Abstract
This study investigates the recent changes in natural hazard prioritizations in northern Bangladesh and presents community-based risk analyses of the various natural hazards that present threats to sustainable agriculture. The study area in northern Bangladesh included two union council areas under the Panchagarh sub-district. Climatological data analysis, a detailed questionnaire survey, and focus group discussions were conducted to assess farmers’ perceptions regarding the shifting and identification of hazards, their seasonal variation, and hazard prioritizations. The SMUG (seriousness, manageability, urgency, and growth) and FEMA (Federal Emergency Management Agency) models were applied for hazard prioritization. Hailstorms were found to be the most prioritized hazard over droughts and flash floods as perceived by the community. The farmers’ perceptions as evaluated through a questionnaire survey also support the findings of the SMUG and FEMA models. This was the first attempt to analyze the potential of hailstorms as a significant hazard in Bangladesh, and GIS maps showed their spatial distribution and temporal frequency across Bangladesh. This newly identified hazard is significantly diminishing farmers’ motivation to continue farming and has the potential to affect sustainable agriculture. The farmers’ perceptions, historical data analysis, use of the two models, institutional approach, hazard risk assessment, and vulnerability to the major sectors show that hailstorms should be considered as an important hazard in northern Bangladesh, and policymakers should pay urgent attention to minimize the threat to sustainable agriculture in northern Bangladesh.
1. Introduction
Climate change and environmental degradation are two of the most urgent matters facing humanity. Evidence from various studies suggests that climate-related events that are caused by meteorological changes are increasing in frequency on a global scale [1]. Our global society perceives great danger [2]. Extreme weather events such as hailstorms, thunderstorms, and lightning are on the increase [3], with impacts that are increasingly visible and detrimental to human survival to varying degrees [4]. Developing countries are vulnerable to extreme weather events arising from climatic variability, and these events cause substantial economic damage. With rising global temperatures, different types of natural hazards have become more significant in regions where previously they had not. Frequent natural disasters are also the result of rapidly changing climatic conditions [5]. Over the past decade, developing countries have annually faced USD 35 billion in losses from natural disasters and particularly extreme weather events [6]. However, extreme weather events are recognized to be one of the prime causes of natural disasters where the devastation level is sometimes beyond imagining [7].
Much research has been internationally conducted on climate change-induced extreme weather events, their climatology, and the adaptive capacities of communities or regions. Most of this research reveals the causes and effects, and the climatology of these extreme weather events. There are several existing studies related to hailstorms and their occurrence with thunderstorms and precipitation, yet most concern the impact of hailstorms and insurance loss. Web et al. (2001) studied hailstorms climatology [8], and Sioutous et al. (2009) studied the impact of hailstorms on agriculture, property, and infrastructure [4]. Hailstorms are small-scale phenomena in which rain in the form of irregular ice balls are produced by convective clouds [8]. Yet despite their small-scale, they are among the major weather threats that result in large economic losses to agriculture, property, and infrastructure [4]. Climatological studies in China have included analyses of average patterns of hail using spatial and temporal scales [9] and an investigation of hail insurance records and hailpad data [10]. There is insufficient understanding regarding the future potential impacts of hailstorms on sustainable agriculture and the ways to minimize losses from the storms.
Bangladesh is one of the most natural disaster-prone countries in the world [11]. Nearly every year, it is affected by floods, tropical cyclones, storm surges, coastal erosion, thunderstorms, and droughts that cause significant loss of life and property, and jeopardize development activities [12]. The frequency of occurrence of these disasters are increasing because of the impact of climate change [13]. The degree of natural disaster damage depends on country location [14]. Bangladesh is ranked fifth in the Global Climate Risk Index in a ranking of 170 countries that are most vulnerable to climate change [15]. The least developed countries like Bangladesh are going through their most vital challenges associated with climate change and variability owing to their robust economic reliance on natural resources and rain-fed agriculture [16]. The intensification of climate change and the proliferation of extreme events are resulting in major, detrimental impacts on Bangladesh’s agricultural sector outweighing impacts on its other economic sectors [17]. Communities have developed coping mechanisms for more common disasters such as floods, droughts, and cyclones, and there are well-established government policies for support. There has been a lot of research in the coastal belt of southern Bangladesh, which is very vulnerable to climate change [18], but only a few studies have been conducted in northern Bangladesh to investigate the impact of climate change induced extreme weather events, such as hailstorms, on crop production, livelihood, and sustainable agriculture. Whether hailstorms are accompanied by thunderstorms or not, they can cause significant damage to agriculture and render the marginal farmers of developing countries temporarily vulnerable to poverty [19]. The impacts of these events also generate a period of food insecurity that sometimes continues throughout the year [20].
Hailpads are used in many parts of the world to measure hail fall on the ground [21], but as they are not used in Bangladesh, there are no specific data on the diameter of hailstones and kinetic energy of storms. The Bangladesh Meteorological Department (BMD) keeps data on three-hour intervals of rainfall and thunderstorms with or without hailstorms from its 35 weather stations. Moreover, the government’s National Disaster Plan (2016–2021) does not classify hailstorms as disasters; rather, only lightning is considered as significant among all extreme weather events. Due to the several disasters that hit the country every year, the government attempts to address disasters that have impacts over larger areas and are potential threats [22]. The capacity to address extreme weather events such as hailstorms is restricted because of technical and resource limitations. Based on the data from the Bangladesh Ministry of Disaster Management and Relief (MoDRM), there are no policies that address hailstorm issues such as compensation to farmers or victims [23]; in fact, hailstorms are recognized as temporal hazards based on their severity and distribution over the country. Their climatology, probability, threat, manageability, and severity impact the vulnerability of the sustainable agricultural sector, property, human health, and rural livelihoods, but these factors still remain unexplored. There is a significant lack of research regarding the place of communities in identifying and prioritizing different hazards. Hailstorms are generally regarded as usual hazards in Bangladesh, but their status and prioritization levels should be analyzed for further consideration. Hailstorms occur every year in Bangladesh, and the most destructive one occurred on April 14, 1986, killing at least 92 people in Gopalganj [21], and damaging thousands of hectares of croplands.
Recently, farmers’ conceptions of hailstorm occurrence have changed due to the larger number of thunderstorms, and the storms do not seem to follow any regular temporal pattern [24]. As there are different hazards in different seasons [25], and these sometimes overlap each other with respect to severity and damage levels, it is sometimes difficult to discern how to prioritize and mitigate them [26]. Northern Bangladesh is seriously affected by droughts and flash floods almost every year, and these result in a series of impacts on agriculture and livelihood issues [27]. With hailstorms recognized as a more serious hazard in the region, it is important to know how they rank among the other frequently occurring hazards and how they affect sustainable agriculture. Numerous environmental disasters could result in farmers who cannot cope financially and lose motivation for crop production. They may quit agriculture if there is a high possibility of recurring hazards and compensation and incentives from government authorities are not made available. Where there is a greater hazard probability, it is more likely that farmers will quit farming, so it is important to look at the sustainability of agriculture. The lack of data on hailstorms in Bangladesh means this study is timely and significant. This study attempts to analyze both the current status of natural hazards with a focus on hailstorms, along with the vulnerability and risks to the community in order to help to formulate mitigation measures and improve policymaking. In addition, the study investigates the status of hailstorms in terms of their spatial and temporal distribution around the country.
2. Methodology
2.1. Study Area
Bangladesh is a densely populated country of 159 million people distributed across a 147,570 square kilometer area [28]. Panchagarh District, lying between 26°17′ and 26°29′ north latitudes and 88°31′ and 88°46′ east longitudes, is located on the banks of the Kartoya River in the northern part of Bangladesh (Figure 1). The total population of Panchagarh is 1.21 million, with 51% males and 49% females distributed across five ‘upazilas’, which are sub-districts (administrative regions) [29]. Upazilas have a function analogous to that of a county or a borough of Western countries. Rural upazilas are again divided into union council areas administratively (Union Parishads: UP), the smallest administrative unit. UP’s are comprised of wards and villages. The overall literacy rate of the district is 71%. It is a crucial region for crop production due to its diversified weather, cropping pattern, and higher cropping intensity (205%) [30]. The people mostly depend on agriculture and face different hazard risks year-round [30]. The study was conducted in two union council areas, Haribhasa and Hafizabad in Panchagarh upazila under the Panchagarh district. These two unions were selected based on the discussions with the local agricultural department and resource personnel considering the importance of crop production and hazard profile. Four villages under those two unions were randomly chosen as study units. Different types of hazards are common in the study area. According to the official data of the agricultural department, it was revealed that the most devastating flash floods occurred in 1974, 1988, 1998, 2005, and 2017, where 75–80% of all types of croplands were damaged, and 3000–5000 homes were inundated. During these disasters, pure drinking water was scarce and sanitation facilities were overwhelmed, resulting in some fatal outbreaks of disease. It is assumed that if there are more flash floods, similar problems on the same scale of severity would reoccur. Every year, severe droughts occur in the study area, that result in 30–40% of crop loss due to the scarcity of surface water and irrigation facilities [31]. Almost every year, about 10–15% of crop damage occurs due to heavy rain and temporal water-logged conditions. Hailstorms occur every year, and about 70–80% of crops are totally damaged, and 55–65% of homestead roofs are damaged. In 2018, several people were seriously injured by the direct impact of hailstones [30]. Nor‘westers (local thunderstorms and heavy rainfall) are common in the study area. Pest attacks are also a potential threat to agriculture and cause 5–10% of annual crop loss.
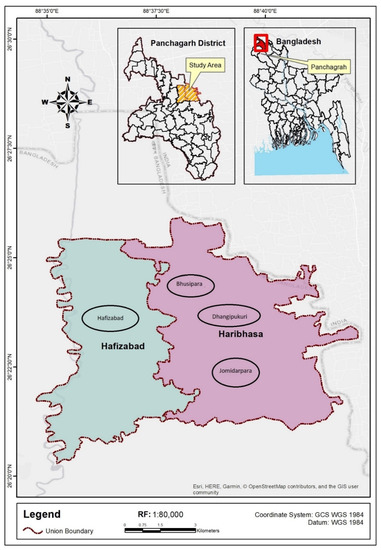
Figure 1.
Map of the study area. Round boxes indicate the location of focus group discussions.
2.2. Data Collection and Analysis
Both quantitative and qualitative data were collected through a structured questionnaire survey and focus group discussions (FGD).
2.2.1. FGD
In order to prioritize the local hazards, FGDs were organized around a series of open-ended questions, a checklist, and an in-depth participatory discussion pertaining to the research objectives based on the SMUG (seriousness, manageability, urgency, and growth) and the FEMA (Federal Emergency Management Agency) model parameters. A total of four FGDs were conducted in Bhusipara, Jomidarpara, Hafizabad, and Dhangipukuri villages (Figure 1), where 48 respondents (12 from each village) were selected from different stakeholder groups: Male and female farmers, school teachers, disaster management officials, local leaders, and agricultural and local government officials. Before conducting the FGDs, the first step was to review hazard reports and existing mitigation plans for the area. Holding discussions with the local people and key informants who had significant knowledge or experience of those hazards was vital for the accurate assessment of the risk [32].
Application of SMUG and FEMA Models Approach
Application of SMUG and FEMA models are reported to be suitable for prioritizing different types of natural hazards for mitigation measures [33]. SMUG is a qualitative evaluation technique, whereas FEMA is a quantitative evaluation technique. The SMUG model is not good for offering solutions to hazards and instead acts as a methodological tool to offer an easy evaluation of specific hazards and, most importantly, prioritizes them [34]. Several researchers have used the SMUG and FEMA models for hazard prioritization, such as Malak et al. (2013) [33], and mitigation and emergency management in different sectors [35]. Wang and Myung (2007) also implemented the SMUG and FEMA models integration for disaster prioritization [36]. Crofts (2006) used the SMUG and FEMA models for hazard prioritization and sought to find the strengths and weaknesses of the models [37]. Agrawal (2018) conducted research on disaster prioritization and management tools and methods when implementing the SMUG and FEMA models.
The SMUG model has four indicators and was adopted by the Tasmania State Emergency Service [38]. The characteristics of the SMUG model are given below (Table 1). The FEMA model uses four criteria to evaluate and score hazards based on their history, vulnerability, maximum threat, and probability [39]. The FEMA model can provide more satisfying evaluation than the SMUG model if there are sufficient numerical data regarding the hazards, as it numerically evaluates each hazard individually [40]. In the FEMA model, history refers to a specific type of emergency that has occurred and where it is acquainted that there were enough hazardous conditions and vulnerabilities to cause the event [41]. Vulnerability measures the number of people and the value of the property that may be vulnerable based on specific factors [33]. In this research, communities’ vulnerability to farming and crop production due to disasters were the main factors taken into consideration. The maximum threat is basically the worst situation, which assumes the most serious event possible alongside the greatest impact. It is revealed in terms of casualties of human life, property loss, and damage levels to crops from a specified disaster [33], but in this study, the maximum threat is characterized as the threat to sustainable agriculture as farmers are discouraged from continuing to farm. The characteristic of maximum threat has been added in order to prioritize the hazards objectively based on the literature, and hazard profiles and characteristics, as well as for government support in the study area. Probability is characterized as the possibility of an event occurring and is expressed in phrases of chances per year that an event of a particular intensity or even greater will occur. There are some links between probability and history; however, given that some hazards are barring precedent, an analysis of the historical record is necessary in order to discern which hazards have a higher probability of occurring [40]. Table 1 shows the scoring system based on hazards and their vulnerability in the states of Panchagarh, Bangladesh. An overall score (low, medium, and high) is calculated for each category shown. These categories are weighed in accordance to their responses simply by assigning low as 1 point, medium as 5 points, and high as 10 points, and weighing the totals by multiplying the history rating by 2, vulnerability by 5, maximum threat by 10, and probability by 7 [42]. Therefore, adding the sub-scores will produce an overall score for each hazard. The data used in the model was acquired from key informants in the study area. The weighting for all four parameters was assigned by the original author [43].

Table 1.
Criteria-based characterization, scoring method, and rating of vulnerability to natural hazards in the study area by the integration of the SMUG (seriousness, manageability, urgency, and growth) and modified FEMA (Federal Emergency Management Agency) models.
The FEMA model calculates a threshold of 100 points [40]. The hazards that score more than 100 points may receive higher priority in mitigation and emergency preparedness (see Table 1), while those scoring less than 100 points should still be considered despite their lower priority [40].
Several researchers have used the SMUG and FEMA models; however, these models present certain challenges, strengths, and limitations. For instance, sometimes a lack of sufficient quantitative data when comparing hazards makes accurate assessment difficult [32]. An advantage of assessing hazards in the FEMA model is that it allows a clear view of which hazards are rated at which level, and it allows easy identification of which hazards take priority concerning mitigation [37]. The main drawback of the FEMA model is that the results table is very basic and lacks hazard detail. Moreover, the FEMA model is slightly harder to implement when prioritizing tasks that need to be carried out to reduce hazards risk. The SMUG assessment, however, rectifies this as the basis of its methodology is to record details. However, it is not as easy to comprehend, as its matrix contains a great deal of information. Moreover, the FEMA assessment fails to properly address the assessment of the social consequences of hazards, whereas SMUG successfully addresses these aspects [37].
2.2.2. Questionnaire Survey
Different hazards in the study area were identified by the farmers through a questionnaire survey and group discussions. Out of a total of 1925 farming households (population) in the study area, a sample size of 320 households were included in the survey, as calculated by a survey system calculator, where the confidence level was 95% (https://surveysystem.com/sscalc.htm). The group discussions and questionnaire survey were conducted in April–May 2019. The respondents were selected using simple random sampling from the list supplied by the upazila’s agriculture office. The hazards were further ranked based on their frequency, intensity, and severity level according to the farmers’ perceptions. A Likert scale was used for scaling responses to questions concerning farmers’ perceptions. Different hazards’ scores were calculated on a 4-point rating scale (high = 3, medium = 2, low = 1, and not at all = 0) and the total number of farmers who responded in different categories were measured as a percentage and shown as a graphical representation [44]. The questionnaire included two main questions: Farmers’ perceptions regarding the different hazard risks (in terms of probability and damage level) and the incentives or any other supports received from the agriculture department and/or government and non-government organizations after each occurrence. Farmers were asked whether they received any support and, if so, then what incentive, such as seed, fertilizer, other input materials for farming, and monetary support or food items were received. The farmers’ perceptions regarding risk of hailstorms, as well as all other hazards at present considering the past decade before participation in the study were analyzed. The hazards were prioritized and triangulated with the results found from the FGDs (SMUG and FEMA model results).
2.2.3. Meteorological Data
Over the last 32 years (1987–2018), data on hailstorm frequency and distributions have been collected at the Climate Division at the Bangladesh Meteorological Department (BMD) from 35 meteorological stations. The locations of the weather stations are shown in Figure 2. Hailstorms events are recorded in each station eight times a day at 3 h intervals, which is the World Meteorological Organization (WMO) standard. The number of hailstorms recorded in one day is the daily hailstorm frequency. The monthly frequency of hailstorms can be estimated from the daily data. The annual time series of hailstorm frequency has been counted from the monthly time series data of hailstorms for the individual stations. The 35 weather stations in Bangladesh were used as the 35 interpolation points in the map that we prepared (Figure 2). Geographic information system (GIS) was applied to encode the hailstorm data based on a district boundary shapefile collected from the Bangladesh Water Resources Planning Organization (WARPO), and the interpolations were conducted based on the data from each station. The time series plot shows the annual data overlaid with the 5-year moving average; the latter efficiently smooths the time series by filtering the high frequency modes. The trend analysis of the time series of hailstorms was performed using the least square technique [24]. The normality tests of the residuals of the linear model were conducted calculating skewness and kurtosis, Kolmogorov–Smirnov and Shapiro–Wilk tests, observation of histogram and normal Q-Q plot of frequency of hailstorms.
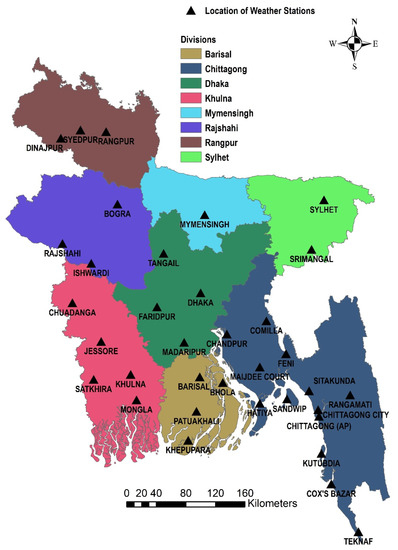
Figure 2.
Location of the weather stations in the eight divisions of Bangladesh.
3. Results
3.1. Hazard Prioritization by FGDs Using SMUG and FEMA Models
In this study, the most common hazards causing damage in Panchagarh and their potential impacts were analyzed along with the application of the SMUG and FEMA models for prioritizations. Table 2 describes the broad scenarios of hazardous conditions and their risk status. It also shows the seriousness of hazards, the manageability of individuals and their communities, hazard mitigation urgency, and hazards’ growth. According to Table 2, a low vulnerability is scored as 1 point, medium vulnerability is 5 points, and a high vulnerability is 10 points, as determined by the SMUG model’s analysis. According to the hazard analysis criteria presented, hailstorms have maximum points when considering their high score for the seriousness of this hazard. The manageability was zero or unknown; therefore, the score was low, and urgency and growth also received the maximum score, thereby indicating that this hazard should be taken into immediate consideration. It was found from discussions that the community has limited to almost no adaptive capacity regarding a hailstorm’s impact. Because of the national policy, the local government’s agricultural department does not compensate or provide any specific incentive to the farmers to cope with their losses. On the other hand, the manageability for flash floods and droughts lies in their medium position. Hailstorms received a high urgency score, indicating that necessary actions and strategies should immediately be adopted and/or implemented to minimize the consequences or compensate the farmers via crop insurance or providing any other incentives. This is because the farmers do not receive any incentives after hailstorms similar to those that they receive in some degree following other hazards such as flash flooding and drought. Based on the higher urgency of a hailstorm and the medium attention required for drought with respect to their growth, both hailstorms and droughts were more often reported.
Table 2.
Hazard analysis and characterization by the SMUG model.
From Table 2, we find that the SMUG qualitative model describes each sector’s damage level according to its hazards and suggests the urgent measures to be adopted. Table 3 expresses the total scores from the SMUG analysis.
Table 3.
Hazard prioritization by the SMUG model.
Table 4 shows that the FEMA model, where hailstorms received a high score (i.e., scored 10 for each parameter and ranked as the number one hazard in the study area). As the FEMA model threshold level is 100, prioritized hazards with a greater score than 100 should be carefully addressed. With the exception of nor‘westers and heavy rain, all hazards in the study area should be taken into consideration.
Table 4.
Hazard prioritization by the FEMA model.
Table 3 and Table 4 show that both the SMUG and FEMA models produced nearly similar results for the prioritization of hazards, and hailstorms are the number one hazard considering the parameters of vulnerability and risks. Drought is the second most important hazard. Table 4 shows that hailstorm history received a high score, indicating that it happened at least once in a year. Hailstorms have the highest level of vulnerability, indicating that more than 30% of crops are vulnerable once a hailstorm occurs, along with damage to property, and that the maximum threat is also highest, giving rise to the threat to sustainable agriculture. Here, “threat to sustainable agriculture” indicates a situation in which there is annual occurrence of hailstorms and farming communities do not receive compensation, insurance pay-outs, or other incentives; this situation may cause farmers to lose motivation for crop production, and they may move to non-farming sources of income. This would ultimately affect sustainable agriculture and household food security. Another undoubtedly alarming and crucial finding is that there could be effects on regional and national crop production. Drought has gained particular attention where the history, vulnerability, and probability of occurrence received the highest scores, however, the threat to agriculture and its sustainability were scored at the medium level. The FEMA model provides more numerical results, and flash floods were the third most important hazard, whereas in the SMUG model, we prioritized flash floods as the fifth most important hazard among seven. Thus, the findings from two models differed a bit.
3.2. Prioritization of the Hazards Based on Hazard Risks Perceived by Farmers Using a Questionnaire Survey
Perceptions of the identified hazards and their occurrence and severity were prioritized by the farmer respondents when answering a questionnaire survey. As shown in Table 3 and Table 4, hailstorms are the most significant hazard in the study area, and Figure 3 shows that almost 99% farmers perceived hailstorm as the most (score high) important hazard. In farmers’ perceptions, drought is the second most important hazard followed by hailstorms. This corroborates the findings of the SMUG and FEMA models that indicate water scarcity and temperature increases cause significant impacts on crop production. Flash flooding during the monsoon season causes serious damage to field crops and daily life and was ranked the third most significant hazard to the community, and yet its current prioritization as a hazard has lowered over the past decade. Pest attacks have a significant position, as these cause serious damage to crops every year, and thus they have gained priority because of their severity in terms of economic loss.
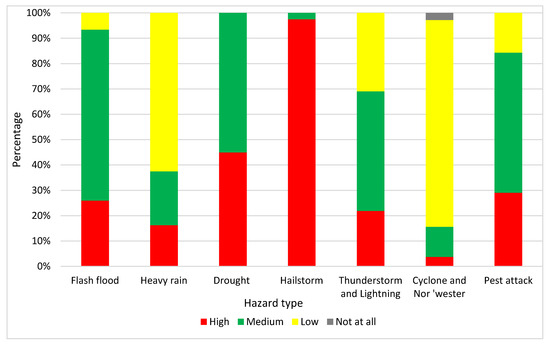
Figure 3.
Prioritization of hazards identified by the farmers of Panchagarh (N = 320).
The prioritization of extreme weather events such as thunderstorms and lighting also increased, indicating changes in prioritization. It was reported that thunderstorms with hail cause serious damage to crops, but thunderstorms without hail do not have a huge impact.
Table 5 shows the percentage of farmers receiving different incentives after the natural hazards including hailstorms occurrence in the study area. It was revealed that after a hailstorm, the farmers did not receive any incentives, contrary to other hazards. Once a flash flood occurs, the farmers mostly received daily necessary food items or monetary support as relief from government and other non-governmental or community sources. The farmers have experienced drought every year and they usually receive different varieties of crops seeds, fertilizers, and different input materials as incentives from the agriculture department. They sometimes can use the community irrigation facilities more cheaply when the drought is extreme. But even after the occurrence of an extreme hailstorm that causes damage to the crops, the respondents reported that they did not receive any incentives or support.
Table 5.
Incentives received by the farmers after the natural hazard occurrences in the study area.
3.3. Frequency and Distribution of Hailstorms in Bangladesh
Once we found the result that hailstorms are the most significant hazard position in terms of their vulnerability, probability, and damage, we attempted to show the frequency and distribution of this hazard across Bangladesh, particularly in northern Bangladesh. The time series plot of Bangladesh’s annual frequency of hailstorms is distinguished by yearly variations (Figure 4). The broken line shows the 5-year moving average. The straight line represents the smoothed time series, where high frequency modes with a time lower than 5 years have been removed. The time series which is smoothed shows low hailstorms frequency up to 2004, the year with a minimum number. From 2004 to 2012, growth was steady. However, the frequency increased sharply after 2012, and growth has been continuous since then. A decadal variation with a conjectural period of around 10 years from 2008 to 2018 is explicit from the smoothed line. The trend analysis shows a significantly increasing trend (p value 0.000) of annual hailstorms frequency (1.80 per year).
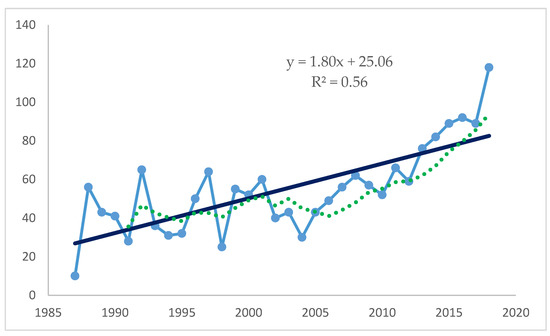
Figure 4.
The time series of annual hailstorms frequency from 1987 to 2018. The broken line indicates the 5- year moving average data, while the straight line indicates the trend. In the regression equation, the x- variable is year. R2 is the coefficient of determination.
Figure 5 shows the increasing rate of hailstorms in Bangladesh and particularly shows that the most affected area was the Rangpur division. Typically known as northern Bangladesh, this area is acknowledged as the most important crop cultivation area. The weather station with the highest number of hailstorms has been recorded (126 times) is Saidpur. The study area included Saidpur, so this may have affected the prioritization change to some extent. Weather stations Rangpur and Dinajpur are also in northern Bangladesh. The map shows that the most significant region of Bangladesh in terms of overall maximum exposure to hailstorms is Rangpur (Figure 2 shows the Bangladesh divisions and location of weather stations). The overall picture of the frequency and distribution of hailstorms across Bangladesh can be seen on the map, which shows that the second most important region is Chittagong. Hatia weather station is on one of the biggest islands of Bangladesh, located in the Chittagong division, and it holds the second most significant position with respect to hailstorms following the study area.
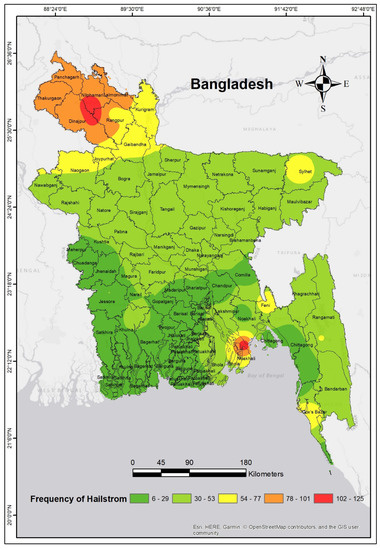
Figure 5.
Hailstorm frequency in Bangladesh.
4. Discussion
This study was concerned with two important research objectives: Change in hazard prioritization and the exploration of the most significant hazard’s climatological status. The study found that hailstorms were the most significant hazard in the study area. This novel finding explains why farmers are deeply concerned about hailstorms, as they cause serious annual damage to crops at least once or twice a year. It was also reported that the frequency and distribution were increasing along with higher levels of devastation due to more intense hailstorms, larger sized hailstones, and longer storms. Climatology, frequency, and distribution were also shown, which answers the major research objective. Many researchers have conducted different types of research regarding Bangladesh’s existing and known natural hazards and analyses of their impacts. However, this study reveals the new knowledge that hailstorms have become the riskiest hazard in northern Bangladesh. There is almost no research on the frequency, intensity, and distribution of hailstorms specifically in Bangladesh, although there have been a number of studies instead found on thunderstorm climatology and its impact. The changes in the patterns of hailstorms, hailstone size, seasonal variation, important regions for hailstorms in Bangladesh, risks, vulnerability related to hailstorms, and farmers’ perceptions of hailstorms (in comparison to other potential hazards) have not been made clear from the previous researches.
There have been very few studies conducted on the frequency and distribution of hailstorm in Bangladesh. However, Yamane et al. (2009) studied the climatology of severe convective storms in Bangladesh, but did not specify hailstorms, which this study does [45]. Habib (2012) [46] found hailstorms and thunderstorms as a type 1 hazard in Bangladesh in general, where floods, riverbank erosion, and droughts were treated as type 2, and tsunamis and cyclones were considered as a type 3 [46]. Hossain and Roy (2013) explored hailstorms as the fifth ranked hazard in community level risk analysis [47], but this study showing a different result where hailstorm became the first ranked. Related to the findings of Dale et al. (2001) we can assume that the increasing number of hailstorms in northern Bangladesh, more particularly in the study area, could be induced due to the geographical location adjacent to the Himalaya mountains [48]. Botzen et al. (2009) conducted research on climate change and hailstorm damage and opined that hailstorm frequency and damage could exacerbate in the future if temperature increases further due to climate change [49]. Several studies have been made on thunderstorms over India, Bangladesh, and other countries [50]. These studies are related to climatology, formation, structure, troposphere instability, and water vapor of the troposphere in association with the forecasting of thunderstorms, but almost no research has focused on hailstorms specifically due to the lack of data, or possible perception of this hazard as minor. BMD suffers from a lack of sophisticated data which are most important to understanding the climatology of hailstorms. This study presents a spatial map of hailstorms and found the most significant region in Bangladesh for occurrence and severity.
From the questionnaire survey, it was found that the occurrence of a single hailstorm in the study area could be disastrous, and every year they occur twice, thrice, or more. The data from the questionnaire showed that the farmers perceived that storm intensity, hailstone size, and kinetic energy are also gradually increasing, and those factors are causing serious damage to the study area. However, such data has not been officially recorded, which poses a major obstacle to further research. The risk of hailstorm was revealed to be the most significant of all natural hazards. Moreover, the data also showed that the farmers did not receive any incentive after hailstorms occurred regardless the consequences for crop production.
Malak et al. (2013) also applied the SMUG and FEMA models in their research to prioritize the hazards in Matlab, Bangladesh and found that flooding was the most important hazard in that locality and that hailstorms took the fourth position in the FEMA model’s analysis [33]. Our study characterizes one of the parameters of the FEMA model, i.e., maximum threat as a threat to sustainable agriculture for the first time, exploring the relationship between hazards and the sustainability of agriculture. Ahsan et al. (2014) conducted a research on climate change and risk perceptions and found that the cyclone leads to substantive loss to the crop production, and 75% of farmers opined that if such disasters occur regularly, they will be compelled to quit farming [51]. On the other hand, we found that almost all farmers perceived hailstorms as a potential threat to sustainable agriculture, and they might stop farming and choose non-farming income sources as mitigation strategies. This unique finding leads us to conclude that hailstorms are a big threat to sustainable agriculture in the study area. Accordingly, these models could be helpful in prioritizing hazards and assisting policymakers.
5. Conclusions
The frequency and distribution of hailstorms have gradually and significantly increased in the study area. The most important region for hailstorms in Bangladesh is the northern region, where different types of droughts are also having serious effects on agriculture. Flash floods were previously very common; however, the present scenario is different. Due to the change in rainfall patterns, good drainage facilities, and lower amounts of water in the adjacent river basin, flash floods are no longer regarded as significant hazards. Other extreme weather events are also increasing simultaneously with the changes in climate. Hailstorms have become the riskiest hazard in terms of their probability, damage level, and threat to sustainable agriculture in the study area. The SMUG and FEMA models finding clearly show that hailstorms emerged as the most significant hazard in the study area. There are few explicit policies that address the issues of hailstorms and agricultural compensation. Immediate attention should be paid to minimizing loss, and assistance should be given in the form of incentives, financial support, and/or farm input materials. Crop insurance would also help to compensate farmers. Assistance should also be given in choosing the most suitable plant varieties and cultivation practices, and in early harvesting of field crops to minimize the risk of hailstorm damage in the pre-monsoon season.
The major limitation of this study is its focus on a specific area of Bangladesh, so the result is localized rather than generalized. Therefore, future studies could consider the location and importance of hazards. We recommend conducting a deep climatological study of hailstorms to discover the reasons behind their higher frequency in the study area, as well as their vulnerability in a broader area, using a larger number of respondents. There is a limited field in the SMUG model that considers the damage level of a hazard, but it does not take the frequency into consideration. But integrated use of the SMUG and FEMA models overcome this limitation and provide satisfactory analyses for prioritization of hazards. In the changing global climate, the most vulnerable countries could adopt these models to prioritize the hazards and take action accordingly.
Author Contributions
Conceptualization, M.L.R., K.O., and S.H.; data curation, M.L.R.; formal analysis, M.L.R.; investigation, M.L.R. and S.H.; methodology, M.L.R.; software, M.L.R. and K.O.; supervision, S.H., K.O., and N.S.; writing—original draft, M.L.R.; writing—review & editing, M.L.R., M.B., K.O., N.S., and S.H. All authors have read and agreed to the published version of the manuscript.
Funding
This research received no external funding.
Acknowledgments
The first author is thankful to the Ministry of Education, Sports, Science and Technology (MEXT) of Japan for the financial support and to the district administration and department of agriculture of Panchagarh, Bangladesh, for all the cooperation and support to conduct field studies.
Conflicts of Interest
The authors declare no conflict of interest.
References
- IPCC. Climate change 2007: The scientific basis. In Fourth Assessment Report of the Intergovernmental Panel on Climate Change; Solomon, S.D., Qin, M., Manning, Z., Chen, M., Marquis, K.B., Averyt, M.T., Miller, H.L., Eds.; Cambridge University Press: Cambridge, UK, 2007. [Google Scholar]
- Dessai, S.; Adger, W.N.; Hulme, M.; Turnpenny, J.; Köhler, J.; Warren, R. An editorial essay 1. External definitions of danger the Delhi declaration on climate change and sustainable development, which emerged in October 2002 from the Eighth Conference of the Parties to the United Nations Framework Convention on Climate Chang. Clim. Chang. 2004, 64, 11–25. [Google Scholar] [CrossRef]
- Cecil, D.J.; Blankenship, C.B. Toward a global climatology of severe hailstorms as estimated by satellite passive microwave imagers. J. Clim. 2012, 25, 687–703. [Google Scholar] [CrossRef]
- Sioutas, M.; Meaden, T.; Webb, J.D.C. Hail frequency, distribution and intensity in Northern Greece. Atmos. Res. 2009, 93, 526–533. [Google Scholar] [CrossRef]
- Sarker, N.I.; Yang, B.; Lv, Y.; Huq, E.; Kamruzzaman, M.M. Climate change adaptation and resilience through big data. Int. J. Adv. Comput. Sci. Appl. 2020, 11, 533–539. [Google Scholar]
- Munich, R.E. Munich Reinsurance Company Geo Risks Research—Annual Report 2012; Germanwatch e.V.: Berlin, Germany, 2013. [Google Scholar]
- UNISDR. Global Assessment Report on Disaster Risk Reduction; United Nations: Geneva, Switzerland, 2009. [Google Scholar]
- Webb, J.D.C.; Elsom, D.M.; Reynolds, D.J. Climatology of severe hailstorms in Great Britain. Atmos. Res. 2001, 56, 291–308. [Google Scholar] [CrossRef]
- Zhang, C.; Zhang, Q.; Wang, Y. Climatology of Hail in China: 1961–2005. J. Appl. Meteorol. Climatol. 2008, 47, 795–804. [Google Scholar] [CrossRef]
- Sioutas, M.V.; Flocas, H.A. Hailstorms in Northern Greece: Synoptic patterns and thermodynamic environment. Theor. Appl. Climatol. 2003, 75, 189–202. [Google Scholar] [CrossRef]
- Bushra, N.; Trepanier, J.C.; Rohli, R.V. Joint probability risk modelling of storm surge and cyclone wind along the coast of Bay of Bengal using a statistical copula. Int. J. Climatol. 2019, 39, 4206–4217. [Google Scholar] [CrossRef]
- Dastagir, M.R. Modeling recent climate change induced extreme events in Bangladesh: A review. Weather Clim. Extrem. 2015, 7, 49–60. [Google Scholar] [CrossRef]
- Hossain, M.; Deb, U. Crop agriculture and agrarian reforms in Bangladesh: Present status and future options. In Sixth Five Year Plan of Bangladesh 2011–2015: Background Papers; Mujeri, M.K., Alam, S., Eds.; Bangladesh Institute of Development Studies and Ministry of Planning: Dhaka, Bangladesh, 2011; Volume 2, pp. 1–24. [Google Scholar]
- Huq, S.; Rabbani, G. Climate change and Bangladesh: Policy and institutional development to reduce vulnerability. J. Bangladesh Stud. 2011, 13, 1–10. [Google Scholar]
- Kreft, S.; Eckstein, D. Global Climate Risk Index 2015: Who Suffers Most from Extreme Weather Events? Weather-Related Loss Events in 2013 and from 1994 to 2013. Briefing Paper. Available online: https://www.preventionweb.net/files/40976_103331.pdf (accessed on 16 October 2014).
- FAO. Adaptation to Climate Change in Agriculture, Forestry and Fisheries: Perspective, Framework and Priorities; Interdepartmental Working Group on Climate Change: Rome, Italy, 2007; pp. 1–32. [Google Scholar]
- Rahman, A.A.; Alam, M.; Alam, S.S.; Uzzaman, M.R.; Rashid, M.; Rabbani, G. UNDP Human Development Report 2007: Background Paper on Risks, Vulnerability and Adaptation in Bangladesh; UNDP: Dhaka, Bangladesh, 2008; pp. 1–86. [Google Scholar]
- Younus, M.A.F.; Sharna, S.S. Combination of community-based vulnerability and adaptation to storm surges in coastal regions of Bangladesh. J. Environ. Assess. Policy Manag. 2014, 16, 1450036. [Google Scholar] [CrossRef]
- Abdul, A.K.M.; Biswas, A.; Islam, T.; Sattar, A.; Mili, S.N.; Jahan, T. Community Based Risk Assessment of Agriculture Sector in Sreerampur Union of Bangladesh. J. Food Secur. 2015, 3, 125–136. [Google Scholar] [CrossRef]
- Huq, N.; Hugé, J.; Boon, E.; Gain, A. Climate change impacts in agricultural communities in rural areas of coastal Bangladesh: A tale of many stories. Sustainability 2015, 7, 8437–8460. [Google Scholar] [CrossRef]
- Giaiotti, D.; Nordio, S.; Stel, F. The climatology of hail in the plain of Friuli Venezia Giulia. Atmos. Res. 2003, 67, 247–259. [Google Scholar] [CrossRef]
- Sarker, M.N.I.; Wu, M.; Alam, G.M.; Shouse, R.C. Livelihood resilience of riverine island dwellers in the face of natural disasters: Empirical evidence from Bangladesh. Land Use Policy 2020, 95, 104599. [Google Scholar] [CrossRef]
- Government of the People’s Republic of Bangladesh, Ministry of Disaster Management and Relief. National Plan for Disaster Management 2016–2020, Building Resilience for Sustainable Human Development; GOB: Dhaka, Bangladesh, 2017.
- Saha, T.R.; Quadir, D.A. Variability and trends of annual and seasonal thunderstorm frequency over Bangladesh. Int. J. Climatol. 2016, 36, 4651–4666. [Google Scholar] [CrossRef]
- Huq, N.; Bruns, A.; Ribbe, L.; Huq, S. Mainstreaming ecosystem services based climate change adaptation (EbA) in Bangladesh: Status, challenges and opportunities. Sustainability 2017, 9, 926. [Google Scholar] [CrossRef]
- Islam, M.; Managi, S. Sustainable adaptation to multiple water risks in agriculture: Evidence from Bangladesh. Sustainability 2018, 10, 1734. [Google Scholar] [CrossRef]
- Ahammed, S.; Chung, E.-S.; Shahid, S. Parametric assessment of pre-monsoon agricultural water scarcity in Bangladesh. Sustainability 2018, 10, 819. [Google Scholar] [CrossRef]
- BBS. Bangladesh Statistics 2017; Statistics and Informatics Division of Government of People’s Republic of Bangladesh: Dhaka, Bangladesh, 2017; pp. 1–73.
- BBS. Population and Housing Census 2011; Government of People’s Republic of Bangladesh: Dhaka, Bangladesh, 2011; ISBN 8802818142.
- SRDI. Panchagarh Upazila Nirdeshika; Bangladesh Soil Resources Development Institute (SRDI): Dhaka, Bangladesh, 2019; pp. 403–411.
- Raihan, M.; Sarker, M.; Miah, M. Shortage of water in Teesta river basin and its impact on crop production in northern Bangladesh. SAARC J. Agric. 2018, 15, 113–123. [Google Scholar] [CrossRef]
- Agrawal, N. Disaster risk evaluation—Other quantitative methods. In Natural Disasters and Risk Management in Canada; Springer: Dordrecht, The Netherlands, 2018; Volume 49, pp. 271–293. ISBN 9789402412833. [Google Scholar]
- Islam, M.N.; Malak, M.A.; Islam, M.N. Community-based disaster risk and vulnerability models of a coastal municipality in Bangladesh. Nat. Hazards 2013, 69, 2083–2103. [Google Scholar] [CrossRef]
- Armenakis, C.; Nirupama, N. Prioritization of disaster risk in a community using GIS. Nat. Hazards 2013, 66, 15–29. [Google Scholar] [CrossRef]
- Arnold, J.L. Risk and risk assessment in health emergency management. Prehosp. Disaster Med. 2005, 20, 143–154. [Google Scholar] [CrossRef] [PubMed]
- Wang, S.-J.; Lee, M.-S. Analysis of hazard of disaster in the aspect of human damage. J. Korean Soc. Disaster Inf. 2007, 3, 87–101. [Google Scholar]
- Crofts, B.L. A Comparison of Risk and Vulnerability Based Approaches to Assessment: An Evaluation of the Threat Posed by the Nyiragongo Volcano, Democratic Republic of Congo. Ph.D. Thesis, Coventry University, Coventry, UK, 2006. [Google Scholar]
- Ali, F.; Khan, B.; Khan, G.; Abbas, Y.; Hussain, E.; Masud, A.; Akber, K.; Karim, R. Hazard vulnerability risk assessment of District Gilgit, Gilgit-Baltistan, Pakistan. Mod. Environ. Sci. Eng. 2015, 1, 255–268. [Google Scholar] [CrossRef]
- Plough, A.; Krimsky, S. The emergence of risk communication studies: Social and political context. Special Issue on the Technical and Ethical Aspects of Risk. Sci. Technol. Hum. Values 1987, 12, 4–10. [Google Scholar]
- FEMA. Multi Hazard Identification and Risk Assessment: The Cornerstone of the National Mitigation Strategy; FEMA: Washington, DC, USA, 1997.
- Haase, D. Participatory modelling of vulnerability and adaptive capacity in flood risk management. Nat. Hazards 2013, 67, 77–97. [Google Scholar] [CrossRef]
- Ikeda, K. Gender differences in human loss and vulnerability in natural disasters: A case study from Bangladesh. Indian J. Gend. Stud. 1995, 2, 171–193. [Google Scholar] [CrossRef]
- Kuban, R. Community-Wide Vulnerability and Capacity Assessment (CVCA), in the Directorate of Research and Development (DRD) in the Office of Critical Infrastructure Protection and Emergency Preparedness (OCIPEP), Formerly Emergency Preparedness Canada; SNH: Inverness, Scotland, 2010.
- Guilbault, G.G.; Hjelm, M. Nomenclature for automated and mechanised analysis (Recommendations 1989). Pure Appl. Chem. 1989, 61, 1657–1664. [Google Scholar] [CrossRef]
- Yamane, Y.; Hayashi, T.; Dewan, A.M.; Akter, F. Severe local convective storms in Bangladesh: Part I. Climatology. Atmos. Res. 2010, 95, 400–406. [Google Scholar] [CrossRef]
- Habib, A.; Ahmed, D. Institutional Partnerships in Multi-Hazard Early Warning Systems; Golnaraghi, M., Ed.; Springer: Berlin/Heidelberg, Germany, 2012; ISBN 978-3-642-25372-0. [Google Scholar]
- Hossain, M.S.; Roy, K. Community based risk assessment and adaptation to climate change in the coastal wetlands of Bangladesh. Int. J. Environ. 2013, 2, 96–105. [Google Scholar]
- Dale, V.H.; Joyce, L.A.; Mcnulty, S.; Neilson, R.P.; Ayres, M.P.; Flannigan, M.D.; Hanson, P.J.; Irland, L.C.; Lugo, A.E.; Peterson, C.J.; et al. Climate change and forest disturbances. Bioscience 2001, 51, 723. [Google Scholar] [CrossRef]
- Botzen, W.J.W.; Bouwer, L.M.; van den Bergh, J.C.J.M. Climate change and hailstorm damage: Empirical evidence and implications for agriculture and insurance. Resour. Energy Econ. 2010, 32, 341–362. [Google Scholar] [CrossRef]
- Karmakar, S.; Alam, M. Modified instability index of the troposphere associated with thunderstorms/nor’westers over Bangladesh during the pre-monsoon season. Mausam 2011, 62, 205–214. [Google Scholar]
- Ahsan, D.; Brandt, U.S. Climate change and coastal aquaculture farmers’ risk perceptions: Experiences from Bangladesh and Denmark. J. Environ. Plan. Manag. 2015, 58, 1649–1665. [Google Scholar] [CrossRef]


© 2020 by the authors. Licensee MDPI, Basel, Switzerland. This article is an open access article distributed under the terms and conditions of the Creative Commons Attribution (CC BY) license (http://creativecommons.org/licenses/by/4.0/).