Article

Investigation of the Correlation between the Use of Antibiotics in Aquaculture Systems and Their Detection in Aquatic Environments: A Case Study of the Nera River Aquafarms in Italy

1
Experimental Zooprophylactic Institute of Umbria and Marche "Togo Rosati'', 06126 Perugia, Italy
2
Regional Environmental Protection Agency of Marche (ARPAM), 60131 Ancona, Italy
3
School of Hygiene and Preventive Medicine, Marche Polytechnic University, 60121 Ancona, Italy
*
Author to whom correspondence should be addressed.
Sustainability 2020, 12(12), 5176; https://doi.org/10.3390/su12125176
Submission received: 27 May 2020 / Revised: 17 June 2020 / Accepted: 22 June 2020 / Published: 24 June 2020
(This article belongs to the Collection Aquaculture and Environmental Impacts)

Abstract

:
Antimicrobial resistance (AMR) arises mostly because of the use and abuse of antibiotics in both the human and veterinary sectors. Furthermore, antibiotic residues can be discharged into the environment, promoting the spread of AMR as well as becoming a potential ecotoxicological risk. Aquaculture is one such source of environmental pollution. In the present work, we evaluated the correlation between antibiotic consumption in 11 selected aquafarms located along the Nera River, and the detection of their residues in surface water and sediment samples gathered monthly from the same stream. Antibiotic consumption was calculated using the ESVAC defined daily doses for animals (DDDvet) method, and a chemical analysis was conducted using a multiclass method. Therefore, the ecological risk of antibiotics being detected in surface waters was established based on the risk quotient (RQ). A strong positive correlation was identified between the concentrations detected in surface waters and the consumption of flumequine (r = 72%, p-value = 0.0085) and florfenicol (r = 83%, p-value = 0.0008). The RQ, however, was low for all the detected antibiotics in surface waters. Therefore, we proved that the antibiotics used in aquaculture can reach the near aquatic environment, but, in this work, they did not represent a toxicological risk to the surrounding ecosystem.

1. Introduction

Antibacterial therapy was one of the most important medical developments of the 20th century and has become one of the pillars of modern medicine [1]. However, the efficacy of these drugs is gradually decreasing because of antimicrobial resistance (AMR), which represents one of the worst current threats to public health. Microorganisms faced with antimicrobial selection pressure enhance their fitness by acquiring and expressing resistance genes and then share those genes with other bacteria. Thus, antimicrobial use and abuse in the human, animal, and plant sectors are important drivers of AMR. The other main drivers are factors that promote the spread of resistant bacteria and resistance determinants within and between these sectors and around the globe [2]. In particular, these include environmental contamination, as the environment can serve as an AMR reservoir [2,3]. Indeed, after administration, a significant fraction of antibiotics, like other pharmaceuticals, can be released into the receiving environment through industrial wastewater, medical and animal waste, and sewage effluent, and can be present either as metabolites or as the parent compound [4,5,6,7]. Furthermore, direct discharge, especially from livestock, meat processing, and aquaculture, is also possible and can contribute to an increase in the total concentration of antibiotics in sewage and surface water [6]. Various studies have demonstrated that antibiotics and their byproducts (BPs) may reach surface water, groundwater, and, potentially, drinking water [8,9]. Even if the detected concentrations are low (from ng/L to µg/L), water bodies have been identified as significant holding tanks for antibiotics [10], which can then potentially bioaccumulate in aquatic organisms [11]. They can also disrupt vital ecosystem processes, representing an ecotoxicological risk [8]. For this reason, antibiotics were recently recognized as an emerging class of environmental pollutants, of which the potential effects on human health have aroused growing concern [8]. In 2018, the European Commission included antibiotics like amoxicillin, ciprofloxacin, and macrolides (erythromycin, clarithromycin, and azithromycin) on a watchlist of substances that when present in surface waters can represent a significant risk for the member states [12,13]. There is currently no specific surveillance system for antibiotics, and the available data are too scarce to evaluate the real risk associated with polluted water bodies [14]. For this reason, to protect the ecology and environment of river systems contaminated by antibiotics, it is essential to characterize the occurrence pattern and spatiotemporal characteristics of representative chemicals and to provide a theoretical basis for basin management and restoration in the future [15]. As proof of the close link between the ecotoxicological risk determinants and human health, we considered the recent paper “Guidelines for health impact assessment” from the Italian “Superior Institute of Health” [16]. The paper presents a guided methodological approach for the execution of ecotoxicological surveys, with the aim of protecting human health from the impact of repeated exposure to environmental risk factors via integration of different knowledge and skills.
Aquaculture is high-risk livestock, regarding its potential impact on environmental health, because drugs for the treatment of fish are directly released into surface waters [17]. Most of all, in intensive aquaculture, especially for salmon and trout, nearly all manipulations undergone by the fish as they are being raised are stressors [18,19]. Because these manipulations decrease the effectiveness of the fishes’ immune systems in clearing up bacterial colonization and infection, the use of antibiotics has increased [18,19,20,21]. In aquaculture, antimicrobials are usually administered to entire populations, including sick, healthy, and carrier individuals, via a medicated feed released directly in the water [22]. In this way, antibiotics enter the environment as a result of leaching from feces and uneaten antibiotic feed. It has been estimated that 70‒80% of antibiotics applied in aquaculture are dispersed into water systems because fish do not effectively metabolize these pharmaceuticals [22,23]. Unfortunately, determining the current levels of antibiotic consumption in aquaculture, as for all veterinary sectors, is not easy because of the different monitoring systems used by different countries, as well as the varying quality of the resulting data [24,25]. AMR is thought to be a direct result of antimicrobial drug use [26]. Thus, in terms of risk to AMR dissemination, aquaculture is of particular concern in terms of the propensity for emergence, persistence, and transmission within the aqueous environment [27]. An increasing number of studies have documented elevated levels of bacterial antibiotic resistance in and around aquaculture production environments, suggesting that similar gene transfer events could play a role in the transfer of antibiotic resistance determinants between fish-associated bacteria and human bacterial pathogens. [28]. In a double meta-analysis conducted on antimicrobial resistance of 11,274 different bacterial isolates from aquatic reared animals and the aquaculture environment obtained from the literature, was found a strong correlation between multi-antibiotic resistance (MAR) indexes from aquaculture and MAR indexes from human clinical bacteria [26]. Although resistance gene dissemination is known to be exacerbated by the presence of antimicrobial compounds in the environment, there is no comprehensive inventory of antibiotics and other antimicrobials that are currently used in aquaculture at local, national and international levels, and the precise types and amounts of chemical and biological contaminants present in aquaculture systems are unclear [27,28].
The aim of this study was to evaluate the hypothetical correlation between antibiotic consumption (using standardized units of measurement) in 11 aquafarms located along the Nera River, and the detection of the same substances in water and sediment samples gathered at five points near fish plants. Furthermore, we evaluated the impact on the environment of the detected antibiotics, calculating the risk quotient (RQ) as an indicator of the ecotoxicological risk. Indeed, the RQ is often used to quantitatively express the possible risk posed by micropollutants. It is calculated by dividing an environmental exposure value (measured environmental concentration-MEC) by a toxicity end-point value (predicted no effect concentration-PNEC) of the target substance. Therefore, the RQ is a ratio of exposure to effect and can be used by decision-makers and risk analysts to evaluate whether the value exceeds any predetermined threshold level of concern [29,30]. This study should support understanding of the chemical pollution derived from aquaculture systems and its role in potential environmental risks, in order to plan more in-depth monitoring activities in this field

2. Materials and Methods

2.1. Sampling Sites and Sample Collection

The Nera River originates in the Sibillini Mountains and flows for around 125 km into the Tevere River, passing through the Marche and Umbria regions in the center of Italy.
Five sampling points were selected in this study on the basis of their distribution in relation to trout farms situated along the Nera River, from the nearest to the most distant, as follows: Molini (P1), Pontechiusita (P2), Borgo Cerreto (P3), Scheggino (P4), and Casteldilago (P5). The majority of the farms are located upstream of Molini, Pontechiusita, and Borgo Cerreto. Between Scheggino and Casteldilago, there are no fish plants. In the considered area, there are 15 aquafarms, which breed trout for human consumption, but four of them did not present any type of antibiotic prescription for 2018. A map (Figure 1) representing the distribution of all the aquafarms, discriminating between those with and without antibiotic prescriptions, and the sampling points was created in QGIS 2.4.0. More detailed information regarding the geographical distribution of the sampling points and the related aquafarms, with a specification of the type of production, is given in Supplementary Table S1.
The Nera River was chosen because the majority of aquafarms in the Umbria and Marche regions are located along it and because it is a watercourse located in a low-population area. In this way, it is less influenced by other potential contamination factors and so was more suitable for the aim of this study.
In 2018, monthly samplings, a total of 12, were conducted. During each sampling, both surface waters and sediments were collected in order to detect the presence of antibiotic residues. All the water samples (1 L) were collected as a grab sample, using a water samplers telescope in order to reach the most central part of the river. The samples were collected in clean laboratory bottles in order to avoid any type of contamination. The sediment samples were collected by scrapping the surface sediment (about 15 cm) through a specific perforated shovel and gathering around 100 g of materials in clean laboratory containers. Both water and sediment samples were collected, where possible, from the most central part of the river for each sampling site. After transportation to the laboratory, water samples were immediately frozen at −20 °C. Sediment samples were air-dried for 72 h in the dark at ambient temperature, sieved to a particle diameter < 1000 µm and then stored at −20 °C until analysis. A multiclass method was applied, using liquid chromatography coupled with high-resolution mass spectrometry (LC-HRMS) to simultaneously determine levels of 64 and 56 analytes in the water and sediment, respectively.

2.2. Chemical Analysis

Acetonitrile (LC-MS grade), glacial acetic acid and ammonia were purchased from Merck (Darmstadt, Germany), methanol (LC-MS grade) from Honeywell Riedel de HaënTM (Seelze, Germany). Formic acid (50%), EDTA sodium salt dehydrate, and ammonium acetate were provided by Sigma-Aldrich (St. Louis, MO, USA). HPLC-grade water was obtained through a Milli-Q water purification system (Millipore, Bedford, MA, USA).
River water: One hundred microliters of NA2EDTA 0.1 M was added to 200 mL of river water sample and acidified to pH 3 with glacial acetic acid. The sample was loaded onto an Oasis HLB cartridge (Waters, Milford, MA, USA) connected to a Strata-X-C cartridge (Phenomenex, Torrance, CA, USA) previously conditioned with 6 mL of methanol and 6 mL 0.1% acetic acid solution. The Strata-X-C was separated and washed with 6 mL of water. The analytes from Strata-X-C were then eluted in a 15 mL polypropylene tube with 3 mL of a mixture acetonitrile/ammonia 70/30 (v/v) and 3 mL of MeOH/ammonia 70/30 (v/v). The eluate was partially evaporated under a nitrogen stream. In the meantime, the Oasis HLB cartridge was washed with 6 mL of water and eluted with 6 mL MeOH, which was reunited with Strata-X-C eluates. After evaporation, the dry extract was redissolved in 200 µL of ammonium acetate 0.2 M, centrifuged (12000 rpm, 5 min) and injected into the LC-HRMS system.
River sediment: One gram of the dried sediment was weighed in a 50 mL polypropylene tube and extracted with 15 mL of McIlvaine-EDTA buffer (pH 7)/MeOH 40/60 (v/v) followed by 5 mL Na2EDTA 0.1 M and 10 mL of McIlvaine buffer (pH 3)/MeOH 40/60 (v/v). The third extraction was carried out with 5 mL Na2EDTA 0.1 M and 10 mL of ammonia buffer (pH 10)/MeOH 40/60 (v/v). The reunited extracts were evaporated under a nitrogen stream to about 24 mL, the pH was adjusted to 3, and the volume was increased to 50 mL with water. The sample was then purified as described for river water, using the SPE cartridges OASIS HLB and Strata-X-C.
The LC-HRMS conditions were the same as those described by Moretti et al., 2016 [31]. Briefly, chromatographic separation was carried out on an Ultimate 3000 (Thermo, San Jose, CA, USA) with a LC column Poroshell 120 EC-C18 (3.0 × 100 mm 2.7 µm, Agilent Technologies, CA, USA), applying a gradient with methanol and water containing 0.1% of formic acid as mobile phases. The mass analyzer was a Q-Orbitrap (Thermo LC-Q-Exactive).
The antibiotics with the relevant limits of detection (LODs) included in the method for river waters (64 compounds) and river sediments (56 compounds) are listed in the Supplementary Materials (Supplementary Table S2). In this table, also the abbreviations that we used for the detected antibiotics are shown. With respect to waters, in sediments, only 56 drugs were determined since eight antibiotics (six beta-lactams and two macrolides) did not reach acceptable accuracy (data not shown), and therefore, they were excluded. In order to assure the quality of results, in each analytical batch, three quality controls were inserted and analyzed in parallel: One blank sample (negative QC) and two spiked ones (positive QCs at low and high concentration). In addition, eight internal standards (ceftiofur-d3, enrofloxacin-d5, florfenicol-d3, metacycline, penicillin-d7, spiramycin-d3, sulfamethazine-13C6 and sulfanilamide-13C6) were added prior sample preparation to check the recoveries of the different antibiotic classes.

2.3. Prescription Analysis and Antibiotic Consumption Evaluation

All the veterinary paper prescriptions that arrived at the Veterinary Public Services of Umbria and Marche regions were gathered and converted to electronic format via an Excel® spreadsheet. Damaged or unreadable prescriptions were deleted. In this way, it was possible to collect all the necessary information in order to conduct the next evaluation of antibiotic consumption patterns. The defined daily doses for animals (DDDvet) method was used to evaluate the consumption of antibiotics, as suggested in the EMA document [32]. The DDDvet is defined as the assumed average dose per kg animal per species per day [32]. In its document, EMA does not take into account fish species for DDDvet values. For this reason, the defined daily doses for animals (DDDA) values (the DDDvet term is conventionally used only for values elaborated by EMA and reported in its document) were assessed for those antibiotics used in the evaluated trout farms. To do that, the summary of product characteristics (SPC) was taken from the Italian veterinary medicine handbook of the Health Ministry [33]. The assigned DDDA values are listed in Supplementary Table S3.
Following the assessment of DDDA values, the number of prescribed DDDA (pDDDA) was calculated as the kg of live weight of animals that might have received a single dose of a specific active substance, according to the different routes of administration. In fish, the oral route via medicated feed is the only one used. Equation (1) shows how the pDDDA was calculated for medicated feed, where “total amount of AS” indicates the real amount (mg) of the single active substance (AS) contained in it, as prescribed. The value is obtained by multiplying the concentration of the medicated feed (mg of AS/g of premix) by the total amount (g) of the premix.
p D D D A = t o t a l   a m o u n t   o f   A S   mg D D D A   mg kg × day
The prescribed DDDA for every feed was then stratified by AS and added up, thus providing the consumption patterns of all the antibiotics prescribed on the evaluated aquafarms. Temporal (monthly), spatial (aquafarms located among the five sampling points), and production-based (fattening, prefattening, and juvenile fish) analyses were also carried out.

2.4. Statistical Analysis

A descriptive analysis was conducted of all variables obtained from the water and sediment sampling along the Nera River, and veterinary prescriptions were evaluated for the assessment of pDDDA values.
To verify the null hypothesis that the sample was casually extracted from a normal or lognormal distribution, the Kolmogorov‒Smirnov and Anderson‒Darling tests were used. The Kruskal‒Wallis nonparametric test [34,35] was used to compare the detected variables between different sampling points.
To determine the presence of correlation among the variables, Spearman’s nonparametric test was applied.
Statistical tests were carried out with 95% significance. Statistical Analysis Systems software, v.9.3 (SAS Institute Inc., Cary, NC, USA) was used to perform all statistical analyses.

2.5. Ecological Risk Assessment of Antibiotics Detected in the Environment

The theoretical ecological risk is defined as the probability of a given ecosystem being threatened by contamination from chemical compounds. Following the recommendation of the European Technical Guidance Document (TGD) [36], the RQ was applied to evaluate the potential ecotoxicological risk related to antibiotics in the Nera River’s aquatic environment, using Equation (2).
R Q E N V = M E C M A X P N E C E N V
where MECMAX is the measured environmental concentration, the maximum concentration of a given contaminant detected in a matrix. The predicted no-effect concentration (PNEC) is the concentration of a chemical below which no adverse effects of exposure in an ecosystem are measured. The PNECENV is the predicted no-effect concentration in the environment (PNEC-Environment), i.e., the maximum concentration of the contaminant that does not harm the ecosystem.
Algae and cyanobacteria are conventionally used as indicators of water quality because of their short life cycle, high reproduction rate, nutrient requirement and because they immediately respond to changes in water quality [37]. Cyanobacteria, like prokaryotes, are considered susceptible organisms to antibiotics [38]. The use of cyanobacteria for effect testing of antimicrobials is recommended by the European Medicines Evaluation Agency (EMEA), which recommends using them due to their sensitivity [39].
In this study we used the PNEC for three representative organisms of the aquatic environment: The cyanobacterium Anabaena flos-aquae (blue green algae) [40], the microalga Raphidocelis subcapitata and the green alga Green Chlorophyta [41,42].
The PNEC values of chemicals considered in this study were taken from the current literature and are presented in Table 4 [43,44,45,46]. Based on the EMEA guidelines [39], the MECMAX/PNECENV ratio indicates a low risk if it is in the range from 0.01 and 0.1, a medium risk if from 0.1 to 1, and a high risk if it is over 1 [36,47].

3. Results and Discussion

3.1. Chemical Analysis

3.1.1. Antibiotics in Water Samples

Among the 64 antibiotics included in the method scope (Supplementary Table S2), 28 were found in at least one of 60 analyzed water samples. It must be underlined that the choice of antibiotics to be included in the method scope was carried out considering their high usage in Italian farms [31]. Analyte concentrations are provided in Supplementary Table S4. Since the variables are not distributed according to a normal or lognormal distribution (p-value < 0.01), the Kruskal‒Wallis nonparametric test [34,35] was applied to evaluate whether there were significant differences in the concentrations of antibiotics detected among the five selected sampling points. These analyses were conducted only on those ASs that were detected with a frequency of over 75% in at least three sampling sites during the 12 months of evaluation. For this reason, in data related to surface water samples, the active compounds florfenicol (FF), sulfadiazine (SDZ), and trimethoprim (TMP) were further evaluated for the statistical analysis. Thus, they represent the antibiotics most commonly found in all the surface water samples. Significant differences among the median values of concentrations detected across the five points (Molini, Pontechiusita, Borgo Cerreto, Scheggino, and Casteldilago) were observed in two of three antibiotics included in the analysis, SDZ (p-value = 0.040) and TMP (p-value = 0.005), while for FF the results were not statistically significant (p-value = 0.096).
The most abundant antibiotics detected in water samples were similar among the five sampling sites and are illustrated in Figure 2. In particular, the first three substances, which revealed the highest median concentrations values in all the sites, were SDZ, TMP and FF. The highest concentration values of antibiotics were associated with the upstream sampling points—Molini and Pontechiusita—except for SDZ, which also presented high results in Scheggino and Casteldilago (median = 102.5 ng/L and 71.5 ng/L, respectively).
Similar findings were highlighted in other studies that investigated the occurrence of selected antibiotics in the surface waters in areas near fish systems. Indeed, all these studies revealed that the sulfonamides (SAs) were the predominant class of antibiotics with the overall highest detection frequency in surface waters [5,48,49].

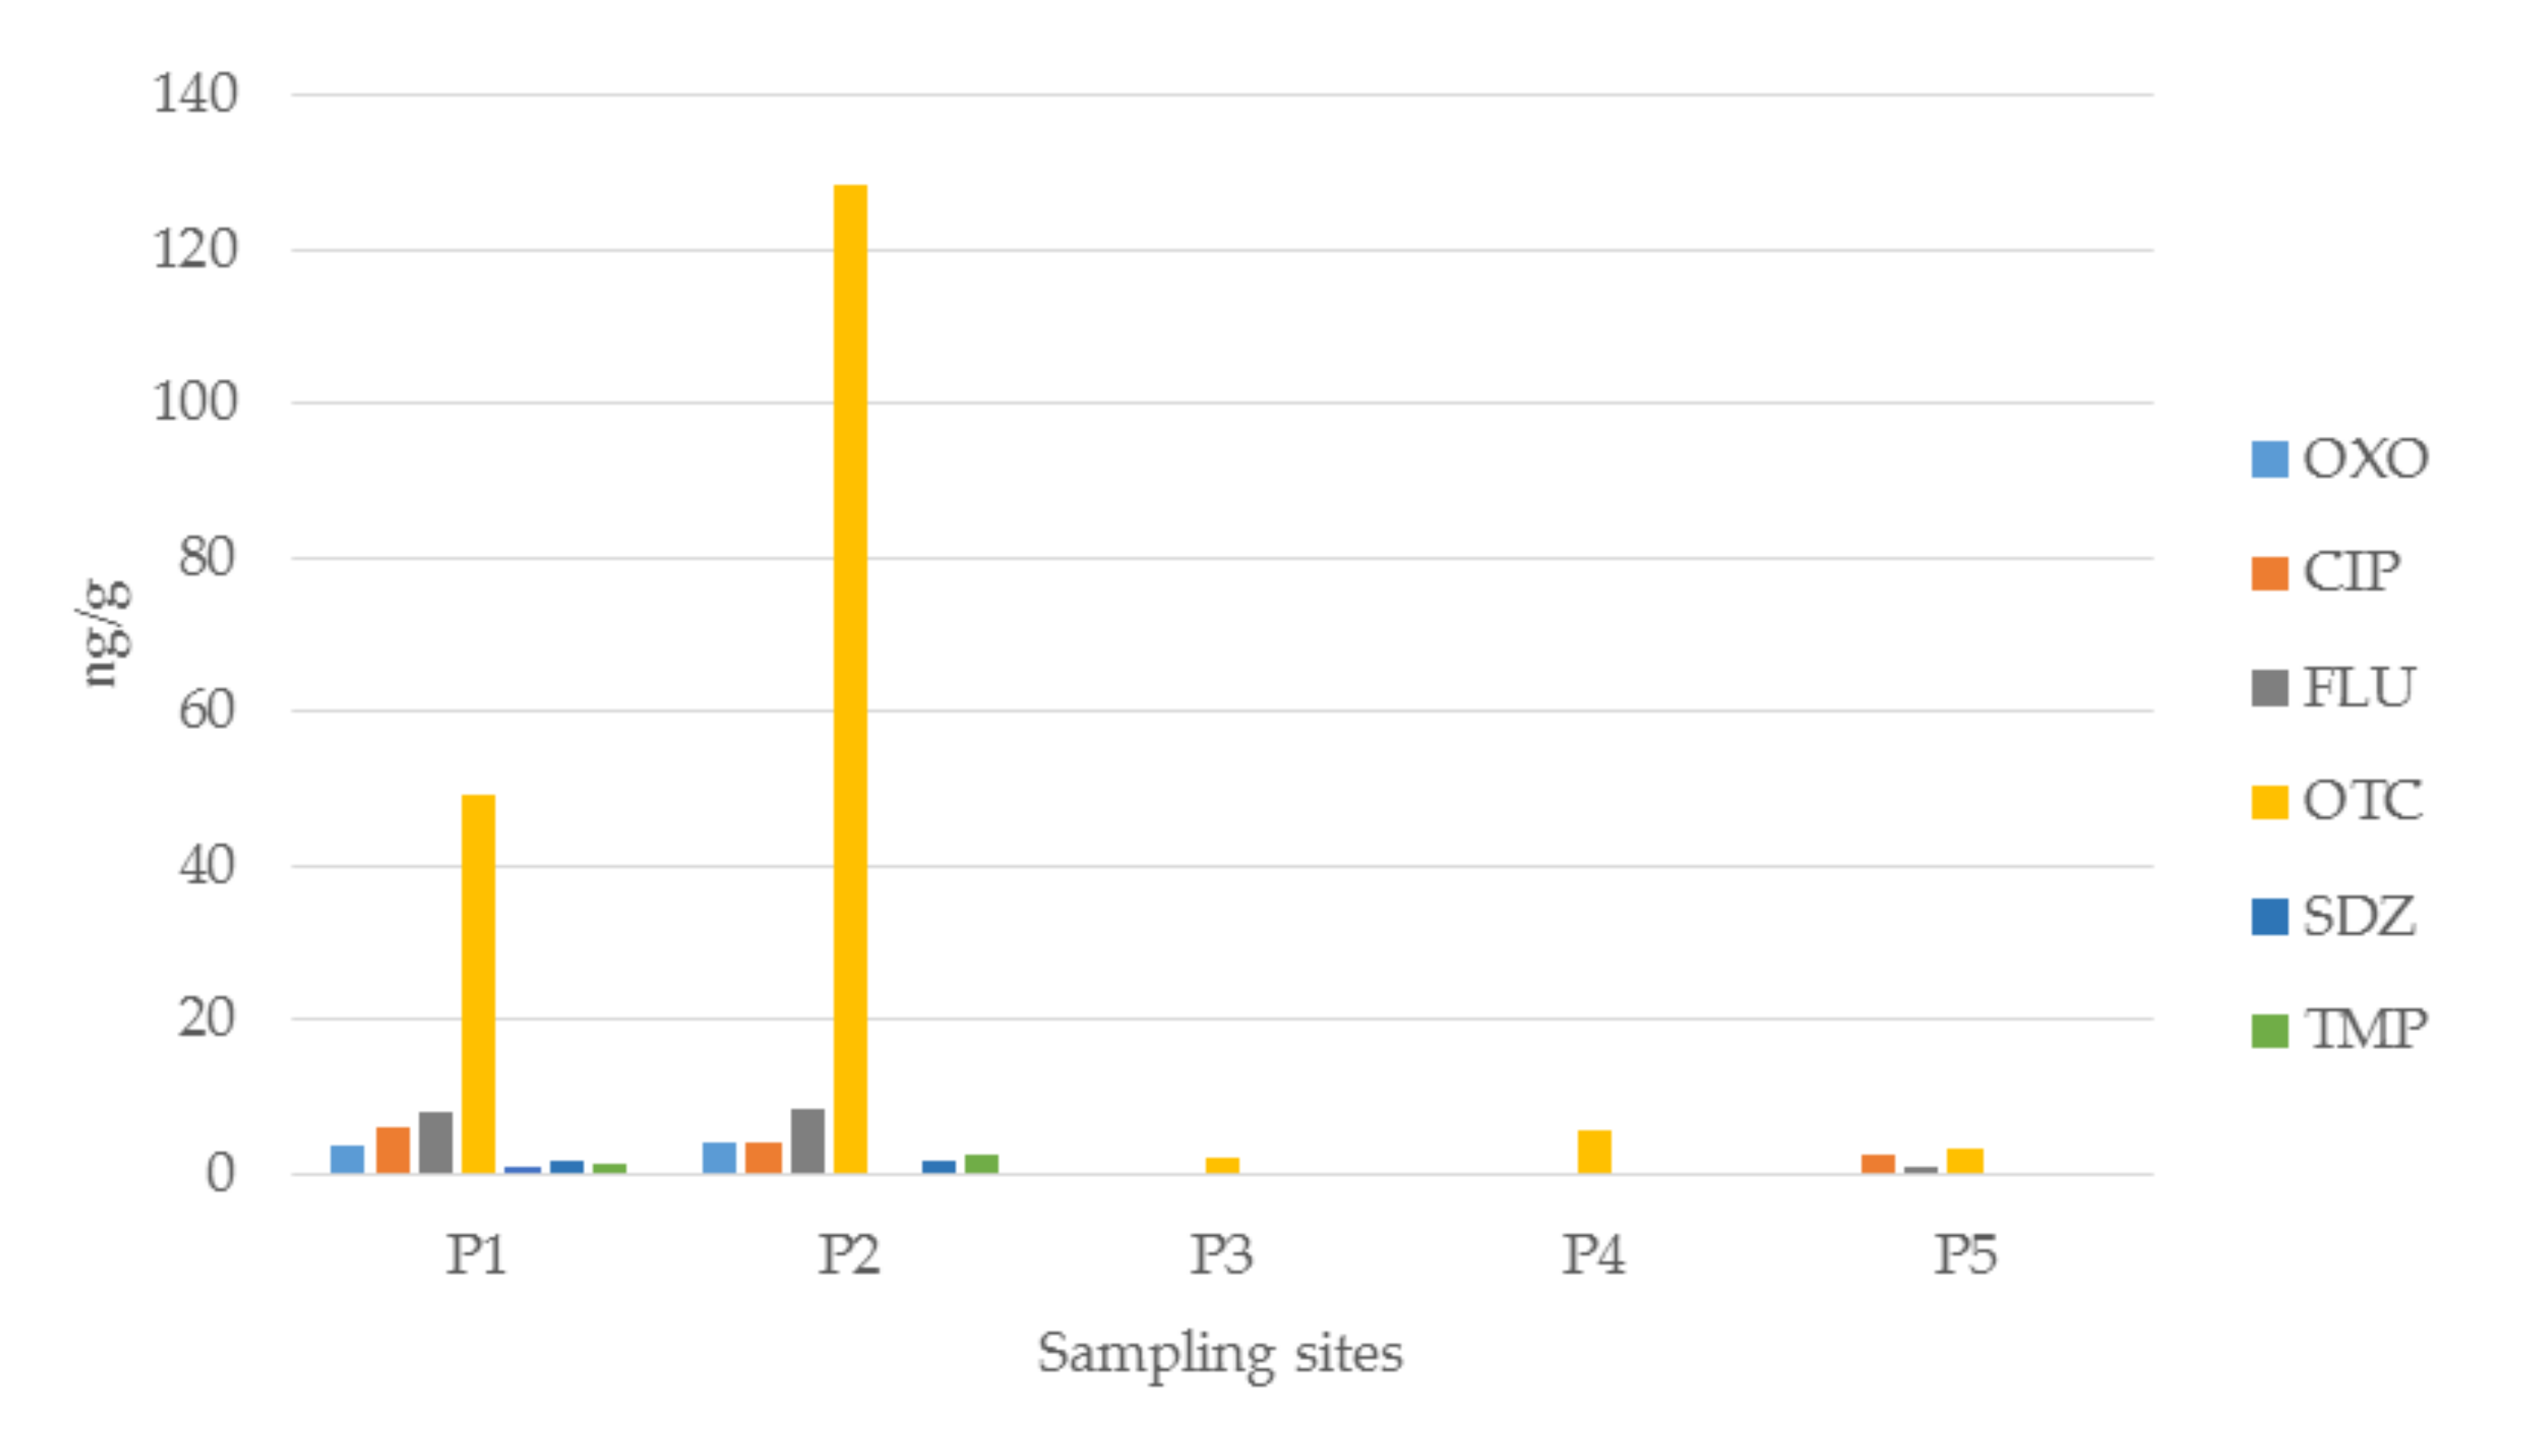
3.1.2. Antibiotics in Sediment Samples

Only 10 out of the 56 antibiotics assessed (Supplementary Table S2) were found in sediments. Their concentrations are reported in Supplementary Table S5. Sediment results highlighted a significant difference between median values of oxytetracycline (OTC) (p < 0.001), the only compound that had a frequency over 75% in all the considered sampling sites, with the highest values in Molini and Pontechiusita, as already observed in water samples. Figure 3 illustrates the median concentration values of the antibiotics detected most in sediment. As expected, the most abundant drugs found in sediments belonged to the quinolones (ciprofloxacin, flumequine, and oxolinic acid) and tetracyclines (oxytetracycline) classes. Indeed, in other similar studies [15,50,51,52], tetracyclines (TCs) and quinolones (QNs) also showed the highest concentration levels in the sediment phases. This may be attributed to the physicochemical characteristic of TCs, as they tend to adsorb onto sediments [53] and are generally not completely catabolized by organisms, thus entering the environment through excrement. This may explain the large difference observed in OTC concentrations between water and sediments (Supplementary Tables S4 and S5).
More specifically, the correlation analysis of the sum of monthly concentrations of antibiotics detected in surface water and sediment samples did not highlight any significant associations (p-value > 0.05) for any of the variables (Table 1). A possible explanation for this evidence is that the sediment‒water interaction of antibiotics could be regulated, to some extent, by the hydrophobicity of antibiotics [5]. In addition, it seems that the molecular size of antibiotics influences their concentrations in sedimentary phases, meaning that large and heavy molecules are more likely to be attracted to the sediment matrix [5]. For example, in this study, SDZ, which has a molecular weight of 250.28 g/mol [54], had the highest concentrations in the water matrix, as was confirmed in other studies [5,15]. In sediment, the most represented AS was OTC, with a molecular weight of 460.4 g/mol [55]. Therefore, in this study, the surface water matrix was then applied for comparison with the prescriptions, as the class of antibiotics used in the evaluated aquafarms better fitted the residues detected in the waters.

3.2. Analysis of Antibiotic Consumption

Aquafarms that breed trout for human consumption along the Nera River number 15 in the Umbria and Marche regions. Four of them did not present any type of prescription for 2018. Among the other farms, there was no off-label use, except for erythromycin (ERY), which is not sold for fish in Italy, but is in some other European countries. The ASs prescribed were ERY, FF, flumequine (FLU), OTC, SDZ, and TMP. The last two, in particular, were administrated in association. Table 2 summarizes the number of pDDDA × 104 of antibiotics per AS. SDZ, in association with TMP, was the most prescribed AS (1049.3 pDDDA × 104), followed by FF (260.7 pDDDA × 104) and OTC (191 pDDDA × 104), while the use of ERY was low compared to other pharmaceuticals (5.3 pDDDA × 104).
The antibiotic consumption related to the different aquafarms was evaluated, taking into account their position in relation to the sampling points. The number of DDDA prescribed on the considered farms, divided by AS and area, between two consecutive sampling sites is summarized in Supplementary Table S6. In particular, four areas were identified: One that includes all the farms located upstream of Molini (A1), one between Molini and Pontechiusita (A2), another between Pontechiusita and Borgo Cerreto (A3), and the last one between Borgo Cerreto and Scheggino (A4). From Scheggino to Casteldilago, there were no aquafarms with prescriptions, so this area was not considered. All the pDDDA considered, based on their area (A1, A2, A3, and A4) and divided by AS, are summarized in Figure 4. A1 contained the aquafarms with the highest number of pDDDA (1285.4 total pDDDA × 104), followed by A2 (618.1 total pDDDA × 104) and A4 (512 pDDDA × 104). These results are in accordance with what was detected in the surface water samples, as the highest values of antibiotic concentrations were detected at the first two sampling points (Figure 2).
The analysis of the antibiotic consumption based on the farms’ type of production (Supplementary Table S7) demonstrated that the majority of usage was related to the fattening sector, where SDZ and TMP were prescribed most of all (88.5 pDDDA × 104). In the juvenile fish sector, FF was the AS most commonly used (184.1 pDDDA × 104). Indeed, according to the diagnoses reported on the prescriptions, FF is usually used for “furunculosis” (Aeromonas salmonicida) treatment, a disease that takes a peracute form mostly in young fish [56]. The combination SDZ‒TMP, instead, was mostly used in the fattening sector, for the treatment of enteric redmouth disease (ERM), a serious septicemic bacterial disease of salmonid fish species caused by Yersinia ruckeri. The disease is most acute in young fish, while it appears as a more chronic condition in older/larger fish, with low-level mortality that is sustained over time, resulting in high cumulative stock losses [57].

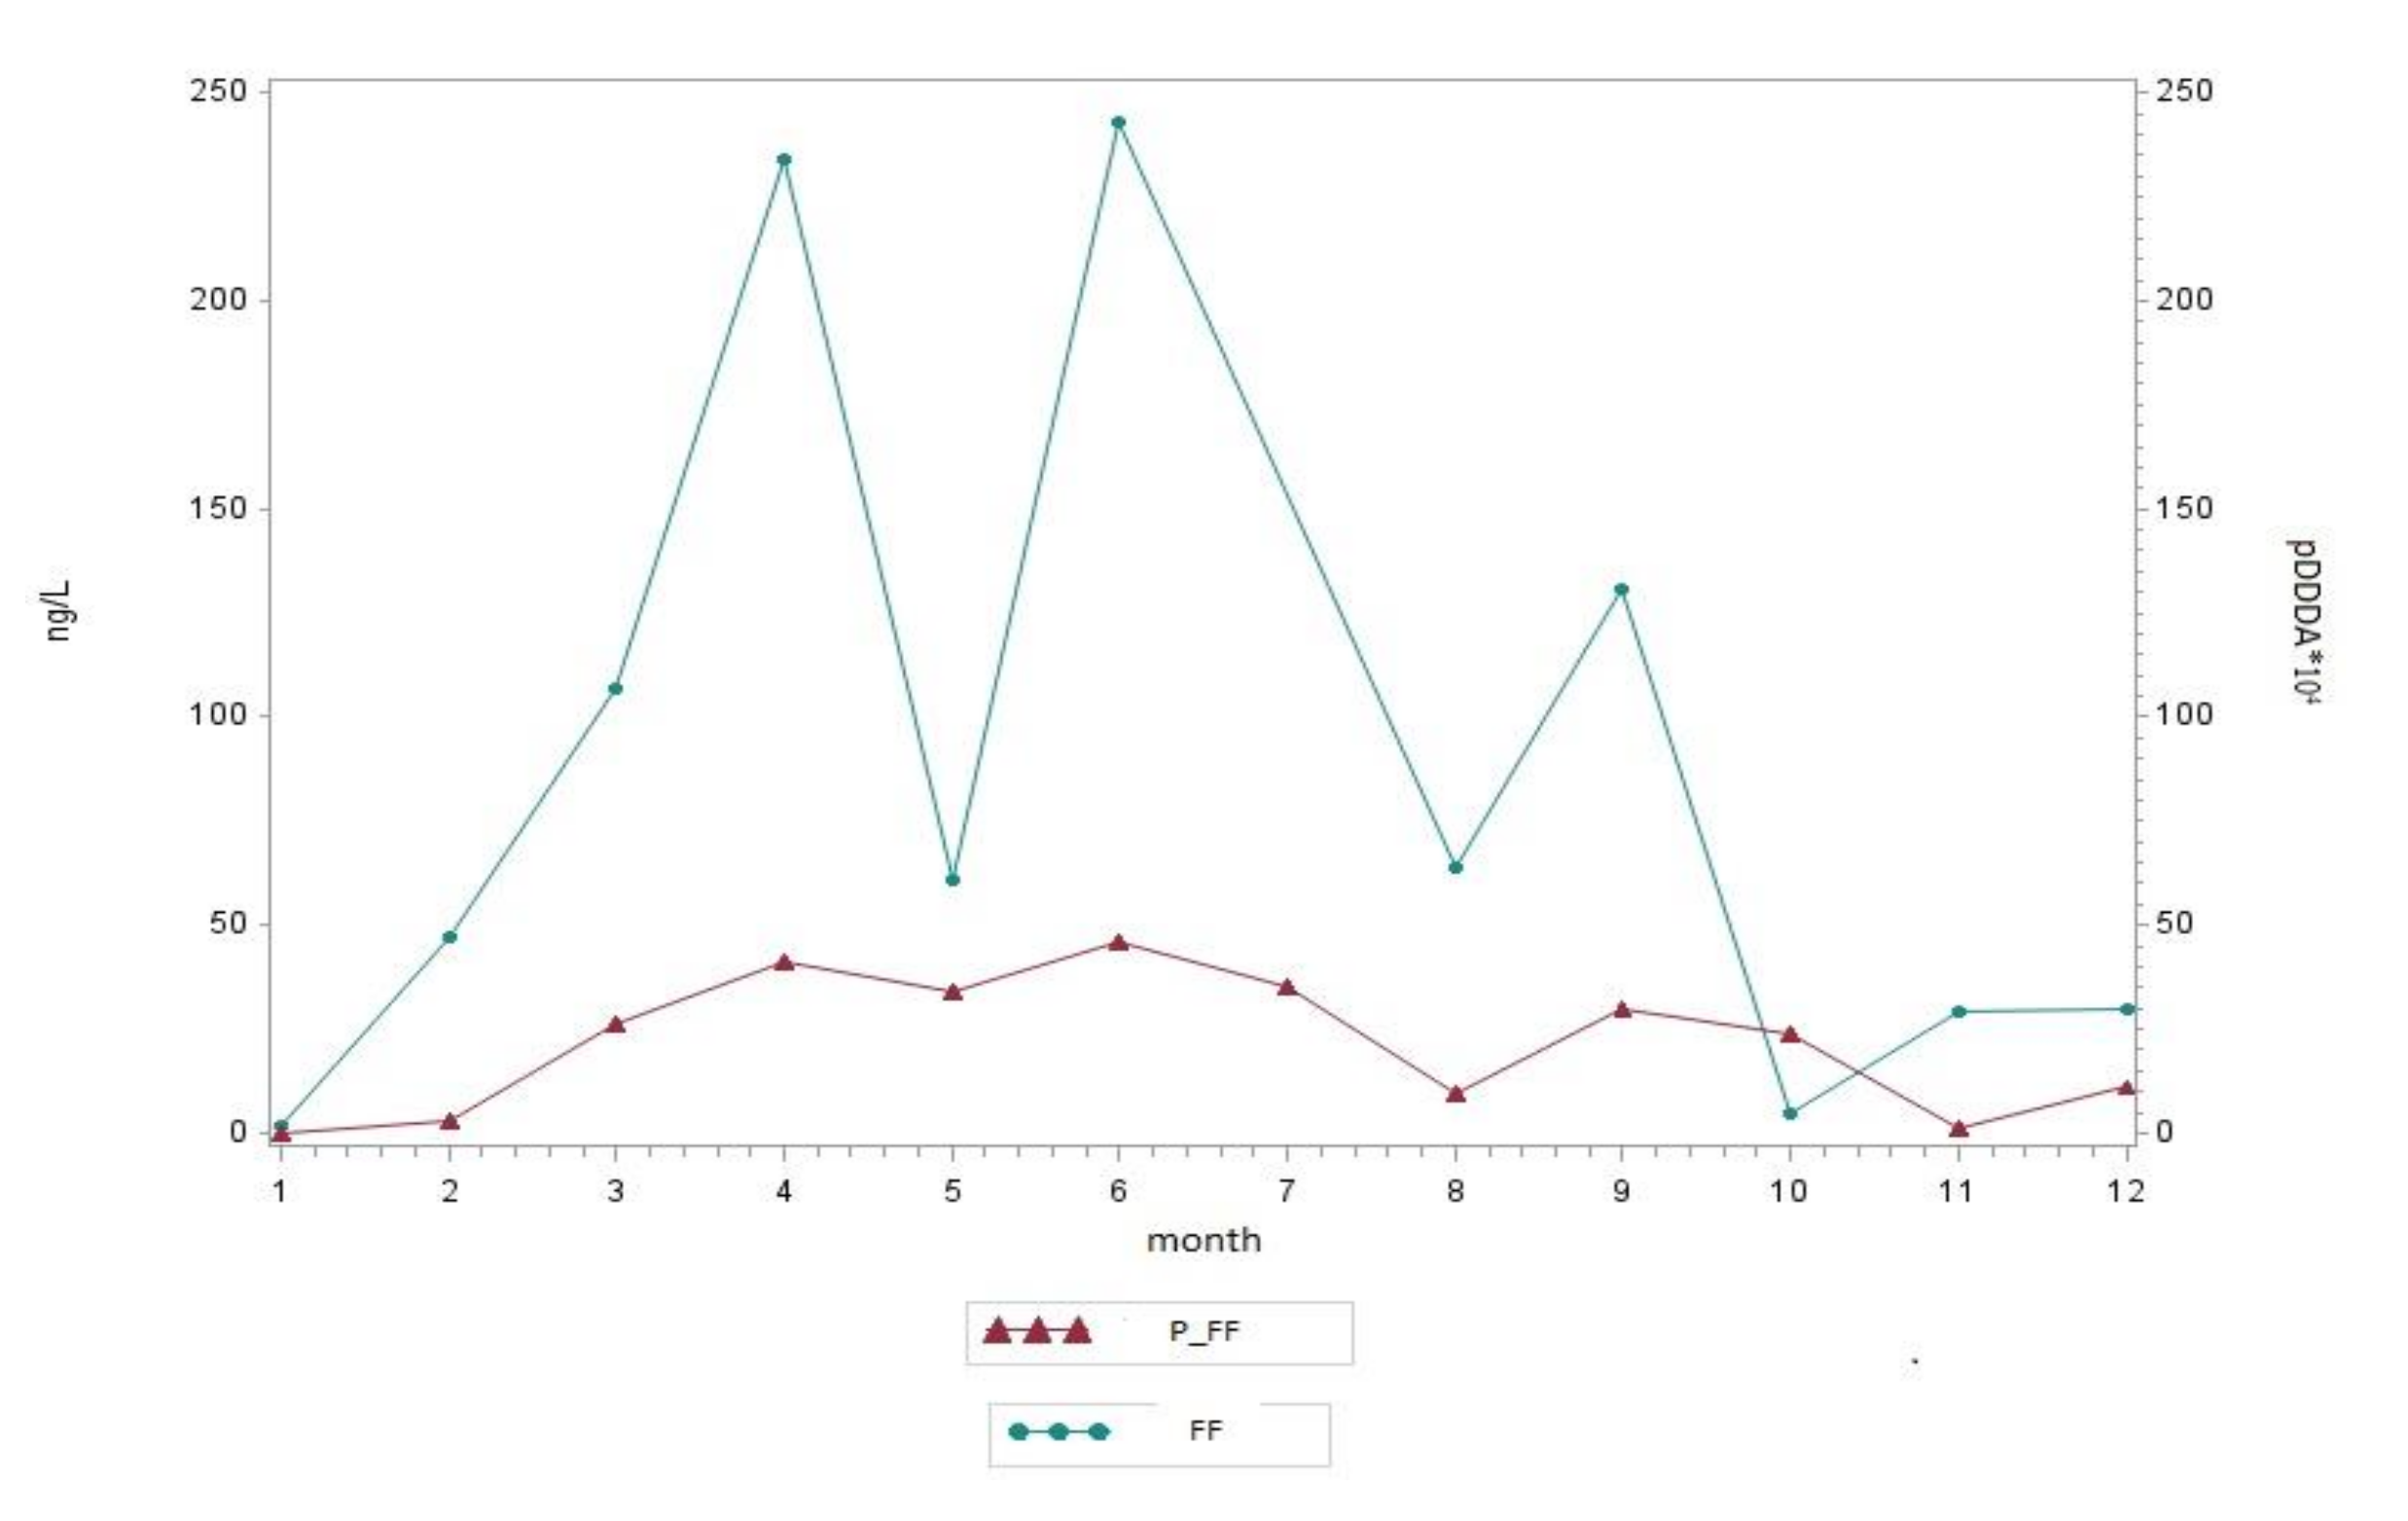
3.3. Correlation Between Antibiotic Consumption and Surface Water Residues

The correlation analysis carried out on the sum of monthly concentrations of antibiotics detected in surface waters and veterinary prescriptions (Table 3) highlighted a strong positive correlation for FLU (r = 72%, p-value = 0.0085, Figure 5) and FF (r = 83%, p-value = 0.008, Figure 6). Figure 5 and Figure 6 show the correlations between the detected concentrations in surface water samples of FLU and FF and the number of prescriptions of the same antibiotics.
An important fact to take into account is that FLU and the FF are almost exclusively used in veterinary medicine, as demonstrated by the 2018 Italian report on human antibiotic consumption, which does not mention these two active compounds [58]. In addition, FLU belongs to the fluoroquinolones class of antibiotics, which has been the object of particular concern in recent years because of several long-term side effects related to their use in humans [59]. This evidence has led to issuing, in 2019, the decision to withdraw from the European trade the drugs containing some active compounds of this class, including the FLU [59]. These data confirmed that the presence of FLU and FF residues in the sampled waters is mainly related to their usage in aquaculture systems. This confirms the hypothesis of a strict linkage between antibiotic consumption in aquaculture and the presence of antibiotics in the nearby aquatic environment. In order to obtain more reliable results, future studies should use treatment data instead of prescriptions. Indeed, in the present study, it was not possible to obtain the treatment data because they still were in a paper-format and held at the single farms. Starting from 2019, instead, such data are going to become more easily accessible, as the electronic veterinary prescriptions will become mandatory in Italy. This will permit gathering in a standardized database all the information regarding veterinary prescriptions and treatments and to make this information easily accessible to the Veterinary Public Services.

3.4. Ecotoxicological Risk Assessment

In the hypothetical environmental impact assessment, based on EMEA guidelines [39], the theoretical ecological risk was low for all the antibiotics detected in the surface water samples (Table 4), as all the values were in the range from 0.01 to 0.1.
The ecotoxicological risk assessment highlighted the possibility of evaluating the potential risk to an aquatic ecosystem posed by antibiotics after their presence is detected in a watercourse like a river. As mentioned before, the evaluation of pollution derived from pharmaceuticals is a growing concern. This was demonstrated by Article 8c of the Priority Substances Directive [14], which was established to develop a strategic approach to pollution of water by pharmaceutical substances, including some of them in the “priority substances list”. The aim was to reduce discharges, emission, and losses of such substances into the aquatic environment [14], and just to be effective, measures should not include end-of-pipe controls (e.g., improved wastewater treatment) but also address the original sources of emissions (e.g., production and use) [60].
In the present study, the ecotoxicological risk was low for all the evaluated antibiotics, showing a positive situation for the Nera River. Indeed, in this case, even if the presence of antibiotics in the aquatic environment was confirmed, their concentrations did not reach high enough levels to cause risk to the most sensitive aquatic microflora considered.
It is important to note that the evaluated river, as reported above, is situated in a low-density area with few zootechnic and agricultural activities, and so the low ecological risk was predictable. Thus, the detection of pharmaceuticals in water, including antibiotics, associated with an assessment of their potential ecotoxicological risk represents a feasible activity to be included in national environmental monitoring plans.

4. Conclusions

To the best of our knowledge, this was the first study to evaluate the real consumption of antibiotics in selected Italian aquafarms using the DDD method. SDZ in association with TMP, was the most prescribed AS, followed by FF and OTC. The results demonstrated a positive correlation between the use of two of these veterinary antibiotics in aquaculture and their detection in the surrounding aquatic environment, although not statistically significant due to the small sample size. This could represent a starting point for building a more extensive understanding of the real contribution of aquaculture systems to environmental pollution derived from antibiotics, and for considering their impact on antimicrobial resistance development. Indeed, the majority of European activities in this field aim to promote the prudent use of antibiotics in both human and veterinary medicine, while information regarding the risks associated with the presence of antibiotics in the aquatic environment is still scarce [8]. An analysis of the pharmaceutical contamination of the river described in this study permitted us to assess the general role of antibiotics as potential ecotoxicological risks through the assessment of the RQ, introducing a new possible investigation to include in future national environmental monitoring programs.
Some other possible confounding determinants remain to be considered in the correlation analysis between the two variables, like pollutant factors (domestic, urban, and agricultural discharges), changes in the flow of the river depending on weather trends, and the different chelating capacities of the antibiotic molecules to the two matrixes. Furthermore, in the future, it would be useful to consider real treatment data instead of those gathered from prescriptions, in order to ensure information more reliable on antibiotic consumption in the aquaculture sector.

Limitations of the Study

As mentioned above, the presence of antibiotics in the evaluated samples depended, in part, on their different behavior in the environment. Thus, there are some ASs, like amoxicillin, that quickly degrade in the aquatic environment and thus show low concentrations. For the purpose of this study, it was important to know which antibiotics were actually present in the aquatic environment near the aquafarms.
The two variables (prescriptions and residues of antibiotics) evaluated by the present study were very different. Indeed, the consumption indexes referred to the overall month, while the antibiotic concentrations were evaluated once a month and might also have been affected by other pollution sources coming from urban centers, the intrinsic molecular characteristics of the active compounds, or hydrometric changes according to different seasons. Furthermore, the consumption evaluation was based on prescription data, which do not necessarily coincide with the actual administration of the medicines. Finally, we decided to use the DDD method for the antibiotic consumption analysis as it is the most up-to-date standardized approach in this field and has never been applied to aquaculture systems before. Further studies could include both pDDDA values and the total amount of AS prescribed (mg) in order to understand which variable gives better results in the correlation analysis with the antibiotic residues detected in the environment. The mentioned limits do not seem to have damaged the overall analysis results, as they were rather satisfying, demonstrating a good hypothetical correlation between the prescription and the administration. This assumption is also supported by the fact that some of the detected antibiotics that demonstrated a strong positive correlation (FLU and FF) are specific to the veterinary sector.
It is important to note that values of PNEC are recommended based on currently available information and may change as more reliable information comes to light. Furthermore, the company publicly discloses safety data sheets for antibiotics, but does not include PNECs in the safety data sheets. By sharing their PNEC information publicly, companies would give governments, researchers, generic medicine manufacturers, and others the opportunity to use these data in their work to minimize the impact of manufacturing discharge of antibiotics. Improved transparency regarding environmental risk management by the companies is strongly suggested, e.g., by adding the medicines’ predicted no-effect concentrations (PNECs) for resistance selection to its safety data sheets.

Supplementary Materials

The following are available online at https://www.mdpi.com/2071-1050/12/12/5176/s1, Table S1. Summary of information on sampling points and related aquafarms with specification of quantity and type of production. Table S2. List of antibiotics and their abbreviations with the relevant limits of detection (LODs) included in the method developed for river waters (64 compounds) and for sediments (56 compounds). Table S3. DDDA and DCDA for antibiotics prescribed in the selected aquafarms, Table S4. Summarised concentrations (ng/L) and frequencies (%) of detected antibiotics in water samples from the five sites. P1: Molini, P2: Pontechiusita, P3: Borgo Cerreto, P4: Scheggino, P5: Casteldilago. Table S5. Summarised concentrations (ng/g d.w.) and frequencies (%) of detected antibiotics in sediment samples from the five sites. P1: Molini; P2: Pontechiusita; P3: Borgo Cerreto; P4: Scheggino; P5: Casteldilago. Table S6. Prescribed DDDA × 104 in farms located in the areas between the evaluated sampling points. A1: upstream Molini; A2: Molini–Pontechiusita; A3: Pontechiusita–Borgo Cerreto; A4: Borgo Cerreto–Scheggino. Table S7. Summary of the number of prescribed DDDA × 104 (mg/kg) of antibiotics of the evaluated aquafarms by type of production.

Author Contributions

Conceptualization, M.C. and R.G.; data curation, M.S.; formal analysis, S.B., K.D.B., M.B. and A.L.; investigation M.S., D.G., R.G. and M.C.; methodology R.G., D.G., M.C., M.S.; project administration, M.C.; validation, R.G. and D.G.; writing—original draft, M.S.; writing—review & editing, M.S., S.B., A.L., R.G., M.B. and M.C. All authors have read and agreed to the published version of the manuscript.

Funding

Umbria Region, within the Activity Program of the Umbria Region 2018, funded this research: “Monitoring of veterinary drugs consumption and assessment of possible environmental and health impacts (PAU05-2018)”.

Acknowledgments

We gratefully acknowledge all the professionals who work for the Public Veterinarian Services of Usl Umbria and ASUR Marche for making available the paper veterinary prescriptions to us.

Conflicts of Interest

The authors declare no conflict of interest. The funders had no role in the design of the study; in the collection, analyses, or interpretation of data; in the writing of the manuscript, or in the decision to publish the results.

References

  1. Friedman, N.D.; Temkin, E.; Carmeli, Y. The negative impact of antibiotic resistance. Clin. Microbiol. Infect. 2016, 22, 416–422. [Google Scholar] [CrossRef] [PubMed]
  2. McEwen, S.A.; Collignon, P.J. Antimicrobial Resistance: A One Health Perspective. Microbiol. Spectr. 2018, 6, 521–547. [Google Scholar] [CrossRef] [Green Version]
  3. Westphal-Settele, K.; Konradi, S.; Balzer, F.; Schönfeld, J.; Schmithausen, R. Die Umwelt als Reservoir für Antibiotikaresistenzen. Bundesgesundheitsblatt Gesundheitsforsch. Gesundh. 2018, 61, 533–542. [Google Scholar] [CrossRef] [PubMed]
  4. Sarmah, A.K.; Meyer, M.T.; Boxall, A.B.A. A global perspective on the use, sales, exposure pathways, occurrence, fate and effects of veterinary antibiotics (VAs) in the environment. Chemosphere 2006, 65, 725–759. [Google Scholar] [CrossRef] [PubMed]
  5. Chen, K.; Zhou, J.L. Occurrence and behavior of antibiotics in water and sediments from the Huangpu River, Shanghai, China. Chemosphere 2014, 95, 604–612. [Google Scholar] [CrossRef] [PubMed]
  6. Kümmerer, K. Antibiotics in the aquatic environment—A review—Part I. Chemosphere 2009, 75, 417–434. [Google Scholar] [CrossRef]
  7. Le Page, G.; Gunnarsson, L.; Snape, J.; Tyler, C.R. Integrating human and environmental health in antibiotic risk assessment: A critical analysis of protection goals, species sensitivity and antimicrobial resistance. Environ. Int. 2017, 109, 155–169. [Google Scholar] [CrossRef] [PubMed]
  8. Carvalho, I.T.; Santos, L. Antibiotics in the aquatic environments: A review of the European scenario. Environ. Int. 2016, 94, 736–757. [Google Scholar] [CrossRef]
  9. Segura, P.A.; François, M.; Gagnon, C.; Sauvé, S. Review of the occurrence of anti-infectives in contaminated wastewaters and natural and drinking waters. Environ. Health Perspect. 2009, 117, 675–684. [Google Scholar] [CrossRef]
  10. Danner, M.-C.; Robertson, A.; Behrends, V.; Reiss, J. Antibiotic pollution in surface fresh waters: Occurrence and effects. Sci. Total Environ. 2019, 664, 793–804. [Google Scholar] [CrossRef]
  11. Edwards, M.; Topp, E.; Metcalfe, C.D.; Li, H.; Gottschall, N.; Bolton, P.; Curnoe, W.; Payne, M.; Beck, A.; Kleywegt, S.; et al. Pharmaceutical and personal care products in tile drainage following surface spreading and injection of dewatered municipal biosolids to an agricultural field. Sci. Total Environ. 2009, 407, 4220–4230. [Google Scholar] [CrossRef] [PubMed]
  12. European Commission. Establishing a Watch List of Substances for Union-Wide Monitoring in the Field of Water Policy; EC Decision 2015/495 Commission Implementing Decision (EU) 2015/495; 2015; Volume 78, pp. 40–42. [Google Scholar]
  13. Loos, R.; Marinov, D.; Sanseverino, I.; Napierska, D.; Lettieri, T. Review of the 1st Watch List under the Water Framework Directive and Recommendations for the 2nd Watch List; EUR 29173 EN; Publication Office of the European Union: Luxembourg, 2018; ISBN 9789279818394. JRC111198. [Google Scholar] [CrossRef]
  14. European Parliament. Directive 2008/105/EC on Environmental Quality Standards in the Field of Water Policy, Amending and Subsequently Repealing Council Directives 82/176/EEC, 83/513/EEC, 84/156/EEC, 84/491/EEC, 86/280/EEC and Amending Directive 2000/60/EC of the European Parliament and of the Council; European Parliament: Brussels, Belgium, 2008; Volume 51, p. 84. [Google Scholar]
  15. Chen, H.; Jing, L.; Teng, Y.; Wang, J. Characterization of antibiotics in a large-scale river system of China: Occurrence pattern, spatiotemporal distribution and environmental risks. Sci. Total Environ. 2018, 618, 409–418. [Google Scholar] [CrossRef] [PubMed]
  16. Dogliotti, E.; Achene, L.; Beccaloni, E.; Carere, M.; Comba, P.; Crebelli, R.; Pasetto, R.; Eleonora, M.; Soggiu, E.T. Guidelines for health impact assessment (Italian Legislative Decree n. 104/2017).; Istituto Superiore di Sanità: Rome, Italy, 2019; (Rapporti ISTISAN 19/9); Volume VII, p. 72. [Google Scholar]
  17. Boxall, A.B.A. The environmental side effects of medication. EMBO Rep. 2004, 5, 1110–1116. [Google Scholar] [CrossRef] [PubMed] [Green Version]
  18. Cabello, F.C. Heavy use of prophylactic antibiotics in aquaculture: A growing problem for human and animal health and for the environment. Environ. Microbiol. 2006, 8, 1137–1144. [Google Scholar] [CrossRef]
  19. Barton, B.A.; Iwama, G.K. Physiological changes in fish from stress in aquaculture with emphasis on the response and effects of corticosteroids. Annu. Rev. Fish Dis. 1991, 1, 3–26. [Google Scholar] [CrossRef]
  20. Cabello, F. Antibiotics and aquaculture in Chile: Implications for human and animal health. Rev. Med. Chile 2004, 132, 1001–1006. [Google Scholar]
  21. Naylor, R.; Burke, M.; Wrigley, J. Raising Tigers of the Sea. Annu. Rev. Environ. Resour. 2005, 30, 185–218. [Google Scholar] [CrossRef] [Green Version]
  22. Santos, L.; Ramos, F. Antimicrobial resistance in aquaculture: Current knowledge and alternatives to tackle the problem. Int. J. Antimicrob. Agents 2018, 52, 135–143. [Google Scholar] [CrossRef]
  23. Lalumera, G.M.; Calamari, D.; Galli, P.; Castiglioni, S.; Crosa, G.; Fanelli, R. Preliminary investigation on the environmental occurrence and effects of antibiotics used in aquaculture in Italy. Chemosphere 2004, 54, 661–668. [Google Scholar] [CrossRef]
  24. Burridge, L.; Weis, J.S.; Cabello, F.; Pizarro, J.; Bostick, K. Chemical use in salmon aquaculture: A review of current practices and possible environmental effects. Aquaculture 2010, 306, 7–23. [Google Scholar] [CrossRef]
  25. Romero, J.; Gloria, C.; Navarrete, P. Antibiotics in Aquaculture—Use, Abuse and Alternatives. In Health and Environment in Aquaculture; InTech: Rijeka, Croatia, 2012. [Google Scholar]
  26. Reverter, M.; Sarter, S.; Caruso, D.; Avarre, J.-C.; Combe, M.; Pepey, E.; Pouyaud, L.; Vega-Heredía, S.; de Verdal, H.; Gozlan, R.E. Aquaculture at the crossroads of global warming and antimicrobial resistance. Nat. Commun. 2020, 11, 1870. [Google Scholar] [CrossRef] [PubMed] [Green Version]
  27. Thornber, K.; Verner-Jeffreys, D.; Hinchliffe, S.; Rahman, M.M.; Bass, D.; Tyler, C.R. Evaluating antimicrobial resistance in the global shrimp industry. Rev. Aquac. 2020, 12, 966–986. [Google Scholar] [CrossRef] [Green Version]
  28. Sapkota, A.; Sapkota, A.R.; Kucharski, M.; Burke, J.; McKenzie, S.; Walker, P.; Lawrence, R. Aquaculture practices and potential human health risks: Current knowledge and future priorities. Environ. Int. 2008, 34, 1215–1226. [Google Scholar] [CrossRef]
  29. Peterson, R.K.D. Comparing ecological risks of pesticides: The utility of a risk quotient ranking approach across refinements of exposure. Pest Manag. Sci. 2006, 62, 46–56. [Google Scholar] [CrossRef] [PubMed]
  30. Thomaidi, V.S.; Matsoukas, C.; Stasinakis, A.S. Risk assessment of triclosan released from sewage treatment plants in European rivers using a combination of risk quotient methodology and Monte Carlo simulation. Sci. Total Environ. 2017, 603, 487–494. [Google Scholar] [CrossRef] [PubMed]
  31. Moretti, S.; Dusi, G.; Giusepponi, D.; Pellicciotti, S.; Rossi, R.; Saluti, G.; Cruciani, G.; Galarini, R. Screening and confirmatory method for multiclass determination of 62 antibiotics in meat. J. Chromatogr. A 2016, 1429, 175–188. [Google Scholar] [CrossRef] [PubMed]
  32. European Medicines Agency. EMA-ESVAC Principles on Assignment of Defined Daily Dose for Animals (DDDvet) and Defined Course Dose for Animals (DCDvet); European Medicines Agency—Veterinary Medicines Division: London, UK, 2015; Volume 44. [Google Scholar]
  33. Veterinary Medicines Handbook—Online Database. Available online: https://www.vetinfo.it/j6_prontuario/public/ (accessed on 9 April 2020).
  34. Kruskal, W.H. A Nonparametric test for the Several Sample Problem. Ann. Math. Stat. 1952, 23, 525–540. [Google Scholar] [CrossRef]
  35. Kruskal, W.H.; Wallis, W.A. Use of Ranks in One-Criterion Variance Analysis. J. Am. Stat. Assoc. 1952, 47, 583–621. [Google Scholar] [CrossRef]
  36. Technical Guidance Document on Risk Assessment: Part II; European Chemicals Bureau: Luxembourg, 2003.
  37. Gökçe, D. Algae as an Indicator of Water Quality. In Algae—Organisms for Imminent Biotechnology; Thajuddin, N., Dhanasekaran, D., Eds.; InTech: Rijeka, Croatia, 2016; pp. 81–101. [Google Scholar]
  38. Maul, J.D.; Schuler, L.J.; Belden, J.B.; Whiles, M.R.; Lydy, M.J. Effects of the antibiotic ciprofloxacin on stream microbial communities and detritivorous macroinvertebrates. Environ. Toxicol. Chem. 2006, 25, 1598–1606. [Google Scholar] [CrossRef]
  39. EMEA. EMEA Guideline on the Environmental Risk Assessment of Medicinal Products for Human Use; European Medicine Agency: Amsterdam, The Netherlands, 2006; p. 12. [Google Scholar]
  40. Agnihotri, V.K. Anabaena flos-aquae. Crit. Rev. Environ. Sci. Technol. 2014, 44, 1995–2037. [Google Scholar] [CrossRef]
  41. González-Pleiter, M.; Gonzalo, S.; Rodea-Palomares, I.; Leganés, F.; Rosal, R.; Boltes, K.; Marco, E.; Fernández-Piñas, F. Toxicity of five antibiotics and their mixtures towards photosynthetic aquatic organisms: Implications for environmental risk assessment. Water Res. 2013, 47, 2050–2064. [Google Scholar] [CrossRef] [PubMed]
  42. Heijerick, D.G.; De Schamphelaere, K.A.C.; Janssen, C.R. Biotic ligand model development predicting Zn toxicity to the alga Pseudokirchneriella subcapitata: Possibilities and limitations. Comp. Biochem. Physiol. Part C Toxicol. Pharmacol. 2002, 133, 207–218. [Google Scholar] [CrossRef]
  43. Ciucă, V. Environmental assessment for Florfenicol FP 10% Evaluarea riscului pentru mediu a produsului Florfenicol FP 10%. In Medicamentul Veterinar/Veterinary Drug; Romanian National Association of the Veterinary Products Manufactures: Bucharest, Romania, 2018. [Google Scholar]
  44. Gallagher, S.P.; Kendall, T.Z.; Krueger, H.O. Florfenicol: A 96-Hour Toxicity Test with the Freshwater Alga (Anabaena Flos-Aquae); Schering-Plough Research Institute: Kenilworth, NJ, USA, 2008; No.: 07119. [Google Scholar]
  45. Tell, J.; Caldwell, D.J.; Häner, A.; Hellstern, J.; Hoeger, B.; Journel, R.; Mastrocco, F.; Ryan, J.J.; Snape, J.; Straub, J.O.; et al. Science-based Targets for Antibiotics in Receiving Waters from Pharmaceutical Manufacturing Operations. Integr. Environ. Assess. Manag. 2019, 15, 312–319. [Google Scholar] [CrossRef] [PubMed]
  46. Zhang, L.; Shen, L.; Qin, S.; Cui, J.; Liu, Y. Quinolones antibiotics in the Baiyangdian Lake, China: Occurrence, distribution, predicted no-effect concentrations (PNECs) and ecological risks by three methods. Environ. Pollut. 2020, 256, 113458. [Google Scholar] [CrossRef]
  47. Sánchez-Bayo, F.; Baskaran, S.; Kennedy, I.R. Ecological relative risk (EcoRR): Another approach for risk assessment of pesticides in agriculture. Agric. Ecosyst. Environ. 2002, 91, 37–57. [Google Scholar] [CrossRef]
  48. Wang, Z.; Du, Y.; Yang, C.; Liu, X.; Zhang, J.; Li, E.; Zhang, Q.; Wang, X. Occurrence and ecological hazard assessment of selected antibiotics in the surface waters in and around Lake Honghu, China. Sci. Total Environ. 2017, 609, 1423–1432. [Google Scholar] [CrossRef]
  49. Hossain, A.; Nakamichi, S.; Habibullah-Al-Mamun, M.; Tani, K.; Masunaga, S.; Matsuda, H. Occurrence, distribution, ecological and resistance risks of antibiotics in surface water of finfish and shellfish aquaculture in Bangladesh. Chemosphere 2017, 188, 329–336. [Google Scholar] [CrossRef]
  50. Brown, K.D.; Kulis, J.; Thomson, B.; Chapman, T.H.; Mawhinney, D.B. Occurrence of antibiotics in hospital, residential, and dairy effluent, municipal wastewater, and the Rio Grande in New Mexico. Sci. Total Environ. 2006, 366, 772–783. [Google Scholar] [CrossRef]
  51. Han, Q.F.; Zhao, S.; Zhang, X.R.; Wang, X.L.; Song, C.; Wang, S.G. Distribution, combined pollution and risk assessment of antibiotics in typical marine aquaculture farms surrounding the Yellow Sea, North China. Environ. Int. 2020, 138, 105551. [Google Scholar] [CrossRef]
  52. Deng, W.J.; Li, N.; Ying, G.G. Antibiotic distribution, risk assessment, and microbial diversity in river water and sediment in Hong Kong. Environ. Geochem. Health 2018, 40, 2191–2203. [Google Scholar] [CrossRef]
  53. Zhang, D.; Lin, L.; Luo, Z.; Yan, C.; Zhang, X. Occurrence of selected antibiotics in Jiulongjiang River in various seasons{,} South China. J. Environ. Monit. 2011, 13, 1953–1960. [Google Scholar] [CrossRef] [PubMed]
  54. National Center for Biotechnology Information PubChem Database. Sulfadiazine, CID=5215. Available online: https://pubchem.ncbi.nlm.nih.gov/compound/Sulfadiazine (accessed on 2 April 2020).
  55. National Center for Biotechnology Information. PubChem Database. Oxytetracycline, CID=54675779. Available online: https://pubchem.ncbi.nlm.nih.gov/compound/Oxytetracycline (accessed on 2 April 2020).
  56. Menanteau-ledouble, S.; Kumar, G.; Saleh, M.; El-matbouli, M. Aeromonas salmonicida: Updates on an old acquaintance. Dis. Aquat. Org. 2016, 120, 49–68. [Google Scholar] [CrossRef] [PubMed] [Green Version]
  57. Kumar, G.; Menanteau-Ledouble, S.; Saleh, M.; El-Matbouli, M. Yersinia ruckeri, the causative agent of enteric redmouth disease in fish. Vet. Res. 2015, 46, 1–10. [Google Scholar] [CrossRef] [PubMed] [Green Version]
  58. OsMed. National Report on Antibiotics Use in Italy. Year 2018; The Medicines Utilisation Monitoring Centre: Rome, Italy, 2019. [Google Scholar]
  59. EMA. Disabling and potentially permanent side effects lead to suspension or restrictions of quinolone and fluoroquinolone antibiotics. Eur. Med. Agency Sci. Med. Agency 2018, 31, 1–3. [Google Scholar]
  60. European Commission. Communication from the Commission to the European Parliament, the Council and the European Economic and Social Committee: European Union Strategic Approach to Pharmaceuticals in the Environment. European Commission: Brussels, Belgium, 2019. [Google Scholar]
Figure 1. The course of the Nera River (light blue line), the overall trout aquafarms (small yellow dots), with the specification of those that were evaluated in the study (red stars), having had antibiotic prescriptions during 2018, and the selected sampling sites (orange diamonds).
Sustainability 12 05176 g001
Figure 2. Concentrations (median values) of the main antibiotics detected in the surface water samples from the five sites during the year 2018. P1: Molini, P2: Pontechiusita, P3: Borgo Cerreto, P4: Scheggino, P5: Casteldilago. ERY: Erythromicin, FF: Florfenicol, FLU: Flumequine, OTC: Oxytetracycline, SDZ: Sulfadiazine, TMP: Trimethoprim.
Sustainability 12 05176 g002
Figure 3. Concentrations (median values) of the main antibiotics detected in the sediment samples of the five sites during the year 2018. P1: Molini, P2: Pontechiusita, P3: Borgo Cerreto, P4: Scheggino, P5: Casteldilago. OXO: Oxolinic acid, CIP: Ciprofloxacin, FLU: Flumequine, OTC: Oxytetracycline, SDZ: Sulfadiazine, TMP: Trimethoprim.
Sustainability 12 05176 g003
Figure 4. Number of pDDDA × 104 antibiotics from the studied farms in 2018, divided into four areas. A1: upstream Molini, A2: Molini–Pontechiusita, A3: Pontechiusita–Borgo Cerreto, A4: Borgo Cerreto–Scheggino.
Sustainability 12 05176 g004
Figure 5. Relationship between concentrations of flumequine detected in surface water samples (ng/L) and the number of prescriptions (pDDDA × 104). P_FLU = number of prescriptions of flumequine (pDDDA × 104), FLU = concentrations of flumequine detected in surface water samples (ng/L).
Sustainability 12 05176 g005
Figure 6. Relationship between concentrations of florfenicol detected in surface water samples (ng/L) and the number of prescriptions (pDDDA × 104). P_FF = number of prescriptions of florfenicol (pDDDA × 104), FF = concentrations of florfenicol detected in surface water samples (ng/L).
Sustainability 12 05176 g006
Table 1. Correlation analysis between concentrations of antibiotics related to surface water and sediment samples—Spearman’s correlation index. The statistically significant results are in bold.
Variabler (%)p-Value
ERY510.0882
OTC500.1006
SDZ400.2028
TMP540.0709
ERY: Erythromycin, OTC: Oxytetracycline, SDZ: Sulfadiazine, TMP: Trimethoprim.
Table 2. Antibiotic consumption (pDDDA × 104) per AS in 2018 of the evaluated aquafarms.
ASpDDDA × 104
ERY5.3
FF260.7
FLU53
OTC191
SDZ1049.3
TMP1049.3
Tot.2608.5
ERY: Erythromycin, FF: Florfenicol, FLU: Flumequine, OTC: Oxytetracycline, SDZ: Sulfadiazine, TMP: Trimethoprim; pDDDA: prescribed defined daily doses for animals; AS: active substance.
Table 3. Results of correlation analysis between the concentrations of antibiotics detected in surface waters and the amount of prescribed antibiotics (DDDA)—Spearman’s correlation index. The statistically significant results are in bold.
Variabler (%)p-Value
ERY420.1746
FLU720.0085
FF830.0008
OTC430.1646
SDZ410.1858
TMP460.1369
ERY: Erythromycin, FLU: Flumequine, FF: Florfenicol, OTC: Oxytetracycline, SDZ: Sulfadiazine, TMP: Trimethoprim.
Table 4. Theoretical ecological risk (RQENV) of the most detected antibiotics in surface water samples.
ASMECMAX (µg/L)PNECENV (µg/L)SpeciesReferencesRQENV
Fluvial WaterFluvial Water
ERY0.0180.5Anabaena flos-aquae[45]0.036
FLU1.08318.7Green Chlorophyta[46]0.058
FF0.19223Anabaena flos-aquae[44]0.008
OTC1.13918Raphidocelis subcapitata[45]0.063
SDZ0.57113Raphidocelis subcapitata[45]0.044
TMP0.18100Anabaena flos-aquae[45]0.002
MECMAX: maximum of measured environmental concentration; PNECENV: predicted no-effect concentration in the environment.

