1. Introduction
Distributed photovoltaic generation, either located on rooftops or ground-mounted, is by far one of the most important and fast-growing renewable energy technologies. Driven by technological advancements and policy encouragement, the distributed photovoltaic generations have developed rapidly in China in recent years. The installed capacity of the distributed photovoltaic (PV) generation reached 20.96 gigawatts (GW) by the year 2018, with cumulative capacity now sitting at 50.61 GW [
1]. According to the 13th Five-year plan for electric power development in China, the installed capacity of solar power is predicted to reach more than 110 GW by 2020, of which more than 60 GW is distributed generation [
2,
3]. Distributed PV generation has been installed mainly in Eastern and Southern China, where the country’s economy is the most prosperous and the demand for power is the greatest. About 52% of capacity is in the following four provinces: Zhejiang, Shandong, Jiangsu, and Anhui, as shown in
Figure 1.
Since 2009, China has introduced many policies to support the distributed PV industry, including financial assistance, technology support, management improvement, etc. However, the trading restriction of the power electricity has hindered the development of China’s distributed PV generation for a long time. In October 2017, China’s National Development and Reform Commission (NDRC) and National Energy Administration (NEA) jointly announced a new policy, which permits the distributed generators (including distributed PV generation and distributed wind power generation) to participate in the trade [
4]. The official document of this policy is the 1901st document in the 2017 year, thus it is usually called the No. 1901 document [
4].
According to the No. 1901 document, the distributed generators can participate in the trade under three modes: peer-to-peer trading mode, consignment sale mode, and sell to the power grid company mode.
- (1)
Peer-to-peer trading mode: enables the distributed PV generators to sign bilateral contracts and trade directly with the end-users on a competitive basis. Before implementing the peer-to-peer trading policy in the No. 1901 policy, the distributed PV generators could only consume the power generation by themselves behind the meter or sell it to the power grid company at a fixed price set by the government. After implementing the peer-to-peer trading policy in the No. 1901 policy, the distributed PV generators are allowed to sell electricity directly to the end-users. The comparisons of the cash flow and power flow between the current non-marketization mode and the peer-to-peer mode are illustrated in
Figure 2. Note that the participants of the peer-to-peer trade need to pay the power grid company a grid fee according to the No. 1901 document.
- (2)
Consignment sale mode: distributed generators sell their electricity to end-users without the need to look for the end-users by themselves. Instead, they consign their power generation to the power grid company, and the power grid company sells the electricity to the end-users on behalf of the distributed PV generators. The prices paid to the PV generators depend on the trading price between the power grid company and the end-users. However, it is unclear how to determine the prices paid by the end-users and the prices paid to the PV generators. This problem is implicitly associated with cross-subsidy issues—an extremely sensitive issue in China’s electricity price—about how to allocate the cross-subsidy in the electricity prices of different end-users. Therefore, this mode is indeed difficult to implement.
- (3)
Sell to the power grid company mode: distributed generators sell their electricity to the power grid company at fixed prices which are set by the government. According to the No. 1901 document, the PV subsidy from the government will be subtracted by partial transmission and distribution price (TDP). Therefore, compared to the current non-marketization mode, the main difference of this mode is that the final subsidy is lower. It can be inferred that few PV generators and the end-users will select this mode.
Based on the above analysis, the peer-to-peer trading mode is the most promising mode among those three modes. Therefore, this paper focuses on the peer-to-peer trading mode in the No. 1901 document, which is also the most recommended trading mode by the central government.
The peer-to-peer mode is supposed to benefit the end-users by bringing cheap electricity directly from the distributed generators, promoting healthy competition among electricity suppliers, and reducing the burden of PV subsidies of the government. In the mass media, the No. 1901 document is widely considered as a major reform to boost distributed renewable energy trading. However, despite the remarkable breaking-through of the trade policy being expected, the policy has not fully taken effect and none of the trading markets are in operation after two years have passed since the announcement of the No. 1901 document. In May 2019, the NDRC and NEA jointly announced 26 pilot projects distributed in ten different provinces in China [
5]. In September 2019, the Jiangsu province announced the detailed trading rules of the distributed generation power, which is the first set of province-level trading rules. However, none of the above pilot projects have traded on the market, and the trade policies or rules have caused great controversy. The difficulties of implementing the trade policy of the distributed generation power are multi-aspect and complicated. In essence, the trade policy of the distributed generation power re-allocates the interests of the distribution generators, the consumers, and the power grid company. What makes matters worse is that several clauses in the No. 1901 document are ambiguous and not clearly explained. For example, the calculation method of the grid fee in the No. 1901 document is ambiguous and controversial, resulting in large differences in its interpretations. Note that the ambiguities in the trade policy are not superficial literal or wordy problems. Indeed, there are several sensitive and complicated issues behind it, such as the government-guided pricing mechanism and cross-subsidy in electricity prices. As a consequence, the trade policy brings great confusion to both the trade participators (including the distributed generators and the end-users) and the trade organizers (the power grid companies and the central/local government) and leaves large room for argument. The ambiguity of the trade policy has brought hardships to the implementation of the trade policy. That is why none of the pilot projects has ever been in operation when two years have passed since the No. 1901 document was announced.
This work at first identifies three vital but not clearly detailed issues in the existing trade policy, especially for the ones that are still ambiguous, left to be decided, or controversial: (1) participation eligibility, (2) the grid fee calculation method, and (3) subsidy rates. Meanwhile, although the potential benefits brought by the trade policy have been widely recognized, there has been limited work to comprehensively analyze the economic value of the distributed photovoltaic (PV) generation under different trading modes. This research takes a comprehensive analysis of the economic impacts on the PV generators, end-users, the power grid company, and the government from the peer-to-peer trade of the distributed PV generation. Moreover, sensitivity analysis on the impacts of the subsidy rates, transmission and distribution prices (TDPs), and end-user regulated prices are conducted. With the available data from an eastern city in China, we carry on an eastern city case study for the economic benefits analysis.
The remainder of this paper is organized as follows:
Section 2 reviews the relevant literature on discussing China’s policies and the economic benefits of the distributed PV generation.
Section 3 identifies three vital but unclear details in the peer-to-peer trading policies and
Section 4 presents the method. In
Section 5, a case study of an eastern city in China is presented and
Section 6 presents the conclusions and policy implications.
3. Unclear Issues in Peer-to-Peer Trading Policy
3.1. Participation Eligibility
According to the No. 1901 document, distributed generators can participate in peer-to-peer trading with eligible end-users who are in the same local distribution network. In the No. 1901 document, the “same local distribution network” is defined as the area with the same one-level-voltage-higher substation. However, it is not easy to understand what “with the same one-level-voltage-higher substation” means, and there is not any authentic interpretation from the government or policymakers so far.
3.2. Grid Fee Calculation
In the peer-to-peer trading mode, distributed generators will be able to sign bilateral contracts on a competitive basis, with eligible end-users who are in the same local distribution network. In this mode, PV generators can compete head-to-head with coal-fired power plants if they are in the same local area. Note that the participants of the peer-to-peer trade need to pay the power grid company a grid fee according to the No. 1901 document.
The grid fee is similar to the transmission network use of system tariff (TNUoS), but it only reflects the costs of the distribution network. The separate distribution fee is a matter of contention, in part because regulators are still grappling with assessing and approving these costs for grid company revenues.
In the No. 1901 document, the grid fee is defined, and the factors which need to be considered for the grid fee calculation are provided. However, the calculation method is still ambiguous. In the No. 1901 document, the calculation method of the grid fee is as follows:
“Equals to the TDP (including the cross-subsidy) of the voltage level at which the end-user is connected minus the TDP of the highest voltage level among the voltage levels which cover the Peer-to-Peer trade of the distributed PV generation”
In China, the regulated electricity price paid by the end-user is composed of the generation price, the transmission and distribution price (TDP), and the government funds, as shown in
Table 1. [
25,
26].
The calculation method of the grid fee in the No. 1901 document is, on purpose or by accident of the policymakers, ambiguous and confusing to some extent. Such ambiguities have brought controversy in the industrial field and have not been responded to by any authorities from the government so far.
Here are the two main different interpretations of the grid fee calculation methods. The No. 1901 document says the grid fee “equals the TDP (including the cross-subsidy) of the voltage level at which the end-user is connected minus the TDP of the highest voltage level among the voltage levels which cover the Peer-to-Peer trade of the distributed PV generation”.
The key problem is that the latter TDP does not contain the “(including the cross-subsidy)”. The unmentioned content can be interpreted as either including or excluding, especially in the Chinese language. Hence, two interpretations of the calculation method of the grid fee coexist now. Moreover, no policies have explained clearly how much the cross-subsidy is in the TDP so far. However, it is widely believed that the cross-subsidy is a substantial part that cannot be neglected in the TDP, and the cross-subsidy issues cannot be neglected when calculating the grid fee.
3.3. Subsidy Rates
In China, new policies related to the PV generation subsidy are often issued, resulting in frequent changes in the subsidy rates. China has provided increasing subsidies for the distributed PV solar systems since 2013. The current subsidy policies for distributed PV are divided into central government subsidy and local government subsidy. The central government subsidy standard was 0.42 Yuan/kWh (tax included), paid through renewable energy development funds, for 20 years [
27], and it is 0.32 Yuan/kWh for the PV generation projects which began in operation after May 1 2018. The local government subsidies are paid by local governments, and rates range from 0.05 to 0.55 Yuan/kWh (USD 0.0077–0.0846/kWh), lasting between 2 and 20 years. However, policies about the PV subsidy come out frequently and the subsidy rates have changed several times in recent months. Some recently announced policies show that the subsidy rates will continue to decrease in future decades, which is sometimes called the “PV subsidy rate downhill plan”, but no policy has confirmed the exact schedule or timeline of this plan. At this point in time, a 10–20% decrease of the PV subsidy is widely implemented. It is predicted by some specialists that the subsidy rates will continue to decrease in the future. The uncertain subsidy rates of PV generation arouse concerns from the PV generators.
4. Method
4.1. Participation Eligibility Illustration
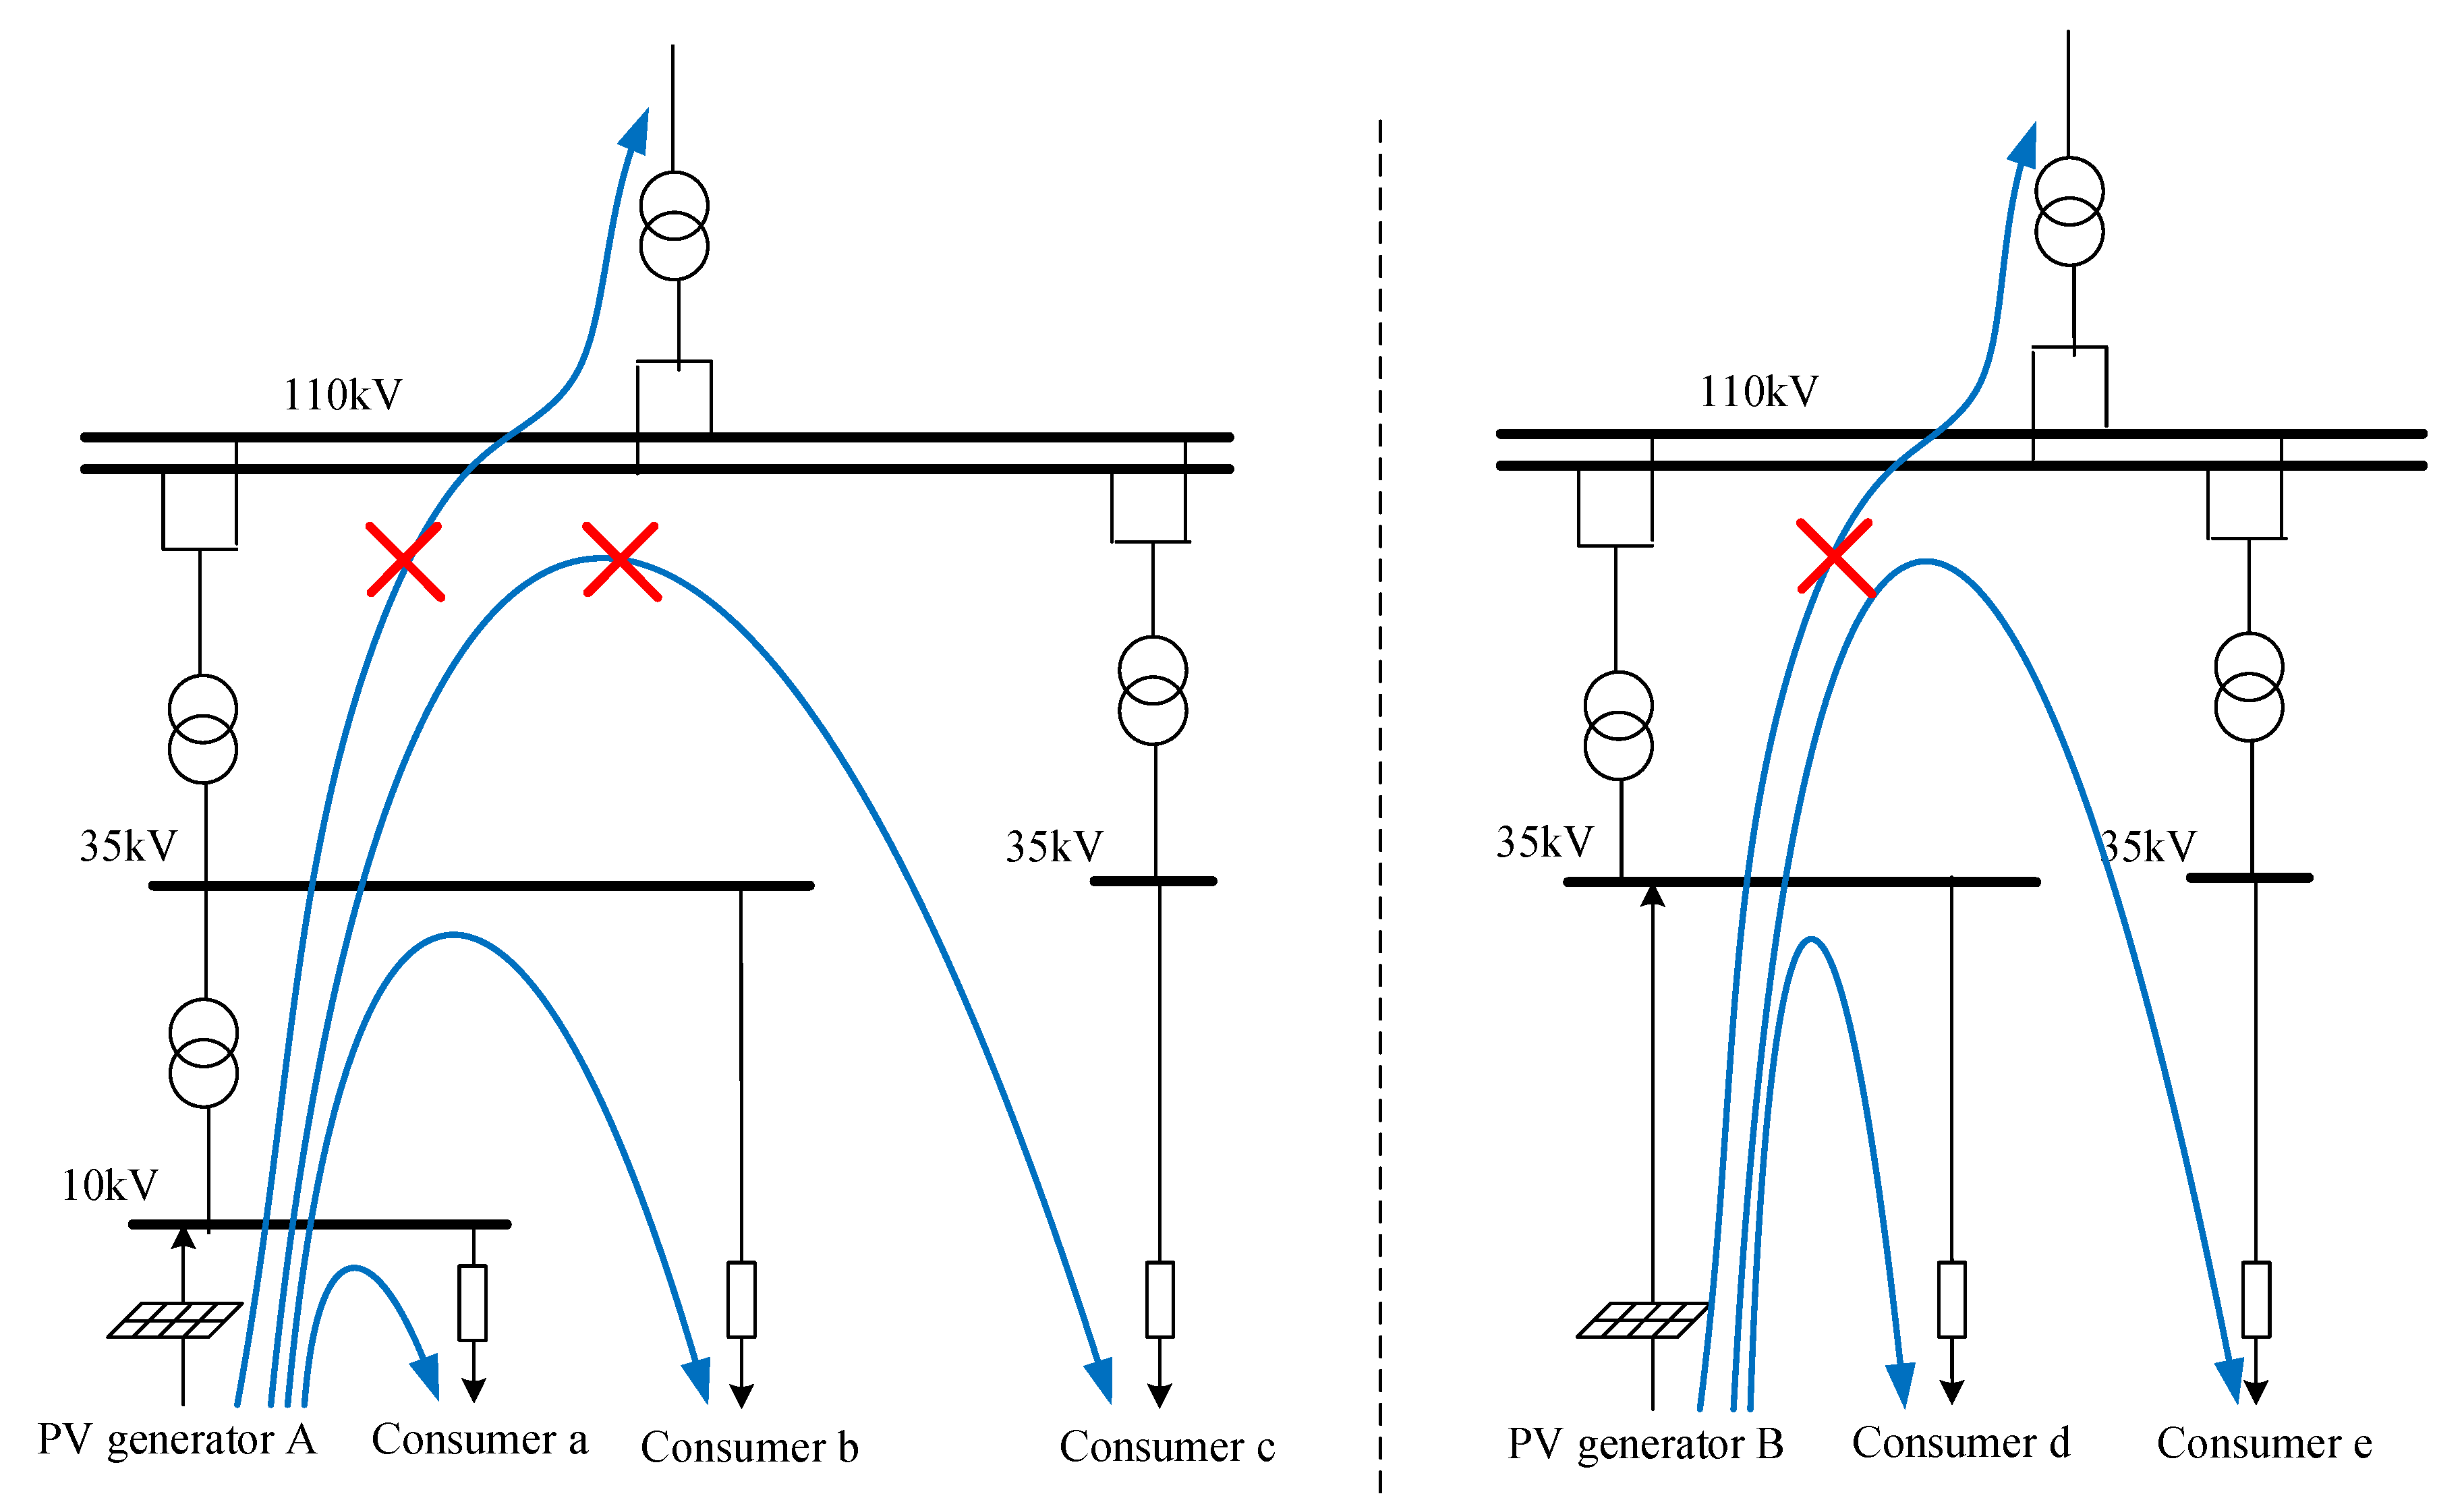
In this part, we interpret in detail the participation eligibility of the PV generators and end-users for the peer-to-peer trading based on our knowledge of China’s electricity power network. In China, most distributed PV generations are connected at 10 kV or 35 kV power grid. For a distributed PV generation connected to a 10 kV power grid, the one-level-voltage-higher substation should usually be the 35 kV substation, and for the one connected to a 35 kV power grid, the one-level-voltage-higher substation should usually be the 110 kV substation. For example, as shown in
Figure 3, the PV generation A connected at 10 kV can trade with consumers a and b, who are connected to the same 35 kV (one-level-voltage-higher) substation, and cannot trade with consumer c who is connected to the same 110 kV (two-level-voltage-higher) substation. Similarly, the PV generation B connected at 35 kV can trade with consumers c and d, who are connected to the same 110 kV substation.
4.2. Grid Fee Calculation Models
In this part, we formulate the two main interpretations of the calculation method of the grid fee into mathematical formulations. The two main interpretations of the calculation method of the grid fee are:
- (1)
Interpretation I: TDP (including the cross-subsidy) of the voltage level at which the end-user is connected—TDP (including the cross-subsidy) of the highest voltage level among the voltage levels which cover the trading process.
- (2)
Interpretation II: TDP (including the cross-subsidy) of the voltage level at which the end-user is connected—TDP of the highest voltage level among the voltage levels which cover the trading process.
The mathematical formulations of the two different interpretations of the grid fee calculation are:
- (1)
Grid fee under Interpretation I.
- (2)
Grid fee under Interpretation II.
Here are three examples to show the differences between Interpretation I and Interpretation II of the calculation methods of the grid fee. The topologies of the PV generation and the end-user are illustrated in
Figure 4.
Example 1:
Interpretation I:
Interpretation II:
Example 2:
Interpretation I:
Interpretation II:
Example 3:
Interpretation I:
Interpretation II:
It can be seen that the grid fee of Interpretation I is lower than for Interpretation II under all conditions. It is inferred by the authors that either of the interpretation could apply in practice, and which interpretation is applied in each region will probably be determined by the local government. When the distributed PV generation is supposed to be given higher priority in the local development plan, Interpretation I is more likely to be implemented to increase the revenue of the PV generators and consumers.
4.3. Subsidy Rate Models
The subsidy of the PV generation includes two parts: subsidy from the central government and subsidy from the local government. According to peer-to-peer trading rules, the per-kWh subsidies from the central government would be reduced from basis levels by 10 to 20 percent. Moreover, some recently announced policies show that the subsidy rates will continue to decrease in future decades, which is sometimes called the “PV subsidy rate downhill plan”, but no policy has confirmed the exact schedule or timeline of this plan. In this paper, we introduce a variable (
) to consider the impacts of the “PV subsidy rate downhill plan”.
4.4. Trading Models
Here are the trading models of non-marketization trading mode and peer-to-peer trading mode. To include the difference between different interpretations of the grid fee, three detailed models are built, e.g., Model A, B and C. The nomenclature is given in
Table 2.
The equations from (4) to (15) illustrate the revenue of the PV generator, the cost of the end-user, the revenue of the power grid company, and the cost of the government (including the central and local government) of the models from Model A to Model C.
Model A:
The revenue of the PV generators (
) is the summed products of the power generated by the PV generator (
) and the revenue per MWh. In Model A, the revenue per MWh is the peer-to-peer trading price (
) plus the subsidies from both the central and local governments, and minus the grid fee charged by the power grid company (
). The superscript (1) illustrates that the knockdown trading price and the grid fee are the ones under Interpretation I of the grid fee.
The cost for the end-users is the summed products of the power consumed by the end-user (
) and the cost per MWh. In Model A, the cost per MWh is the trading price under Interpretation I (
) plus the government funding (
). The government funding in China is a tiny fee charged by the government for some special utility construction, e.g., Three Gorges hydroelectric power station. Government funding slightly differs for different end-users.
The revenue of the power grid company (
) is the summed products of the power generated by the PV generator (
) and the cost per MWh. In model A, the price per MWh is the grid fee under Interpretation I (
) plus the government funding.
The cost for the government is the summed products of the power generated by the PV generator (
) and the subsidy per MWh, and the latter includes subsidies from the central government (
) and the local government (
). Considering the “PV subsidy rate downhill plan” in the central government, the
is introduced.
Model B:
Similar to Model A, Model B is the revenues or costs under the peer-to-peer trading mode. The unique difference is that the grid fee is under Interpretation II, thus the trading prices are also the knockdown prices under Interpretation II of the grid fee. Therefore,
and
are with the superscript (2).
Model C:
Model C is the current mode (non-marketization trading mode). PV generators sell the power generation to the power grid company at the regulated prices of the PV generations, also known as the “PV generation regulated price”. The revenue is the summed products of the power generation and the revenue per MWh, and the latter one is the “PV generation regulated price” plus the subsidies from the local and central governments.
The cost for the end-users is the summed products of the power consumed and the “end-user regulated price”.
The revenue of the power grid is the summed products of the power traded and the revenue per MWh, and the latter is the “end-user regulated price” minus the “PV generation regulated price”
As to the cost for the government, the cost is the summed products of the power traded and the PV subsidy cost per MWh.
5. Results
5.1. Data
We select four peers of the distributed PV generators and the end-users in an eastern city of China to study their economic benefits.
Basic information about the PV generators and the end-users. The basic information of the four trading peers is shown in
Figure 5. To study the annual average economic benefits of the studied system, we develop the “PV generation curves” for each PV generator, as shown in
Appendix A Figure A1a. The “PV generation curves” are developed based on the typical daily generation curves and the annual generation power from the realized data of each PV generator. The typical power curves of each end-user are shown in
Appendix A Figure A1b.
Regulated prices. The regulated prices are set by the provincial National Development and Reform Commission. In this case, the “PV generation regulated price” is 0.3844 Yuan/kWh, and the “end-user regulated prices” are shown in
Appendix A Table A1. All the prices are from Anhui Province in China [
28].
Transmission and Distribution Price (TDP). The TDP is set by the provincial National Development and Reform Commission. In this case, the TDP in Anhui Province is applied, as shown by
Appendix A Table A2 [
28]. Meanwhile, considering that the percentage of the cross-subsidy in the grid fee or the TDP is not public and it is very hard to calculate it clearly, we assume that 50% of the grid fee is the cross-subsidy in this case.
Trading price. The average trading prices of the four peers in each model are given in
Appendix A Table A4. For Model C, the numbers in
Appendix A Table A4 are the averaged results, which are calculated based on the government-guided regulated prices and the power curves of each PV generation. For Models A and B, the numbers in
Appendix A Table A4 are estimated trading prices, and the possible minimum and maximum boundaries of the trading prices are also estimated. We use the estimation trading prices rather than the realized ones because the new policy has not been implemented and the realized trading prices are lacking. Note that the middle trading prices in Model A and B highly depend on the competition intensity of the given market.
Subsidy rate. In this case, all the studied PV generation projects went into operation after May 1 2018, thus the 100% subsidy from the central government is 0.32 Yuan/kWh. Apart from the subsidy from the central government, the local government of the studied eastern city is 0.25 Yuan/kWh, which is also considered in this paper and is set to the same value in all the cases.
5.2. Results
Table 3 provides the detailed information of the trading models considered in the case study. The average daily costs (for the end-users and the government) or the revenues (for the PV generators and the power grid company) are shown in
Figure 6 and
Table 4. Note that the trading prices under the peer-to-peer trading policy are determined through bilateral negotiation. Therefore, the minimum and maximum estimation of the cost and revenues are presented by the error bars in
Figure 6 based on the boundaries of the trading prices in
Table A4. In
Table 4, the results in the current mode (Model C) are set as the reference case.
The detailed meanings of the revenues or costs for each stakeholder are explained as follows.
For the end-users: cost refers to the electricity billing cost of the end-users.
For the government: cost refers to the subsidy cost of the government.
For the PV generators: revenue refers to the revenue from selling electricity from the PV generators.
For the power grid company: revenue refers to the revenue from the grid fee or the difference between buy-in and sell-out electricity.
The results show that the peer-to-peer trading policy benefits the PV generators with more revenues by 6–11% (covering only the mid. estimation, uncovering min. and max. estimation, similarly hereinafter), reduces the cost for end-users by 6–12%, and decreases the revenue of the power grid company by 32–55%. For the government, the subsidy cost is reduced by 6% under the peer-to-peer trading policy. Based on the results, it can be predicted that PV generators and the end-users will therefore actively participate in the peer-to-peer trade mode, which probably highly stimulates the power market’s vitality. However, the power grid company will probably dislike this trading mode and might slow down or even hinder the implementation of the peer-to-peer trading policy.
The grid fees for each trading peer are presented in
Table 5, calculated according to the electric topology. When focusing on the impacts of the grid fee interpretations, it can be seen that the grid fees under Interpretation II are on average higher than the ones under Interpretation I by 66%, as shown in
Table 5. Furthermore, having fewer grid fees leads to higher economic benefits. The results show that under Interpretation I, the PV generators on average make more revenue by 5% and the end-users on average save more in electricity cost by 6% compared to those under Interpretation II. Moreover, trading paths also have impacts on the grid fee and economic benefits. Among the four given trading peers, peer 1 has the shortest trading path, which is from one “10 kV point” to a neighboring “10 kV point”. Thus, peer 1 has the smallest grid fee, and the PV generator makes more revenue by 8% while the end-user spends less by 11% compared to other trading peers in the peer-to-peer trading mode, as shown in
Figure 7.
5.3. Sensitivity Analysis: Subsidy Rates
The results for the different subsidy rates are shown in
Figure 8. Note that we set the current non-marketization mode (Model C) as the reference. For the sake of similarity, we focus on the impacts on the peer-to-peer mode (Models A and B).
The results show that as the subsidy rate decreases, the PV generators’ revenues decrease and the end-users’ costs increase as expected. Such results indicate that the PV generators and the end-users will have less negotiation room along with the subsidy rates decrease. Moreover, it can be seen that the PV generators can make no fewer revenues than the current non-marketization mode (Model C) until the subsidy rate decreases to the 20% in Model A, and this number is about 50% for Model B. For the end-users, they can pay no more cost than the current non-marketization mode until the subsidy rate decreases to 20% in Model A, and this number is about 60% for Model B. For the power grid company, its revenue comes from the grid fee in Model A and B, thus it is not impacted by subsidy rates decrease. For the government (including the central and local governments), the financial burdens linearly decrease along with the subsidy rates’ decrease.
5.4. Sensitivity Analysis: TDPs
In the sensitivity analysis, the TDPs in Anhui Province and Guangdong Province are applied, as shown by
Appendix A Table A2 and
Table A3, and we name them as “high TDPs” and “low TDPs”, respectively.
Figure 9 summarizes the differences in the costs or revenues between high and low TDPs. The bars are the costs or revenues with low TDPs over the ones with high TDPs.
The results show that the revenues of the power grid company are highly affected by the TDPs in peer-to-peer trading modes, which is consistent with common sense. Compared to high TDPs, the revenues of the power grid company will decrease by nearly 74% in Model A and decrease by 50% in Model B in low TDPs. For the PV generators and the end-users, the economic changes affected by the TDPs are small, and they can share the impacts through the bilateral negotiation mechanism. In Model C, TDPs do not affect the PV generators’ and the power grid company’s revenues because the TDPs are not in use under the current non-marketization mechanism.
5.5. Sensitivity Analysis: End-User Regulated Prices
The results with different “end-user regulated prices” are shown in
Figure 10. The “end-user regulated prices” are the terminal selling prices to the end-users. The results in
Figure 10a show that the cost for end-users decreases as the “end-user regulated prices” decrease. The results in
Figure 10b show that the decrease in cost for the end-users will lead to a decrease in the PV generators’ revenues through a bilateral negotiation mechanism.
Figure 10c shows that as “end-user regulated prices” decrease, the revenues of the power grid company decrease in Model C, and stay the same in Model A and Model B. The reason is that in the non-marketization mechanisms (Model C), the power grid company buys and sells electricity at the government-guided prices. Unless the buying price decreases at the same time, the decreases in selling price are undertaken only by the power grid company. For the government, the subsidy cost is not impacted by the changes of the “end-user regulated prices”, as shown by
Figure 10d.
6. Conclusions and Policy Implications
In October 2017, China’s government launched a policy to permit the distributed generators to trade their electricity generation on the market, which is expected as a remarkable breakthrough for the reformulation of the electricity market in China.
The general conclusions in this paper are summarized as follows.
- i.
The peer-to-peer trading policy will benefit the PV generators and the end-users, and decrease the revenues of the power grid company, which is consistent with the conclusions in [
12]. The results show that the Peer-to-Peer trading policy benefits the PV generators with more revenues by 6–11% (covering only the mid. estimation, uncovering min. and max. estimation, similarly hereinafter), saves the cost of end-users by 6–12%, and decreases the revenue of the power grid company by 32–55%. For the government, the subsidy cost is reduced by 6% under the peer-to-peer trading policy.
- ii.
Regarding the different interpretations of the grid fee calculation, Interpretation I helps the PV generators to make more revenue by 5% on average and the end-users to save more in electricity costs by 6% than in Interpretation II.
- iii.
The sensitivity analysis shows that under the different subsidy rates, PV generators can get no fewer benefits than the current mode until the subsidy rate decreases to 20–50%, and the numbers for the end-users are 20–60%, which both depend on the specific trading modes and other influencing factors. TDPs mainly affect the revenues of the power grid company and have higher affection in Model A than in Model B.
- iv.
Regarding the different “end-user regulated prices”, the decrease of the “end-user regulated prices” will decrease the end-users’ costs in all trading modes, decrease the PV generations’ revenue only in market-oriented trading modes, and decrease the power grid company’s revenue only in non-market trading modes.
Moreover, concerning the slow progress of the policy implementation, we further look into the underlying problems of the trade policy. The main policy implications are as follows.
- i.
The trade policy and its implementation plans need to be clarified and executable. The current trade policy is ambiguous in several details, especially regarding how to calculate the grid fee. The ambiguities in the policy details bring different interpretations of the policy itself, and further differentiate the benefit estimation of the stakeholders. Consequently, the PV generators and end-users are hesitant to participate in the trading, and the organizers (especially for the local government and grid power company) are confused about how to implement the trade policy. Such ambiguities have brought controversy in the industrial field and have not been responded to by any authorities from the government so far. In this paper, we identify two main interpretations of the grid fee calculation (in
Section 3.2) and compare them numerically in the case study. The results show that the differences are considerable. The grid fees under Interpretation II are on average higher than the ones under Interpretation I by 66%, and PV generators on average make more revenue by 5% and the end-users on average save more in electricity costs by 6% compared to those under Interpretation II. In this regard, the policymakers should give an explicit description and mathematical formulation for calculating the grid fee.
- ii.
The calculation method of the grid fee and cross-subsidy need to be systematically studied. The current calculation method for the grid fee in the No. 1901 document only considers the voltage level of the integration point, while the distance or the power flow issues are neglected, which is a simple and rough definition. Moreover, the calculation of the grid fee is highly related to the calculation of the cross-subsidy, while the latter is a profoundly sensitive and complicated issue in China. Considering the complexity of the grid fee and cross-subsidy issues, we recommend that policymakers make a step-by-step schedule to improve the calculation method. For example, the first step might be to develop several candidate methods for calculating the grid fee and the cross-subsidy. Then, those methods can be tested in parallel in the pilot projects. After that, it could be feasible to run a systematic study of the calculation method and announce the final policy in the end.
- iii.
Long-term, deterministic, and sustainable subsidy policy is needed. The subsidy policy for the distributed PV generator is continuously changing in China, which brings significant uncertainty to PV development. For example, China’s state council issued the No. 24 document on July 4 2013, saying that “The subsidy rate of feed-in tariffs is in principle implemented for 20 years” [
29]. The subsidy rate has been set as 0.42 Yuan/kWh since 2013 but was reduced to 0.37 Yuan/kWh in 2017, then was reduced to 0.32 Yuan/kWh in 2018, and was further reduced to 0.1 Yuan/kWh. As a result, some PV generators claimed that they were cheated, and have great hesitation and worries during PV plant investments, trade market participation, and contract negotiations. The results of this paper show that the participants might quit the trade market when the subsidy rate decreases to 20–60% depending on different trading modes. Therefore, it is highly recommended for the policymakers to make a long-term and deterministic subsidy policy, and at least clarify the years in the use of the announced policy, which will be helpful to alleviate the hesitation and worries of the participators.
In summary, the trade policy of the distributed PV generation does and will play a significant role in the healthy development of the electricity market and the PV industry in China. However, due to the ambiguity of the trade policy and several underlying issues, e.g., grid fee, cross-subsidy, PV subsidy rate, and interest re-allocation, the transition from a regulated electricity market to a deregulated market for distributed PV generations is probably a slow and unlikely development.


