Article

Rice-Straw-Based Heat Generation System Compared to Open-Field Burning and Soil Incorporation of Rice Straw: An Assessment of Energy, GHG Emissions, and Economic Impacts

by
Maria Victoria P. Migo-Sumagang
1,2,*,
Monet Concepcion Maguyon-Detras
2,
Martin Gummert
1,
Catalino G. Alfafara
2,
Myra G. Borines
2,
Jewel A. Capunitan
2 and
Nguyen Van Hung
1,*
1
International Rice Research Institute, DAPO Box 7777, Metro Manila, Manila 1301, Philippines
2
Department of Chemical Engineering, College of Engineering and Agro-Industrial Technology, University of the Philippines Los Baños, College, Los Baños, Laguna 4031, Philippines
*
Authors to whom correspondence should be addressed.
Sustainability 2020, 12(13), 5327; https://doi.org/10.3390/su12135327
Submission received: 1 June 2020 / Revised: 22 June 2020 / Accepted: 24 June 2020 / Published: 1 July 2020
(This article belongs to the Section Sustainable Agriculture)

Abstract

:
Rice is a staple food crop, and its production generates large volumes of agricultural waste, rice straw. Several studies have proven that open-field burning and soil incorporation are unsustainable practices of managing rice straw, but remain as prevalent methods of treating and disposing of rice straw. An alternative solution is to harness the energy from rice straw via a small-scale heat conversion system for paddy drying applications, which can reduce rice grain post-processing costs and improve paddy storage conditions. This study investigated the energy flow, Greenhouse Gas (GHG) emissions, and cost of a small-scale rice-straw-based heat generation (RBHG) system using a downdraft furnace and a dryer simulator setup. The highest input energy and GHG emissions of 92% and 68%, respectively, were from the heat generation stage. The RBHG energy ratio was between 1.4 and 1.7, and the percent net energy was between 39 and 67%. The best case of RBHG offers a possibility of a net GHG avoided (−61 kg CO2-eq Mg−1), while the worst case (856 kg CO2-eq Mg−1) has a net GHG emission comparable with soil incorporation. The average total cost of RBHG is 0.096 USD kWh−1. Overall, RBHG technology has the potential to improve energy flow, GHG emissions, and the cost of rice production systems.

1. Introduction

Rice is one of the most staple foods in the world, providing the calorie requirement of many countries. As one of the leading food crops, its production reached up to 780 million Mg globally in 2018, covering 167 hectares of land [1]. The leading producers are Asian countries, with China, India, and Indonesia in the top three [1]. The Philippines, like its neighboring countries, primarily depends on rice as its main food source, with 80% of the population relying on rice for 40–65% of their calorie requirement [2].
The steady increase in the cultivation of rice for food rice production has given rise to the problem of rice straw waste management. About 1 to 1.5 megagrams of rice straw are produced for every megagram of paddy [2,3,4]. In many rice-growing countries, the most common rice straw waste management method is open-field burning [5,6,7,8,9,10,11]. In the Philippines, farmers turn to open-field burning to drive away pests and to avoid the labor-intensive, manual gathering of rice straw [2,7]. In 2009, 95% of the total surplus of 10,150 Mg rice straw in the country was managed or disposed of by open-field burning [12]. Though the burning of biomass may be considered a carbon-neutral activity, it also causes the emission of toxic greenhouse gases CH4 and N2O [7,12]. Open-field burning also results in up to 100% nitrogen (N) loss, 25% phosphorous (P) loss, 20% potassium (K) loss, and 5–60% sulfur loss [7].
A common alternative to open-field burning is soil incorporation, or leaving the straw on the field to decompose [5,13]. The benefits of soil incorporation include a complete carbon turnover, improved soil aeration, re-oxidation of iron and other reduced substances (which accumulate during flooding), reduced weed growth, and reduced irrigation requirement [14]. However, these benefits may be offset by the disadvantages of soil incorporation, which include the risk of decreased grain yield, acetic acid formation, decrease in available nitrogen, and insufficient turnaround time for intensive cropping systems [14,15]. Moreover, soil incorporation leads to a higher global warming potential (GWP) at 8023 kg CO2-eq per ha, higher than open-field burning, which is at 4913 kg CO2-eq per ha [7]. Yield-scaled GWP measurements for complete soil incorporation, partial straw removal, complete straw removal, and complete straw burning scenarios were found to be 881, 477, 174, 453 kg CO2--eq per Mg straw, respectively [7]. In other studies, open-field burning was evaluated to cause 1460 kg CO2--eq per Mg straw [6], and soil incorporation results to 1025 kg CO2--eq per Mg straw [13]. These numbers highlight the comparative advantage of complete straw removal (over other scenarios mentioned), as it had the lowest GWP. After complete removal from the field, rice straw can be further processed under several alternatives.

1.1. Complete Straw Removal and the Paddy Flatbed Dryer (PFBD)

Complete straw removal from the field provides the opportunity for other off-field uses of rice straw. The other off-field rice straw management options are divided into energy solutions (direct combustion, bioethanol, and anaerobic digestion) and non-energy solutions (substrate for mushroom production, animal bedding, and fodder, biochar, and fertilizer) [3,5,6]. Among the different off-field solutions, rice-straw-based heat generation using direct combustion furnaces is one of the simplest. The heat generated may be used to dry rice paddy in a paddy dryer. There are different types of paddy dryers, but a paddy flatbed dryer (PFBD) composed of a drying bin, blower, and furnace is preferable due to its simplicity and low cost [16]. In a PFBD, hot air mixture from the furnace is directed by the blower to the grain bed, increasing the drying bin temperature to 43–45 °C. The drying time is around 4–10 h depending on the temperature and initial moisture content, the common capacity is 4–6 tons paddy per batch, while the working hours may be 16 to 20 h per day in a 40-day harvest season [16]. The motor may be diesel- or electric-powered, with a horsepower rating of 7–12 HP [16].
Currently, PFBD furnaces use kerosene or rice husk as fuel. Kerosene is a nonrenewable resource from petroleum, while rice husk is a renewable resource from rice production. Compared to rice straw, rice husk is lesser in supply but higher in demand. An existing small-scale downdraft furnace (dRF) using direct combustion technology at the International Rice Research Institute (IRRI) uses rice husk as fuel, with drying air efficiencies reaching about 80% maximum. In a related study, the IRRI dRF was retrofitted to use rice straw instead of rice husk. The optimum operating conditions for this dryer (retrofitted for rice straw feed) have recently been determined. The drying air efficiencies at the optimum conditions were between 86.1 and 88.78% [17].
To have a more meaningful comparison of the different alternatives for rice straw waste management concerning energy and sustainability, various studies have performed life cycle assessment (LCA).

1.2. Life Cycle Assessment in Rice Production

In rice production, the steps in the supply chain are rice cultivation, harvesting, collection, transportation, storage, and utilization of rice straw [8]. In assessing the life cycle of biofuels, the complete cycle from raw material production, processing transportation, manufacturing, storage, distribution, and utilization should be considered as each step may have a negative or positive impact on the environment, economy, or social aspects [18]. Despite the “cradle-to-grave” principle of life cycle assessment, for bioenergy studies, an arbitrary system boundary may be defined as many processes are excluded for different reasons [18]. Instead of the “cradle-to-grave,” the “cradle-to-gate” approach is sufficient for comparing different biofuel production processes [18].

1.3. Rationale of the Study

Using rice straw as fuel in paddy drying will help in averting open-field burning, as well as support the rising energy demand. At 100% collection, the renewable energy potential from rice straw can reach up to 141,800 GJ in the Philippines [12]. Studies on rice-straw-based power generation in Malaysia, Thailand, India, and Egypt show reduced Greenhouse gas (GHG) emissions and other environmental benefits [6,9,11,13,19]. Input–output energy analysis in Iran and China reports an energy ratio between 1.39 and 9.94 with both paddy and straw values in the output energies [20,21]. For small communities, a small-scale rice-straw-based heat generation system with an energy output between 100 and 300 MJ h−1 may be advantageous since it requires lower capital and transportation costs. A process bottleneck is found in the rice straw collection step, which is known to be labor-intensive if done manually. The other option, mechanical collection, requires high capital costs due to the use of a baler. Thus, an alternative to offer baling as a service to generate profit may improve the costs.
This study was conducted to assess the energy flow as well as the net GHG emissions of a small-scale rice-straw-based heat generation (RBHG) system for paddy drying. The cost per heat output using the IRRI downdraft furnace (dRF) was also evaluated. The results of this research aim to help in the decision and policymaking on the sustainability of rice straw waste management systems.

2. Materials and Methods

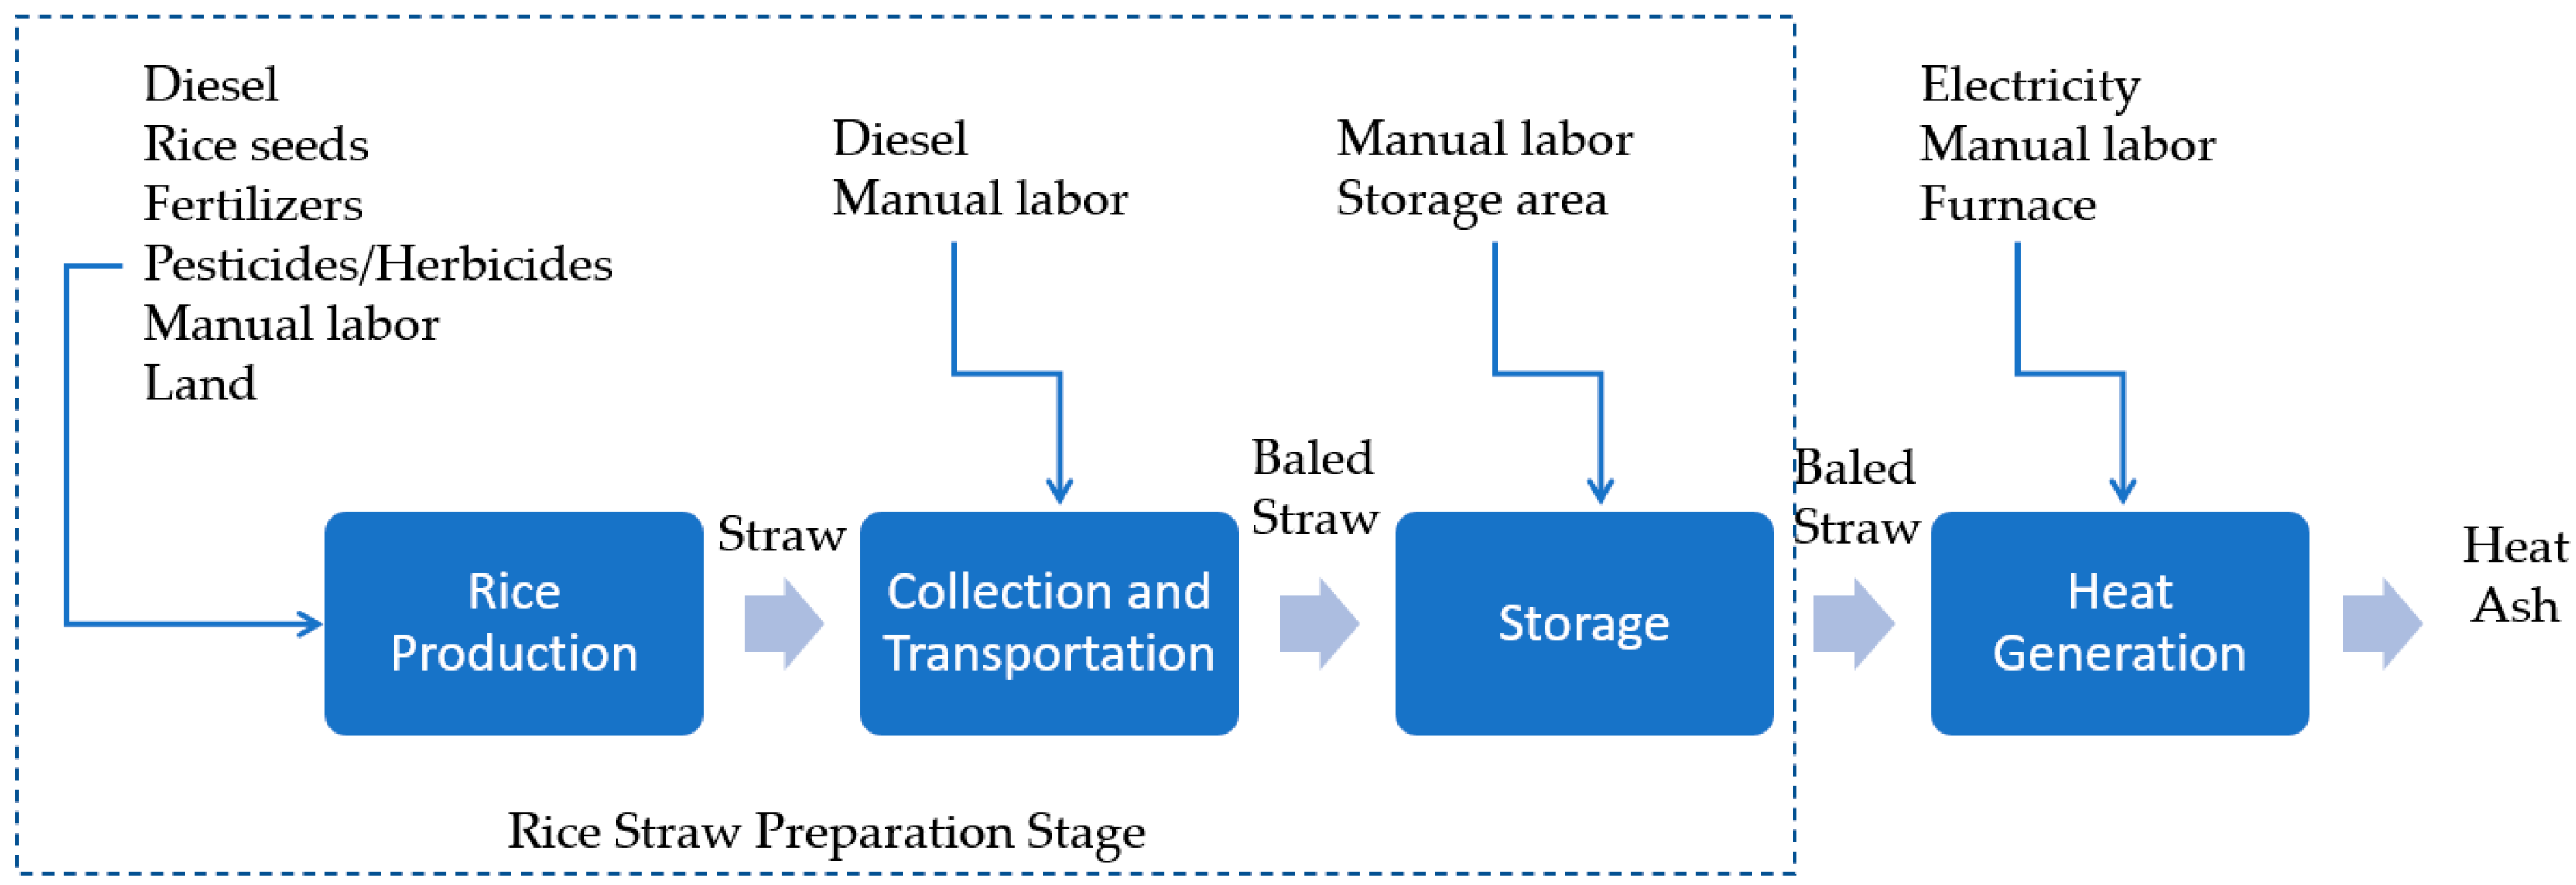
2.1. Research Study Area and System Boundaries

The research was conducted at the International Rice Research Institute (IRRI), and the data used was from the IRRI and Philippine farmer fields.
The system boundaries for both energy balance and GHG emissions are shown in Figure 1 for rice-straw-based heat generation (RBHG). There are four (4) stages: rice production at IRRI and Philippine farmer fields during the dry season, baled straw collection and transportation to a storage area 4 km away, rice straw storage in a roofed facility, and rice-straw-based heat generation using the downdraft furnace (dRF) with electric motor and blower. The three (3) initial stages can be grouped as the rice straw preparation stage. In each step, the inputs and outputs are listed; for example, in rice production, diesel consumption in agricultural equipment, rice seeds, fertilizers, pesticides/herbicides, manual labor, and land use are all inputs, while the outputs are rice straw (on the field), and rice paddy. The rice straw output from rice production is considered as input in the next stage, the rice straw collection and transportation stage. The functional unit for the energy flow and GHG emission balance is 1 Mg rice straw as fuel. The functional unit for the cost evaluation is 1 kWh of heat output as a product.

2.2. Data Collection

2.2.1. Assessment of the Structures

The construction of the storage center and downdraft furnace (dRF), which are referred to in this study as structures, were assessed through interviews with a civil engineer and furnace fabricator. The storage center was a roofed facility with a 200 sq. meter floor area, 3 m high, and open sides. The bill of quantities (BOQ), electricity consumption, and manual labor during construction of the two structures are listed in Table 1. The dRF included the electric motor and blower.

2.2.2. Rice Straw Preparation

Data on rice production, collection, and transportation are found in Table 2 [7,8,22]. During rice production, the diesel consumption of machinery from the references included the rotovator, tiller, spreader, thresher, and combine harvester. Some references also included manual labor from a draught animal. Rice paddy yield (varieties: NSIC Rc222, Rc18–38%, Rc222–33%, IR74–6%, NSIC Rc18) was at an average of 4.8 Mg ha−1 with a range of 3.31–6.70 Mg ha−1; while rice straw yield was at an average of 2.69 Mg ha−1 with a range of 2.23–3.39 Mg ha−1 [7,22,23].
The data for mechanical collection and transportation to a storage area (4 km away from the collection area) were also based on reference studies shown in Table 2. Diesel consumption during this stage included machinery, tractor, and trailer. The manual labor during this stage included rice straw handling and driving of the machinery. On the other hand, the manual labor capacity during rice straw storage was determined by measuring the weight of rice straw handled during storage per unit time (in three replicates).

2.3. RBHG Experiments

The rice straw samples used for heat generation in the dRF were collected from the rice production (variety NSIC Rc 238) during the dry seasons of 2017 and 2018 at IRRI, which used an alternate wetting and drying water management and a cropping duration of 110 days. A square baler (CLAAS Markant 55, 45 HP) attached to a tractor (MF399, 5.8 L, 6-cylinder diesel engine) was used for baled straw collection. The moisture contents of the sun-dried rice straw samples were measured using ASAE Standard S358.2 (DEC93) Moisture Measurement for Forages Method, which ranged from 8.89 to 10.48%.
The combustion setup was based on initial experiments conducted at IRRI on the dRF using rice straw as fuel [17]. The dRF was attached to a pre-calibrated dryer simulator (7.82 m long and 0.7 m in diameter) where temperature and percent relative humidity measurements were made. The blower connected to an electric motor (TECO 3-Phase Induction Motor Type AEEF-F-YC4, 1750 RPM, 10 HP) was controlled via an automatic controller (Schneider Electric variable speed drive ATV312HD11M3 3-phase supply) attached to a power monitor (Efergy Electricity Monitoring Transmitter). The drying airflow rate was set by adjusting the cone in the dryer simulator, as well as setting the frequency of the automatic controller. Two kg of rice straw were loaded initially into the primary combustion chamber via the feed hopper. A blowtorch was used to ignite the first rice straw via the bottom ash exit, and the rice straw feed rate was manually set by weight over time measurements.
Two scenarios of optimized conditions of rice straw feed rate (SFR) and drying air flow rate (DAF) were tested based on a previous study [17]. Based on the study, Scenario 1 (using SFR: 28.06 kg h−1, DAF: 4 m3 s−1) resulted in a dRF heat output, CO, and NOX emissions of 332.48 MJ h−1, 89.9 ppm, and 3.17 ppm, respectively. Scenario 2 (using SFR: 20.67 kg h−1, DAF: 3.03 m 3 s−1) resulted in a dRF heat output, CO, and NOX emissions of 231.47 MJ h−1, 76.57 ppm, and 2.93 ppm, respectively. The electricity consumption of the blower in kW was monitored every 5 min through the power monitor. The bottom ash was collected and weighed after every run. The dRF operation labor capacity was determined by measuring the weight of rice straw and manual labor time in three replicates.

2.4. Methodology and Software Used for Calculation and Simulation

Rice production was allocated between the two products in terms of economic value [19] to remove the influence of rice paddy in the output. The allocation was only applied in the rice production stage since rice straw was the sole product in the next stages (rice straw collection and transportation). Equations (1) and (2) were used in the economic allocation [8,24,25].
% Allocation of rice straw = 100 ∗ Yrs ∗ Prs/(Ypd ∗ Ppd + Yrs ∗ Prs)
% Allocation of paddy = 100 − Allocation of rice straw
where Yrs is the yield of rice straw, Prs is the price of rice straw based on calculations in this study, Ypd is the yield of paddy, and Ppd is the price of paddy at 430 USD Mg−1 [26] based on an exchange rate of 1 USD = 52.10 PHP [27]. The total rice production input in Table 3 was multiplied with the percent allocation for rice straw in both energy and GHG emissions.
The energy conversion for manual labor was based on the metabolic equivalent of task (MET) or the ratio of human metabolic rate when performing a task to the metabolic rate during rest [23]. Manual handling of rice straw with an energy output of 0.89 MJ h−1 [8,23] was assumed for rice straw storage and dRF operation.
The method Cumulative Energy Demand version 1.10 was used for the conversion of the agronomic inputs to energy, through the SimaPro software, version 8.0.5.13 [28]. The software automatically multiplies all the agronomic inputs by their corresponding energy equivalents in Table 4. The calculated energies during rice production, rice straw collection, and transportation using secondary data are found in Table 3.
For the GHG emissions balance, the method IPCC 2013 GWP 100a version 1.03 [28] was used for the conversion of the agronomic inputs to kg CO2-eq based on their GHG emission factors in Table 4. Direct soil emissions during rice production were accounted for, based on the yield-scaled GWP of partial and complete straw removal of 477 and 174 kg CO2-eq Mg−1 straw, respectively [7]. The direct soil emissions measured the GWP of CH4 and N2O of different rice straw management practices; in this case, the scenarios’ partial or complete straw removal are both applicable since rice straw was collected and used for RBHG. The calculated GHG emissions for rice production (without allocation), rice straw collection, and transportation using secondary data are found in Table 3.
To evaluate the energy depreciation of the structures (storage center and dRF), the embodied energy or energy expended by all the processes related with construction (including mining and processing of natural resources) [38] was calculated based on the BOQ and the energy equivalents in Table 2 and Table 3. The structure of energy depreciation was calculated using Equation (3), and Equation (4) was used to calculate for the structure GHG emissions per Mg rice straw.
Structure energy depreciation (MJ Mg−1) = Embodied energy/(Qy ∗ LS)
Structure GHG emissions (kg CO2-eq Mg−1) = Embodied GHG emissions/(Qy ∗ LS)
where the structure energy depreciation is in MJ Mg−1 straw, the embodied energy is in MJ; Qy is the annual capacity of the structure in Mg yr−1, and LS is the life span of the storage center or dRF in years. Table 5 includes the data on the annual capacity and lifespan of the storage center and dRF. Likewise, the GHG emissions per Mg rice straw of the structures were evaluated by getting the embodied GHG emissions using the BOQ and emission factors in Table 2 and Table 3.
CH4 and N2O emissions during the combustion of rice straw in the furnace were considered using the emission factors 0.70–9.6 g kg−1 dry straw for CH4 and 0.033–0.264 g kg−1 dry straw for N2O for dry straw, based on 10–15% moisture content [7,40,41,42]. The GWP of the two gases were 30.5 and 265 kg CO2-eq kg−1 for CH4 and N2O, respectively [29].
In terms of outputs, the contributions of the rice paddy were excluded since economic allocation was done. Thus, only two products (heat and ash) were considered. The dRF heat output was based on the study of Migo-Sumagang et al. [17]. The avoidance of kerosene combustion was accounted for in the GHG avoided. The kerosene combustion emission factor used was 71 kg CO2 GJ−1 [36,37].
In rice straw combustion, the bottom product composed of ash and unburnt combustibles is considered as a byproduct with applications in concrete aggregate replacement. Concrete, which is a mixture of Portland cement, coarse and fine aggregates, and water, depends on aggregates for 65% of its composition [43]. Many studies have shown that substituting the fine aggregates in concrete (commonly sand) with coal or municipal solid waste incinerator bottom or fly ash have exhibited higher compressive strength, expansion control, and slowing down of water penetration [43,44,45,46]. These ashes are rich in silica, which is also found abundantly in rice straw ash [47,48]. For both energy and GHG emissions, the weight of the ash byproduct was accounted as a concrete aggregate replacement using the equivalent factors for sand manufacturing and transportation [29] in Table 4.
Energy analysis was done by calculating the net energy (MJ Mg−1), energy ratio, and percent net energy using Equations (5)–(7), based on the total energy input and output [8,21,49]. The net energy in GJ ha−1 in Equation (8) was calculated for comparison with other studies. The net GHG emissions (kg CO2-eq Mg−1) was calculated using Equation (9), and Equation (10) was used in converting the net GHG emissions in terms of kWh, where SFR is in kg h−1, dRF heat output is in MJ h−1, and 1000 and 3.6 are conversion factors.
Net energy (MJ Mg−1) = Energy output (MJ Mg−1) − Energy input (MJ Mg−1)
Energy ratio = Energy output (MJ Mg−1)/Energy input (MJ Mg−1)
% Net energy = Net energy (MJ Mg−1/Energy input (MJ Mg−1) ∗ 100
Net energy (GJ ha−1) = Net energy (MJ Mg−1) ∗ Yrs/1000
Net GHG emissions (kg CO2-eq Mg−1)
= GHG emissions (kg CO2-eq Mg−1) − GHG avoided (kg CO2-eq Mg−1)
Net GHG emissions (kg CO2-eq kWh−1) = [Net GHG emissions (kg CO2-eq Mg−1) ∗ SFR ∗ 3.6]/[dRF heat output ∗ 1000]

2.5. RBHG Cost Calculations

RBHG cost depended on inputs such as fuel, labor, and materials used during heat generation. Depreciation, maintenance, and interest of the storage center and dRF (blower, motor, and furnace) were also included. Only one type of baler (CLAAS Markant 55, 45 HP) was evaluated in the cost calculations using Equation (11).
RBHG Cost (USD kWh−1) = [ML ∗ LC + BPC ∗ EC + SFR ∗ RSC + (TC + DC + SC) ∗ SFR/1000] ∗ 3.6/dRF heat output
where RBHG cost is in USD kWh−1 dRF heat output, ML is the number of manual labor, LC is the cost of manual labor which is 0.84 USD man−1 h−1 [39], BPC is the blower electricity consumption in kW, EC is the price of electricity which is 0.20 USD kWh−1 [50], SFR is the rice straw feed rate in kg h−1, RSC is the price of rice straw USD kg−1, TC is the transportation cost in USD Mg−1, DC is the furnace depreciation and maintenance cost in USD Mg−1, SC is the rice straw storage depreciation and maintenance cost in USD Mg−1, dRF heat output is in MJ h−1, and 3.6 is a conversion factor.
The price of baled straw was based on financial analysis, taking into account investment, depreciation, interest, labor, fuel, tractor rental, tax, and transportation costs. The investment cost of a CLAAS Markant 55 baler was obtained from a baler sales company, Agri Component Corporation. All the other specifications of the baler were obtained from the manufacturer’s manual. A 10% equipment transportation cost, as well as a 10% tax, were included in the total cost. Equations (12) and (13) show the calculations for depreciation and interest, respectively.
D = IV/(LS ∗ Qy)
Irs = IV ∗ Irb/Qy
where D is the depreciation of the item in USD Mg−1, IV is the investment cost in USD, LS is the lifespan of the item in years, Qy is the annual capacity in Mg year−1, Irs is the interest of the service, and Irb is the bank interest (12%). Maintenance and repair costs were based on percentage factors in Table 5 multiplied to the depreciation cost. Equation (12) was also used in the dRF and storage center depreciation cost calculations, considering maintenance and repair factors. The investment cost and specifications of the storage center and dRF were obtained from a civil engineer and furnace fabricator, respectively.
Transportation cost was based on a diesel price of 0.82 USD L−1 [51], fuel consumption of 2.18 L Mg−1 for a distance of 4 km [8], driving tractor and trailer capacity of 13.13 Mg h−1 [8], and driving manual labor cost of 0.96 USD man−1 h−1 [39]. The calculated transportation cost was 1.86 USD Mg−1 for a distance of 4 km.
The annual capacity of the storage center (assuming two harvest seasons) was based on the baled straw density from literature values, ranging from 81.47 to 331 kg m−3, with an average of 157.16 kg m−3 at 8–14% moisture content dry basis [17,48,52]. On the other hand, the annual capacity of the dRF was based on the optimized straw feed rates of 20.67 to 28.06 kg h−1 SFR [17].

3. Results

3.1. Results of the RBHG Experiments

Table 6 presents the results of the RBHG experiments. In the heat generation experiments, the blower electricity consumption for Scenario 1 conditions was between 16.30 and 19.92 kW, with a mean 18.38 (1.87) kW, while that of Scenario 2 was between 11.17 and 11.81 kW with a mean of 11.48 (0.32) kW. The blower electricity consumption of Scenario 1 was higher compared to Scenario 2 due to the higher airflow rate setting of Scenario 1.
The ash output for Scenario 1 was between 6 and 6.11 kg h−1, with a mean of 6.03 (0.07) kg h−1, while that of Scenario 2 was between 4 and 4.28 kg h−1, with a mean of 4.17 (0.17) kg h−1. The ash production in Scenario 1 was higher compared to Scenario 2 due to the higher straw feed rate in Scenario 1. Naturally, Scenario 1 had higher heat output as compared to Scenario 2 [10] due to the higher straw feed rate.
The labor energy per Mg straw was between 4.68 and 6.24 MJ Mg−1 with a mean of 5.42 (0.78) MJ Mg−1 for storage and between 5.52 and 6.87 MJ Mg−1 with mean of 6.03 (0.73) MJ Mg−1 for dRF operation.

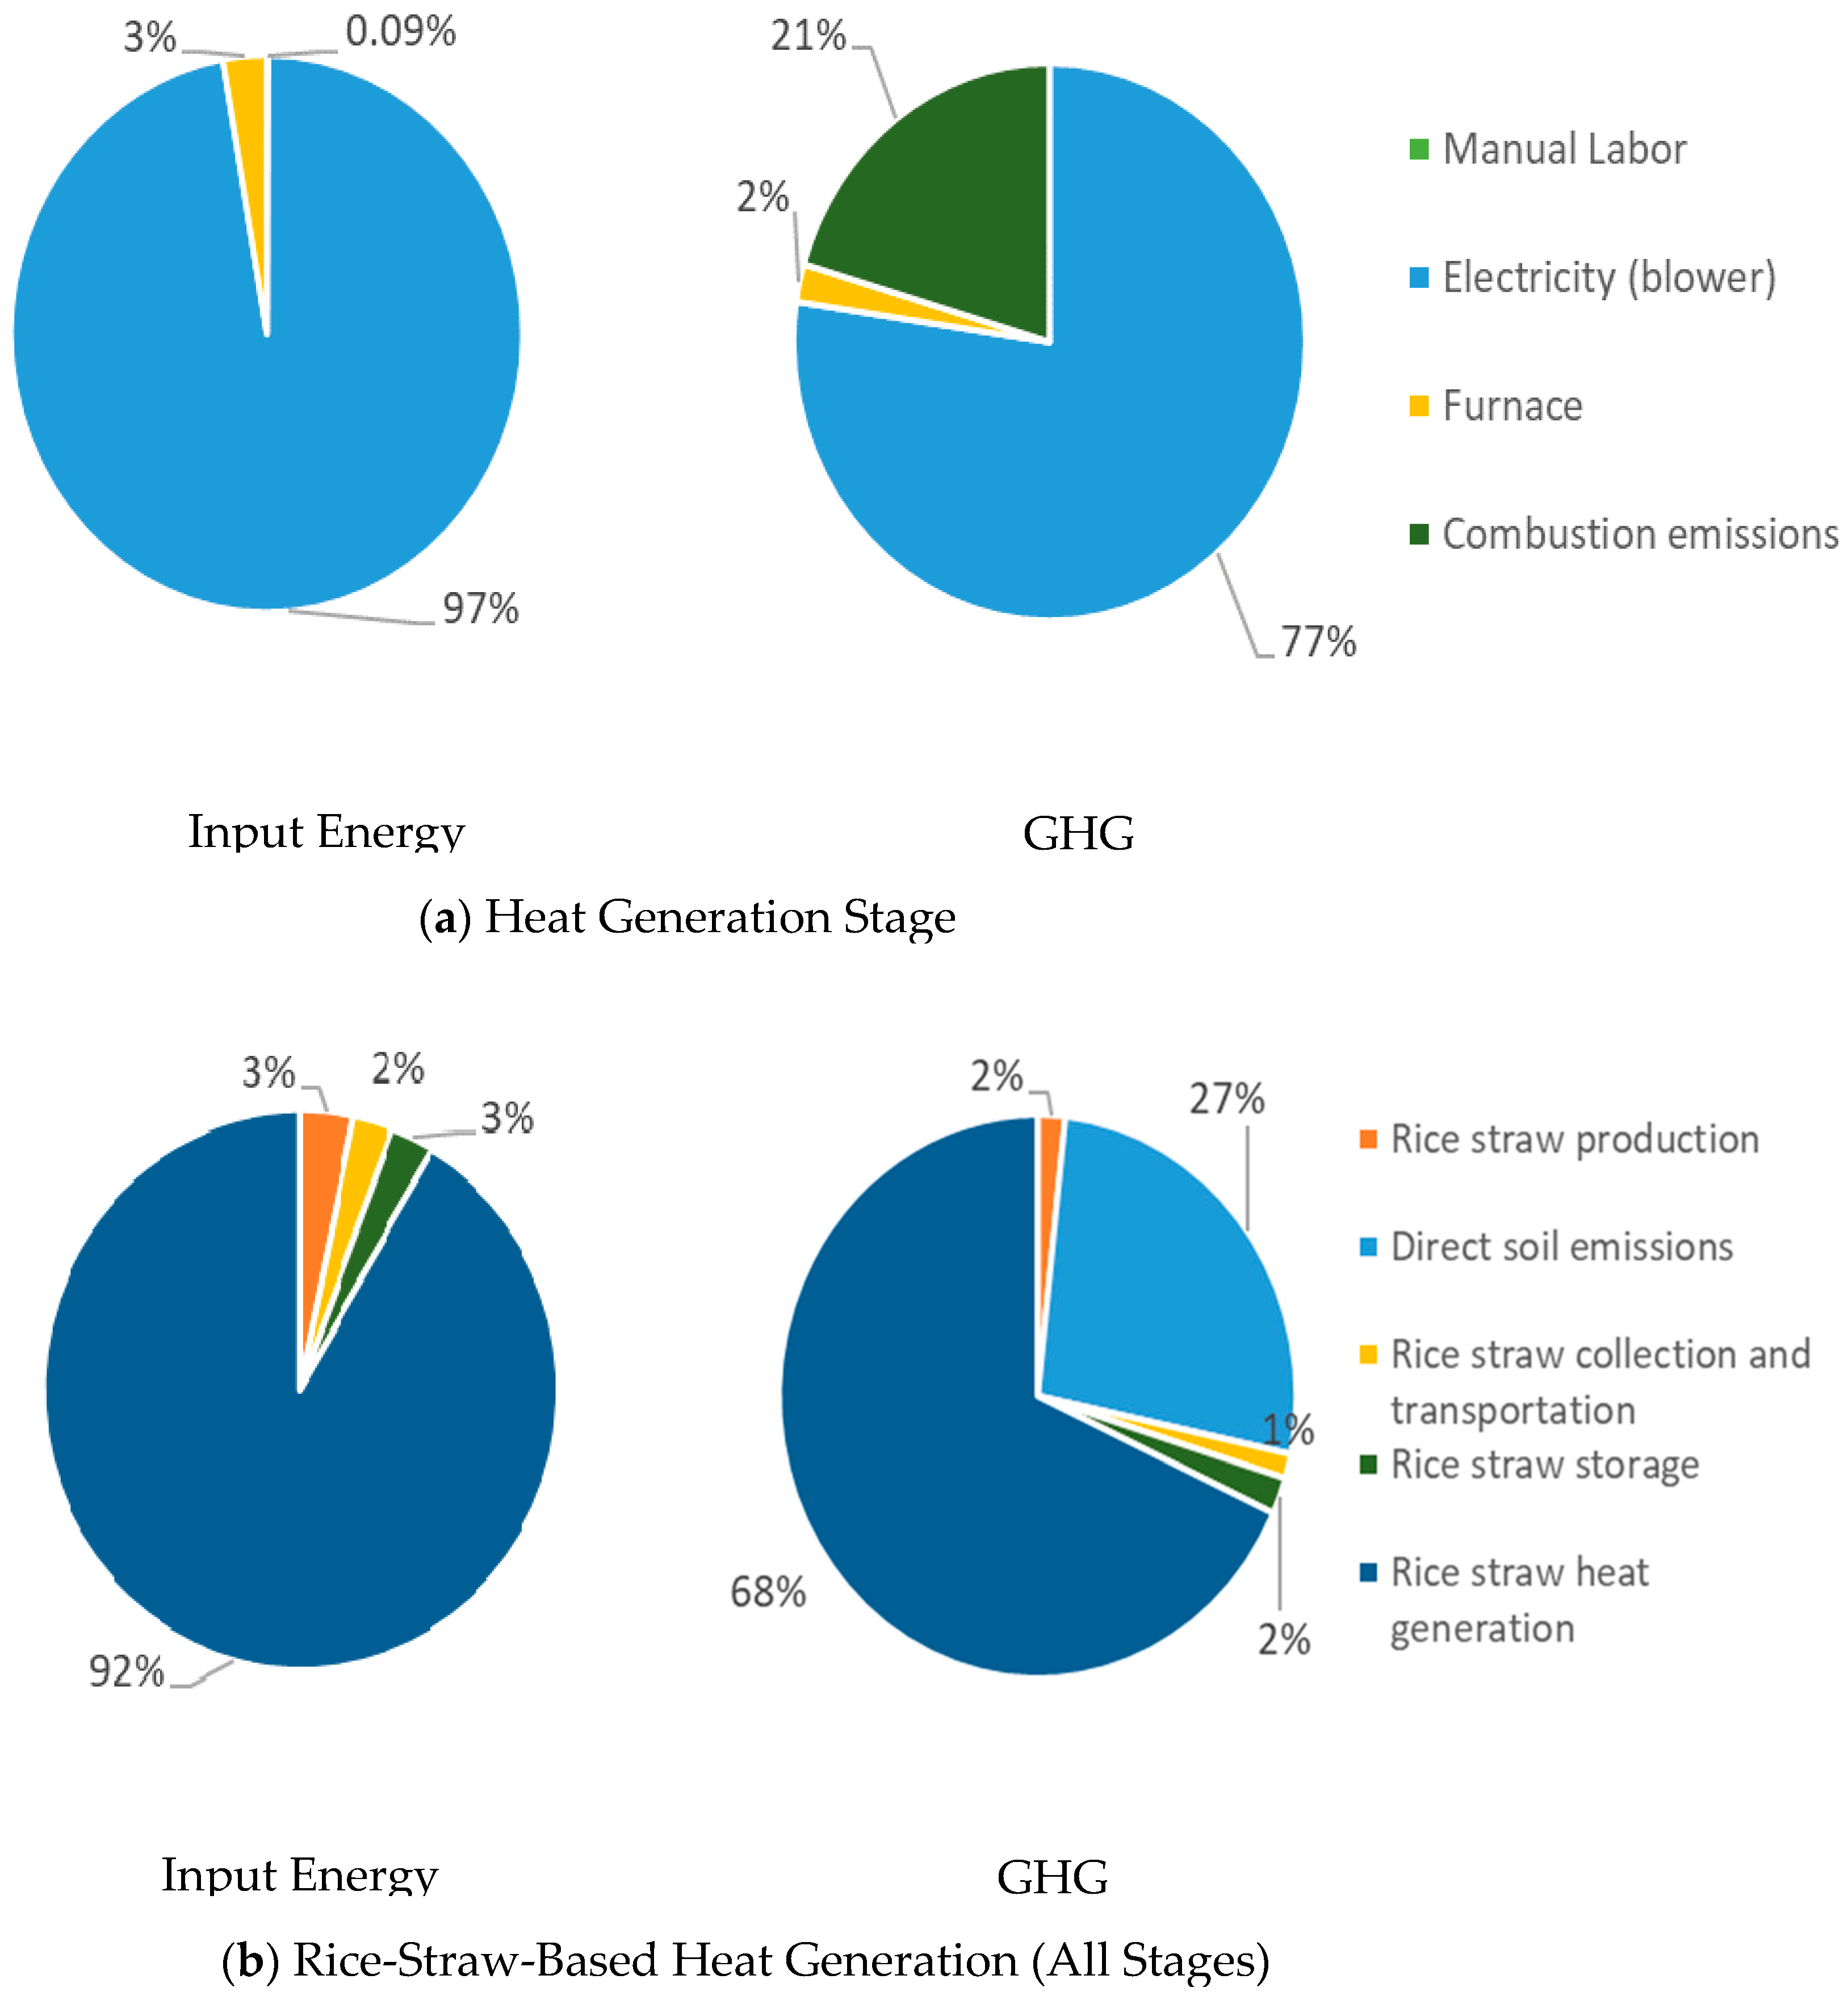
3.2. Energy Flow and GHG Emissions

The energy input per megagram straw during paddy production ranged from 2725 to 9053 MJ Mg−1. Due to the much higher economic value of rice paddy as compared to straw, rice straw allocation only ranged from 3.74 to 4.92%, and the rest was allocated to the rice paddy. Table 7 shows the summarized energy flow and GHG emissions for RBHG. The allocation for rice straw in rice production based on secondary data was only between 118 and 392 MJ Mg−1 for energy and between 9 and 33 kg CO2-eq Mg−1 for GHG emissions. Data on rice straw collection and transportation based on secondary data were converted to their equivalent input energy and GHG emissions, also reported in Table 7. The converted input energy and GHG emissions for the first two stages, rice straw production and rice straw collection and transportation, had comparable values.
The construction of the 200 sq. meter and 3-meter-high storage center expended a total of embodied energy of 254 GJ, equivalent to 1270 MJ per sq. meter. In terms of energy depreciation, the calculated energy depreciation per Mg of rice straw using Equation (3) ranged from 79 to 318 MJ Mg−1 for the storage center (Table 7). The embodied GHG emissions for the construction of the storage center was 32,810 kg CO2-eq, or 164 kg CO2-eq per sq. meter. Thus, the GHG emissions per Mg rice straw ranged from 10 to 41 kg CO2-eq Mg−1 for the storage center.
During the heat generation stage, the construction of the furnace (dRF) expended a total embodied energy of 22.1 GJ, corresponding to an energy depreciation between 152 and 232 MJ Mg−1 rice straw using Equation (4). The embodied GHG emissions in the construction of the furnace were 2100 kg CO2-eq. Thus, the GHG emissions per Mg rice straw ranged between 14.5 and 22 kg CO2-eq Mg−1 for the dRF. The converted blower electricity consumption ranged from 6218 to 7334 MJ Mg−1, while the GHG emissions ranged from 496 to 794 kg CO2-eq Mg−1 rice straw, using the emission factors in Table 4. The rest of the contributions during the heat generation stage and the outputs are also reported in Table 7.
The net total positive energy ranged between 3348 and 4527 MJ Mg−1 rice straw, while the net total GHG emissions ranged between (−)61 and 856 kg CO2-eq Mg−1 rice straw, wherein the negative sign of the lower range indicates GHG avoidance instead of emission. The total net energy corresponded to an energy ratio between 1.4 and 1.7 and percent net energy between 39 and 67%.
Figure 2 summarizes the percentages of the energy flow and GHG emissions. During the heat generation stage, the blower electricity consumption required the highest input energy at an average of 97% of the total input energy (Figure 2a). The furnace energy depreciation was only at an average of 3% of the total input energy in this stage, and the manual labor energy is almost negligible at an average of 0.09%. Blower electricity consumption also emitted the highest GHG at an average of 77% of the total emissions during the heat generation stage (Figure 2a). Rice straw combustion emissions from the release of CH4 and N2O accounted for an average of 21% (Figure 2a), followed by furnace construction emissions at 2% in the heat generation stage.
In terms of the total input energy and GHG emissions for all the stages, the highest input energy was during the heat generation stage, at an average of 92% of the total input energy, and an average of 68% of the total GHG emissions for all stages (Figure 2b). The rest of the stages ranged from 2 to 3% of the total input energy. Direct soil emissions followed as the next highest contributor of GHG emissions in all stages at an average of 27%, while the rest of the stages ranged from 1 to 2% of the total GHG emissions (Figure 2b).
In the outputs, the heat product dominated the total input energy, while the ash byproduct had minimal contribution (Table 7). Nevertheless, it was important to consider the use of the ash byproduct as a means of waste disposal. GHG emissions from the avoidance of kerosene combustion (801 to 847 kg CO2-eq Mg−1) is higher compared to combustion emissions from rice straw (26 to 316 kg CO2-eq Mg−1).

3.3. Cost Calculations

In the cost calculations, rice straw production and baling were grouped as the cost of baled straw. The estimated cost of baled straw in the Philippines ranged from 17.8 to 22.2 USD Mg−1 straw. However, for a profitable straw baler service provider with a time of capital return from 1.4 to 2.8 years, baled straw price is around 33 USD Mg−1 straw. Transportation cost for a 4 km distance was 1.86 USD Mg−1 straw. In terms of the dRF heat output, the cost of a storage center, labor for dRF operation, electricity, and dRF are presented in Table 8. The total cost ranged from 0.0796 to 0.1127 USD kWh−1.

4. Discussion

The lower range of the input energy during paddy production of this study is comparable with similar studies, which had values between 1730 and 2520 MJ Mg−1 [9,19]. The lower range of the straw collection and transportation is also comparable with that of rice straw collection from similar studies, which ranged between 38 and 110 MJ Mg−1 [9,19]. As for the higher range of the input energy, the difference may be due to the manual labor considered in the study. The GHG emissions during collection and transportation are lower compared to similar studies (132 to 394 kg CO2-eq Mg−1) [6,13,19], possibly due to the shorter distance considered in this study.
Heating value and moisture content affect the performance and efficiency of combustion [5,17,53]. There is a loss in heating value due to the adsorption of water vapor, oxidation, and biochemical reactions during storage [48,54]. Thus, it was necessary to include storage in the life cycle analysis of RBHG. A roofed facility with minimal features was chosen in this study. Comparisons were made with more complex residential structures in terms of input energy and GHG emissions per sq. meter to verify the simplicity of the presumed structure. Results show that the assessed input energy and GHG emissions of the presumed storage center are expectedly lower compared to more complex residential houses with input energies between 3000 and 9740 MJ per sq. meter [55,56] and GHG emissions of 165 to 665 kg CO2-eq per sq. meter [57,58]. The resulting input energy of the storage center was wide-ranged due to the wide range of annual storage capacity considered, which depended on factors such as rice straw density and availability.
The measured labor energy for storage and dRF operation is comparable to the labor energy reported from another study, which is 4.78 MJ Mg−1 for manual straw handling (collecting rice straw to the bund, loading, and unloading) and 6.41 MJ Mg−1 for manual piling of rice straw [8,23]. The closeness with literature values may be explained by the fact that the dRF operation included similar activities such as weighing and feeding of straw into the hopper for combustion.
The blower electricity consumption required the highest input energy during the heat generation stage and also emitted the highest GHG. The significant input energy and GHG emissions from electricity consumption included the contributions from power generation and transmission [29], with factors of 3.11 MJ MJ−1 and 0.21 kg CO2-eq MJ−1 for input and GHG emissions, respectively (Table 4). Thus, other types of motors, such as diesel-powered, may be explored to decrease the input energy and GHG emissions.
In terms of the total input energy and GHG emissions for all the stages, the highest input energy and GHG emissions were during the heat generation stage. The results can be attributed to the blower electricity consumption during heat generation, which required the highest input energy and emitted the highest GHG. The percent net energy output of RBHG is lower compared to that of a small-scale anaerobic digestion study, which is around 71 to 85% [8]. The difference may be attributed to the high input energy during the heat generation stage, specifically the high blower electricity input energy. The energy ratio or energy use efficiency is also comparable to the results of input–output energy analyses from literature (1.39 to 1.72) in Iran [20,49,59], but lower than the values from a study in China (6.81 to 9.94) [21]. It is important to note that the mentioned input–output studies directly considered the energy values of paddy and straw in the output energy and excluded the energies in rice straw processing. RBHG net energy converts to 10.59 GJ ha−1 using Equation (8). Comparing the energy flow of RBHG with that of rice straw soil incorporation and open-field burning, RBHG adds more value to the energy flow since the outputs of soil incorporation (1.35 GJ ha−1) and open-field burning (0.34 GJ ha−1) only include rice straw as fertilizer, with corresponding nutrient losses [14].
Furnace combustion emissions are comparable or lower than open-field burning, which ranged from 453 to 1460 kg CO2--eq Mg−1 straw [6,7]. Combustion in a controlled environment such as the dRF can improve the efficiency and completion of the process [17] over the uncontrolled open-field burning. To compare RBHG with soil incorporation and open-field burning scenarios, it was essential to consider the direct soil emissions in complete or partial removal of rice straw, as shown in Table 7. Direct soil emissions in the complete straw removal scenario come from the incorporation of the remaining rice straw stubbles that favor CH4 formation, as well as N2O emissions during fertilizer application [7]. The net GHG emissions imply that the best case of RBHG would result in net GHG avoidance, indicated by the negative value (−61 kg CO2-eq Mg−1). The best case of RBHG is better compared to the yield-scaled GWP of soil incorporation with emissions of 881 and 1025 kg CO2-eq Mg−1 [7,13], and open-field burning with emissions of 453 and 1460 kg CO2-eq Mg−1 [6,7]. On the other hand, the worst case of RBHG is just comparable with that of soil incorporation.
The average net GHG emissions in this study convert to 0.12 kg CO2-eq kWh−1 using Equation (10), lower compared to the literature value of rice-straw-based electricity generation (0.845 kg CO2-eq kWh−1) in Malaysia [19], higher than that in Thailand (0.043 kg CO2-eq kWh−1) [60], and comparable with that in India (0.15 kg CO2-eq kWh−1) [13]. Studies on rice-straw-based electricity generation show that transportation may contribute a significant portion of the total GHG emissions [9,13,19]. As an example, transportation GHG emissions were up to 42% in a study where the distance of the rice straw collection area to the power plant was 250 km [19]. In another study, transportation contributed up to 81.68% for a rice-straw-based electric power plant [9]. On the other hand, the distance considered in this study was only 4 km. As a result, collection and transportation only contributed 1% of the GHG emissions during the rice preparation stage. For a small-scale RBHG system, a long distance from the rice straw collection area to the dRF unit is not required since individual dRF units may be installed near the rice fields. Thus, small-scale systems may improve the overall GHG emissions with respect to transportation.
The estimated cost of baled straw in the Philippines ranged from 17.8 to 22.2 USD Mg−1 straw, but it was set to 33 USD Mg−1 for a profitable straw baler service provider. This value was lower compared to 38 USD Mg−1, which was the information gathered from farmers in Nueva Ecija, Philippines [8]. Rice straw cost only accounted for 11.04% of the total cost of RBHG (Table 8). Blower electricity consumption accounted for the highest cost (40.47%), followed by labor (23.59%) and storage (14.58%). Alternatives to an electric motor and storage may be explored to drive down the cost. Transportation contributed only 0.62% to the cost, due to the short distance between the rice straw collection and the storage center and furnace. Thus, the energy conversion area must be located strategically to drive down transportation costs [5]. The average total cost of RBHG is 0.096 USD kWh−1, lower compared to the paddy drying cost of 0.13 to 0.15 USD kWh−1 in the Philippines [61,62]. The cost is also lower compared to a 500 kW steam power plant (0.21 USD kWh−1) in Japan within a 3 km distance [63], but slightly higher compared to the cost of a 5 MW rice-straw-based electricity generation system in Thailand within 70 km from the collection point (0.0889 USD kWh−1) [60]. The cost is comparable with the selling price of pelletized rice straw in Japan from literature (0.29 USD kg−1 straw) within a 20 km radius from the collection point [64].

5. Conclusions

The highest contributor among all the stages (rice straw production, straw collection and transportation, storage, and heat generation) in the total input energy and GHG emissions was from the heat generation stage due to the blower electricity consumption. Because of the short distance assumed in this study (4 km), collection and transportation only contributed 1% of the total GHG emissions in the rice straw preparation stage. The RBHG energy ratio was between 1.4 and 1.7, and the percent net energy was between 39 and 67%; RBHG improves the net energy flow over soil incorporation and open-field burning since the last two options only consider rice straw as fertilizer with nutrient losses. The best case of RBHG offers a possibility of a net GHG avoided (−61 kg CO2-eq Mg−1) in contrast with soil incorporation and open-field burning, while the worst case has a net GHG emission comparable with soil incorporation. Blower electricity consumption accounted for the highest cost, followed by labor cost. Thus, alternatives to an electric motor and storage may be explored to drive down not only the input energy and GHG emissions but also the cost of RBHG. In contrast, transportation contributed the lowest cost, due to the short distance considered (4 km). The average total cost of RBHG (0.096 USD kWh−1) was lower compared to the paddy drying cost in the Philippines.
The results of this study show that RBHG adds more value to the energy flow compared to soil incorporation and open-field burning. A small-scale RBHG system may also be advantageous over rice-straw-based electricity generation since long distances from the rice straw collection point may not be required, as individual furnace units may be installed near rice fields. Overall, RBHG is a technology with the potential to improve the energy flow, GHG emissions, and the cost of rice production systems.

Author Contributions

Conceptualization, M.C.M.-D., N.V.H., M.G., C.G.A., M.G.B., J.A.C.; methodology, M.V.P.M.-S., N.V.H., M.C.M.-D., M.G., C.G.A., M.G.B., J.A.C.; software: N.V.H.; validation, N.V.H. and M.V.P.M.-S.; writing—original draft, M.V.P.M.-S. and M.C.M.-D.; writing—review and editing, N.V.H., M.C.M.-D., M.G., C.G.A., M.G.B., J.A.C.; supervision: N.V.H. and M.C.M.-D. All authors have read and agreed to the published version of the manuscript.

Funding

This research was funded by (1) The Philippine Department of Agriculture through the project “Sustainable rice straw management for bioenergy, food, and feed in the Philippines)”, Grant Ref. 101101-03-042-2018; (2) The German Federal Ministry for Economic Cooperation and Development through the “Scalable straw management options for improved livelihoods, sustainability, and low environmental footprint in rice-based production systems,” Grant Ref. 15.7860.8-001.00; and (3) Flagship Program 2, Upgrading Rice Value Chains of the CGIAR Research Program on Rice (RICE).

Acknowledgments

The authors acknowledge the valuable support of the management and research support teams in the International Rice Research Institute and the support of Eduardo Secretario, Engr. Ampy Paulo Roxas, Engr. Joseph Sandro, and Engr. Carlito Balingbing for their assistance and expert advice.

Conflicts of Interest

The authors declare no conflict of interest.

References

  1. Food and Agriculture Organization of the United Nations (FAO). Rice Market Monitor. 2017. Available online: http://www.fao.org/economic/est/publications/rice-publications/rice-market-monitor-rmm/en/ (accessed on 19 December 2018).
  2. Mendoza, T.C.; Samson, R.O.G.E.R. Strategies to Avoid Crop Residue Burning in the Philippine Context. 1999. Available online: https://www.reap-canada.com/online_library/IntDev/id_eco_sugarcane/9 (accessed on 12 December 2018).
  3. Van Hung, N.; Quilloy, R.; Gummert, M. Improving energy efficiency and developing an air-cooled grate for the downdraft rice husk furnace. Renew. Energy 2018, 115, 969–977. [Google Scholar] [CrossRef]
  4. Kadam, K.L.; Forrest, L.H.; Jacobson, W.A. Rice straw as a lignocellulosic resource: Collection, processing, transportation, and environmental aspects. Biomass Bioenergy 2000, 18, 369–389. [Google Scholar] [CrossRef]
  5. Logeswaran, J.; Shamsuddin, A.H.; Silitonga, A.S.; Mahlia, T.M.I. Prospect of using rice straw for power generation: A review. Environ. Sci. Pollut. Res. 2020. [Google Scholar] [CrossRef] [PubMed]
  6. Singh, A.; Basak, P. Economic and environmental evaluation of rice straw processing technologies for energy generation: A case study of Punjab, India. J. Clean. Prod. 2019, 212, 343–352. [Google Scholar] [CrossRef]
  7. Romasanta, R.R.; Sander, B.O.; Gaihre, Y.K.; Alberto, M.C.; Gummert, M.; Quilty, J.; Nguyen, V.H.; Castalone, A.G.; Balingbing, C.; Sandro, J.; et al. How does burning of rice straw affect CH4 and N2O emissions? A comparative experiment of different on-field straw management practices. Agric. Ecosyst. Environ. 2017, 239, 143–153. [Google Scholar] [CrossRef]
  8. Nguyen, V.H.; Topno, S.; Balingbing, C.; Nguyen, V.C.N.; Röder, M.; Quilty, J.; Jamieson, C.; Thornley, P.; Gummert, M. Generating a positive energy balance from using rice straw for anaerobic digestion. Energy Rep. 2016, 2, 117–122. [Google Scholar] [CrossRef]
  9. Said, N.; Alblawi, A.; Hendy, I.; Daiem, M.A. Analysis of Energy and Greenhouse Gas Emissions of Rice Straw to Energy Chain in Egypt. Bioresources 2020, 15, 1510–1520. [Google Scholar] [CrossRef]
  10. He, L.; Huang, H.; Zhang, Z.; Lei, Z.; Lin, B. Le Energy Recovery from Rice Straw through Hydrothermal Pretreatment and Subsequent Biomethane Production. Energy Fuels 2017, 31, 10850–10857. [Google Scholar] [CrossRef]
  11. Silalertruksa, T.; Gheewala, S.H. A comparative LCA of rice straw utilization for fuels and fertilizer in Thailand. Bioresour. Technol. 2013, 150, 412–419. [Google Scholar] [CrossRef]
  12. Gadde, B.; Bonnet, S.; Menke, C.; Garivait, S. Air pollutant emissions from rice straw open field burning in India, Thailand and the Philippines. Environ. Pollut. 2009, 157, 1554–1558. [Google Scholar] [CrossRef]
  13. Soam, S.; Borjesson, P.; Sharma, P.K.; Gupta, R.P.; Tuli, D.K.; Kumar, R. Life cycle assessment of rice straw utilization practices in India. Bioresour. Technol. 2017, 228, 89–98. [Google Scholar] [CrossRef] [PubMed]
  14. Dobermann, A.; Fairhurst, T.H. Rice straw management. Better Crop. Int. 2002, 16, 7–11. [Google Scholar]
  15. Knoblauch, R.; Ernani, P.R.; Deschamps, F.C.; Gatiboni, L.C.; Walker, T.W.; Lourenço, K.S.; Martins, A.A.; Pegoraro, A. Rice straw incorporated just before soil flooding increases acetic acid formation and decreases available nitrogen. Rev. Bras. Ciência Solo 2014, 38, 177–184. [Google Scholar] [CrossRef] [Green Version]
  16. Philrice. Maligaya Flatbed Dryer. Pinoy Rice Knowledge Bank Handout Series. 2010. Available online: http://www.pinoyrice.com/wp-content/uploads/maligaya-flatbed-dryer.pdf (accessed on 3 September 2018).
  17. Migo-Sumagang, M.V.P.; Van Hung, N.; Detras, M.C.M.; Alfafara, C.G.; Borines, M.G.; Capunitan, J.A.; Gummert, M. Optimization of a downdraft furnace for rice straw-based heat generation. Renew. Energy 2020, 148, 953–963. [Google Scholar] [CrossRef]
  18. Singh, A. Life Cycle Assessment of Renewable Energy Sources; Springer: London, UK, 2016. [Google Scholar] [CrossRef]
  19. Shafie, S.M.; Masjuki, H.H.; Mahlia, T.M.I. Life cycle assessment of rice straw-based power generation in Malaysia. Energy 2014, 70, 401–410. [Google Scholar] [CrossRef]
  20. Kazemi, H.; Kamkar, B.; Lakzaei, S.; Badsar, M.; Shahbyki, M. Energy flow analysis for rice production in different geographical regions of Iran. Energy 2015, 84, 390–396. [Google Scholar] [CrossRef]
  21. Yuan, S.; Peng, S. Input-output energy analysis of rice production in different crop management practices in central China. Energy 2017, 141, 1124–1132. [Google Scholar] [CrossRef]
  22. Bautista, E.G.; Minowa, T. Analysis of the energy for different rice production systems in the Philippines. Philipp. Agric. Sci. 2010, 93, 346–357. [Google Scholar]
  23. Quilty, J.R.; McKinley, J.; Pede, V.O.; Buresh, R.J.; Correa, T.Q.; Sandro, J.M. Energy efficiency of rice production in farmers’ fields and intensively cropped research fields in the Philippines. Field Crop. Res. 2014, 168, 8–18. [Google Scholar] [CrossRef]
  24. Blonk Consultants. Agri-Footprint 2.0 Part 1: Methodology and Basic Principles. 2015. Available online: https://simapro.com/wp-content/uploads/2018/02/Agri-Footprint-4.0-Part-1-Methodology-and-basic-principles.pdf (accessed on 12 December 2018).
  25. PRé Consultants. SimaPro Tutorial. 2016. Available online: https://www.pre-sustainability.com/download/SimaPro8Tutorial.pdf (accessed on 12 December 2018).
  26. Philippine Statistics Authority (PSA). Updates on Palay, Rice and Corn Prices. 2018. Available online: https://psa.gov.ph/sites/default/files/CerPrSitAprWeek32017.pdf (accessed on 28 April 2018).
  27. XE Corporation. XE Currency Converter. 2019. Available online: https://www.xe.com/ (accessed on 4 April 2019).
  28. SimaPro, Version 8.0.5.13; LCA Software: Amersfoot, The Netherlands, 2017.
  29. Ecoinvent. Implementation of Ecoinvent 3. 2017. Available online: http://www.ecoinvent.org/partners/resellers/implementation-of-ecoinvent-3/implementation-of-ecoinvent-3.html (accessed on 3 December 2017).
  30. Bowers, W. Agricultural Field equipment. In Energy in Farm Production; Fluck, R.C., Ed.; Energy in World Agriculture: New York, NY, USA, 1992. [Google Scholar]
  31. Richard, C.F. Energy Analysis for Agricultural Systems. In Energy in Farm Production; Fluck, R.C., Ed.; Energy in World Agriculture: New York, NY, USA, 1992. [Google Scholar]
  32. IPCC. Emissions Factor Database. 2013. Available online: http://www.ghgprotocol.org/Third-Party-Databases/IPCC-Emissions-Factor-Database (accessed on 3 December 2017).
  33. Dalgaard, T.; Halberg, N.; Porter, J.R. A model for fossil energy use in Danish agriculture used to compare organic and conventional farming. Agric. Ecosyst. Environ. 2001, 87, 51–65. [Google Scholar] [CrossRef] [Green Version]
  34. Industry Data 2.0. Industry Data LCA Library. 2017. Available online: https://simapro.com/databases/industry-data-lca-library/ (accessed on 17 September 2018).
  35. American Time Use Survey. Summary MET Values for Occupation. 2018. Available online: https://epi.grants.cancer.gov/physical/MET/atusmet.php?major[]=05&keywords=&metval_min=&metval_max= (accessed on 17 September 2018).
  36. Engineering ToolBox. Combustion of Fuels—Carbon Dioxide Emission. 2009. Available online: https://www.engineeringtoolbox.com/co2-emission-fuels-d_1085.html (accessed on 12 December 2018).
  37. Quaschning, V. Specific Carbon Dioxide Emissions of Various Fuels. 2015. Available online: https://www.volker-quaschning.de/datserv/CO2-spez/index_e.php (accessed on 20 December 2018).
  38. Milne, G. Embodied Energy. 2013. Available online: http://www.yourhome.gov.au/materials/embodied-energy (accessed on 12 December 2018).
  39. Department of Labor and Employment (DOLE). Summary of Current Regional Daily Minimum Wage Rates Non-Agriculture, Agriculture (As of April 2018). Available online: http://nwpc.dole.gov.ph/pages/statistics/stat_current_regional.html (accessed on 28 May 2018).
  40. Hayashi, K.; Ono, K.; Kajiura, M.; Sudo, S.; Yonemura, S.; Fushimi, A.; Saitoh, K.; Fujitani, Y.; Tanabe, K. Trace gas and particle emissions from open burning of three cereal crop residues: Increase in residue moistness enhances emissions of carbon monoxide, methane, and particulate organic carbon. Atmos. Environ. 2014, 95, 36–44. [Google Scholar] [CrossRef]
  41. Arai, H.; Hosen, Y.; Pham Hong, V.N.; Thi, N.T.; Huu, C.N.; Inubushi, K. Greenhouse gas emissions from rice straw burning and straw-mushroom cultivation in a triple rice cropping system in the Mekong Delta. Soil Sci. Plant Nutr. 2015, 61, 719–735. [Google Scholar] [CrossRef] [Green Version]
  42. IPCC. IPCC, methane and nitrous oxide emission factors. In IPCC Guidelines for National Greenhouse Gas Inventories; Eggleston, H.S., Buendia, L., Miwa, K., Ngara, T., Tanabe, K., Eds.; IGES: Kanagawa, Japan, 2006. [Google Scholar]
  43. Kadam, M.P.; Patil, Y.D. The Effect of sieved Coal Bottom Ash as a Sand Substitute on the Properties of Concrete with Percentage Variation in Cement. Am. J. Civ. Eng. Archit. 2014, 2, 160–166. [Google Scholar] [CrossRef] [Green Version]
  44. D’Souza, R.G. Replacement of Fine Aggregate with Bottom Ash in Concrete and Investigation on Compressive Strength. Int. J. Eng. Res. 2017, 6, 172–176. [Google Scholar] [CrossRef]
  45. Detwiler, R.J. Substitution of Fly Ash for Cement or Aggregate in Concrete: Strength Development and Suppression of ASR, RD127; Portland Cement Association: Skokie, IL, USA, 2002. [Google Scholar] [CrossRef] [Green Version]
  46. Pavlík, Z.; Keppert, M.; Pavlíková, M.; Volfová, P.; Černý, R. Application of MSWI bottom ash as alternative aggregate in cement mortar. WIT Trans. Ecol. Environ. 2011, 148, 335–342. [Google Scholar] [CrossRef] [Green Version]
  47. Jenkins, B.M.; Baxter, L.L.; Miles, T.R.; Miles, T.R. Combustion properties of biomass. Fuel Process. Technol. 1998, 54, 17–46. [Google Scholar] [CrossRef]
  48. Topno, S.E. Environmental Performance and Energy Recoverable from Stored Rice Straw Bales in Humid Climate. Ph.D. Thesis, University of the Philippines Los Baños, Laguna, Philippines, 2015. [Google Scholar]
  49. Pishgar-Komleh, S.H.; Sefeedpari, P.; Rafiee, S. Energy and economic analysis of rice production under different farm levels in Guilan province of Iran. Energy 2011, 36, 5824–5831. [Google Scholar] [CrossRef]
  50. Meralco. Rates Archives, 2018. Available online: https://meralcomain.s3.ap-southeast-1.amazonaws.com/2018-05/052018_summaryschedule.pdf?null (accessed on 20 May 2018).
  51. Department of Energy (DOE). Energy Supply and Demand Outlook. Available online: https://www.doe.gov.ph/energy-supply-and-demand-outlook (accessed on 11 April 2017).
  52. Kargbo, F.; Xing, J.; Zhang, Y. Property Analysis and Pretreatment of Rice Straw for Energy Use in Grain Drying: A Review. Agric. Biol. J. North Am. 2010, 1, 195–200. [Google Scholar] [CrossRef]
  53. van Loo, S.; Koppejan, J. The Handbook of Biomass Combustion and Co-Firing; Earthscan: London, UK, 2012. [Google Scholar] [CrossRef]
  54. Tian, X.; Zhang, H.; Sheng, C. Self-Heating of Agricultural Residues during Storage and Its Impact on Fuel Properties. Energy Fuels 2018, 32, 4227–4236. [Google Scholar] [CrossRef]
  55. Han, M.Y.; Chen, G.Q.; Shao, L.; Li, J.S.; Alsaedi, A.; Ahmad, B.; Guo, S.; Jiang, M.M.; Ji, X. Embodied energy consumption of building construction engineering: Case study in E-town, Beijing. Energy Build. 2013, 64, 62–72. [Google Scholar] [CrossRef]
  56. Koezjakov, A.; Urge-Vorsatz, D.; Crijns-Graus, W.; van den Broek, M. The relationship between operational energy demand and embodied energy in Dutch residential buildings. Energy Build. 2018, 165, 233–245. [Google Scholar] [CrossRef]
  57. Suzuki, M.; Oka, T.; Okada, K. The estimation of energy consumption and CO2 emission due to housing construction in Japan. Energy Build. 1995, 22, 165–169. [Google Scholar] [CrossRef]
  58. Röck, M.; Saade, M.R.M.; Balouktsi, M.; Rasmussen, F.N.; Birgisdottir, H.; Frischknecht, R.; Habert, G.; Lützkendorf, T.; Passer, A. Embodied GHG emissions of buildings—The hidden challenge for effective climate change mitigation. Appl. Energy 2020, 258, 114107. [Google Scholar] [CrossRef]
  59. Aghaalikhani, M.; Kazemi-Poshtmasari, H.; Habibzadeh, F. Energy use pattern in rice production: A case study from Mazandaran province, Iran. Energy Convers. Manag. 2013, 69, 157–162. [Google Scholar] [CrossRef]
  60. Delivand, M.K.; Barz, M.; Gheewala, S.H.; Sajjakulnukit, B. Economic feasibility assessment of rice straw utilization for electricity generating through combustion in Thailand. Appl. Energy 2011, 88, 3651–3658. [Google Scholar] [CrossRef]
  61. Martinez, R.C.; Flores, E.D.; Asuncion, N.T.; Daquila, R.E.; Viloria, W.Z.; Manalabe, R.E. Development of Philmech rice hull-fed furnace system for heating mechanical dryers. PhilMech J. Post Harvest. Eng. 2010, 1, 1–20. [Google Scholar]
  62. IRRI Knowledge Bank. Economic Aspects of Drying. 1994. Available online: http://www.knowledgebank.irri.org/step-by-step-production/postharvest/drying/economic-aspects-of-drying (accessed on 7 November 2019).
  63. Matsumura, Y.; Minowa, T.; Yamamoto, H. Amount, availability, and potential use of rice straw (agricultural residue) biomass as an energy resource in Japan. Biomass Bioenergy 2005, 29, 347–354. [Google Scholar] [CrossRef]
  64. Ishii, K.; Furuichi, T.; Fujiyama, A.; Watanabe, S. Logistics cost analysis of rice straw pellets for feasible production capacity and spatial scale in heat utilization systems: A case study in Nanporo town, Hokkaido, Japan. Biomass Bioenergy 2016, 94, 155–166. [Google Scholar] [CrossRef]
Figure 1. System boundaries for rice-straw-based heat generation (RBHG).
Sustainability 12 05327 g001
Figure 2. Percentages of input energy and Greenhouse gas (GHG) emissions in the (a) heat generation stage, (b) rice-straw-based heat generation (all stages).
Sustainability 12 05327 g002
Table 1. Bill of quantities (BOQ), electricity consumption, and manual labor during construction of one (1) unit of structure.
ParameterUnitQuantity
Storage center structure
Alkyd paintkg42
Cement cast plasterkg1082
Cement, Portlandkg18,636
Concrete blockkg42,000
Gravelkg44,016
Plywoodm30.12
Polyvinyl Chloride (PVC) pipekg6
Reinforcing steelkg1681
Sandkg39,954
Steel sheetkg1616
Steel, low-alloyed, hot-rolledKg6
Welding, arc, steelm640
ElectricitykWh1000
Manual labor constructionMJ4576
Downdraft furnace (dRF) structure
Cement, Portlandkg250
Clay brickkg385
Electric motorkg73
Reinforcing steelkg324.03
Steel sheetkg155.05
Steel, low-alloyed, hot-rolledkg1
Synthetic rubberkg1
Welding, arc, steelm319.99
ElectricitykWh78.8
Manual laborMJ192
Table 2. Published agronomic inputs in dry season rice straw preparation.
ParameterRangeAverageSources
Rice production
Seeds (kg ha−1)20–10050[7,22,23]
Fertilizer (kg ha−1)
N58–195125[7,22,23]
P2O515–5025[7,22,23]
K2O8.4–3021[7,22,23]
Herbicide (kg ha−1)0.75–1.981.24[22,23]
Insecticide (kg ha−1)0.50–2.871.45[22,23]
Total diesel consumption of machineries (L ha−1) 32–14582[22,23]
Total manual labor (MJ ha−1)423–820618[22,23]
Rice straw collection and transportation
Total diesel consumption of machineries (L Mg−1)4.79–14.108.30[8]
Total manual labor (MJ Mg−1)0.97–2.431.19[8]
Table 3. Calculated energy and Greenhouse gas (GHG) emissions during rice production (without allocation), rice straw collection, and transportation using secondary data.
ParameterEnergyGHG Emissions
MJ Mg−1kg CO2-eq Mg−1
INPUTS
Rice production
Mechanized operations867–258380–238
Labor190–242
Rice seeds241–79415.3–50.4
Fertilizer1714–3973159–352
Herbicide101–1765.7–9.9
Insecticide53–1992.9–10.9
Subtotal, rice production3166–7967263–661
Rice straw collection and transportation
Mechanized operations130–25112–23
Labor0.97–2.43
Subtotal, rice straw collection and transportation131–25412–23
Direct soil emissions from partial or complete straw removal 174–477
Table 4. Energy equivalent and GHG emission factors of inputs and outputs.
ParameterUnitEnergy Equivalent
(MJ unit−1)
GHG Emission Factor
(kg CO2-eq unit−1)
Sources
INPUTS/GHG EMISSIONS
Rice production
Diesel consumptionL44.84.13[29,30,31,32]
Machine manufactureL15.61.44[30,31,32,33]
Laborh0.89 [23]
Seedskg26.911.71[29,32]
Nitrogenkg605.75[29,32]
P2O5kg17.811.12[29,32]
K2Okg8.940.53[29,32]
Herbicidekg300.6316.87[29,32]
Insecticidekg301.5512.84[29,32]
Structure materials and energy
Alkyd paintkg99.526.74[29,32]
Cement, Portlandkg4.280.94[29,32]
Concrete blockkg0.860.09[29,32]
Clay brickkg3.840.32[29,32]
Sandkg0.190.01[29,32]
Gravelkg0.190.012[29,32]
Cement cast plasterkg1.370.21[29,32]
Plywoodm343,613660.93[29,32]
PVC Pipekg683.4[32,34]
Reinforcing steelkg23.632.04[29,32]
Steel sheetkg33.272.9[32,34]
Steel, low-alloyed, hot-rolledkg242.2[29,32]
Welding arc, steelm2.630.21[29,32]
Electric motorunit6850537[29,32]
Synthetic rubberkg87.72.88[29,32]
ElectricityMJ3.110.21[29,32]
Laborh1.0 [35]
Rice Straw Combustion
CH4kg 30.5[29]
N2Okg 265[29]
OUTPUTS/GHG AVOIDED
dRF heat outputMJ1
Kerosene substituteGJ 71[36,37]
Ash as concrete aggregate substitutekg0.190.012[29,32]
Table 5. Investment and specifications of cost items.
ParameterBalerStorage CenterdRF
Investment cost (USD)28,80023,0001515
Workshop for parking and maintenance (USD)2000
Life span (years)5105
Working time (hours day−1)8 2416
Maintenance and repair cost (%)502050
Working days each year (days) 60–9030060
Capacity (Mg yr−1)96080–32019–29
Tractor rental price (USD h−1)4.8
Baler service management (USD man−1 day−1)4.8 [39]
Note: Exchange rate of 1 USD = 52.10 PHP [27].
Table 6. Results of the RBHG experiments and labor energy measurements.
ScenarioBlower Electricity Consumption
(kW)
ASH
(kg h−1)
StageLabor Energy
(MJ Mg−1)
Scenario 1 Storage
Range16.30–19.926–6.11 4.68–6.24
Average18.386.03 5.42
STDEV1.870.07 0.78
Scenario 2 dRF Operation
Range11.17–11.814–4.28 5.52–6.87
Average11.484.17 6.03
STDEV0.320.17 0.73
Table 7. Energy flow and GHG emissions balance for RBHG.
ParameterEnergyGHG
MJ Mg−1kg CO2-eq Mg−1
INPUTEMISSIONS
Rice straw production (rice production with allocation) *,1118–3929–33
Rice straw collection and transportation *131–25312–23
Direct soil emissions from partial or complete straw removal * 174–477
Rice straw storage
Labor4.7–6.2
Storage center energy depreciation/GHG emissions79–31810–41
Subtotal rice straw storage84–32410–41
Rice-straw-based heat generation
Labor5.7–6.9
Blower electricity consumption6218–7334496–794
dRF energy depreciation/GHG emissions152–23214.5–22
Rice straw combustion emissions (CH4 and N2O) 26–316
Subtotal RBHG6376–7573537–1132
Total Energy Input/GHG Emissions6709–8542742–1706
OUTPUTAVOIDED
dRF heat output11,198–11,849
Kerosene combustion avoided 801–847
Ash as concrete aggregate38–412.4–2.6
Total Energy Output/GHG Avoided11,236–11,890803–850
Net Total Energy Output/GHG Emissions3348–4527(-)61–856
Energy Ratio1.4–1.7
% Net Energy39–67
* based on secondary data in Table 3; 1 multiplied by the percent allocation for rice straw, 3.74 to 4.92%.
Table 8. Cost of rice-straw-based heat generation (RBHG) in the Philippines.
InputsCostPercentage of Average Value
USD Mg−1
Rice Straw
USD kWh−1
Heat Output
%
Rice straw330.010611.04
Transportation1.860.00060.62
Storage center maintenance and depreciation18.2–690.0059–0.022214.58
Labor for dRF operation59.9–81.20.0193–0.026123.59
Blower electricity consumption111–1310.0357–0.042140.47
dRF maintenance and depreciation23.6–34.40.0076–0.01119.70
Total cost248–3500.0796–0.1127100

