1. Introduction
The movement of traditional market channels towards online platforms is reshaping customer needs and expectations, resulting in rapidly increasing demands for newer products and expeditious service. Such high consumption rates spark concerns about waste management due to shortening product life cycles and the increasing need for natural resources. Moreover, the exponential increase in electronic waste (e-waste) has become a primary concern in growing economies [
1]. Vindicating these concerns, extended producer responsibility (EPR) and Waste Electrical and Electronic Equipment (WEEE) legislations mandate original equipment manufacturers (OEMs) to establish a catalyst for e-waste collection and recovery operations [
2,
3]. The transformation of the global market and strict environmental regulations cause exponential complexity in managerial and operational layers of downstream and upstream supply chains. To overcome this challenge, OEMs are now under pressure to develop leading-edge strategic initiatives to build unique, agile, dynamic, responsive, and customer-centered ecosystems along their value chains [
4].
Product trade-in incentives have become a viable marketing strategy for many companies with their ability to help companies comply with EPR and WEEE legislations and to stimulate additional revenue channels for OEMs through product remanufacturing. Within the context of purchasing behavior, trade-in schemes elicit an enticing impact on customers’ buying decisions by allowing buyers to claim the scrap value of their existing devices. Particularly in oversaturated industries such as electronics and automotive, trade-up promotions develop a pipeline for OEMs to generate significant residual value by reselling recovered products in secondary markets after remanufacturing, refurbishing, or repair operations [
5,
6,
7]. Such an industry setting paves the way for an unprecedented degree of end-of-life product (EOLP) recovery in environmentally friendly logistics operations. Here, the product recovery is achieved by a disassembly-to-order (DTO) system which coordinates disassembly, inspection and sorting, remanufacturing, reuse, and/or recycling operations en masse.
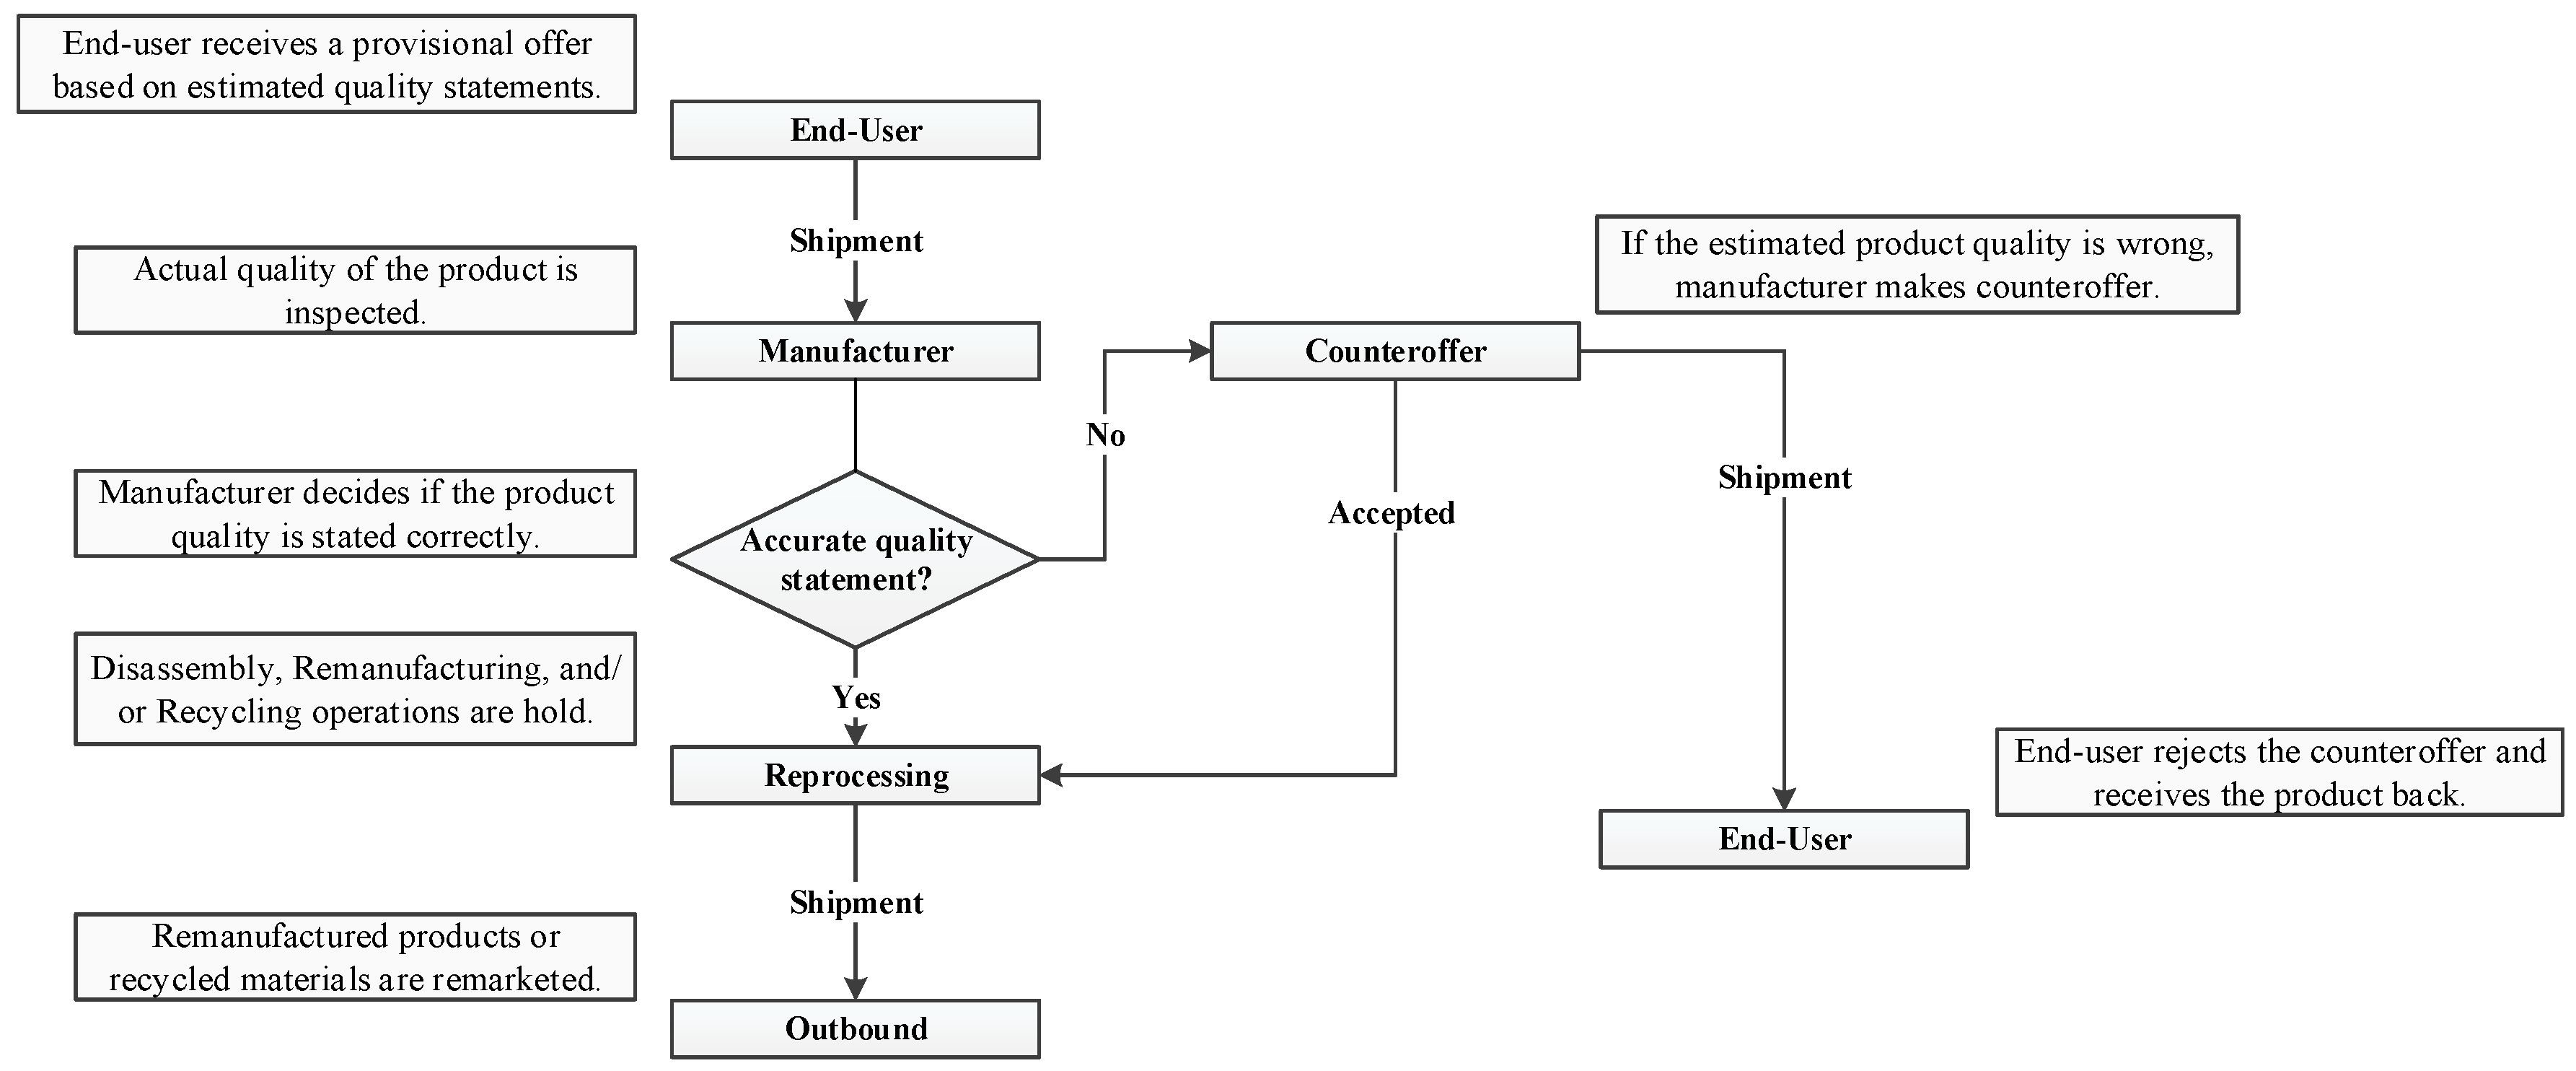
In particular, in the consumer electronics industry, the majority of companies offering business-to-consumer trade-in practices implement a traditional quality-dependent plan at which the process lasts at least a month [
8].
Figure 1 depicts the workflow of conventional trade-in programs.
Yet, in today’s fast-changing market dynamics, maintaining such multi-dimensional trade-in practices triggers persistent functional and financial burdens caused by the unpredictability surrounding the actual quality status of returned products. This ambiguity leads to a number of inspection and disassembly steps in determining the condition of EOLPs in addition to prolonged bargaining processes between customers and OEMs, increasing the overall complexity and product-recovery cost of operations [
9,
10]. The appropriate utilization of newly available information technologies, on the other hand, allows manufacturers to reduce the ambiguities in the returned product conditions significantly, therefore promptly responding to the customer needs while reducing the complexity across operational layers.
Digital twin technology augments decision making and planning for EOLP recovery by eliminating the uncertainty related to the condition and the remaining useful lives of returned products. Digital twins impose a positive impact on the overall DTO operations since this technology increases the product identification capability by removing the need for inspection and sorting. In particular, digital twins are virtual replicas of physical assets [
11]. These are empowered by utilizing the scattered data obtained through Internet-of-Things (IoT) devices such as sensors and radio-frequency identification (RFID) tags embedded in real-world counterparts [
12,
13]. A widely distributed connection between the objects with the ability to produce data through sensors peaks the efficiency and eases the complexities in the DTO systems. Such competency makes digital twin technology more strategic for organizations due to its strength is to provide tighter control mechanisms while boosting transparency [
14]. Once embedded in a product, IoT sensors keep track of all critical components in a product and record data regarding their condition, such as usage patterns, run cycles, and failures. Moreover, they hold all of the necessary product information such as serial numbers, model name and year produced, bill-of-material, and assembly/disassembly instructions [
15]. This provides accurate data for product behavior both at the product and component level [
15].
OEMs can build a high predictive capability, viz. predictive twins, in estimating the remaining useful life of products based on the data collected for the product and component functionalities through IoT infrastructure [
16]. Predictive twins model the behavior of the products or systems based on the historical data of their real-time simulated instances. The remaining useful life of a product can be approximated with the help of historical observations gathered from the product and components, or other similar devices, or a combination of those [
17,
18,
19]. Such predictive model provides manufacturers with the ability to anticipate the future state of product and component conditions before offering trade-in prices.
In this broadly connected network, synchronizing data through the cloud leads to cybersecurity and trust issues [
20]. Blockchain technology provides vital infrastructure for transmitting data to digital twins in a confidential fashion [
21,
22,
23]. Blockchain is a distributed peer-to-peer ledger technology that permanently seals every transaction into blocks to ensure security and perpetuity [
24,
25]. With this capability, data are stored with cryptographic surveillance in a decentralized structure, where digital twins can securely transfer data from IoT sensors [
26,
27]. Additionally, blockchain forms the concept of smart contracts. Smart contracts are characterized as distributed transactions stored on the blockchain to allow for heavily automated workflows that require no human interaction [
28]. These digital contracts pave the way for more secure, transparent, traceable, and rapid transactions between all parties in an entirely predictable manner [
29]. This capability enables manufacturers to generate special trade-in offers for each customer returning their outdated products.
A predictive DTO twin represents advanced decision support for product-recovery operations, including disassembly, remanufacturing, and recycling, in a simulated environment. This system aims to preserve the minimum quality of products and system requirements for the OEM while fulfilling customer expectations [
30]. Determining engaging trade-in prices for used products is significant for the producer since it creates a viable market avenue and for the customers since it influences their decisions for accepting the offers. Optimal trade-in offers, on the other hand, are reliant on the product conditions and components’ remaining useful lives. The simulated system ensures that the system goals are reached through various what-if scenarios. It focuses on obtaining the minimum achievable trade-in discount and the maximum achievable trade-in acceptance rate in the existing product conditions. Performing in a blockchain-enabled environment, digital twins achieve a high degree of interconnection and transparency without the need for intermediaries along the value chains [
31]. Moreover, predictive twins become capable of generating prompt trade-in incentives for individual customers based on particular product behavior with the help of smart contracts.
This paper’s primary contribution is to introduce a predictive assessment of the impact of production technologies on the decision-making process of trade-in schemes at the individual customer-level from a disassembly-to-order system perspective. In line with the advanced manufacturing and supply chain technologies, the importance of predictive models dramatically grows due to their capability of analyzing large scale datasets. Predictive analyses introduce conducive models such as simulation and statistical tools to foresee the patterns of large datasets and what is likely happen [
32]. Such competence can remarkably help faster and more efficient decision making in trade-in operations; therefore, it provides the OEM with an autonomy in reducing complexities and the resulting time and cost in operational layers. In particular, focusing on the potential impact of employing digital technologies to generate trade-in contracts for individual customers, there is an inevitable need for more predictive models in the literature to investigate optimal take-back prices in a comprehensive manner. However, the major part of the existing studies on trade-in policymaking engages explicit optimization models and preventive analysis hindering the practicability of the substantial volume of data generated by the increased use of technological tools.
Additionally, contradicting the myriad of research on both take-back incentives and EOLP management, there exist no studies handling trade-in schemes in the DTO context. Despite the fact that the majority of the existing studies deal with remanufacturing operations in trade-in policymaking, it is also crucial to consider disassembly processes since dismantling adds additional cost and time to product-recovery operations due to varying returned product conditions. Therefore, this paper focuses on filling this gap by evaluating the potential benefits of employing digital technologies in DTO systems to achieve faster and more efficient trade-in schemes from the OEM’s perspective.
With this motivation, an autonomous, sensor-embedded, and decentralized disassembly-to-order system simulation is conceptualized. The assessment consists of a comparison of potential trade-in policies and aims to acquire the optimal trade-in incentive. In order to comprehend the predictive competency of a sensor-embedded platform, a mathematical model is simulated and tested. In particular, a discrete event simulation model is constructed to gain insights regarding the behavior of the returned devices as well as the expected overall cost of the product-recovery operations. Following a design-of-experiments study, a logistics regression model employed on the simulated data is presented from an OEM perspective by proposing an appealing price for all parties engaged in the transaction. This study builds on a recent work presented by Tozanlı et al. [
4], which deals with the uncertainty in product recovery to obtain optimal trade-in-to-upgrade incentives for electronic product returns in a sensor-embedded blockchain-powered DTO platform. However, the model proposed by Tozanlı et al. [
4] addresses discrete sets of quality standards, which hinders the predictive capability of IoT-enabled blockchain technology to facilitate individualized trade-in offers. This is the first piece of work that studies the application of predictive analysis to evaluate the implementation and performance of different trade-in policymaking scenarios under the governing concept of IT-powered disassembly-to-order systems.
The remainder of the paper is organized as follows:
Section 2 lists a comprehensive literature review. A quantitative assessment for trade-in pricing policy and the simulation system description are presented in
Section 3 and
Section 4.
Section 5 demonstrates numerical analysis and findings. Finally,
Section 6 presents the concluding remarks and points regarding future work directions.
3. Trade-in-to-Upgrade Policy Analysis
Trade-in programs are the promotions offered by OEMs to attract customers to exchange their used products with upgraded versions. These programs not only have several benefits from the OEM’s standpoint but also customers can benefit from them by claiming the scrap value of their outdated products. Within the context of trade-in policymaking, end-users can be classified under two categories: replacement customers and one-time buyers who prefer to (i) trade-in their discarded products to purchase upgraded versions, and (ii) exchange their used products for an immediate credit without the need for new product purchases, respectively. As the customers gain stronger bargaining power due to the increasing number of alternative products in the market along with competition, OEMs are required determine a feasible marketing approach and offering appealing prices to sustain their competitiveness in the secondary market. One way to achieve a successful trade-in strategy is to understand customers’ behavior and expectations along with their product usage patterns.
Therefore, this section presents two alternative product acquisition strategies: trade-in-to-upgrade discounts and instant credits. To achieve an optimal strategy, a base pricing scheme was first presented to obtain theoretical acquisition prices for returned products at varying quality conditions. Following this, the pricing model was embedded in a simulation-based game setting to mimic the customer behavior and the resulting payoffs for the OEM for both trade-in and instant credit scenarios in a dynamic ecosystem.
The model notations, assumptions, and formulation are elaborated in the following sections.
3.1. Nomenclature
| : | Quality unit () |
| : | Age of a returned product within the useful lifespan () |
| : | Age-dependent new product price for any customer returning a product at age |
| : | Age-dependent instant credit for any customer returning a product at age |
| : | Maximum price for a remanufactured product at quality can be sold in the market |
| : | Market price for a new product |
| : | Perceived discounted price of any customer joining trade-in for new product purchases |
| : | Upper price limit that any customer pays for new product purchases |
| : | Perceived residual value of any customer returning a product at quality for instant credit |
| : | Upper credit limit that offered to any customer replacing a product at quality |
| : | Unit cost of disassembly-to-order system |
| : | Unit cost of remanufacturing |
| : | Unit cost of product handling including inventory |
| : | Unit backorder cost for unmet remanufactured product demand |
| : | Return revenue function of an EOLP at age |
| : | Discount factor for the achievable margin in the payoff of the OEM offering instant credits |
3.2. Model Assumptions
Following assumptions have been considered in the model:
The costs introduced by forward supply flows are not included in the model.
The trade-in program is considered as a business-to-consumer model.
Due to the reusability of components in the remanufacturing line, devices upmost three years of usage are accepted to the product take-back program. Based on system obsolescence concerns, utilizing components older than three years in remanufactured products incur a higher failure rate resulting in higher warranty costs.
End-users joining the trade-in-to-upgrade program can exchange their products with newer versions only.
Return function relies on the product age and behaves independently for each product return. This function is correlated with the reusability of devices at the remanufacturing line.
Trade-in schemes are considered in a dynamic game setting where the OEM and the end-user have complete information. The acquisition process is constructed in a finite horizon, where two players behave rationally.
3.3. Base Model
The base framework is based on a profit-maximizing policy adopted from the pricing scheme proposed by Ray et al. [
5]. The model aims to obtain optimal quality-dependent pricing offers based on a continuous age of returned products for trade-in incentives and instant credits.
The OEM obtains the actual quality of the products and assigns one of the three quality classes, viz. high quality, medium quality, and low quality. These quality classes present product age profiles based on the range of product age (). In particular, products at age between 0 and 1 year, 1 and 2 years, and 2 and 3 years are considered as high-, medium-, and low-quality, respectively. Customers exchanging their products for trade-in-to-upgrade are charged () at new product purchases, whereas end-users returning to receive instant credits are offered ().
The product holder’s decision to join the trade-in program demonstrates a strong linear dependence on the surplus they receive. This surplus value can be examined separately for two take-back schemes. Assuming a buyer replacing a product at age
t for trade-in-to-upgrade has a perceived price (
) satisfying the new device purchasing decision. The end-user surplus can be expressed as:
To provide an analytically tractable framework,
is assumed as heterogeneous following uniform distribution (
). The uniform distribution is accepted as a standard approach in the literature due to its ability to convey a large degree of variability. Hinging on this assumption, the probability of a randomly chosen customer with a product at age
accepting the promotion at a price
can be obtained as:
Given the perceived discounted price within the range
and
the probability of customer returning products remains positive. Moreover, at each device return, the OEM incurs return function
correlated with the reusability of devices at the remanufacturing line. Remanufactured products are sold for a price based on their quality units in the secondary market. As the quality unit increases, the deterioration of EOLP increases, and the quality class decreases. As an example, once a returning product is between ages 0 and 1, the quality class of this product is accepted as high quality, and the quality unit is assigned as 1. Similarly, once an older product between the ages 2 and 3 returned for trade-in, the quality unit is considered as 3. Since the deterioration level increases with the years of usage, the profitability of reprocessing items in the remanufacturing line decreases simultaneously with the age of the product and the related market selling price level. Therefore, the
is a non-increasing function of age
and quality unit
:
Given the above definitions, the objective function which maximizes the expected profit from the trade-in-to-upgrade incentives becomes:
The optimal price
for any given product at age
that maximizes the expected profit in trade-in-to-upgrade program is presented by the first-order derivative condition
Therefore, for any product at age
(
), the optimal trade-in price is easily interpreted as:
Similar to trade-in-to-upgrade promotions, individuals preferring instant credits desire to maximize their surplus. Considering a customer who has a perceived residual value (
) for a product return, the surplus can be shown as:
where
heterogeneous and uniformly distributed (
). Perceived residual value is also defined as the minimum expected instant credit of a customer. The OEM sells remanufactured products in the market based on their quality classes, viz.
high-,
medium-, and
low-quality, and quality units, viz. 1, 2, 3, respectively. Therefore, the price category for reprocessed items is determined based on these quality classes. An incentive offered to a customer returning a product at age
with a quality unit
falls into the margin between the maximum price
at which remanufactured product at the quality unit
can be sold, and the cost of the disassembly-to-order system (
). To allow analytical tractability, the upper bound (
) for an instant credit offered to any customer replacing a product at the quality
is limited with the margin of (
). Any acquisition price that exceeds this bound can never be profitable and therefore is not considered.
Motivated by these, the probability of a randomly chosen customer with a product at age
belonging to the quality unit
accepting the credit at a credit
can be expressed as:
The return function for instant credits follows the same pattern with the revenue incurred in the trade-in-to-upgrade policy. In the acquisition process for immediate cash credits, the OEM aims to maximize the trade-off between the remanufactured product sales and buyback credit. Here, the manufacturer is subjected to a discount factor in the achievable margin since the customers sell their outmoded products to the manufacturers without the need for any product purchases. Therefore, the margin obtained from the buy-back policy is discounted by ().
Conditioned by these descriptions, the objective function that maximizes the expected profit from the cash credits becomes:
The optimal buyback credit
for any given product at age
that maximizes the expected profit through the sales of remanufactured products at quality unit
is presented by the first-order derivative condition
Therefore, for any product at age
,
, falling into quality unit
, the optimal trade-in price is formulated as:
3.4. Dynamic Simulation-Based Game Model
Performing remanufacturing operations in a digital twin-supported platform powered by IoT and blockchain technologies provides the OEM with the opportunity to leverage data exchange between operational layers throughout end-to-end supply chains. With this ability, the manufacturer can access accurate data regarding the exact product condition and conduct real-time performance analysis and cost optimization using it. Unlike traditional product take-back models, this novel approach authorizes the producer to set accurate pricings for discarded products on a real-time basis without relying on the perceptions regarding the conditions of returned EOL products. This ability caters to significant margin enhancement in operational layers by eliminating the costs of inspection, sorting, and additional shipments.
In some cases, the condition of EOLPs can be more deteriorated than the product holder anticipates. In such situations, conforming customers’ expectations grows into a complex decision process since the OEM may fail to offer valid rebates from the customer standpoint. Addressing this issue, the proposed framework was constructed as a game model is mimic in the simulation to allow the manufacturer to keep track of how an individual customer reacts to the allocated incentive. Knowing the individuals’ behavior, the producer can form binding rebates while maximizing the overall profit. Such a dynamic setting also originates from the concept of smart contracts in a dynamic business-to-consumer environment. The utilization of smart contract-enabled blockchains in an IoT domain significantly boosts more input and output data flow, therefore, increases the learning capacity of predictive twins. This helps the OEM make individual customer-level offers. Such platform provides the manufacturer with the value of perfect information, which remarkably accelerates decision making and helps the attainment of autonomy in the long term.
The utilization of predictive analyses such as simulation and statistical tools allows OEMs to foresee the patterns of large datasets and what is likely happen. Therefore, the base pricing model was embedded in a simulation-based game-theoretic model to analyze the resulting payoffs for trade-in-to-upgrade and cash rebates from the OEM perspective in a dynamic ecosystem. Trade-in schemes are considered in a basic game setting where the OEM and the end-user behave rationally. It is assumed that each consumer can make a single product submission only in a finite horizon. Having a perceived residual value in mind, the customer has no anticipation regarding what the potential trade-in value is.
Figure 2 depicts the interaction between the manufacturer and the end-user during the acquisition process in the proposed game setting.
This dynamic game is initialized by the product holder’s decision to join the trade-in program or not. Processing the procured data using multiple scenarios, the manufacturer makes the offer to the customer either of the two choices to the product holder: new product purchase at a discounted price, trade-in-to-upgrade, or instant cash without a purchase. Responding to the manufacturer’s move, the end-user either accepts the incentive and returns the device, or rejects and keeps the product.
As described in
Section 3.3, the manufacturer generates rebates for the EOLPs using a continuous age approach. Since the game is in a finite horizon with perfect information, the OEM and the user’s strategies can be examined through the backward induction process. Starting from the last nodes, the optimal action for the OEM can be obtained as follows:
- (1)
Considering the trade-in-to-upgrade path, the OEM sets a price, for individual products at age . The OEM anticipates that a rational customer accepts in case where the granted price is less than the customer’s perceived reservation price, . Thus, the probability of a randomly chosen customer accepting the trade-in falls into [0, 1] only if the discount satisfies .
In the base model,
is defined as a uniformly distributed random variable between 0 and
(~
). In order to establish a more realistic foundation, the perceived discounted price is enhanced by defining a lower bound
for each quality class
in the simulation model. As described in
Section 3.3, the quality classes are grouped as
high-,
medium-, and
low-quality based on the product age. Using this information, the lower and upper bounds for uniform distribution is redefined as
. The gain of the customer accepting the offer is formulated as the difference between the price for the new product and the discounted price,
. Since this incentive is granted only if the customer purchases a new product, the user’s outcome is multiplied with a discount factor,
. The discount factor
can also be explained as the conceptual depreciation for individuals being required to buy a new product. Therefore, the optimal decision of the OEM for this scheme can be expressed as:
Otherwise, the optimal strategy for the OEM is to offer a price lower than the customer’s reservation price. In such cases, the customer rejects the offer. Once the discounted value is dismissed, the product holder holds a perceived residual value of
for the product at quality unit
, whereas the manufacturer incurs holding cost for component inventory and backorder cost for unmet demand for remanufactured products in the secondary market. This, obviously, is not considered as an ideal move for the producer.
- (2)
Examining the instant credit choice, the manufacturer provides a cash value of
to the customer returning a product at age
. In this structure, the return on investment for granting a refund is correlated with the quality class of products, viz.
high-quality,
medium-quality, and
low-quality. The OEM sells the recovered products in the market based on these three quality units. Therefore, the manufacturer attempts to maximize the margin
between the maximum market price of a remanufactured product at quality unit
and the incentive offered to the end-user. The margin can also be expressed as:
A rationale end-user accepts the cash rebate in case where the credit
is higher than the customer’s perceived residual value
. The user’s residual value is uniformly distributed and heterogeneous,
. Similar to the customer’s behavior towards accepting trade-in-to-upgrade offers, the perceived residual value is extended by assigning a lower bound
allied with the designated quality unit
. To this end, the simulation for the cash model is performed with the upgraded lower and upper bounds for the anticipated incentive, (
), for more practical results. The probability of a randomly chosen customer accepting cash promotion
falls into [0, 1] only if the amount satisfies
.
As also detailed in
Section 3.3, proposing immediate credits the OEM encounters with a discount factor
in the achievable margin since the end-users are not required to purchase any new or remanufactured products. Acknowledging the customer’s advantage, the optimal move for the producer can be expressed as:
Assuming that the OEM’s favorable move is to propose a value lower than the user’s residual value, the consumer withdraws and keeps the residual value
at the end of the game. This rejection invokes the backorder cost for the producer. Similarly, holding and backorder costs also emerge from the manufacturer’s standpoint.
- (3)
In this step, the producer compares the payoff acquired from two nodes. Assuming that the optimal decision is to offer
for trade-in-to-upgrade node and
for cash credit node, the OEM prefers to provide discounted amount if following holds:
Linking Equations (10) and (13), the manufacturer’s optimal decision for trade-in can be indicated as:
Alternatively, the manufacturer’s choice to deliver a refund is:
Repeatedly, binding Equations (12) and (15), the producer’s optimal decision for instant credit can be expressed as:
- (4)
The manufacturer’s final choice relies on the maximum expected profit attained from each node. Examining the probability of an end-user acquiring the rebate, the expected profit for trade-in-to-upgrade strategy is:
whereas the expected profit obtained from instant credit plan is:
Comparing the two schemes, the superior game plan that yields higher output is selected.
ARENA v.15.1 was used to implement the virtual game model in the DTO system and to mimic the customers’ behavior towards the presented incentives. The pricing model detailed in this section is embedded in a discrete event simulation model to evaluate the application and the performance of two different trade-in policies as a marketing strategy.
4. System Description
This section presents a conceptual model of a discrete event predictive twin of a DTO system as a type of product-recovery system. The game model detailed in
Section 3.4 utilized in a discrete event simulation model to analyze and compare two trade-in policies under the perfect information scenario. Policies are assessed based on individual customer behavior against the offered incentives and their profitability for the OEM.
Focusing on this, a discrete event simulation (DES) was deployed to pinpoint the implementation of a conceptual product-recovery line. The DES model is used to assist in time-saving, margin enhancement, cost reduction, and risk minimization in point-to-point operations. Taguchi Orthogonal Arrays were implemented as a design-of-experiments study to observe the entirety of the DTO system under varying experimental conditions. The cost parameters obtained through the DTO DES model are embedded in the dynamic simulation-based game model to generate simulated data for customers’ decisions on trade-in rebates and the resulting expected profit for the OEM. Moreover, a logistics regression model was applied to the simulated data in order to maximize the likelihood of customers accepting the offers.
The DES product-recovery system represents the complete disassembly-to-order operations, including disassembly and remanufacturing. In this model, a manufacturer was assumed to have the capability of obtaining real-time data streams regarding product usage patterns and quality conditions with the help of IoT sensors in the form of RFID code. Therefore, there are no inspection and sorting costs that occur in the system. The simulated DTO model helps the OEM calculate expected overall cost of product recovery, as well as the unit cost of processing a product in the complete DTO system. Accessing the actual quality status of products and the unit DTO cost, OEMs can acquire the return on investment of each product at varying levels of quality once they enter the system. The return on investment here was obtained through the dynamic game model, where the expected profit of acquiring a product is calculated based on the customer’s decision. This model enables the manufacturer to generate precise trade-in rebates for each customer. The working principles of the virtual game model can be elaborated as follows.
Every product has a unique identification code, viz. a serial number, stored in blockchains and readable through RFID in a fully connected and decentralized network. Once the serial number is acquired, the product information, including bill of materials and assembly/disassembly instructions and sensor data sealed in blockchain, is retrieved. Relevant data are permanently stored and transferred to the product twin and simultaneously to the process twin though the cloud. Utilizing digital twins, the manufacturer can mimic the condition of EOLPs and the DTO system in real-time. Through the data gathered, the OEM can predict the remaining useful life of products and virtually computes the overall product-recovery cost, viz. the DTO cost, including disassembly, remanufacturing, inventory, backorder, and transportation costs via the online simulation model.
The intelligent DTO system involves returned sensor-embedded end-of-life (EOL) game consoles (GCs).
Figure 3 depicts the series of recovery processes addressing various quality levels of EOL GCs. Initially, EOL GCs enter the system for data retrieval using RFID sensors stored in the blockchain, after which the returned products are processed through a six-station disassembly and a six-station remanufacturing line. EOLP interarrival rate follows a Poisson distribution. Returned products are examined for their usage time and condition. EOL GCs are first considered in three quality classes at which products less than one year of handling are recognized as
high-quality; products that are older than one but newer than two years are classified as
medium-quality; and products higher than two years of usage are categorized as
low-quality products. GCs older than three years of handling are not accepted in trade-in programs. Yet, in some situations, devices with lesser usage times encounter a loss in functionality. In such cases, the quality class is downgraded. To account for the warranty returns, products returned within 30 days of utilization are also considered in the DTO system.
Game consoles are comprised of six components including a hard drive, power supply, disc drive, motherboard, heat sink, and fan.
Table 1 exhibits the precedence relationship between the components.
A complete disassembly is performed to ensure that all components are extracted.
Figure 4 depicts the complete disassembly flow of
high-quality game consoles.
Medium- and
low-quality game consoles follow the same flow. Hinging on the condition of the components, either of two disassembly options can be performed: destructive or non-destructive. Destructive disassembly is employed when components are broken or have zero remaining life span. Non-destructive disassembly, on the other hand, is performed for functioning components and is associated with a higher cost compared to destructive disassembly. Station disassembly times are exponentially distributed due to the memoryless and randomness properties of these events. Following the dismantling, additional component testing becomes unnecessary since the component conditions are quantified via RFID sensors. The OEM eradicates the uncertainty in the disassembly yield, therefore eliminating the inspection and sorting steps and reducing the total disassembly time. Here, the information retrieval cost is considered to be less than inspection and sorting costs and the lifecycle information for EOL GCs is assumed to be available and known.
The recovered components are distributed to relevant inventory bins based on their quality levels, viz.,
high (Bin 1),
medium (Bin 2), and
low (Bin 3), to fulfill the demand for the in-plant remanufacturing line. In the case where
high- and
medium-quality component inventory bins are full, components are assigned to lower life bins and are underutilized. If all inventory bins reach their maximum inventory levels, the excess amount is sold to satisfy the external component demand.
Figure 5 exhibits the component inventory bin assignments.
The second-hand component market can be a supplementary revenue channel for the OEM, where falling short to meet the demand for used parts may imply backorder costs. Moreover, in line with the environmental regulations, the manufacturer is required to regain the value embedded in EOLPs as functioning components or usable materials to avoid disposal. To achieve this, it is assumed that additional surpass inventory is sold to recyclers for material recovery ensuring zero disposal.
There are two types of inventory held in the system: component inventory bins and product inventory bins. Component inventory bins are filled with the dismantled components based on their quality classes, viz. high, medium, low, after the disassembly operations, whereas product inventory bins are hold for the reassembled products based on their quality classes, viz. high, medium, low, after the remanufacturing line.
Component inventory bins are first utilized to meet the internal demand for remanufacturing. The remanufacturing line is based on six assembly stations as shown in
Figure 6, where products are rebuilt in a quality-dependent basis.
Figure 6 presents the remanufacturing flow of high-quality game consoles. Medium- and low-quality GCs follow the same flow. Supposing the component inventory level is insufficient, parts are ordered from outside suppliers. Here, suppliers hand over the higher quality components. This option is not a favorable option for the manufacturer since it not only is associated with a higher cost but this option also undervalues the components utilized towards remanufacturing
medium- and
low-quality products. Following the assembly operations in the remanufacturing line, end products are placed in the appropriate product inventory bins according to their quality classes, viz.,
high (Bin 1),
medium (Bin 2), and
low (Bin 3). Similar to the disassembly line, station assembly times follow exponential distribution. Remanufactured products are sent to the secondary market for sale.
At the end of the product-recovery process, the system calculates the expected cost of the full disassembly-to-order system and the costs of disassembly, remanufacturing, inventory, and backorder. The cost and revenue parameters employed in the product-recovery DES model consist of the unit backorder and inventory cost of components, unit non-destructive and destructive disassembly costs, unit assembly cost, unit transportation cost, price for component sales at different quality levels, and unit price for material recycling. These parameters vary based on the type, useful time, and functionality of the components in the returned products. As an example, high-quality components result in higher cost value but also higher revenue since they require thorough dismantling due to their higher value-added structure. Therefore, every time a customer returns a product, the simulation program assesses the return on investment on a real-time basis for each product entry and acquires the expected cost and revenue to the system. The unit cost of disassembly-to-order system can be obtained through the expected cost of the overall DTO over the average number of products processed at the end of the overall run cycles of the simulation. In addition to the unit DTO cost, unit remanufacturing, inventory, and backorder costs can be extracted. These cost metrics are embedded in the virtual game model to be used as the unit cost of DTO.
The virtual game model is based on the dynamic simulation-based game presented in
Section 3.4. This abstract design allows the manufacturer to calculate the expected profit of offering whether trade-in-to-upgrade or instant credits for each customer holding a product at a specific quality standard. In accordance with the presented game structure, the virtual model was constructed for trade-in-to-upgrade and instant credit incentives, and data were generated for both models. For each product entry in trade-in-to-upgrade incentives, a discounted price for the new product sale was found as explained in the base model (see
Section 3.3). The discount here is reliant on the product quality condition and unit cost values acquired from the simulated DTO model. Similarly, in the instant credits, a credit was generated based on the product quality and unit cost parameters (see
Section 3.3). In each take-back program, the OEM is required to offer an incentive which keeps their margin in a positive range. The rebates are then offered to the customers for their acceptance or rejection decisions.
On the other hand, it is important to note that product-recovery operations vary dependent on the individual product and component condition. In some situations, a product can be more depreciated than the customer perceives. In such cases, the probability of a customer accepting the incentive dramatically changes compared to the probability shown in the base model (see
Section 3.3). It can be notably low due to the lower discount offered than the customer expects. Since the consumer behavior is reliant on the conceptual depreciation value of the used product, the perceived incentive of each customer is assigned based on the customer’s perceived product quality. To illustrate this, a customer holding a device between 1 and 2 years old was assumed to have a perception that their product is
high-quality. Therefore, the perceived discounted price of the customer from trade-in-to-upgrade program can be uniformly distributed as
, and the probability of this particular customer accepting the offer can be calculated accordingly as explained in the base model. The upper and lower bounds of the perceived incentives can vary for trade-in-to-upgrade and immediate credit options. While the upper bound decreases in accordance with the increasing product quality in trade-in rebates, the lower bound increases with the increasing product quality in cash rebates. This dynamic model helps OEMs investigate the behavior of an individual customer holding products at varying quality conditions against the offered incentive. In that case that the OEM offers an incentive that provides a positive surplus to the customer, the likelihood of customer accepting the offer becomes significantly high.
Predicting the individual customer’s behavior, the producer can estimate the effects of proposing an engaging incentive to each customer. Given the probability of customer accepting the offer, the dynamic game model calculates the cost parameters for each product entry as depicted in
Figure 7. In trade-in-to-upgrade incentives, once a customer accepts the product exchange, an expected profit is calculated based on the margin between new product sales and the unit DTO cost and return revenue (see
Section 3.4). Similarly, in the immediate credits, the expected profit is obtained through the margin between remanufactured product sales and the unit DTO cost and return revenue. The unit DTO cost consists of the cost of disassembly, remanufacturing, inventory, backorder, and transportation, which are obtained from the product-recovery DES model. Despite the fact that the OEM incurs profit through the accepted offers, the manufacturer is required to deal with backorder and holding costs in case the customer rejects the rebate.
This prediction mechanism was used to evaluate the expected profit margin of the product-recovery system for each product entry. The profit range for each incentive program was then provided.
5. Analysis of Trade-in Policies in Predictive DTO System
The discrete event simulation model was constructed using ARENA v.15.1. A dataset was obtained from a remanufacturing facility of one of the leading Japan-based consumer electronics companies, to gain an insight into the arrived EOLPs behavior. The handling time of return products was assigned based on a triangular distribution in the interval with a mode of 1.35. The model extracted the expected overall cost of disassembly-to-order system en bloc.
The simulation for the predictive disassembly-to-order system was tested through a design-of-experiments study to observe the behavior of the system under varying experimental conditions. In this regard, a three-level full factorial design was constructed. A total of 50 independent variables were involved in the experimental design, with the three levels of low, intermediate, and high. Independent variables were considered as the factors that reflect the most significant features of the problem. The three-level factorial design was implemented due to its capability of modeling possible curvatures in the response function, as well as to address any nominal factors occurring at all three levels.
Table A1 in
Appendix A demonstrates factors with factors and factor levels used in the experimental design. Moreover,
Table A2 (see
Appendix A) shows the cost and revenue parameters used in the product-recovery DES model.
Engaging a three-level full factorial design with 50 factors, on the other hand, yields a significant number of combinations (viz.,
). Despite the fact that implementing full factorial design conveys the most accurate design, such an extensive number of experiments hinders the practicality of this study. To reduce the experiment to a researchable level, a subset of minimum number of combinations that yields the maximum information possibly concerning all factors about the performance of the response function was selected. This small segment of combinations was chosen based on a partial fraction method to determine experiments that yields the most comprehensive information on factors. Building such experiments, Taguchi [
115] provided a guideline with a new means of implementing these type of experiments in a special form called Orthogonal Arrays (OAs). OAs focus on finding a minimum number of combinations within the statistical accuracy, where degree of freedom approach is utilized to obtain the most powerful subset of experiments. Such a design-of-experiments study is also characterized as the Taguchi’s Orthogonal Arrays (OAs) design.
Due to their convenience and low cost in experimenting with high volume factorial analysis, OAs are often employed in industrial cases to identify the effect of several control factors [
116,
117]. In contrast to its efficient and robust design, however, there are certain limitations of using the OA approach. One is that the selection of the factors and factor levels requires prior knowledge of the system. In this study, the simulation model is constructed based on a specific product; therefore, the independent variables are distinctive for this case study. In case any changes in the product type or any product-recovery lines, factors and factor levels may change, or OA may not even be applicable. The decision maker should understand the system before selecting the variables. Another drawback can be considered as the accuracy of the experiments. Compared to full factorial design, fractional designs may lead less accurate results. However, this could be acceptable in many cases where cost and time efficiency of using OAs dominates the cost of less precise analysis. In particular, in this study, Taguchi design provides the ability to perform the analysis at a researchable level. Therefore, it is utilized due its efficient and time-saving structure.
When selecting the minimum set of the combinations, the number of OAs must be greater than or equal to the system’s degree-of-freedom for accuracy. In this study, the degree of freedom was first obtained to find the least number of experiments based on the formula: , where represents the number of levels for each factor ( and is the total number of factors (. This can also be denoted as = ([(Number of levels − 1) × Number of Factors)] + 1). Given that there are 50 factors each at three levels, 101 OAs were selected . This means that 101 experiments are required to address 50 factors upon three levels. OAs assume that there are no two factors interact with another.
To construct a robust design, the simulation has performed for 101 experiments. The time frame to run each experiment covers a period of eight hours per shift, one shift per day, and five days per week for six months over 100 replications. The ARENA model for the product-recovery process calculates the expected total cost during the simulation runtime using the following equation:
where
DC is defined as the total disassembly cost generated by destructive and non-destructive disassembly operations;
RMC is the total remanufacturing cost resulted from assembly processes;
HC is the total inventory holding cost of components;
BC is defined as the total backorder cost of components in the secondary and recycling market;
TC is the total transportation cost for shipping the products to the main facility;
CS is signified as the total revenue obtained through component sales in the secondary market; and
MS is the total revenue produced through component sales in the recycling market for material recovery.
Despite the fact that the system mainly alters the expenses, the revenue generated through component and material sales is also examined. Components are sold based on their quality levels such as high, medium, and low in the second-hand market, whereas recyclers acquire used parts regardless of their condition. Therefore, price variation exists in the secondary market of recovered components due to varying quality standards.
Additionally, the demand for material recovery was considered at a significantly high rate. According to this approach, all discarded products including the surpass volume of the functional components inventory are sold to the recyclers, with no disposal cost occurring in the process. The scrap value of a particular component for recycling is determined based on the multiplication of the unit scrap revenue and the component weight. The transportation cost is assumed to be
$50 for each trip of the truck. The results for 101 experiments are partially shown in
Table A3 in
Appendix A.
The DTO DES model helped derive the unit cost of processing a product from disassembly to remanufactured product at a certain quality level in the entire product-recovery system. This unit cost was utilized as the unit DTO cost in the dynamic game DES model to attain the expected margin of an individual product entry into the system.
Additionally, actual product qualities were extracted based on the existence and functionality of their components. Each time a product has a missing or a non-functional component, the age and the quality class of the product increases. In particular, the age of an individual game console is a continuous variable ranging between 0 and 3. Each product age belongs to a discrete quality class, where EOLPs with a usage time between 0 and 1 year, 1 and 2 years, and 2 and 3 years are assumed as high-, medium-, and low-quality, respectively. Assuming that a product used less than 1 year can be conceived as less than 1 year old, it can be considered inside the high-quality product category. However, in many cases, the actual status of the device can be irrespective of its conceived age since the usage behavior of individual user may significantly differ. Retrieving the sensor data for each product once they enter the system, the manufacturer can obtain the condition of each component in real-time.
In this regard, the actual quality of components revealing the true quality of return products under varying conditions was first determined in the DES model. The probability factors are provided in
Table A1 (see
Appendix A). Once a product entered the system, the conceived age and the actual age of products were recorded. In the case that the product is more deteriorated than its conceived age, the actual age was increased and the quality index was downgraded accordingly.
The virtual game was performed for two take-back programs separately and data were generated accordingly. The simulation follows the same logic for both take-back schemes. In this regard, once characteristics of each product entering the system were captured, an achievable margin was analyzed to obtain the potential incentive. The incentive was calculated based on the equations provided in
Section 3.3, given that the customers joining the trade-in scheme were offered a discount in their new product purchases, whereas the customers received a cash amount in the instant credit program. Exchange rebates were assessed according to age, quality index, return revenue, and the cost of the DTO system in the virtual game. Similarly, immediate credits were evaluated depending on age, quality index, return revenue, remanufactured product sales, and the cost of DTO system. It is important to note that the return revenue function is highly reliant on the real status of devices since a rate of change in the return revenue affects the utilization of remanufacturing line.
Obtaining the potential incentive for each EOLP, the OEM offers the rebate to the customer. As previously discussed, the customer’s decision is heavily dependent on the customer’s perceived residual value and the price offered for the product. In other words, the likelihood of customers accepting an offer is relatively higher in the case that they receive a positive surplus in joining the exchange program. Based on the pre-defined probability functions (see
Section 3), the customer’s decision for accepting or rejecting the offer was generated in the virtual game model.
In the trade-in program, each customer has a perceived reservation price for a new product purchase once they return their discarded devices. The market price for newer-generation products to be released by the OEM in the future term is assumed to be USD 400 ( = USD 400). The perceived price of a particular customer paying for new device is uniformly distributed with . Considering that trade-in contracts are based on the new product purchases, the perceived price refers to the customer’s expected discounted price for new product purchases. However, since the perceived product quality may be different from the actual product quality, the distributions for different quality indexes were rearranged. Focusing on this, was considered high-quality (), whereas and were assigned to medium-quality () and low-quality () product classes.
Accordingly, in the immediate credit scheme, each customer has a perceived incentive value for each product return at a specific quality status. Reprocessed devices are sold on the secondary market according to their quality levels. The expected credit for a particular customer delivering an EOLP follows a uniform distribution
. To allow analytical tractability, the upper bound was limited with the margin between market price for a remanufactured product at different quality indexes and the cost of the DTO system (see
Section 3.4). This condition also meets the variability in the perceived and the actual product quality standards.
It is assumed that the reprocessed products are sold according to their quality levels in the secondary market. A
high- (
),
medium- (
), and
low-quality (
) remanufactured products can be sold at highest for USD 280, USD 200, and USD 120, respectively. The discount factor in the achievable margin for the OEM was assumed to be ∆ = 0.85. Hinging on the achievable margin detailed in
Section 3.4, a cash amount is offered to customers. Similar to trade-in-to-upgrade decisions, the likelihood of a customer accepting the offer is relatively higher once the customer recognizes a positive surplus between their expected credit and the offered credit.
Inferring a continuous linear return function for both trade-up and cash offers, the OEM increases the return revenue by obtaining higher quality components which linearly increases the performance of remanufacturing line. From the customer’s perspective, in case the manufacturer’s offered credit cannot meet the customer’s expected credit value, the customer rejects the offer.
The time frame of the simulation model spans a period of eight hours per shift, one shift per day, and five days a week for six months with 100 replications. Total of 28,851 and 28,861 datapoints were assembled for both trade-in-to-upgrade and instant cash policies, respectively. Sample outputs for two illustrative models are exhibited in
Table 2 and
Table 3. For each take-back strategy, the virtual game evaluates the perceived age and actual age of each product entering the system based on the deterioration of the components and assigns the actual quality index. The simulation then calculates a return revenue for each product based on their usability in the remanufacturing line. Depending on the take-back program, customers have either a perceived price or credit value for their products. They expect to receive a surplus to accept the OEM’s offer. This surplus simply presents the difference between the expected and the offer price/credit. The numerical study provides data for OEM’s rational reaction to the individual customer returning a product with a particular usage pattern.
In both tables, the end-user’s decision for accepting the rebate is presented as 1 (
), and as 0 for rejecting the offer
. Obtaining the results from the virtual model, a binary logistic regression model was performed due to the dichotomous nature of the customers’ decisions. The logistics regression was used to approximate of the acceptance probability of a customer dependent on a variant for the difference between the perceived offer and the actual offer. This model was implemented in both trade-in-to-upgrade and instant credit datasets. For trade-in-to-upgrade, the variant for the acceptance probability of a customer can be shown as the surplus of the customer from the perceived price and the offered price:
where the probability function for the customer’s acceptance decision is formulated as:
Similarly, the model prediction for the customer behavior for instant credit policymaking was derived from the surplus between the perceived credit and the actual credit offered:
Following this, the probability function for the customer’s acceptance decision can be expressed as:
As described in the dynamic game model in
Section 3.4, the manufacturer’s final choice relies on the maximum expected profit attained from each product return. Hinging on the above probability functions, the expected profit of each product return can be obtained as:
The statistical software IBM SPSS Statistics v.20 is used to run the logistic regression analysis. To derive the estimates of the coefficients
and
for each product acquisition strategy, the likelihood function is maximized.
Table 4 and
Table 5 show the best fitting values for covariates
and
for both trade-up and cash offers, respectively. The overall significance level of the obtained model as the
p-value below 0.001.
With the help of the approximated parameters, it was found that the expected profit ranges between [−88.74, 191.16] for the trade-in-to-upgrade program, whereas the expected profit for offering take-back incentives falls between [−90.75, 132.04].
Figure 8 exhibits the comparison between the two take-back policies based on the distribution of probabilities and the expected profits.
The comparison of the strategies reveals several interesting findings. Based on the analysis, the approximation of an individual’s behavior is statistically significant for both models as evidenced by the p-values (<0.001) and the correction predictions are 78% for trade-up and 84% for instant credits. Assuming a classification cutoff value of 0.5 for the regression analysis, the density of the customers falls under 50%, corresponding to the rejection of the immediate cash offer. This implies that the manufacturer fails to offer appealing credits to the customers, which in return increases the overall backorder and handling costs. To avoid higher costs, the model is more likely to recommend higher value cash rebates, given that the balance between positive gains and lost acquisitions are not optimized. On the other hand, focusing on the perceived and the actual product quality levels, the manufacturer determines a lower cash offer if the product deterioration is sufficiently higher than expected. This decreases any possible risk for the OEM to generate a negative margin in the future term.
Focusing on the trade-in-to-upgrade policy, the proportion of the customers accepting the proposal is almost identical to the proportion of those that reject the offer. In other words, an acceptance or rejection decision for an individual has the same likelihood of occurring. Moreover, concentrating on the achievable margin for this strategy, a higher yield of product submissions can be observed in the positive direction. This indicates that the producer carries lower risks when offering higher prices. One plausible explanation for this is that the results not only focus on short-term product submissions but also aim at achieving long-term customer loyalty to ensure sustainable profit generation. Trade-in-to-upgrade incentives imply higher profit levels compared to instant credits. Therefore, a higher customer loyalty in addition to higher levels of economic and environmental output can be attained through the proposed trade-in-to-upgrade marketing strategy.
6. Conclusions
Due to the limited financial prospects, the majority of OEMs today behave recalcitrant to invest on reverse logistics and remanufacturing operations. This behavior is mainly triggered by the ambiguity in the returned product quality, quantity, and location. One approach that several OEMs implement in attempts to increase the return product turnover with direct impact on the returned quantities is product take-back strategies. Creating a link between the quality and quantity of returns through trade-ins not only increases the efficiency of EOLP operations but also forms new revenue channels for OEMs. However, product take-back decision making is a challenging task for manufacturers since the exchange schemes may cause financial burden in the long run due to various product uncertainties.
The increasing availability and capacity of technological advancements, however, offer immense opportunities for OEMs to increase the traceability of their products in the overall supply chain. The utilization of IT infrastructures in the product-recovery operations can provide manufacturers with the ability to capture the quality of used products in real time. Data captured from such digital structures can be used to predict the future statements of product-recovery operations. Reaching the quality status of products in real time, OEMs can significantly accelerate their trade-in decisions.
A number of studies on trade-in policymaking is presented in the literature, where the majority of the studies focus on finding optimal trade-in policies through explicit optimization and preventive analysis. However, considering today’s highly advanced technology and the resulting vast data, the need for predictive models to assess the optimal product acquisition prices has become inevitable.
This study contributes to the closed-loop supply chain literature by introducing a novel approach for comparing product trade-in strategies from the disassembly-to-order system standpoint by using technology as a leverage. The concept of digital twin technology was utilized to virtually represent disassembly and remanufacturing processes in an IoT-enabled blockchain platform on a real-time basis. Through this framework, the manufacturer becomes capable of eliminating the uncertainty in the return product yield which allows for faster and more efficient decision making across operational levels along the supply chain network. The study focuses on game console trade-in exchanges.
Due to the predictive capability of such smart platform, a discrete-event simulation model was developed to mimic the DTO system of a specific product, viz. game consoles, and to obtain the expected overall cost. The output was tested using Taguchi’s Orthogonal Arrays design as a design-of-experiments study. The simulation model for product-recovery operations was built upon a game console bill-of-material, and therefore, the flow of operations was constructed based on the precedence relationships of components in a game console.
To determine the favorable acquisition strategy, a general pricing scheme was embedded in a dynamic simulation-based game model to mimic the customer behavior and to obtain resulting payoffs from the OEM’s perspective. The results obtained from the simulation were analyzed through a logistic regression model to approximate a particular end-user’s behavior based on the customer’s expected rebate and the provided rebate. The product take-back dynamic model built in this study can be a useful reference for future researchers in performing predictive analysis for trade-in policy decision making.
Focusing on the emerging technologies and the necessity for the data analytics tools, there is an increasing need for predictive models in the related literature. There are various research perspectives that can be examined within the relevant fields. Digital twins can be used to predict future state of the systems based on variable data. This concept can be reflected through performing simulation scenarios, validated in data analytics tools such as regression analysis, neural network, or machine learning algorithms. Empowering digital twins through IoT provides immense data, which significantly increase the prediction competency of digital twins. Moreover, connecting digital twins and IoT devices through blockchain not only helps nearly eliminate cyber risks but also enables smart contracts. With the help of smart contracts, the OEM become capable of offering customized services to individual customers. This capability remarkably affects buyer–supplier relationships along value chains.
Transforming disassembly and remanufacturing operations in such an online ecosystem through smart infrastructures, the producer creates a high degree of communication and transparency without the need for intermediaries along the value chains. Such a state-of-the-art approach provides a unique, secure, sustainable, agile, dynamic, responsive, knowledge-based, and customer-oriented decision-making model which extends business functions beyond an advanced and remarkably flexible platform. With the power of perfect information obtained through an intelligent network, the model, while significantly reducing the distrust between the stakeholders also can lessen customer hesitations towards the authenticity and the quality of remanufactured products. This conceptual model not only delivers a unique user-producer experience but also allows for environmentally-benign value chains by saving time and resources.
While this model fits well with today’s consumer electronics industry, the study can be further improved by analyzing the dataset through a machine learning algorithm. Artificial intelligence such as machine learning and neural networks are convenient models in the digital era with their ability to identify trends and patterns in datasets. Moreover, machine learning algorithms are able to handle multi-dimensional and multi-variety data without the need for human interaction. Such competency can significantly improve the forecasting accuracy in a high volume of input and output data flows, specifically in the context of predictive twins. The utilization of predictive twins with the help of advanced data analytic tools would help OEMs to obtain a faster and a more efficient decision-making platform for not only trade-in policymaking, but also for wider applications such as warranty programs.


