1. Introduction
Transportation and logistics form the core of smart city solutions. The advent of various smart devices has revolutionized both the quality and quantity of the data available from a single commute. Such data can be used for efficient decision making at various levels. There is a constant need for enhancing infrastructure performance through leveraging the digital footprint and using data-driven decision tools [
1,
2,
3,
4,
5]. The idea of smart cities addresses how the advancement and unavoidable use of Information and Communication Technology (ICT) can impact urban development in regards to environmental, financial, and personal satisfaction aspects [
6]. Smart cities promise to create an environment for safer, faster, more economical, and more environmentally friendly travels, especially in metropoles. Developing and implementing dynamic data collection tools, tailored for specific goals, can be a better alternative to expanding transportation infrastructure that is costly and time consuming. Such tools provide city planners with more reliable indicators for journey information, start and end location and time for each individual journey [
7]. Daily commutes increasingly worsen traffic congestion in big cities. In California, for instance, a typical Los Angeles driver loses approximately
$1774 (and rising) in time and fuel costs annually [
8].
Playing a significant role in climate change, Carbon Dioxide (CO
2) emissions have risen globally at a 1.6% annual rate to reach 36.2 billion tons, though a 2.7% growth rate was predicted for 2018 [
9,
10]. Eco-driving is the process of driving in a way that minimizes fuel consumption and CO
2 emissions [
11]. Contrarily, Non-Eco driving accounts for both higher travel costs and CO
2 emissions. Studies suggest that many are aware of the effects of emissions on the environment, yet do not realize how high travel costs of non-eco driving adversely affect them [
12,
13].
At the turn of the 21st century, transportation became more complex. Transportation professionals are asked to meet the goals of providing safe, efficient, and reliable transportation, while minimizing the impact on the environment and communities. This has turned out to be quite difficult given the constant increase in travel demand, fueled by economic development, and the ever-growing demands to do more with less. A partial listing of some of those challenges that transportation professionals face includes capacity problems, poor safety records, unreliability, environmental pollution, and wasted energy [
14]. Adding to the challenge is the fact that transportation systems are inherently complex systems involving a very large number of components and different parties, each having different and often conflicting objectives [
14,
15]. In recent years, there has been an increased interest among both transportation researchers and practitioners in exploring the feasibility of applying Artificial Intelligence (AI) techniques to address some of the aforementioned problems, improving the efficiency, safety, and environmental compatibility of transportation systems.
This study shows that drivers make more eco-friendly decisions when they are informed of their contribution to CO2 emissions. This information is conveyed to them via their smartphone, and the application that is designed for the study.
2. Background
More than half of the world’s population now lives in cities; this share of the population is expected to increase [
16]. Worldwide, cities play a critical social and economic role, while considerably impacting the environment [
17]. Transportation systems have become indispensable parts of daily human activities. An average of 40% of the world population spends at least one hour on the road every day [
18]. Currently, there is no readily and easily accessible tool that would help the common citizen to be informed about daily trip costs and the emissions affecting the built environment. Statistics show that almost 71 percent of the population in the United States uses a smartphone [
19]. Since widely used mobile applications such as Google Maps and Waze do not provide travel costs, fuel consumption, and emission rates, there is a lack of tools to provide such data dynamically and in real-time [
20].
During recent decades, people have depended more on transportation systems, creating new opportunities as well as various new challenges. Traffic congestion, for example, has become an increasingly critical issue worldwide, as the number of vehicles on the roads increases. Higher traffic congestion levels cause more exhaust emissions and more deterioration of the air quality [
21]. Such environmental challenges require rapid actions and effective solutions, among which Intelligent Transportation Systems (ITS) are particularly promising. ITS have emerged as the symbol of smart cities [
21]. The next generation of transportation networks heavily rely on the intelligent systems that can deliver reliable, low-cost, energy efficient transportation services.
Considering the improvements in transportation infrastructure and Information Technology (IT), the relationship between vehicles, road networks, and people need to be reevaluated in a novel approach. This multifaceted approach will result in improving the order and control of transportation systems by making the transportation management systems more efficient, convenient, safe, and intelligent. The ITS-enabled solutions such as traffic management and congestion control can also be employed for urban energy management.
Environmental changes are affecting cities and their inhabitants more regularly. Therefore, city planners need to satisfy the need to improve air and water quality, and control noise pollution to create a healthy and enjoyable environment for city inhabitants [
22,
23]. During the last decades, climate change has become a greatly discussed topic. Globally, transportation accounts for 25 percent of all black carbon emissions, of which diesel engines account for approximately 70 percent. The U.S. produces approximately 6.1 percent of the world’s fossil fuel and biofuel soot, and on-road vehicle emissions are expected to decrease by as much as 90 percent as federal fuel efficiency requirements increase [
24]. Therefore, policymakers are primarily pushing for more efficient vehicles, alternative fuels, and reducing Vehicle Miles Traveled (VMT) in order to reduce CO
2 emissions [
25]. Manufacturers have focused on building vehicles in order to improve powertrain efficiency and introduce alternative technologies such as hybrid and fuel cell vehicles. Alternative fuel possibilities include many low-carbon options such as biofuels and synthetic fuels [
12,
13]. However, less attention is always taken on reducing CO
2 emissions by reducing traffic congestion. Fuel consumption and consequently CO
2 emissions are increased as traffic congestion increases [
26]. Therefore, congestion mitigation programs should focus on reducing CO
2 emissions.
2.1. Comprehensive Modal Emissions Model (CMEM)
Since 1996, the Comprehensive Modal Emissions Model (CMEM) has resulted in a variety of vehicle emission and energy studies [
27], focusing on fuel consumption. Such microscale modeling helps in predicting fuel consumption patterns according to various traffic scenarios.
The model has been developed to interface with a wide variety of transportation models and datasets to provide detailed analysis of fuel consumption and to generate a regional inventory of emissions [
28]. One of the most important features of CMEM is that it can break down the entire fuel consumption and emission process into components that correspond to vehicle operation and emission production. These components and parameters vary according to vehicle type, engine, emission technology, and level of deterioration. A significant advantage of this strategy is that many of the breakdown components can be modified to predict the energy consumption of future vehicle models, as well as their emissions and new technology applications. Since 2000, the CMEM method has been developed and maintained under the sponsorship of the Environment Protection Agency (EPA) [
29].
The CO
2 emissions from transportation depend on various factors. Driving habits, such as the number of times a driver decides to accelerate, cruise, and push the break, are among the important factors significantly affecting the environment. Each trip includes different stages, depending on the driver’s behavior, the roadway type, and the level of traffic congestion.
Figure 1a shows the driving speed over time in relation to CO
2 emissions. The emitted CO
2 can be adequately estimated by the velocity profile of each trip and detailed vehicle information.
Figure 1b shows the relationship between emissions and speed for typical traffic [
26]. The graph can be used to examine how different traffic management techniques can affect vehicle CO
2 emissions, knowing the vehicle travels at a constant steady-state speed. In addition, the University of California at Riverside has developed emission models for different vehicle types, both in laboratory and in real-world traffic scenarios. These data set are the foundation for estimating the CO
2 emissions for a wide variety of vehicles under various driving conditions [
26].
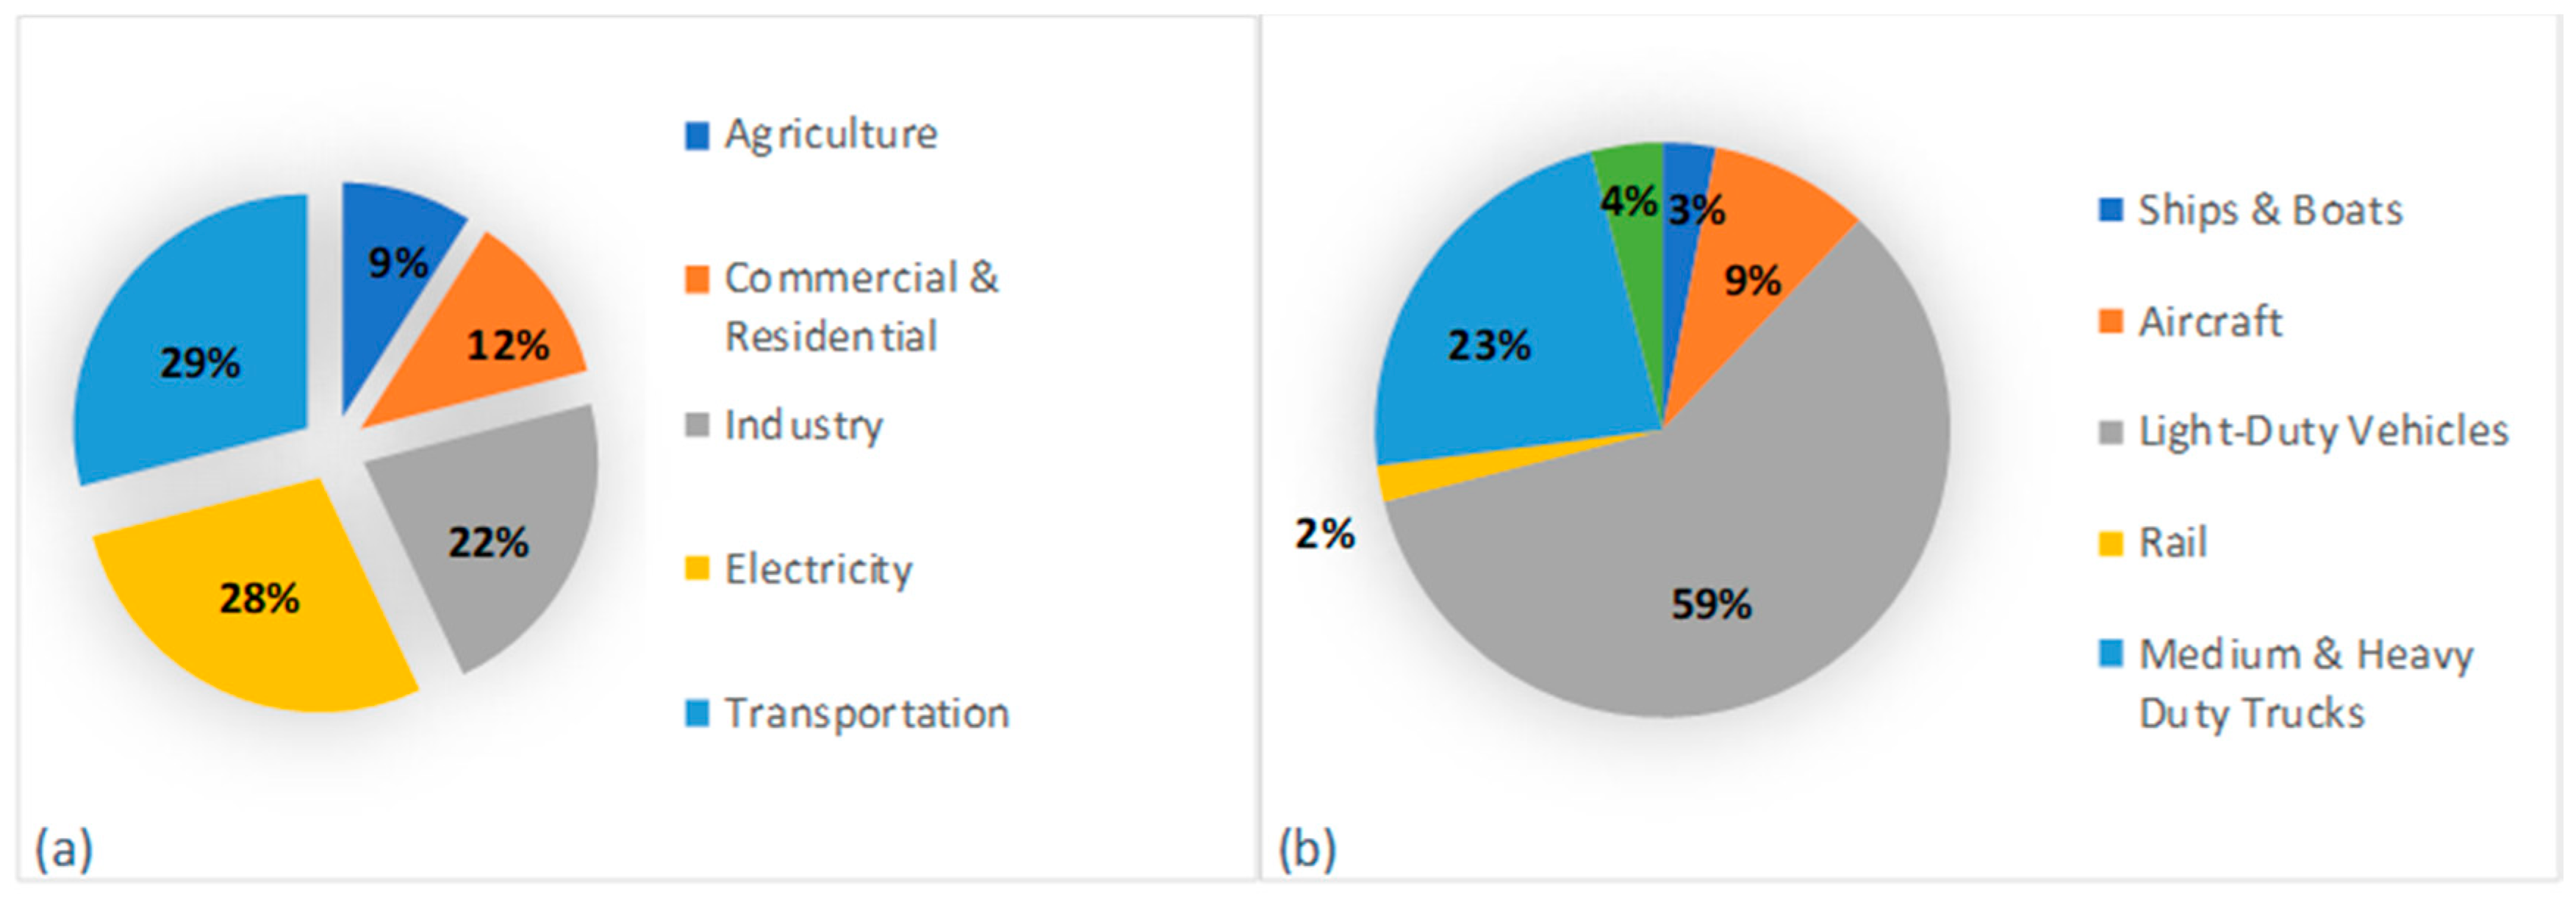
The transportation sector is one of the largest contributors (29%) to anthropogenic Green House Gas (GHG) emissions [
30]. Cars, trucks, commercial aircrafts, and railroads, among other sources, all contribute to transportation sector end-use emissions. Within the sector, the light-duty vehicles category (including passenger cars and light-duty trucks) is responsible for 59% of GHG emissions, which is by far the largest amount, while medium and heavy-duty trucks form the second largest category with 23% of emissions, as shown in
Figure 2b. Emissions decreased by 0.5 percent from 2016 to 2017; this decline was largely driven by a reduction in fossil fuel combustion emissions. GHG emissions in 2017 were 13 percent below 2005 levels, as shown in
Figure 2a [
31].
The GHG emissions in the transportation sector increased more in the absolute terms than in any other sector (i.e., electricity generation, industry, agriculture, residential, commercial) due to an increased demand for travel [
32]. A typical passenger vehicle emits approximately 4.6 metric tons of CO
2 per year. This number is subject to change with variations of fuel type and number of miles driven per year. Currently, an average passenger vehicle on the road drives about 22 miles per gallon and 11,500 miles per year [
32].
Eco-driving is a smarter and more fuel-efficient alternative, focusing on improving driving habits, and vehicle treatment, use, and selection. This habituation requires consistent practicing of recommendations so that drivers internalize the eco-driving guidelines. Typically, an eco-driver can achieve 5 to 33 percent improvements in the fuel economy by following eco-driving guidelines [
27]. On the other hand, eco-driving guidelines are not easily accessible, and drivers often ignore its benefits. Currently, there is no easily accessible tool informing urban citizens about their daily trip costs and the carbon emissions they leave behind in the environment [
27]. There are other solutions to reduce CO
2 emissions, such as centralized management solutions and AI applications [
33,
34,
35]. There are currently a couple of technologies that are used for determining emissions as follows:
2.1.1. Emission Calculations and Reduction
The Carbon Footprint is a free add-on application for Google Maps that automatically estimates the total CO
2 emissions resulting from driving on the route suggested by Google Maps [
36]. This application measures the emissions in Kilo Grams (kg) of CO
2 and has not been updated since October 2017 with a database of 8000 users, which indicates weak user adaptability and interest. Another form of technology is truck stop electrification for heavy-duty trucks. To lower emissions due to engine idling, private companies have incorporated systems throughout the United States known as Electrified Parking Spaces (EPS). The EPS systems provide access to resources such as heating, air conditioning, and power appliances without requiring the truck to have engine idling [
37].
2.1.2. Travel Costs Calculations
Trip Toll Calculator (Tollguru) is a free mobile application available for both Android and iOS that provides calculations for tolls and gas costs in various countries such as the United States, Canada, Mexico, and India. It also provides a Toll Application Programming Interface (API) that can be used by developers trying to use their services in order to provide trucking freight operations, connected vehicles, rideshare services, billing, and transportation modeling for toll roads [
38]. The cheapest route option per trip is also provided. However, one of the main problems of this application is that it does not automatically fetch the local gas price per gallon of gasoline. The gas price needs to be manually entered.
2.1.3. React Native for Mobile Applications
React Native is a cross-platform framework, developed by Facebook in 2015, to create mobile applications targeting iOS and Android mobile phone operating systems while attempting to focus primarily on JavaScript. But JavaScript is not limited to being used exclusively. A native code such as Objective C and Java can be used for iOS and Android in order to leverage specific use cases such as accessing the mobile phone’s hardware. The primary reason for selecting React Native is its flexibility and ease of use.
Although technologies that determine transportation emissions and fuel costs already exist, very few of them consider mass user adaptability. For instance, mobile and web applications such as Google Maps and Waze help users to travel from one location to another, using time and distance as the only optimization factors. Yet, other important factors such as trip cost based on fuel consumption and CO
2 emissions are ignored in both [
39]. This encourages the ultimate goal of Vector Maps to achieve extensive usage. The purpose of this study is to fill this gap. More specifically, this study seeks to develop an analytic tool that provides users with well-informed choices, based on fuel consumption, Green House Gas (GHG) emissions, and travel cost (fuel and toll) in addition to time and distance.
3. Methodology
The primary goal of our mobile application is to provide urban citizens with a smart, intuitive, and effective way to record, monitor, and improve their decision making to select optimized trips. The application provides knowledge about the impact of emissions on the environment, as well as the most economic route for the trip. This will be via a cross-platform, iOS- and Android-based mobile application. The proposed application is accomplished in three major stages of Recommendations, Logging, and Displaying the best routes available that offer the least emissions intensive and more optimized route for cost savings.
Recommendations—This is a vital part of the application whereby the user gives recommendations based on the searched mapped route. These recommendations include a more optimized route for trip cost and an emissions reduction friendly route calculated by an algorithm that comes up with a sustainability index, providing a better way to lower emissions. Specifically, the user is notified whether the selected route is good (green) in terms of the metrics mentioned above or red otherwise.
Logging—During this stage, the application records the user’s route information such as the starting location, destination route, and time logged which provides the emissions consumed by the trip as well as the total cost of the trip including toll roads, if applicable.
Displaying—The user is able to display weekly, monthly, and annual consumption data of both emissions and trip costs. This part of the application is under the EcoStats tab in which the user may navigate at any point in time. An aggregated data plotted on a graph helps to visualize the appropriate emission as well as trip cost data.
User data privacy and protection is considered using Amazon Web Services (AWS), with AWS Cognito used for the user store, and AWS DynamoDB for storing additional user data. The user securely logs in using the AWS Signature Version 4 algorithm and is later authorized via an Identity and Access Management (IAM) temporary token which expires hourly. Access to this data is strictly enforced to only those parts of Vector Maps research and development.
3.1. Architecture
This study develops a system for creating a mobile phone application in order to retrieve distance, time, CO
2 emissions, and toll way for various suggested road alternatives.
Figure 3 shows the high-level application architecture of the mobile application and major components.
As shown in
Figure 3, the mobile application and the web services are connected via simple HTTP (Hyper Text Transfer Protocol) requests. The react native mobile application is broken down into three main components:
React Redux: A react native framework handles the state of the application. It comprises of reducers and actions in order to propagate the state to all application screens.
Axios: A react native component that provides the ability to make HTTP requests to external web services.
Mobile phone application logic components: The core logic of the application which comprises of all models and screen components. In addition to the high-level diagram,
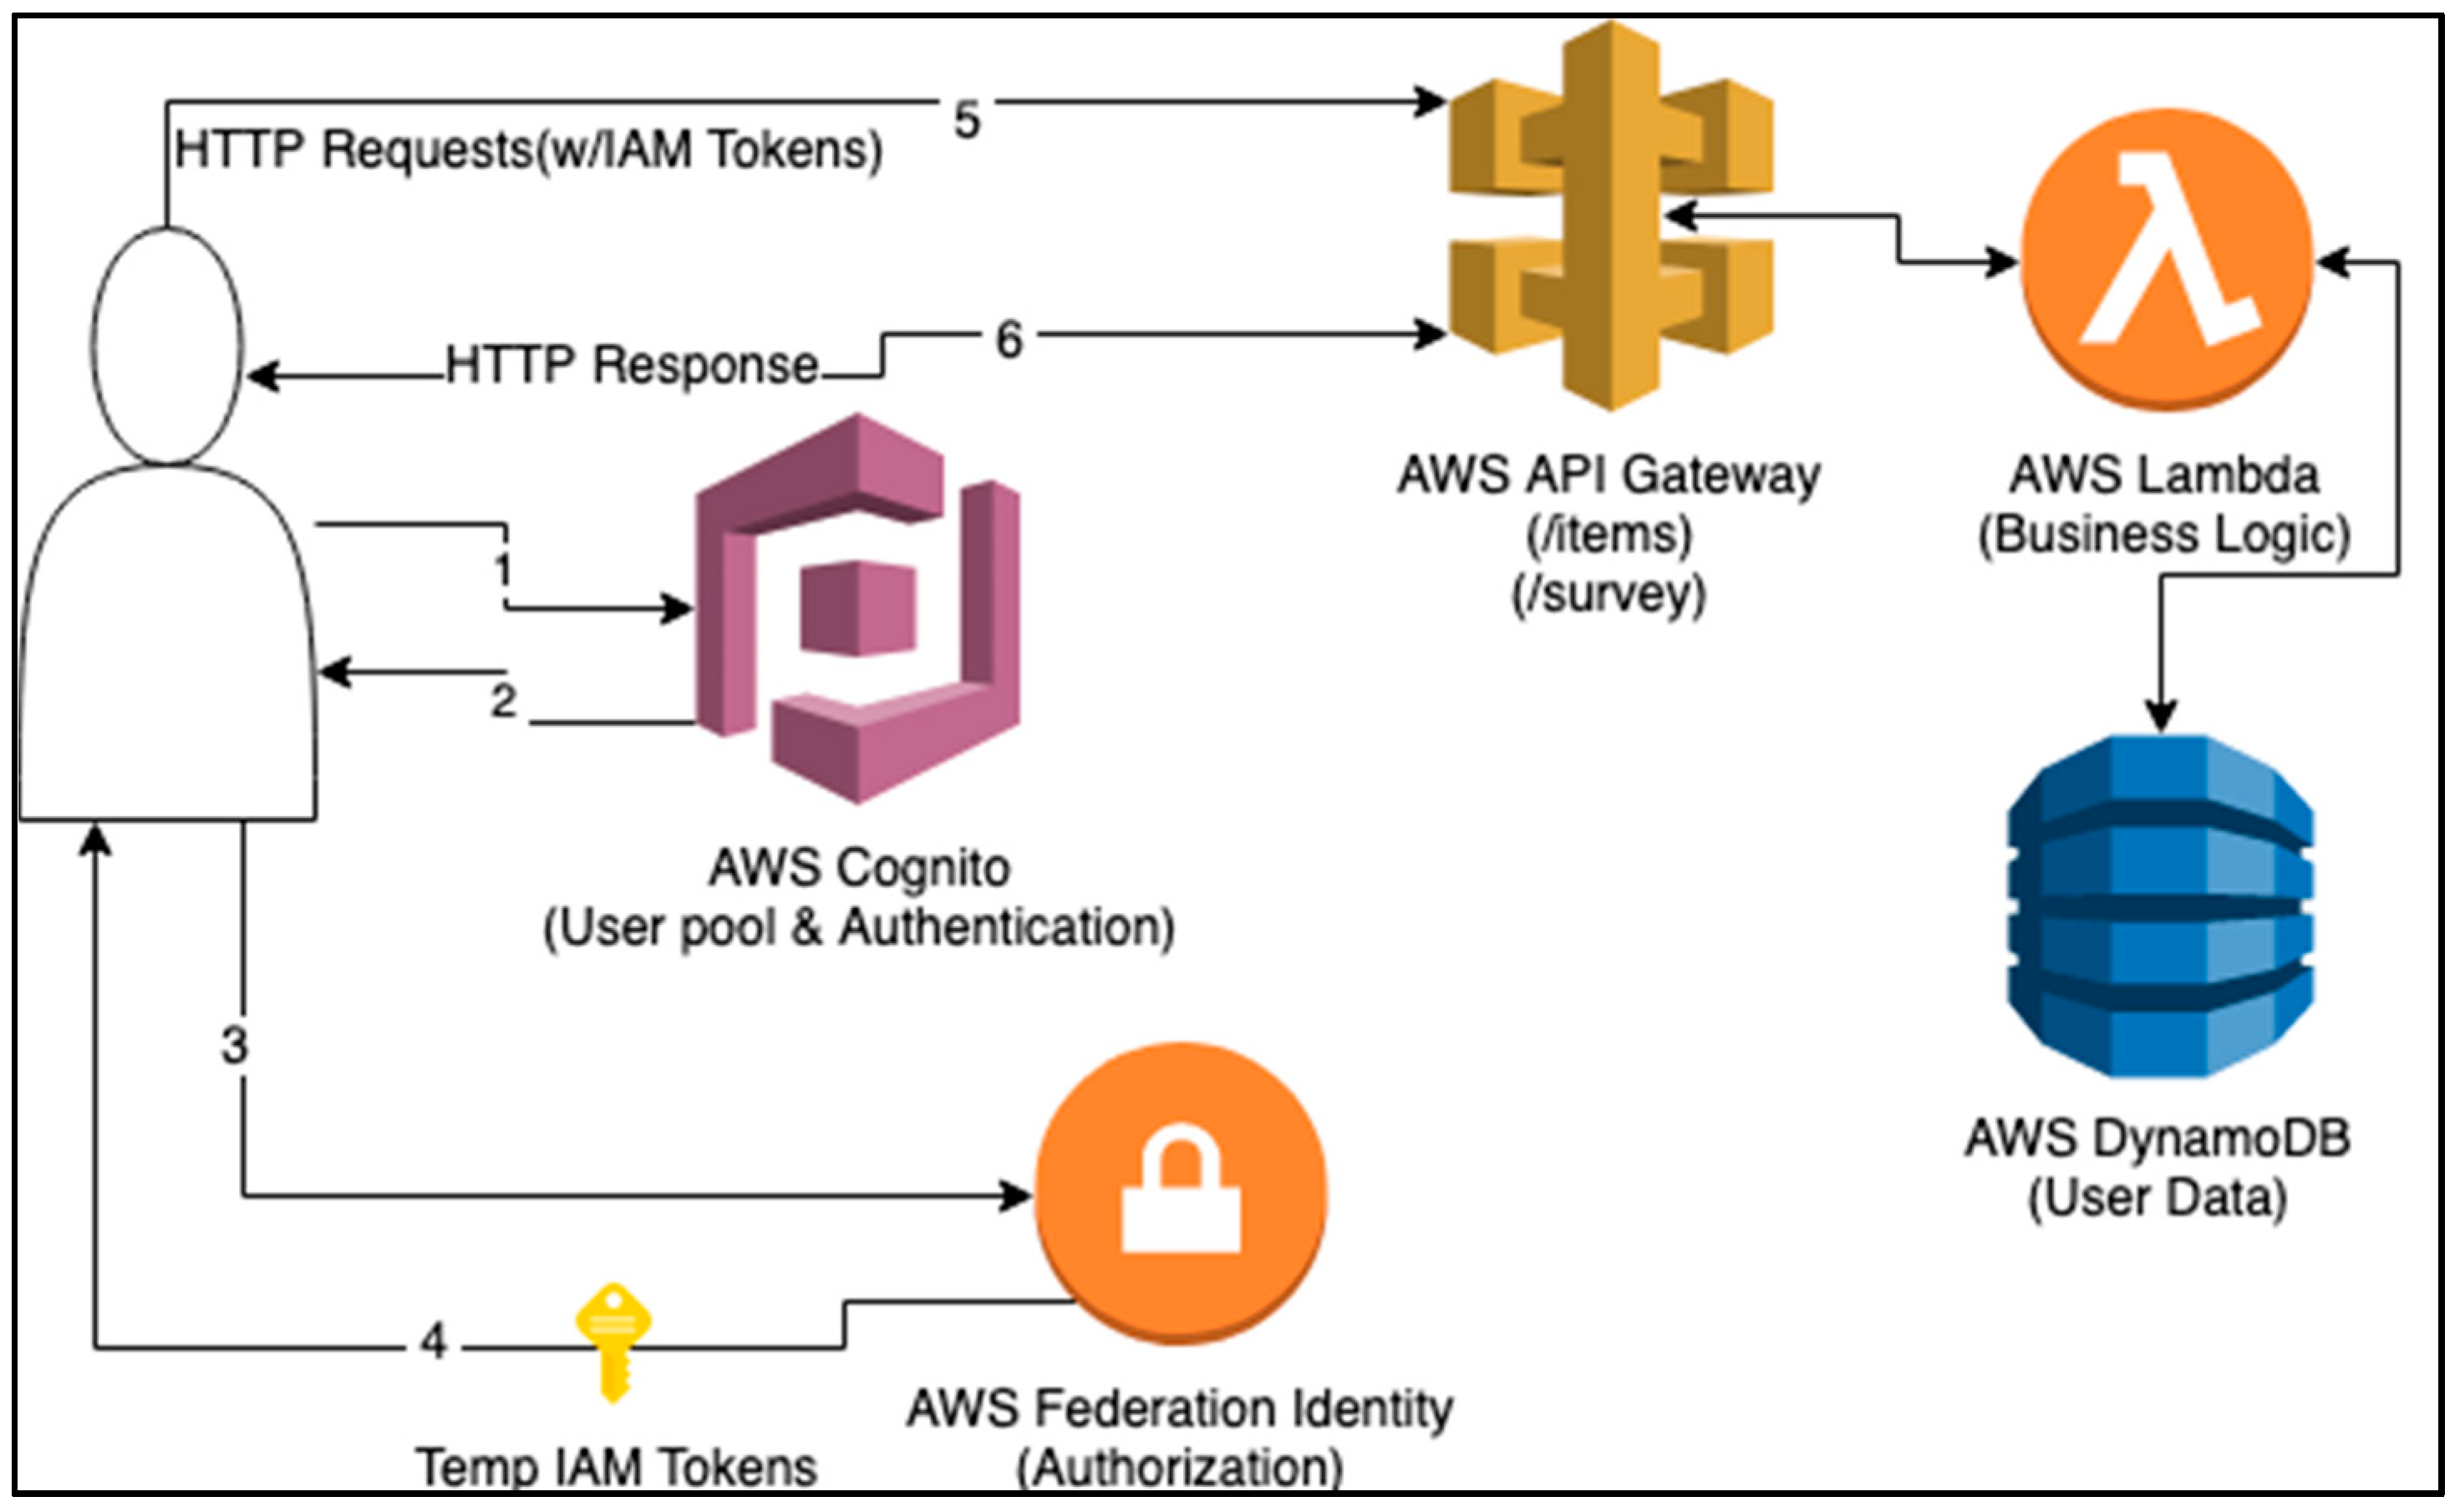
Figure 4 shows the AWS used in the mobile phone application.
The primary function of the AWS is to provide services for application’s users to store their information such as user profile, logged trips, and survey data.
Figure 4 shows how AWS services work with the mobile phone application. The process includes the following steps:
The user logs into the mobile phone application. For new users, a registration form is available.
If authentication is successful, AWS Cognito authenticates the user and returns the user with Json Web Tokens (JWT) containing user details such as the username, full name, and vehicle information (e.g., MPG for gas calculations).
In order to access AWS services such as API Gateway, the user needs to obtain IAM credentials. So, a request is sent to exchange the JWT tokens obtained in step 2.
If authorization is successful, the user is returned temporary IAM credentials to perform requests to AWS API Gateway. The temporary IAM tokens expire in 15 days.
HTTP requests (e.g., GET/items and POST/survey) can be performed to fetch or store data such as logged route information as well as survey data that the user has input.
HTTP response of data is returned to the user in a structured JSON format.
3.2. Development
The tools used for developing the mobile phone application are:
JetBrains WebStorm IDE 2018—Noted as the “smartest JavaScript IDE” by the JetBrains site, this is the main Interactive Development Environment (IDE) used to develop the mobile application, since it is a cross platform React Native, programmed in JavaScript language.
Xcode 10.3 IDE—The iOS interactive development kit used to make native mobile applications for Apple phones. It is used to build the source code and other iOS specific code targeted for iOS. This is also a requirement to run and virtually simulate the mobile application.
Android Studio 3.4 IDE—The Android IDE is the Android Operating System for developing native mobile applications specifically designed for Android phones. This needs to build and simulate a virtual Android device to run the mobile application.
React Native Debugger 0.10—Tool, also known as Remote JS Debugging, is used to debug cross platform applications. It is a server-like application for Mac OS to listen to the debug traffic on port 8081, when the mobile application is running.
The flow diagram in
Figure 5 shows the sequence that the application runs on.
3.3. Functional Specification
In this research, a comprehensive methodology is developed to measure vehicles CO2 emissions and its relationship with traffic congestion, optimizing route selection as an alternative to Google Maps. With this methodology, we can estimate how congestion mitigation programs can reduce CO2 emissions and consequently improve sustainability.
3.3.1. Travel Time and Distance
The Google Maps API gets multiple routes based on the integrated depending factors including time and distance. Then, a color coding similar to Google Maps’ is used to show the traffic congestion levels. The red color shows the heavy traffic, orange color shows the light traffic, and blue color shows no traffic. The pseudo code for extracting time and distance information is shown in Algorithm 1.
| Algorithm 1. Pseudo code for extracting time and distance information. |
Input: 1. Current user GPS position (latitude, longitude).
2. Destination position searched by place, calculated in coordinates (latitude, longitude).
Output: List of n routes {r0… rn} with route properties (e.g. arrival time, distance in miles). |
1 get routes from Google API based on the initial user’s position and destination position.
2 for each route r in routes {r0… rn}
3 set the average duration of the route in minutes
4 set traffic_duration of the route in minutes
5 set distance in miles
6 for each encoded polyline of r
7 decode encoded polyline
8 set decoded polyline
9 return list of routes {r0… rn} with the set values. |
3.3.2. Travel Cost
In this research, the travel cost is calculated based on the current local gas price in the industry and travel distance. The current local gas price is calculated by GasBuddy service, based on the user’s address or Zip code [
40]. Hence, the application mainly searches local gas prices based on the user’s location. Once the list of gas prices is obtained, the application calculates and displays the average gas price for each trip, according to the pseudo code for extracting cost information shown in Algorithm 2.
| Algorithm 2. Pseudo code for extracting cost information. |
Input: Distances in miles of the route. Local gas price g in dollar amount.
Output: Total trip cost c in the dollar amount of route |
1 get distance from route and gas price g
2 calculate and set gallons of gas per distance route
3 <
4 return |
3.3.3. Gas Emission
Equation (1) shows the core logic for determining CO
2 emission calculations in the proposed mobile application according to the Environmental Protection Agency [
31].
where
MPG (Mile per Gallon) is determined by
MPG of user’s vehicle based on the user’s selected profile vehicle.
Driving style is either normal driving or aggressive driving with values of 1 and 1.15, respectively.
Traveled distance is the total travel distance in miles. The
CO2 emissions per gallon of gasoline and diesel are reported annually by the EPA. In order to calculate more accurate CO
2 emissions in grams, the developed application updates CO
2 emissions from a gallon of gasoline and diesel from the EPA website directly. Once the emissions value is calculated by grams of CO
2, the next step is to calculate the sustainability index. The sustainability index used in our application is inspired by [
26], as shown in
Figure 6.
The sustainability index derived from
Figure 6 is then divided into three categories as shown in
Table 1. In this research, we consider the highway miles of the route as a variable. Hence, the overall sustainability index can be determined by considering the fact that the trip contains more than 75 percent of highways and the speed in MPH (miles per hour) is calculated based on the severity of the traffic status. The overall sustainability factor then is determined based on the traffic status as is shown in
Table 1. It is important to notice that the traffic severity value is color-coded as red, green and orange for 0–39, 40–70, and +70 mph, respectively, according to the traffic status. An index of (0) enhances the chance to promote a lowering of CO
2 emissions.
The sustainability color codes for this application are determined in order to compare the CO
2 emission of each route to the same destination. The green color shows that the route is sustainable, while the red color shows that the emissions of CO
2 are high. Algorithm 3 shows the extraction gas emissions.
| Algorithm 3. Pseudo code for extracting gas emissions information. |
Input: The route r to be used for calculations.
Output: The sustainability index of 0 and −1 for the best and worst emission factors, respectively. |
1 if then:
2 if / ≥ 0.75 and if is green (good):
3 return 0
4 otherwise:
5 return −1
6 otherwise (the route comprises of street thus):
7 return −1 |
3.3.4. Tollway Calculation
TollGuru is a free mobile application available for both Android and iOS that provides calculations for tolls and gas costs in various countries such as the USA, Canada, Mexico and India. They also provide a Toll API to be used by third party developers or companies in order to provide trucking freight operations, connected vehicles, rideshare services, billing, and transportation modeling for toll roads [
38]. They also provide the cheapest route to save money on trips. However, TollGuru does not automatically fetch the local gas price per gallon of gasoline. The gas price has to be manually typed in and can give unpredictable results if it is mistakenly input.
Google Maps API is able to determine if there are toll roads of the trip. However, it is not able to determine the toll cost. Initially it was difficult to determine the toll costs per trip due to the lack of free resources. Lately, TollGuru API can help to calculate the toll costs per trip. TollGuru API provides toll road information given a source and destination distance of the trip. If the trip does not contain a toll road, then it will give an empty response. However, if the trip contains toll roads, it will return a list of toll prices per each route of the trip. Algorithm 4 shows the process of how the tolls are displayed to the user.
| Algorithm 4. Pseudo code for extracting toll way information. |
Input: The route r to be used for calculations.
Output: Calculation of the trip’s toll prices. |
1 if then:
2 if / ≥ 0.75 and if is green (good):
3 return 0
4 otherwise:
5 return −1
6 otherwise (the route comprises of street thus):
7 return −1 |
Notice that there are two types of toll to consider: FasTrak and One-Time-Toll. According to the Toll Roads website, FasTrak is “an electronic tolling account that allows drivers to pay tolls automatically from a pre-established account that can be prepaid and replenished using a credit card, cash or check. In this research, both toll types are displayed to the user. While FasTrak may offer special discounts for registered users, One-Time-Toll is used for anyone willing to pay the toll price as a one-time deal.
3.4. Application Graphical User Interface (GUI)
As mentioned before, the proposed mobile application is developed in React Native. React Native is a cross-platform framework developed by [
41] to create mobile applications targeting iPhone and Android mobile phone operating systems while focusing primarily on JavaScript. While JavaScript is not only limited to being used exclusively, native code such as Objective C and Java for iOS and Android can be used in order to leverage specific use cases such as accessing a mobile phone’s hardware. The React Native is chosen because of its flexibility and ease of use to develop and evaluate this application.
When the mobile application is opened, the Login Screen shows up, asking for users’ login information. It allows users to create an account as shown in
Figure 7a. After each user creates an account, the main screen labeled ‘Home’ will be shown.
Many users are familiar with the mobile version of Google’s and Apple’s map applications. Therefore, the Home screen as shown in
Figure 7 brings them the same experience. When the Home screen is launched, it performs three steps:
By choosing the ‘Profile’ tab in the application, user can navigate to the ‘Profile’ screen as it is shown in
Figure 7d. The Profile screen shows details about the user’s profile information wherein the user will enter their vehicle MPG. By choosing the search results as shown in
Figure 7e, it displays the statistics of the application general usage. This includes the aggregation data of the daily emissions.
Figure 7f shows the Survey screen, which includes two options of Pre-drive and After drive. Pre-drive asks questions only related to before driving in order to measure the level of impact on users experiencing the mobile application. After drive does so for after using the application. These questions help understand the users’ experience prior to and post using the application.
Figure 7g,h show the vital part of the application whereby the user is given recommendations based on the searched mapped route. These recommendations include the most optimized route for travel cost and a lower emission route calculated by an algorithm following a sustainability index. Furthermore, the user is notified whether the route user has selected is good (green) or not (red), according to the metrics mentioned earlier.
The participants also have the ability to see all the information and select the most optimized route based on their own perception. After using the application for at least two weeks, they are given the second round of the questionnaire with the same questions to assess how they are affected prior to and after using the application.
4. Case Study
As a case study, the mobile phone application was used as a survey tool for collecting information and user data. To achieve the research aim and to gain deeper understanding of the mobile phone application impacts, 20 participants were selected from California State University, Long Beach. Before the experiment, consent forms were approved by the participants assuring the confidentiality of their data, using selected AWS services (AWS Cognito for the user store and AWS DynamoDB for storing additional user data). The user securely logs in using AWS Signature v4 algorithm and is later authorized via Identity and Access Management (IAM) temporary tokens. Data access is strictly limited to the researchers and developers of the mobile phone application for application development purposes.
Participants were asked to provide their personal information as well as their experience with other navigation apps like Google Maps or Apple Maps. Then they were asked to rank four essential features studied in this research before using the application. Based on their priority, they ranked features from 4 to 1 (4 being the most and 1 being the least important).
When participants log into the application, it starts to record the user’s route information such as departure and arrival locations and login duration, which is later used to calculate CO2 emissions per trip, as well as the total travel cost including toll roads. Each user was asked to use the application for at least two weeks in order to make sure that the application is used in various situations such as rush hours, and under various weather scenarios. The users complete both pre- and post-questionnaires, and their trip information are stored in Rockset, a third-party cloud tool, for further analysis.
5. Results and Discussion
Data analysis includes two main steps. The first step is to validate the accuracy of CO2 emissions calculated by the application. The second step is to measure the mobile phone application impact on users before and after using the application. Further details are discussed in the following sections.
5.1. Modeled Emissions
Validation is crucial in assessing the accuracy of the application input. This is achieved by calculating the trip CO
2 emissions according to Equation (1) and comparing it to the EPA’s public CO
2 emissions data for different vehicles [
42].
After defining emission factors in the application to measure the CO
2 emissions, five cars with different makes, models, years built, and known MPG were selected to measure the accuracy of CO
2 emissions compared to the EPA’s public CO
2 data.
Table 2 represents this comparison.
The results show that there is less than 10% difference between the CO2 emission calculated by the application comparing to the EPA data. The small difference can be caused by the variance in vehicles ages and particular condition of their engine, tire, etc. Therefore, it can be concluded that the application is reliable enough in calculating CO2 emissions, as a decision factor presented to the users to choose more environmentally friendly trip routes.
5.2. Survey Results
In order to compile and aggregate the results from the application, the data is directly stored in a third-party cloud tool called Rockset. It helps ingest the AWS data, where all the users’ data is stored, facilitating the query and analytics. The data includes the users’ trip data (i.e., trip cost and CO2 emissions) and their questionnaire responses exported as a csv file.
Table 3 and
Table 4 show the survey results before and after using the application. Including the change percentages for each transportation factor. In addition, the overall result is shown in
Figure 8, comparing the average ranking of pre-survey and after survey results.
Figure 8 illustrates the impact of the mobile phone application on the users’ decision making. As can be seen, most of the participants still consider time and traffic as their chief priority in selecting routes. However, we notice that the application has a positive impact on the other transportation factors. After using the application, participants are more inclined to consider CO
2 emissions, fuel prices, and tollways in selecting their routes. Particularly, it seems that the application has made the users more environmentally conscious. As can be seen in
Figure 8, after using the application, the travel time and traffic has a reduced priority for some of the users, which are informed of the slight difference in time and traffic levels for various route options. The same reasoning can explain the decrease of the number of users who prioritized the fuel price after using the application. Most of the routes determined to be more fuel efficient are in fact no different than others with respect to fuel consumption. The application’s impact on the priority of tollway can be skewed by the number of tolls on the road. Further information on the number of tolls can give us a better understanding of the application’s impact on prioritizing tollways in decision-making.
Furthermore, the users of the proposed application can make their own choice of route selection criteria from the available alternatives. For instance, if the user chooses time as the sole selection criterion, only faster route alternatives are given, neglecting the other two factors. On the other hand, if the user is concerned about time and fuel cost as a sustainable alternative, the user has the option to choose the route with the combination of less time and lower costs.
6. Conclusions
This research and proposed vector maps application show the advantage of discharging open information on adaptive transportation alternatives in urban areas. By providing a more clear vision of travel route alternatives, users can better decide which route to choose according to their own preferences on travel time, fuel consumption, CO2 emissions, and tolls. Users that participate in route selection based on their own preferences, rather than traveling on a given route, help to make urban transportation smarter. Finally, it is shown that the developed mobile phone application has the ability to provide a new dimension in transportation route selection, while addressing the need for more effective decision factors in smart cities transportation. This application can also be an effective tool in route planning to provide an efficient and economical transportation system if utilized by the Department of Transportation and engineers. The purpose of this research is developing the mobile phone application is to help urban citizens in their daily transportation. Although the development scope is limited (i.e., there are navigation restrictions in Google Maps API), below are a list of objectives that can be achieved by continuing this research:
Adding emissions/trip cost graphs for daily, monthly, and annual time increments.
Adding navigation.
Adding Admin portal to observe and analyze aggregated user data (ONLY available to Admin/Research personnel).
Releasing the mobile application in Android and iOS app stores.
Author Contributions
Conceptualization, V.B.; methodology, V.B. and M.A.; software, M.A.; validation, V.B., S.F. and M.A.; formal analysis, V.B.; writing—original draft preparation, V.B.; writing—review and editing, V.B. and S.F.; visualization, V.B.; supervision, V.B.; funding acquisition, V.B. All authors have read and agreed to the published version of the manuscript.
Funding
This research was funded by the Office of Research and Sponsored Programs at California State University Long Beach.
Acknowledgments
The authors would also thank the GasBuddy for providing written permission to retrieve data from their public services with the intention to “be a good net citizen”.
Conflicts of Interest
The authors declare no conflict of interest.
References
- Amouhadi, R.; Balali, V.; Zuidgeest, M.; Heydarian, A. Measuring Walkability Using a Mobile Phone Sensors and Applications. In Proceedings of the Transportation Research Board 98th Annual MeetingTransportation Research Board, Washingdon, DC, USA, 13–17 January 2019; p. 19-05297. [Google Scholar]
- Amouhadi, R.; Veliz, V.; Balali, V.; Aliasgari, M. Optimization and Decision Making for Route Selection as an Alternative of Google Maps Considering Sustainability. In Computing in Civil Engineering 2019: Smart Cities, Sustainability, and Resilience; American Society of Civil Engineers: Reston, VA, USA, 2019; pp. 359–366. [Google Scholar]
- Fathi, S.; Srinivasan, R.S. Analysis of Energy Performance of University Campus Buildings Using Statistical and Energy Modeling Approaches. In Proceedings of the 2015 Winter Simulation Conference (WSC), Huntington Beach, CA, USA, 6–9 December 2015. [Google Scholar]
- Im, H.; Srinivasan, R.; Fathi, S. Building Energy Use Prediction Owing to Climate Change: A Case Study of A University Campus. In Proceedings of the 1st ACM International Workshop on Urban Building Energy Sensing, Controls, Big Data Analysis, and Visualization, New York, NY, USA, 12 November 2019. [Google Scholar]
- Fathi, S.; Srinivasan, R.S.; Ries, R. Campus Energy Use Prediction (CEUP) Using Artificial Intelligence (AI) to Study Climate Change Impacts. In Proceedings of the 2019 Building Simulation Conference, Rome, Italy, 2–4 September 2019. [Google Scholar]
- Đinh, T.P. Smart Transportation: The Role of Big Data and Internet of Things. The 4th International Conference on Next Generation Computing. 2018. Available online: http://lib.bvu.edu.vn/bitstream/TVDHBRVT/19297/1/Smart-Transportation.pdf (accessed on 6 July 2020).
- O’Brien, O. Smart Mobility and Open Data: A Global and Personal Perspective. 2017. Available online: https://www.itdp.org/2017/11/20/smart-mobility-open-data/ (accessed on 6 July 2020).
- Le Quéré, C.; Andrew, R.M.; Friedlingstein, P.; Sitch, S.; Hauck, J.; Pongratz, J.; Pickers, P.A.; Korsbakken, J.I.; Peters, G.P.; Canadell, J.G.; et al. Global Carbon Budget 2018. Earth Syst. Sci. Data 2018, 10, 2141–2194. [Google Scholar] [CrossRef] [Green Version]
- Jackson, R.B.; Le Quéré, C.; Andrew, R.; Canadell, J.G.; I Korsbakken, J.; Liu, Z.; Peters, G.P.; Zheng, B. Global energy growth is outpacing decarbonization. Environ. Res. Lett. 2018, 13, 120401. [Google Scholar] [CrossRef]
- TRIP. Los Angeles Transportation by the Numbers. 2018. Available online: https://tripnet.org/wp-content/uploads/2018/08/CA_Los_Angeles_Transportation_by_the_Numbers_TRIP_Report_Aug_2018.pdf (accessed on 6 July 2020).
- Ünal, A.B.; Steg, L.; Gorsira, M. Values versus environmental knowledge as triggers of a process of activation of personal norms for eco-driving. Environ. Behav. 2018, 50, 1092–1118. [Google Scholar] [CrossRef] [PubMed] [Green Version]
- Choisdealbha, Á.N.; Timmons, S.; Lunn, P.D. Experimental evidence for the effects of emissions charges and efficiency information on consumer car choices. J. Clean. Prod. 2020, 254, 120140. [Google Scholar] [CrossRef]
- Rashid, K. Design, Economics, and Real-Time Optimization of a Solar/Natural Gas Hybrid Power Plant; The University of Utah: Salt Lake City, UT, USA, 2019. [Google Scholar]
- Mahanpoor, M.; Monajjem, S.; Balali, V. Sustainable highway maintenance: Optimization of existing highway vertical alignment considering pavement condition. Sustainability 2019, 11, 1659. [Google Scholar] [CrossRef] [Green Version]
- Asl, V.M.; Sadeghi, S.A.; Fathi, S. A mathematical model and solving method for multi-depot and multi-level vehicle routing problem with fuzzy time windows. Adv. Intell. Transp. Syst. 2012, 1, 19–24. [Google Scholar]
- Hilty, L.M.; Aebischer, B. ICT Innovations for Sustainability; Springer: Berlin/Heidelberg, Germany, 2015; Volume 310. [Google Scholar]
- Albino, V.; Berardi, U.; Dangelico, R.M. Smart cities: Definitions, dimensions, performance, and initiatives. J. Urban Technol. 2015, 22, 3–21. [Google Scholar] [CrossRef]
- Connelly, M.J. Fatal Misconception: The Struggle to Control World Population; Harvard University Press: Cambridge, MA, USA, 2009. [Google Scholar]
- Iia. Research Peek of the Week: Smartphone Users in the US Expected to Reach Over 270 Million by 2022. 2018. Available online: https://internetinnovation.org/general/research-peek-of-the-week-smartphone-users-in-the-us-expected-to-reach-over-270-million-by-2020/ (accessed on 6 July 2020).
- Balali, V.; Zalavadia, A.; Heydarian, A. Real-Time Interaction and Cost Estimating within Immersive Virtual Environments. J. Constr. Eng. Manag. 2020, 146, 04019098. [Google Scholar] [CrossRef]
- Xiong, Z.; Sheng, H.; Rong, W.G.; Cooper, D.E. Intelligent transportation systems for smart cities: A progress review. Sci. China Inf. Sci. 2012, 55, 2908–2914. [Google Scholar] [CrossRef] [Green Version]
- Fathi, S.; Srinivasan, R.; Kibert, C.J.; Steiner, R.L.; Demirezen, E. AI-Based Campus Energy Use Prediction for Assessing the Effects of Climate Change. Sustainability 2020, 12, 3223. [Google Scholar] [CrossRef] [Green Version]
- Fathi, S.; Srinivasan, R.S. Climate Change Impacts on Campus Buildings Energy Use: An AI-Based Scenario Analysis. In Proceedings of the 1st ACM International Workshop on Urban Building Energy Sensing, Controls, Big Data Analysis, and Visualization, New York, NY, USA, 10 November 2019. [Google Scholar]
- Council, H.-G.A. Methodology for Estimating Greenhouse Gas Emissions and Assessing Mitigation Options for Project Level Applications for On-Road Mobile Sources. 2011. Available online: https://groups.tti.tamu.edu/airquality/files/2010/11/HGAC.pdf (accessed on 6 July 2020).
- Le, T.H. Historical Overview of Climate Change Science. 2007. Available online: https://ci.nii.ac.jp/naid/10024874143/ (accessed on 6 July 2020).
- Barth, M.; Boriboonsomsin, K. Traffic Congestion and Greenhouse Gases. 2009. Available online: https://escholarship.org/uc/item/3vz7t3db (accessed on 6 July 2020).
- NCHRP. 2000. Available online: http://www.trb.org/Publications/PubsNCHRPPublications.aspx (accessed on 6 July 2020).
- Cicero-Fernández, P.; Long, J.R.; Winer, A.M. Effects of grades and other loads on on-road emissions of hydrocarbons and carbon monoxide. J. Air Waste Manag. Assoc. 1997, 47, 898–904. [Google Scholar] [CrossRef] [PubMed] [Green Version]
- Park, S.; Rakha, H. Energy and environmental impacts of roadway grades. Transp. Res. Rec. 2006, 1987, 148–160. [Google Scholar] [CrossRef]
- Miller, S.M.; Wofsy, S.C.; Michalak, A.M.; Kort, E.A.; Andrews, A.E.; Biraud, S.C.; Dlugokencky, E.J.; Eluszkiewicz, J.; Fischer, M.L.; Janssens-Maenhout, G.; et al. Anthropogenic emissions of methane in the United States. Proc. Natl. Acad. Sci. USA 2013, 110, 20018–20022. [Google Scholar] [CrossRef] [Green Version]
- EPA. Inventory of U.S. Greenhouse Gas Emissions and Sinks. 2018. Available online: https://www.epa.gov/ghgemissions/inventory-us-greenhouse-gas-emissions-and-sinks (accessed on 6 July 2020).
- EPA. Sources of Greenhouse Gas Emissions. 2017. Available online: https://www.epa.gov/ghgemissions/sources-greenhouse-gas-emissions (accessed on 6 July 2020).
- Jabali, O.; van Woensel, T.; de Kok, A.G. Analysis of travel times and CO2 emissions in time-dependent vehicle routing. Prod. Oper. Manag. 2012, 21, 1060–1074. [Google Scholar] [CrossRef]
- Zambrano-Martinez, J.L.; Calafate, C.; Soler, D.; Zuñiga, L.L.; Cano, J.-C.; Manzoni, P.; Gayraud, T. A Centralized Route-Management Solution for Autonomous Vehicles in Urban Areas. Electronics 2019, 8, 722. [Google Scholar] [CrossRef] [Green Version]
- Fathi, S.; Srinivasan, R.S.; Fenner, A. Machine learning applications in urban building energy performance forecasting: A systematic review. Renew. Sustain. Energy Rev. 2019. [CrossRef]
- AOSSIE. Carbon Footprint for Google Maps. 2019. Available online: https://sites.google.com/site/mapsfootprint/ (accessed on 6 July 2020).
- DOE. Truck Stop Electrification for Heavy-Duty Trucks. 2018. Available online: https://afdc.energy.gov/conserve/idle_reduction_electrification.html (accessed on 6 July 2020).
- TollGuru. Toll Calculator and Gas Calculator. 2018. Available online: https://tollguru.com/ (accessed on 9 September 2018).
- Mahanpoor, M.; Monajjem, S.; Balali, V. An optimization model for synchronous road geometric and pavement enhancements. J. Traffic Transp. Eng. 2020. [Google Scholar] [CrossRef]
- GasBuddy. Find The Nearest Gas Stations & Cheapest Prices. 2019. Available online: https://www.gasbuddy.com/ (accessed on 9 September 2018).
- Occhino, T. React Native: Bringing Modern Web Techniques to Mobile. 2015. Available online: https://code.facebook.com/posts/1014532261909640/react-nativebringing-modern-web-techniques-to-mobile (accessed on 9 September 2018).
- EPA. Greenhouse Gas Emissions from a Typical Passenger Vehicle. 2014. Available online: https://nepis.epa.gov/Exe/ZyNET.exe/P100LQ99.TXT?ZyActionD=ZyDocument&Client=EPA&Index=2011+Thru+2015&Docs=&Query=&Time=&EndTime=&SearchMethod=1&TocRestrict=n&Toc=&TocEntry=&QField=&QFieldYear=&QFieldMonth=&QFieldDay=&IntQFieldOp=0&ExtQFieldOp=0&XmlQuery=&File=D%3A%5Czyfiles%5CIndex%20Data%5C11thru15%5CTxt%5C00000014%5CP100LQ99.txt&User=ANONYMOUS&Password=anonymous&SortMethod=h%7C-&MaximumDocuments=1&FuzzyDegree=0&ImageQuality=r75g8/r75g8/x150y150g16/i425&Display=hpfr&DefSeekPage=x&SearchBack=ZyActionL&Back=ZyActionS&BackDesc=Results%20page&MaximumPages=1&ZyEntry=1&SeekPage=x&ZyPURL (accessed on 9 September 2018).
© 2020 by the authors. Licensee MDPI, Basel, Switzerland. This article is an open access article distributed under the terms and conditions of the Creative Commons Attribution (CC BY) license (http://creativecommons.org/licenses/by/4.0/).


