Article

Using Intelligence Green Building Materials to Evaluate Color Change Performance

1
Department of Architecture, National Taiwan University of Science and Technology, Taipei 10607, Taiwan
2
College of Intelligence, National Taichung University of Science and Technology, Taichung 40401, Taiwan
3
Department of Landscape Architecture and Environmental Planning, MingDao University, Changhua 10617, Taiwan
*
Author to whom correspondence should be addressed.
Sustainability 2020, 12(14), 5630; https://doi.org/10.3390/su12145630
Submission received: 7 May 2020 / Revised: 22 June 2020 / Accepted: 1 July 2020 / Published: 13 July 2020

Abstract

:
Environmental protection is an important issue in modern society. Most construction demolition wastes cannot be easily decomposed, thus occupying a lot of space in landfill. Reducing the demand for new resources is an efficient approach to decrease the environmental burden. Most green buildings are made from reused and recycled materials. Although there are a variety of green building materials available on the market, there is no material, as yet, with thermochromic functionality. This study used a form of face bricks, and six recovered materials, including wood chips, iron powder, fallen leaves, concrete, newspaper, and silt, to make smart green building materials. The modules were made in accordance with Taiwan’s green building material regulations. The discoloration efficiency of indoor and outdoor green building materials was tested, and the RGB (red, green, blue) values of the face bricks were measured by a color analyzer to observe the discoloration effect. The findings show that among the A, B, C, and D groups, Group D exhibited the optimal rate of change in color, and the rates of change in the six recycled waste materials of indoor Group D were wood chips > newspaper > fallen leaves > concrete > iron powder > silt, while the rates of change in the outdoor group were newspaper > wood chips > fallen leaves. This study successfully reused waste materials to reduce the environmental burden, achieve sustainable environmental protection, and ensure both the aesthetics and quality of the building materials. The results of this study can offer an alternative choice to architects or space designers when selecting green building materials.

1. Introduction

While increased attention is being paid to environmental issues in current times, the issue of the waste reused and recycled has been widely discussed. Most of the wastes from our daily life or construction demolition cannot be easily decomposed, thus occupying more and more space in landfill. Reused or recycled products can be used to reduce the environmental burden. In China, construction and demolition waste accounts for about 30–40% of total waste production, and there is a large potential demand for recycled material [1]. Solid wastes cause serious problems in Asian countries and better solid waste management is needed [2]. In Europe, construction demolition waste accounts for approximately 25–30% of all waste generated in the European Union (EU), and the EU requested that its members reuse or recycle construction demolition waste to achieve 70% recycling rates by 2020 [3]. Taiwan’s highly developed social economy and city construction have led to a large amount of construction waste every year, and effective recovery systems are needed for the proper use of these wasted resources [4]. The cyclic utilization of resources contributes to lessening the environmental load, creates an effective decline in the consumption of waste landfill space, decreases CO2 emissions, and implements energy saving and carbon reduction [5]. Reuse, recycling, and reduction of the use of construction materials is the most effective way to solve the waste problem [6], and thus, developing competitive recycled materials could benefit the construction industry. Moreover, many landfills are at full capacity, and the high cost of fees increases the need to create a sustainable-resource construction industry [7]. Applying zero waste concepts to manage construction demolition waste would lead to a great improvement in waste management [8]. The recycled concrete bricks can be used in the seismic design of multi-layer masonry buildings [9]. However, as the strength of the bonding mortar increased, the bearing capacity and deformability of reclaimed concrete brickwork increased, leading to an increase in the elastic modulus. The hybrid recycling of green building materials and the use of different industrial or domestic general wastes according to the items of building materials and usable waste materials showed that the recycling of green building materials had a blending ratio [10].
In terms of lightweight concrete panels, the ratio of waste materials other than cement should be higher than 50%. Nearly 40% of the resources from building demolition were reused, while the remaining 60% were sent to landfills. If 60% of waste resources could be completely reused, the effect of demolition on the environment could be reduced [11,12,13]. As per the Building Technical Regulations of Taiwan, the indoor usage rate of green building materials should be more than 60% of the total area, and the outdoor usage rate of green building materials should be more than 20% of the total area [14]. The use of green building materials has gained increased attention, and there have been different green face-brick products available on the market; however, there are no reports regarding their thermochromic functions.
Different temperature control factors have resulted in thermochromic materials at different temperatures, which could be mixed with other pigments, and have no color at high temperatures and color development at low temperatures. These thermochromic materials could change color by controlling the temperature, solvent polarity, and pH by rearranging the molecules [15]. We overprinted 15 colors of thermochromic materials by screen printing and observed 255 different trapping effects [16]. In order to create a nondestructive testing (NDT) method for RC components that reinforce bar position, [17] coated a thermochromic paint on a concrete specimen surface, and defined the different thermal conductivities of the reinforcing bars and concrete, which induced differences in color change. The thermochromic material could be applied to medical treatments, lenses, and packaging, and presented the potential of color changing products [18]. To control the reversibility of color change for thin film technology, solar sanitization was also used in [19].
Thermochromic green building materials control the color-changing mechanism of allochroic microcapsules, mainly by temperature; thus, the average temperatures of different locations in Taiwan should be determined. According to [20], northern Taiwan has the lowest annual mean temperature of 9.9 °C and the highest mean temperature of 39.3 °C; central Taiwan has the lowest mean temperature of 11.3 °C and the highest mean temperature of 31.8 °C; southern Taiwan has the lowest mean temperature of 12.0 °C and the highest mean temperature of 35.7 °C; eastern Taiwan has the lowest mean temperature of 11.3 °C and the highest mean temperature of 36.3 °C. According to the above air temperature variation ranges of different regions in Taiwan, the reference frame of the ambient temperature for the indoor simulation experiment was set as 9–40 °C. Mixed waste materials with gypsum and allochroic powder to make thermochromic face bricks; however, the strength of the material required further enhancement [21,22]. White cement as the primary material and doped it with thermochromic pigment to test the strength [23]. The experimental result showed that, while the setting time and stability of the cement were not influenced, when the normal water content in the cement paste was increased by about 13%, the mechanical properties of bending strength and compressive strength were degraded by 20%–40%. The thermal conductivity of cement was 0.78, and it had a fairly good thermal insulation effect among different materials, as well as a strong material structure, high plasticity, good weather resistance, and is resistant to fire; thus, it could be extensively used [24]. Cement board has a high thermal insulation effect, and white cement has high quality, better strength than common gray cement, very strong miscibility, and more optional pigments and admixtures. The three primary colors of light colors are created with ”additive mixtures”, specifically by mixing the three primary colors of light, such as R + G = yellow, G + B = cyan, and B + R = magenta, and the “subtractive color mixture”, where the three pigments added up to black. In order to unify the definition of light colors, in 1931, the International Commission on Illumination defined the standard wavelengths of RGB (red, green, blue) as 700.0 nm, 546.1 nm, and 435.8 nm, respectively. The hue values of three primary colors are defined as yellow (R = 255, G = 255, B = 0), blue (R = 0, G = 0, B = 255), and red (R = 255, G = 0, B = 0) [25]. A study used a color analyzer to measure the RGB values and HSL (hue, saturation, and lightness) values of object surface color, and analyzed the surface coatings of different cement mortar specimens [25]. We applied the filling of Mater-Bi to nanoclays to enhance the biofilm rigidity [26]. We developed biohybrid materials based on halloysite, sepiolite and cellulose nanofibers, to change the materials’ character [27]. However, to date, there is no report of allochroic green building material made of white cement mixed with transparent silicon and waste. Hence, this study mixed white cement with waste and transparent silicon, in order to change the material color and make it more apparent.

2. Materials and Methods

2.1. Materials

The production of recycling green building materials should follow a certain blending ratio, which is as high as 50% of waste, in accordance to related regulations for production, indoors and outdoors experimental analyses [11,12,
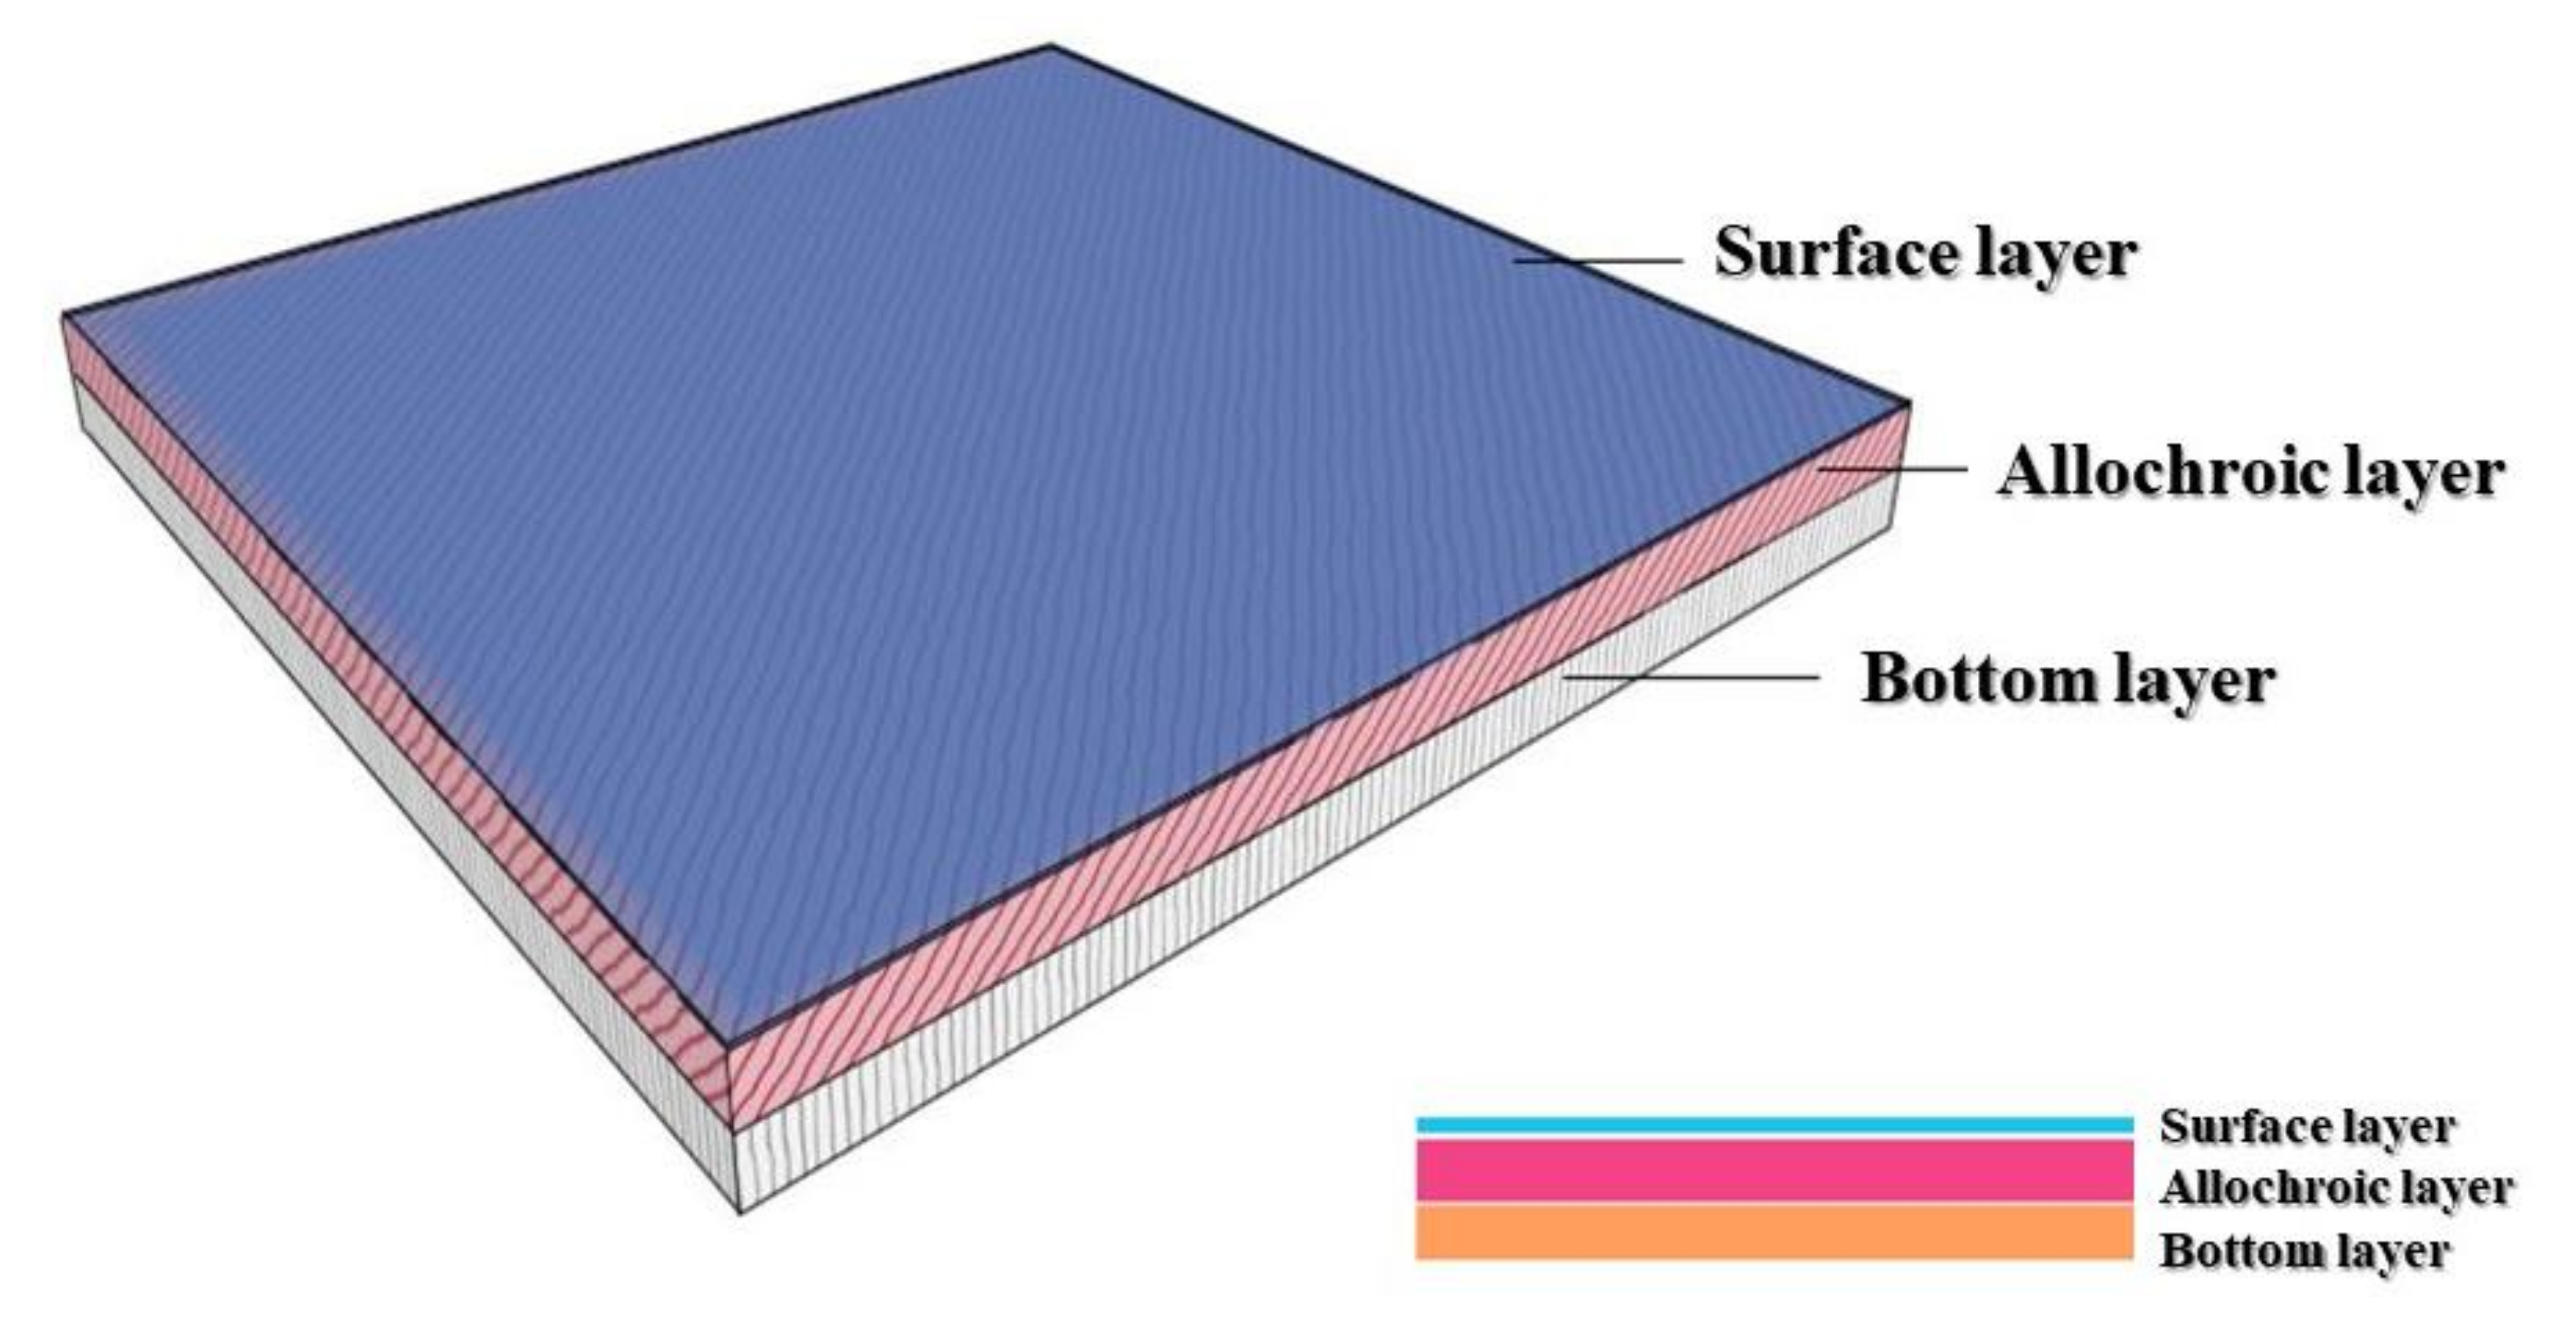
13]. Moreover, the effects of color change should also be compared. In this study, the smart green building materials were made into a face brick, which contained 60% of waste materials. The size of the face brick was 4.5 cm × 4.5 cm × 1 cm. The face brick was divided, from bottom to top, into three layers, namely the bottom layer, the allochroic layer, and the surface layer (Figure 1).
Regarding the bottom layer, the wastes were made into micromolecules smaller than 0.3 cm and mixed with white cement and water, where the proportions were white cement 15 g (25%), waste 36 g (60%), and water 9 g (15%), as well as 0.5 ml of antioxidants and stabilizers, respectively, which were mixed for about 1 min and poured into 1.19 cm thick molds. Regarding the allochroic layer, silicon was used, as it has favorable plasticity, is resistant to weather, UV, and ozone, is neutral, and does not influence the deterioration of the material. Moreover, as it has favorable viscosity for most building materials, there is no aging or cracking, and it can bear a temperature range of −60~150 °C. The allochroic powder 1.5–2 g (8%) was mixed with 11.25–15 g (60%) of transparent silicon and 6–8 g (32%) of water, to make the allochroic layer, which was 0.3 cm thick and required a drying time of nearly 24 h. The surface protection coating consisted of a 0.01 cm thick weather-resistant surface protection coating of Plimates P226 waterproofing paint.
Six kinds of recycled waste materials and four types of allochroic powders of different percentages were used; thus, 24 face bricks were made for experimental modules. The 24 face bricks were divided into four groups (ABCD), according to different allochroic powder blending ratios (Table 1). Group A consisted of common orange pigment (0.5 g model: acryliuqe301) added allochroic powder (Blue 25 °C, 2g); Group B consisted of allochroic powder at two different temperatures (Yellow 33 °C, 1 g; Blue 25 °C, 1 g); Group C consisted of allochroic powder at three different temperatures (Yellow 33 °C, 0.5 g; Blue 25 °C, 0.5 g; and Red 20 °C, 0.5 g); Group D consisted of allochroic powder at three different temperatures (Yellow 43 °C, 0.5 g; Blue 31 °C, 0.5 g; Red 20 °C, 0.5 g) (Table 2).
While the fallen leaves, newspaper, and concrete required pre-operation, the six recycled waste materials were identical. The newspaper and fallen leaves were torn up, mashed in a juicer, soaked in water, and drained for about one week. In order to reduce the content of chlorophyll and newspaper ink in the material, and enhance the coloration effect, the water was changed about every 12 hours during soaking. Before mixing, the concrete was scrapped, but not powdered; otherwise, the pH level of the concrete would influence the color change. The diameter was controlled within 0.2 cm by screening after knocking, followed by washing and draining. The silicon was not provided with the allochroic layer until the bottom layer was semidry (water content 25–45%). The allochroic powder was dissolved in water and mixed with silicon after uniform color mixing, in order to make the color uniform. It was then mixed with waste material in particle sizes smaller than 0.1 cm, and finally, the allochroic layer was prepared in the ratio of 1:1. The color analyzer TECPEL Tech-Link-TES 135 (TES Electrical Electronic Corp., Taipei, Taiwan) was used for RGB color analysis, and a digital thermometer was used for brick temperature measurement, where the temperature measurement range was –10 °C to + 70 °C. Images were acquired using a Sony DSC-W620 digital camera (14.1 megapixels). Soil moisture and a DM-15 acidity meter were used to estimate the water content for brick preparation.

2.2. Methods

This experiment was divided into indoor temperature change (both rise and drop) simulation, and actual outdoor temperature measurement, where the range of simulated temperature change was 9 °C–40 °C. In the temperature rise test, the face brick was affixed to the wall, an electric heater (Sampo HX-FB10F) was placed 20 cm in front of the face brick, and electronic thermometers were affixed to the wall and face brick to measure the indoor temperature, and the face brick surface layer temperature. The time of temperature change was recorded. In the temperature drop test, ice cubes were placed in a measuring cup and covered with a plastic cloth to avoid direct contact with the face brick, then the face brick was placed above the cup, an electronic thermometer was affixed to the surface of the face brick, and the time of temperature change was recorded. The RGB measurement was performed by a color analyzer when the temperature increased or dropped by one degree (data domain: 0–255), and the difference was estimated. In the outdoor experiment, the observation time was 5 a.m. to 10 p.m., where the face brick with the best effect was placed outdoors and irradiated by sunlight, and the RGB values were measured per hour. Regarding the indoor and outdoor measurements, the color analyzer was affixed to the brick surface, measurements were rapidly performed five times, and the average was taken. The data can provide a basis for the design of indoor and outdoor setups in the future.

3. Results

3.1. Test for Indoors Discoloration Efficiency of ABCD Groups

The 9 °C–40 °C RGB rates of change of six recycled waste materials of Group A are presented in Figure 2. The highest rates of change in R value were fallen leaves (73%) and wood chips (58%), and the lowest rate of change was iron powder (26%). The rates of change of R value from high to low were fallen leaves > wood chips > concrete > newspaper > silt > iron powder. The highest rates of change in G values were fallen leaves (21%) and wood chips (20%), and the lowest was silt (9%). The rates of change of G value were in the order of fallen leaves > wood chips > concrete > newspaper > iron powder > silt. The highest rate of change in B values was fallen leaves (16%), and the lowest rate of change was iron powder (3%). The rates of change of B value were leaves > wood chips > concrete > silt > newspaper > iron powder (Table 3).
The RGB rates of change of six recycled waste materials of Group B at 9 °C–40 °C are shown in Figure 3. The highest rates of change in R value were fallen leaves (81%) and wood chips (85%), and the lowest rate of change was iron powder (26%). The rates of change of R value from high to low were wood chips > fallen leaves > newspaper > concrete > silt > iron powder. The highest rate of change in G value was fallen leaves (59%), and the lowest were silt and newspaper (32%). The rates of change of G value were in the order of fallen leaves > wood chips > concrete > iron powder > newspaper > silt. The highest rate of change in B value was concrete (31%), and the lowest was silt (9%). The rates of change of B value were concrete > Iron powder > newspaper > wood chips > fallen leaves > silt (Table 4).
The RGB rates of change of six recycled waste materials of Group C at 9–40 °C are shown in Figure 4. The highest rates of change in R value were for wood chips (97%) and fallen leaves (80%); the lowest rate of change was iron powder (21%). The rates of change of R value from high to low were wood chips > fallen leaves > newspaper > concrete > Silt > iron powder. The highest rates of change in G value were fallen leaves (66%) and wood chips (63%), and the lowest was iron powder (22%). The rates of change of G value were in order of fallen leaves > wood chips > concrete > newspaper > silt > iron powder. The highest rates of change in B value were for fallen leaves (57%) and wood chips (49%), and the lowest was iron powder (7%). The rates of change of B value were fallen leaves > wood chips > newspaper > silt > concrete > iron powder (Table 5).
The 9–40 °C RGB rates of change of six recycled waste materials of Group D are shown in Figure 5. The highest rates of change in R value were fallen leaves (99%) and wood chips (88%), and the lowest rate of change was concrete (30%). The rates of change of R value from high to low were in the order of fallen leaves > wood chips > newspaper > silt > iron powder > concrete. The highest rate of change in G value was wood chips (81%), and the lowest was concrete (30%). The rates of change of G value were in the order of wood chips > newspaper > fallen leaves > silt > iron powder > concrete. The highest rate of change in B value was wood chips (52%), and the lowest rate of change was iron powder (16%). The rates of change of B value were wood chips > fallen leaves > newspaper > silt > concrete > iron powder (Table 6).
Therefore, the amounts, specifications, and combinations of allochroic powders and the changes in color of the end products resulted in different RGB color change effects and rates of change. Cumulatively, the rates of change in color were in descending order: Group D > Group C > Group B > Group A.

3.2. Color Analysis Diagram for RGB Color Change Among ABCD Groups

The RGB of smart green building material was evaluated by a color analyzer, and the data were integrated, before displaying the actual colors by Photoshop. The color gradual transition process of Group A recycled waste material was relatively dark in general. Due to contrast color, the color difference was relatively apparent at low temperature, with an overall poor effect. The wood chips, fallen leaves, and newspaper of Group B gave brighter colors than in the Group ACD, and they were displayed in blue at low temperatures. However, the iron powder, silt and concrete were displayed in dark purple at low temperature. The thermochromic microcapsule was colorless at high temperature and developed at low temperature; therefore, Group C appeared bright at high temperature. At 25–40 °C, the color of Group C began to fix. According to the color mixing principle, when the temperature was low, yellow + blue appeared to be green, but green + red appeared to be dark brown, and the color darkened. Group D appeared to be light green and light yellow at up to 30 °C, because of yellow allochroic microcapsule at 43 °C, and blue allochroic microcapsule at 31 °C (Figure 6).

3.3. Outdoor Group D Discoloration Efficiency Test

The outdoor experiment found that the wood chips, newspaper, and fallen leaves exhibited the best color change effect. The discoloration range of Group D was wider than Groups A, B, and C; therefore, they were applicable for outdoor use and the gradual color transition process could be displayed by Adobe Photoshop. In terms of the amplitude of variations in the RGB values of the wood chips of Group D in the outdoor experiment, the R, G, and B values were 58%, 27%, and 14%, respectively, the maximum values of R, G, and B were 231.1, 239.1, and 172.6, respectively. The colors were yellow to green in general. In terms of the amplitude of variations in the RGB values of the newspaper of Group D in the outdoor experiment, the R, G, and B values were 58%, 40%, and 25%, respectively, and with an apparent overall amplitude of variation. In this case, the maximum values of R, G, and B were 239.3, 255, and 183.5, respectively, and in terms of the amplitude of variation, the R, G, and B values were 36%, 16%, and 7%, respectively, and with the least apparent overall amplitude of variation among the three groups. The maximum values of R, G, and B were 242.2, 234.7, and 175.3, respectively, as shown in Figure 7.
According to the outdoor experimental data of the three groups, newspaper exhibited the largest amplitude of variation. The rate of change in the R value of newspaper and wood chips was 58%, the difference in G value was 13%, and the difference in B value was 11% (Table 7). Therefore, newspaper provided the best overall effect, followed by wood chips, and then fallen leaves, as shown in Table 7.

4. Discussion

This study prepared and tested six waste materials as smart green building materials, including iron powder, newspaper, fallen leaves, silt, wood chips, and concrete. Although fallen leaves, newspaper, and concrete required more preparation in the production process, the finished materials had good structural properties and discoloration effect. Moreover, as iron powder may be rusted by water, the chroma and lightness of the discoloration of the green building materials could be reduced, resulting in a special color effect. In terms of the discoloration effect, as Group C and Group D were mixed with multistage allochroic powder, they had a better abundance of hue change during discoloration than Group A and Group B. Due to the properties of wood chips, fallen leaves, and newspaper, these materials had a better discoloration effect than iron powder, silt, and concrete. The discoloration differences among the materials can be observed in Figure 6, which may be due to the colors and pH of iron powder, silt, and concrete influencing the abundance of discoloration hue. According to the outdoor measurement of the smart green building materials, newspaper has the best overall discoloration effect, followed by wood chips. Based on the results, newspaper and wood chips are recommended to be processed into green building materials.

5. Conclusions

According to the results of the indoor experiment, the highest rate of change in RGB was exhibited by Group D. The rates of change of six materials of Group D were in the order of wood chips > newspaper > fallen leaves > concrete > iron powder > silt. When the outdoor temperature difference in the daytime was 8 °C, the experimental rates of change were in the order of newspaper > wood chips > fallen leaves. According to the indoor and outdoor data, the allochroic powder has a discolored reaction under external environmental disturbance. As indicated, as long as the preset temperature of allochroic powder was reached, the face brick would change color. These experimental results can provide a reference to architects or space designers when designing different spaces. The strength of green building materials, which includes compressive strength, bending resistance, tensile strength, thermal insulation performance, and sound insulation performance, will be the direction of our further research.

Author Contributions

Conceptualization, Y.-L.L., Y.-H.C., and C.-Y.L.; methodology, Y.-L.L., Y.-H.C., J.-L.L. and C.-Y.L.; software, Y.-L.L., Y.-H.C., J.-L.L. and C.-Y.L.; validation, Y.-L.L., Y.-H.C., J.-L.L. and C.-Y.L.; formal analysis, Y.-L.L., Y.-H.C., J.-L.L. and C.-Y.L.; investigation, Y.-L.L., Y.-H.C., J.-L.L. and C.-Y.L.; resources, Y.-L.L., Y.-H.C., and C.-Y.L.; data curation, Y.-L.L., Y.-H.C., J.-L.L. and C.-Y.L.; writing—original draft preparation, Y.-L.L., Y.-H.C., J.-L.L. and C.-Y.L.; writing—review and editing, Y.-L.L., Y.-H.C., J.-L.L. and C.-Y.L.; visualization, Y.-L.L., Y.-H.C., J.-L.L. and C.-Y.L.; supervision, Y.-L.L., Y.-H.C., J.-L.L. and C.-Y.L.; project administration, Y.-L.L., Y.-H.C., J.-L.L. and C.-Y.L.; funding acquisition, Y.-L.L., Y.-H.C., J.-L.L. and C.-Y.L. All authors have read and agreed to the published version of the manuscript.

Funding

This research was funded by Ministry of Science and Technology, Taiwan, MOST 103-2221-E-451-008.

Acknowledgments

This work was supported by the Ministry of Science and Technology, Taiwan (MOST 103-2221-E-451-008).

Conflicts of Interest

The authors declare no conflict of interest.

References

  1. Seeboth, A.; Lötzsch, D.; Ruhmann, R. First example of a non-toxic thermochromic polymer material—Based on a novel mechanism. J. Mater. Chem. C 2013, 1, 2811. [Google Scholar] [CrossRef] [Green Version]
  2. Chang, Y.-H.; Huang, P.-H.; Chuang, T.-F. A Pilot Study of the Color Performance of Recycling Green Building Materials. J. Build. Eng. 2016, 7, 114–120. [Google Scholar] [CrossRef]
  3. Chang, Y.-H.; Huang, P.-H.; Wu, B.-Y.; Chang, S.-W. A study on the color change benefits of sustainable green building materials. Constr. Build. Mater. 2015, 83, 1–6. [Google Scholar] [CrossRef]
  4. Chang, Y.S. Waste Input-Output Analysis of CO2 Emission and Waste Recycling in Taiwan. Master’s Thesis, Institute of Environmental Engineering, National Central University, Taiwan, 2008. [Google Scholar]
  5. Chowdhury, M.A.; Joshi, M.; Butola, B.S. Photochromic and Thermochromic Colorants in Textile Applications. J. Eng. Fibers Fabr. 2014, 9, 107. [Google Scholar] [CrossRef]
  6. Huang, R.Y.; Li, C.D. Development of a recycling and reuse system for building demolition wastes. J. Technol. 2005, 20, 91–106. [Google Scholar]
  7. Kim, J.; Rigdon, B. Qualities Use and Examples of Sustainable Building Materials; National Pollution Prevention Center for Higher Education: Ann Arbor, MI, USA, 1998; pp. 322–323. [Google Scholar]
  8. Lötzsch, D. Thermochromic Biopolymer Based on Natural Anthocyanidin Dyes. Open J. Polym. Chem. 2013, 3, 43–47. [Google Scholar] [CrossRef]
  9. Ma, Y.; Zhu, B. Research on the preparation of reversibly thermochromic cement based materials at normal temperature. Cem. Concr. Res. 2009, 39, 90–94. [Google Scholar] [CrossRef]
  10. Roulet, C.A. Indoor environment quality and energy use in buildings. Energy Environ. 2001, 33, 183–191. [Google Scholar]
  11. Zhang, F. Framework for Building Design Recyclability; University of Kansas, School of Engineering: Lawrence, KS, USA, 2008; pp. 211–212. [Google Scholar]
  12. Lin, Y.C. The Application of Industry Waste Wood Chip for Use in Green Material—Case Study for Light Weight Concrete. Master’s Thesis, Institute for Disaster Prevention Technology, Southeast University of Science and Technology, Nanjing, China, 2012. [Google Scholar]
  13. New Prismatic Enterprise Co., Ltd. 2012. Available online: http://www.colorchange.com.tw/zhtw/index.php/ (accessed on 22 June 2019).
  14. Central Meteorological Administration. 2020. Available online: https://www.cwb.gov.tw/V8/C/ (accessed on 22 June 2019).
  15. Wu, H.T. A Feasibility Study of Thermal Sensitive Coating as Alternative Steel Bar Position Testing for RC Members. Master Thesis, Department of Civil Engineering, National Jiao Tong University, Shanghai, China, 2010. [Google Scholar]
  16. Chang, C.Y. Thermochromic Material Experiment and Design Application. Master’s Thesis, Visual Communication Design Institute, Ling Tung University of Science and Technology, Taichung, Taiwan, 2012. [Google Scholar]
  17. Chang-chian, S.Y. Fundamental Research on Improvement of Urban Heat Island Effect—Effect of Thermophysical Properties on Surface Temperature. Master’s Thesis, Department of Civil and Ecological Engineering, I-Shou University, Taiwan, 2009. [Google Scholar]
  18. Cao, W.L.; Wang, Q.; Zhou, Z.Y.; Dong, H.Y. Experimental Study on Compression Performance of Recycled Concrete Brick Masonry. World Earthq. Eng. 2011, 27, 17–22. [Google Scholar]
  19. Chen, C.C. Introduction to Architectural Physics; Chansbook: Taipei, Taiwan, 2018. [Google Scholar]
  20. Lu, J.J. Synthetic Studies on Temperature Sensitive Dyes. Master’s Thesis, Department of Applied Chemistry, Chaoyang University of Science and Technology , Wufeng, Taichung, Taiwan, 2008; pp. 29–30. [Google Scholar]
  21. Cavallaro, G.; Lazzara, G.; Lisuzzo, L.; Milioto, S.; Parisi, F. Filling of Mater-Bi with Nanoclays to Enhance the Biofilm Rigidity. J. Funct. Biomater. 2018, 9, 60. [Google Scholar] [CrossRef] [PubMed] [Green Version]
  22. Lorenzo, L.; Bernd, W.; Giulia, L.D.; Giuseppe, L.; Gustavo, D.R.; Pilar, A.; Eduardo, R. Functional biohybrid materials based on halloysite, sepiolite and cellulose nanofibers for health applications. Dalton Trans. 2020, 49, 3830–3840. [Google Scholar]
  23. Zhao, W.; Leeftink, R.; Rotter, V.S. Evaluation of the economic feasibility for the recycling of construction and demolition waste in China—The case of Chongqing. Resour. Conserv. Recycl. 2010, 54, 377–389. [Google Scholar] [CrossRef]
  24. Idris, A.; Inanc, B.; Hassan, M.N. Overview of waste disposal and landfills/dumps in Asian countries. J. Mater. Cycles Waste Manag. 2004, 6, 104–110. [Google Scholar] [CrossRef]
  25. BIO Intelligence Service. Implementing EU Waste Legislation for Green Growth; Final Report prepared for European Commission DG ENV; BIO Intelligence Service: Paris, France, 2011. [Google Scholar]
  26. BIO Intelligence Service. Service Contract on Management of Construction and Demolition Waste—SR1; Final Report prepared for European Commission DG ENV; BIO Intelligence Service: Paris, France, 2011. [Google Scholar]
  27. Tam, V.W.; Tam, C.M. A review on the viable technology for construction waste recycling. Resour. Conserv. Recycl. 2006, 47, 209–221. [Google Scholar] [CrossRef] [Green Version]
Figure 1. The layering and configuration of face brick
Sustainability 12 05630 g001
Figure 2. Group A; RGB discoloration performance.
Sustainability 12 05630 g002
Figure 3. Group B RGB discoloration performance.
Sustainability 12 05630 g003
Figure 4. Group C RGB discoloration performance.
Sustainability 12 05630 g004
Figure 5. Group D RGB discoloration performance.
Sustainability 12 05630 g005
Figure 6. Group A to D discoloration process of green building materials.
Sustainability 12 05630 g006
Figure 7. Group D outdoor RGB.
Sustainability 12 05630 g007
Table 1. Intelligent Green Building Materials.
GroupsABCD
Materials
Iron powder Sustainability 12 05630 i001 Sustainability 12 05630 i002 Sustainability 12 05630 i003 Sustainability 12 05630 i004
Newspaper Sustainability 12 05630 i005 Sustainability 12 05630 i006 Sustainability 12 05630 i007 Sustainability 12 05630 i008
Silt Sustainability 12 05630 i009 Sustainability 12 05630 i010 Sustainability 12 05630 i011 Sustainability 12 05630 i012
Wood chips Sustainability 12 05630 i013 Sustainability 12 05630 i014 Sustainability 12 05630 i015 Sustainability 12 05630 i016
Fallen leaves Sustainability 12 05630 i017 Sustainability 12 05630 i018 Sustainability 12 05630 i019 Sustainability 12 05630 i020
Concrete Sustainability 12 05630 i021 Sustainability 12 05630 i022 Sustainability 12 05630 i023 Sustainability 12 05630 i024
Table 2. Set up allochroic powder at different temperatures of groups A, B, C, and D.
ColorABCD
Yellow 33 °C (1 g)33 °C (0.5 g)43°C (0.5 g)
Blue25°C (2 g)2 °C (1 g)25 °C (0.5 g)31 °C (0.5 g)
Red 20 °C (0.5 g)20 °C (0.5 g)
Table 3. Group A green building materials discoloration rate of 9 ℃ to 40 ℃ RGB.
MaterialsWood ChipsIron PowderFallen LeavesSiltNewspaperConcrete
RGB
R58%26%73%28%39%45%
G20%14%21%9%17%20%
B14%3%16%11%8%13%
Table 4. Group B; green building materials discoloration rate of 9 ℃ to 40 ℃ RGB.
MaterialsWood ChipsIron PowderFallen LeavesSiltNewspaperConcrete
RGB
R85%26%81%36%72%62%
G53%40%59%32%32%53%
B11%19%10%9%19%31%
Table 5. Group C green building materials discoloration rate of 9 ℃ to 40 ℃ RGB.
MaterialsWood ChipsIron PowderFallen LeavesSiltNewspaperConcrete
RGB
R97%21%80%43%70%61%
G63%22%66%36%38%53%
B49%7%57%22%41%22%
Table 6. Group D green building materials discoloration rate of 9 ℃ to 40 ℃ RGB.
MaterialsWood ChipsIron PowderFallen leavesSiltNewspaperConcrete
RGB
R88%32%99%46%85%30%
G81%31%65%41%68%30%
B52%16%38%21%29%18%
Table 7. Group D; green building materials outdoor experiment discoloration rate of RGB.
MaterialsWood ChipsNewspaperFallen Leaves
RGB
R58%58%36%
G27%40%16%
B14%25%7%

