2.1. Literature Review
This research focuses on previous studies in two ways. First, this research determines the factors needed to analyze urban structures, and second, the research methods construct a smaller geographic unit (i.e., census output area) in an urban area or a city.
First, a plethora of studies have focused on transforming urban structures in terms of urban sprawl and re-agglomeration. Unquestionably, spatial transformations of urban structures have become increasingly decentralized over time in contemporary cities. It is a major characteristic of cities with particularly rapid economic growth. The urban structure has transformed monocentric, mixed, or polycentric structures over time [
13,
24,
25,
26,
27,
28].
During the nighttime, a city center with a business district becomes “hollowed-out” because the economically active population has left the city—commonly known as a “doughnut effect” [
29]. The doughnut phenomenon occurs often because businesses and people move into the outskirts of the city [
29]. Even though most jobs were historically located in the city center [
11,
13], McMillen pointed out that employment in large metropolitan areas has become increasingly decentralized, and the percentage of suburban residents working in the city has declined [
10,
11,
13]. In addition, large sub-centers can look similar to a traditional central business district. Thus, the contemporary city is seen as a polycentric city that forms a metropolitan area with a strong central business district and large sub-centers [
24,
25,
26,
27]. In general, the processes of sprawl or decentralization have heavily relied on people, transportation, land use planning and its regulations, and employment opportunities [
13,
18]. Accordingly, credible statistical summaries in central business districts are an important factor for understanding how an urban structure has been transformed. However, each of the countries uses a different theory to delimit urban structures or economic places. Below, we discuss how other countries use various criteria for economic census places or small statistic areas.
The United States uses an economic census place that expands or contracts over time as the population and commercial activity increase or decrease [
30]. The Economic Census is the U.S. Government’s official five-year measure of American businesses and the economy. However, the economic census place is used to provide detailed information about employers and businesses from the Economic Census and the Survey of Business Owners. The economic census place is composed of incorporated places, census-designated places, minor civil divisions, and balances of minor civil divisions or counties [
31]. Some of the economic places are legally defined boundaries, and the economic places cannot be over the county boundaries. In general, the US follows the following three criteria: (1) the economic place must have at least 2500 people; (2) according to the results of the American Community Survey obtained between 2016 and 2010, the economic place must include at least 2500 jobs; and (3) after the 2010 Census Survey, there are new places with a population of at least 2500 people [
30]. When these requirements are met, without aggregating procedures of existing boundaries of economic places, the new places can be defined as new economic places.
England uses output areas to represent the geographical distributions of residents and residences; however, these distributions are different from those of workplaces and workers. Thus, the government uses workplace zones that are based on data from the 2011 Census of England and Wales to better represent the distributions of the working population [
32]. Using automated zone-design techniques, workplace zones are delimited via splitting, merging, or retaining the 2011 output areas. Moreover, workplace zones are determined by the number of workers and industrial factors at the small area level, i.e., the automated processes consider similar characteristics of the workers and workplaces [
32,
33,
34].
The design criteria of the workplace zones are that all zones must be “above,” “within,” or “below” thresholds, which are homogeneous in population size and as compact in shape as possible [
33]. The abovementioned threshold zones need to be split and must include over three postal codes. The below-threshold zones need to be merged into one or more zones with fewer than three postal codes. For example, the below-threshold zones are only allowed to merge with other below-threshold zones or within-threshold zones. Within-threshold zones must include at least three postal codes and be above the lower threshold (greater than 200 people) and below the upper threshold (fewer than 625 people). England inputted criteria into an AZTool, which is an automated zone design tool developed by David Martin and Samantha Cockings. The AZTool is able to make a spatial unit of workplace zones bigger, the same, or smaller compared to the spatial scale of the output areas using delimitation processes with splitting, merging, or retaining. Based on the new workplace zones, England compared descriptive statistics (mean and standard deviation (SD)) of the middle layer super output areas with those of the workplace zones. When comparing SDs in a district, the middle layer super output areas are basically higher than the workplace zones; thus the mean of the SD was used to compare them. Consequently, the outputs of the workplace zones showed better results. Using the algorithm in the AZTool, 48 census variables were selected to differentiate different types of workers and workplaces. The 48 variables were grouped by four domains: (1) composition of the workplace population; (2) composition of the built environment; (3) socioeconomic characteristics of the workplace population; and (4) employment characteristics of the workplace population [
35]. Furthermore, K-means clustering was used to generate seven sub-groups: (1) retail, (2) top jobs, (3) metro suburbs, (4) suburban services, (5) manufacturing and distribution, (6) rural, and (7) servants of society.
Note that other countries such as Norway or Canada use similar concepts for determining economic regions. Norway is divided into 90 economic regions that are designed for three data sets: commuting data, wholesale and retail trade statistics, and population data [
36]. Furthermore, Canada uses economic regions that maximize social and economic homogeneities in the same area and minimize social and economic homogeneity between the regions.
To summarize, the economic census place in the United States was not determined by a complex algorithm or an automated process. Norway defined the economic regions to explain economic activities rather than to delimit a spatial unit of the economic place. Canada designed its economic regions after considering social and economic homogeneity [
37]. England considered the workers and workplaces and used a clustering technique to generate social and economic variables. Furthermore, based on the AZ-based algorithm, their small census areas were automatically merged and split.
Regarding the research methods needed to construct a smaller geographic unit, many researchers have used a raster-based model with a certain cell size. The cell sizes (i.e., zones) are determined by complex computational approaches and are statically aggregated through the homogeneity or variables of each cell. In their most recent research, Yang et al. pointed out that urban planners have dealt with issues such as the jobs–housing balance [
38] and the ecological capacity of the city center [
39]. They proposed a new method by considering the preference of emerging economic sectors and their associated workers to forecast agglomeration patterns for the formation of newer employment sub-centers [
16]. The statistical information in a city or a suburb is essential to managing the land use and to predicting the transformation process of an urban structure. In general, current census output areas rely heavily on geographic features [
40], and their boundaries in multiple scales are determined by computational algorithms or various criteria. Based on a preferred algorithm, it may generate a different size of the smallest geographic unit.
The process of aggregation makes it difficult to assess the spatial location and geographic accuracy of the simulation because of the size of the cell. It means that the smaller a scale, the more accurate the simulation result or representation of an urban structure [
17,
41]. Thus, others have applied alternative approaches using a fine spatial scale, which helps to more precisely assess the urban structure or processes of sprawl and aggregation for planning purposes. Examples include a confusion matrix [
42,
43,
44], fitness regression [
45], or a receiver operating characteristic curve [
46]. Other researchers proposed a zonal aggregation approach to generate smaller cells with discrete subdivisions that improve the validation process of how urban areas are transformed [
21,
22]. The models indicate that the approaches in the large-scale regional models are useful for long-term planning.
However, when compared with reality, a small cell size is still not enough to validate a small zone because an area represented by one cell can be off. Pan and Deal pointed out that a smaller cell at a fine scale is useful for a large region, but there are still limitations of the models. To overcome these limitations, Pan and Deal proposed the use of a multi-resolution fitting process for improving the objectiveness and reasonableness of the planning support system’s spatial model applications [
17]. Dean and Lit also used machine learning methods to forecast the transformation of future urban development [
19,
44]. However, the models are not proper for providing existing statistical information in a small census output area for general purposes.
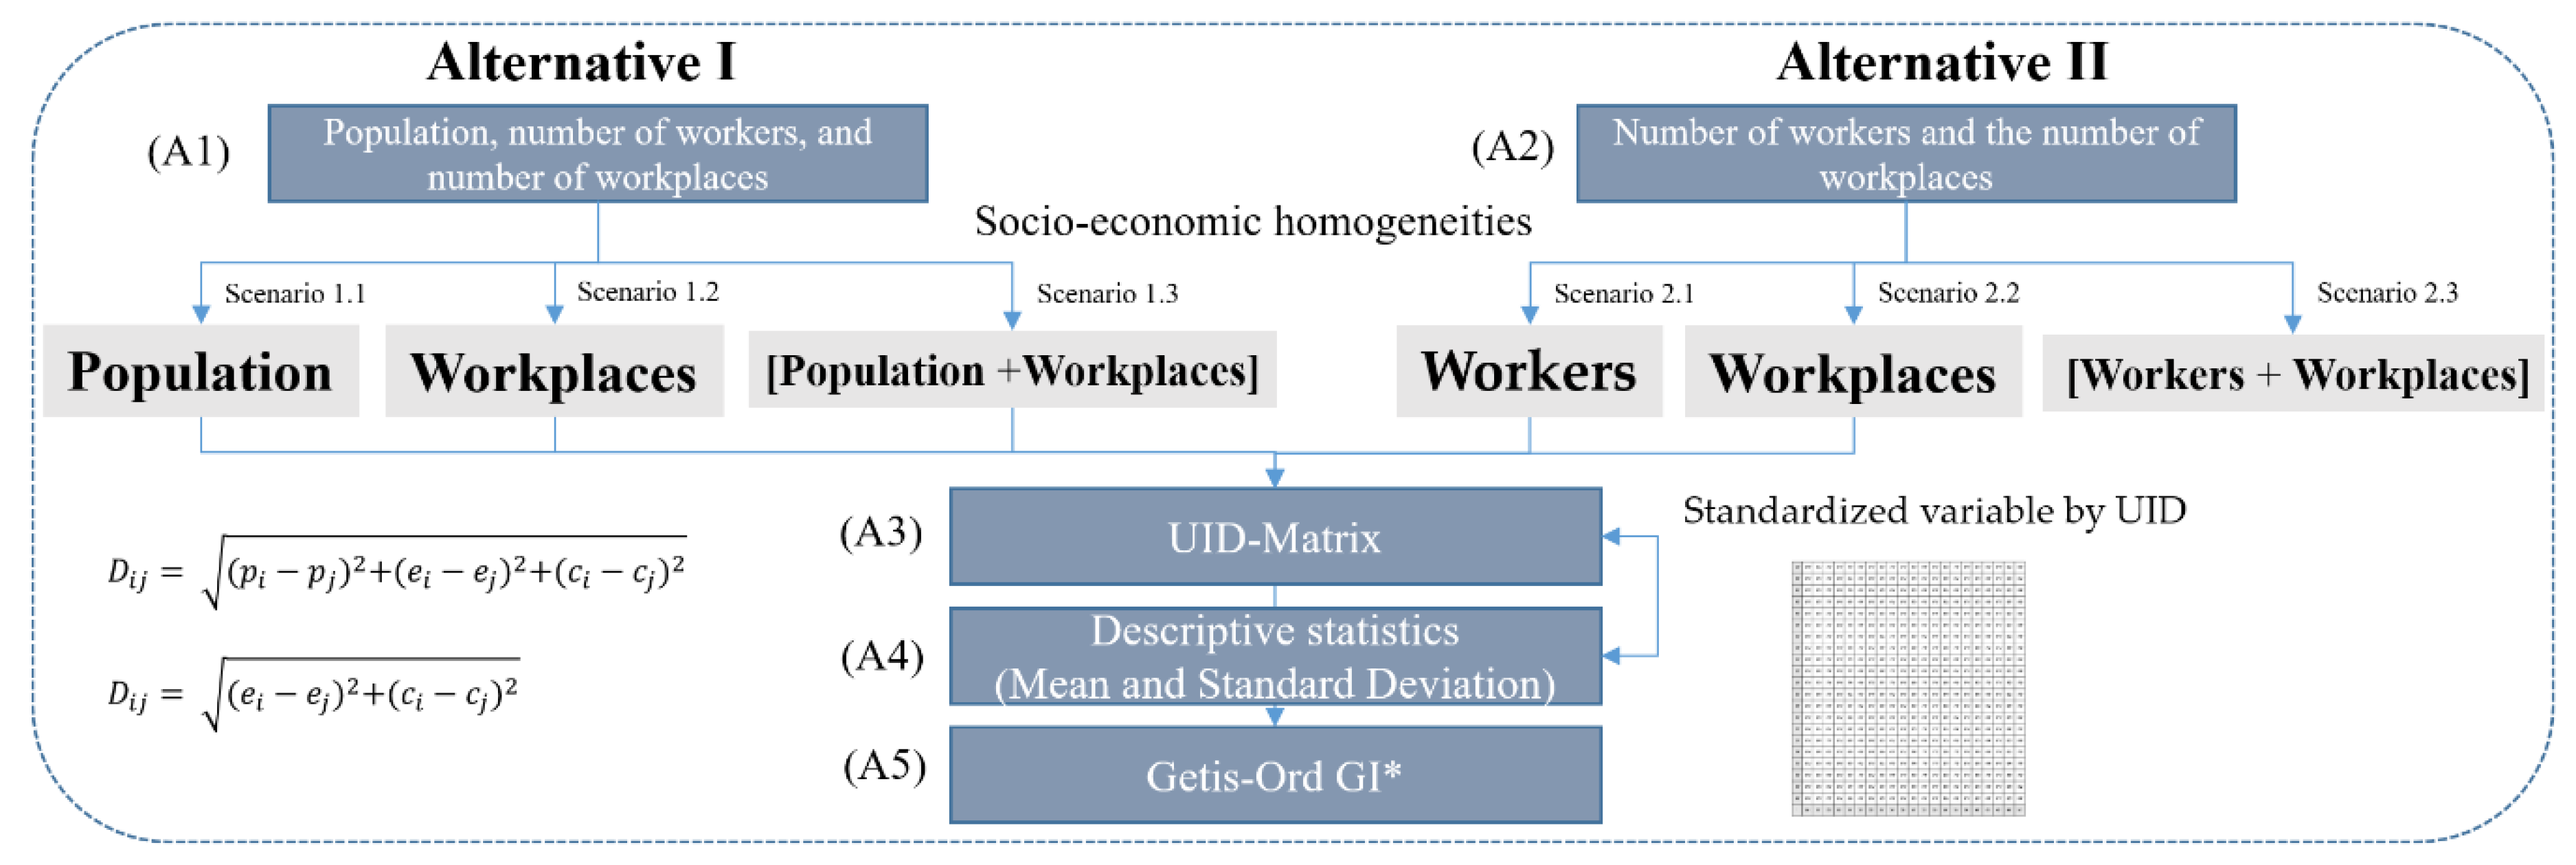
Consequently, although many researchers have focused on investigating urban structures and developing algorithms for zonal aggregation methods, few researchers have focused on statistical information in the urban structure, particularly at census output areas or where economic activity occurs. In other words, the existing census output areas in a hierarchy of census geographic units do not reflect the reality of the current spatial urban structure. It may cause underestimated or overestimated statistical summaries, particularly in areas where economic activities occur. Thus, to fill this gap and strengthen the existing economic census output areas, this study proposes two alternatives using a combination of factors—population, workers, and workplaces—and develops an algorithm to newly construct census output areas, including the smallest basic unit districts with national statistical information. Accordingly, this research assists in estimating reliable and accurate statistical information, which is used for the development of a sustainable economy and high-quality spatial data.
2.2. Problem Statement
As stated in
Section 2.1, there are gaps between previous research on urban structures and the statistical information in small census economic areas (i.e., COAs). To provide reliable statistical information about COAs, it is essential to reevaluate and re-aggregate the statistical summaries in existing COAs.
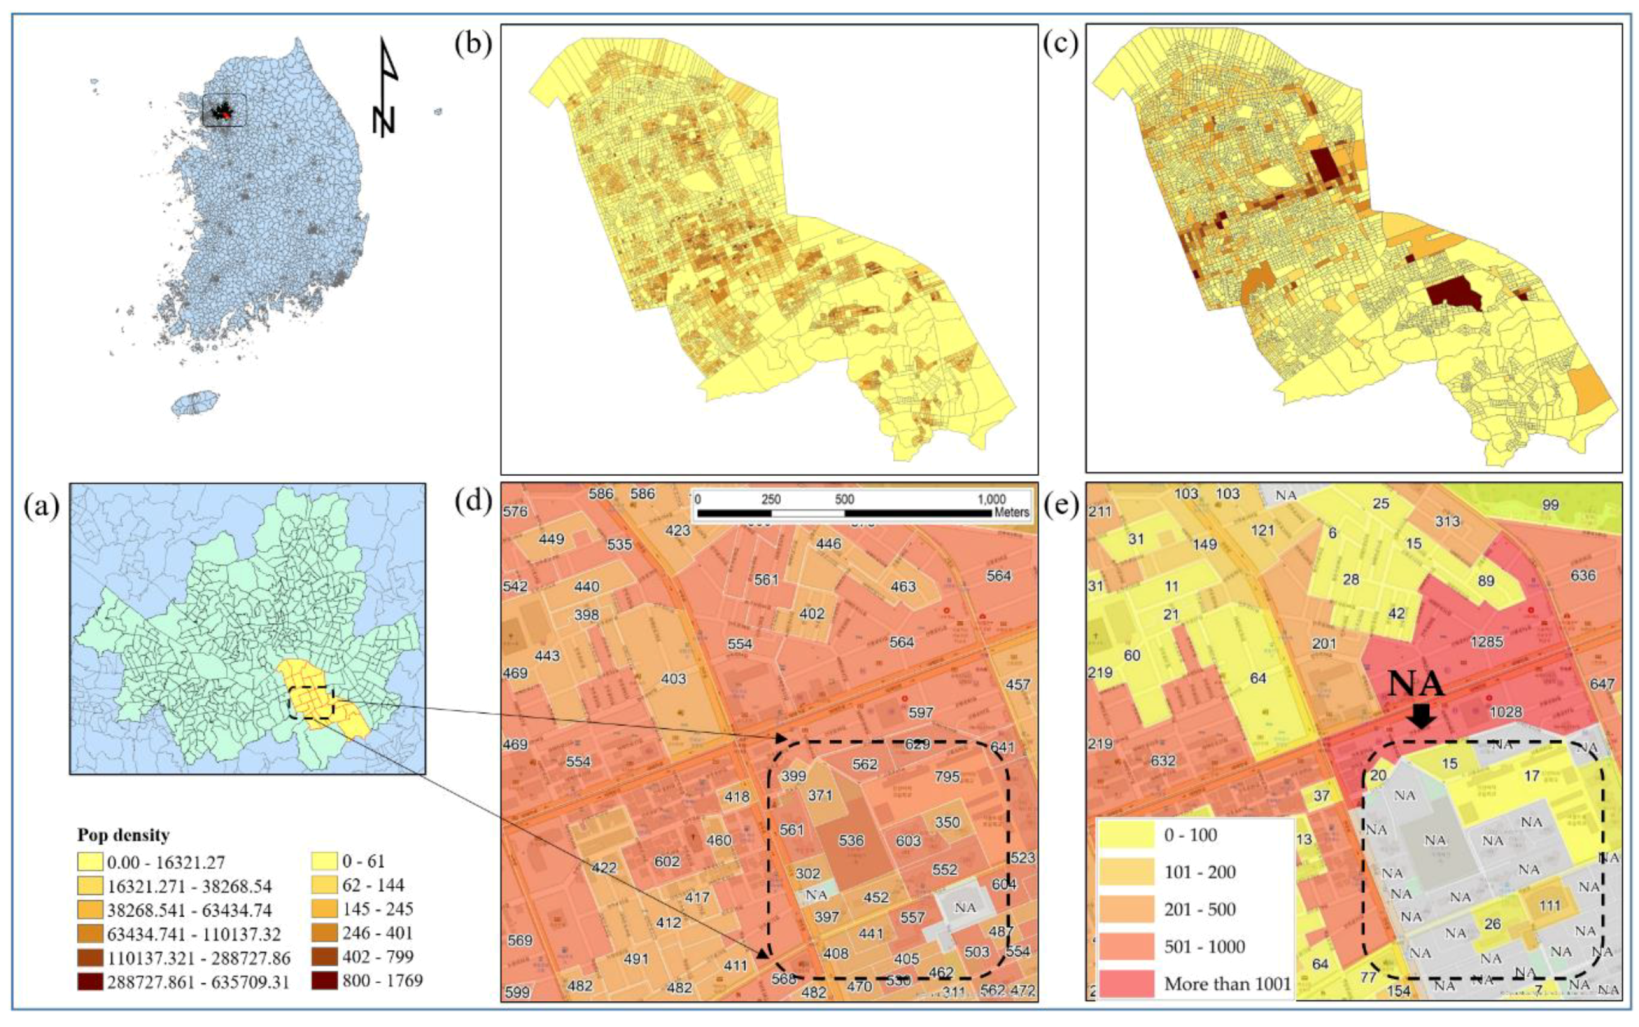
Figure 1 shows how the current COAs produce different statistical summaries in the study area. The area of interest in this study is the Gangnam district (yellow boundary in
Figure 1a), which is one of the 25 districts in the city of Seoul, South Korea, and a central business district (
Figure 1a). According to the 2018 census data, the total population of the Gangnam district is 544,257. The area of interest is the third-largest district in Seoul, with an area of 39.5 km
2. The district consists of a mix of many businesses and residential areas with extremely expensive real estate [
47].
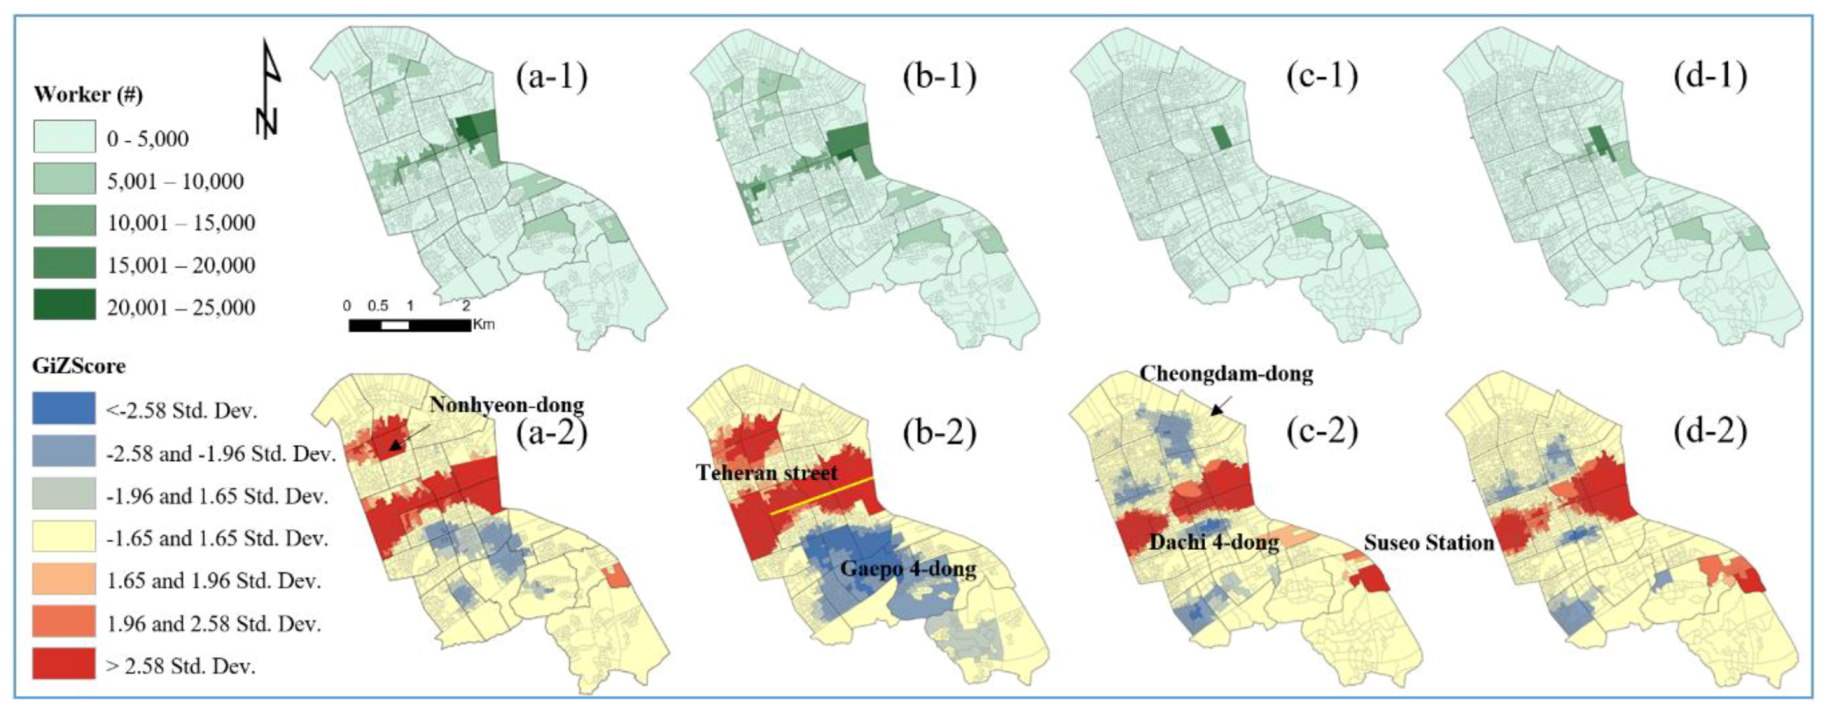
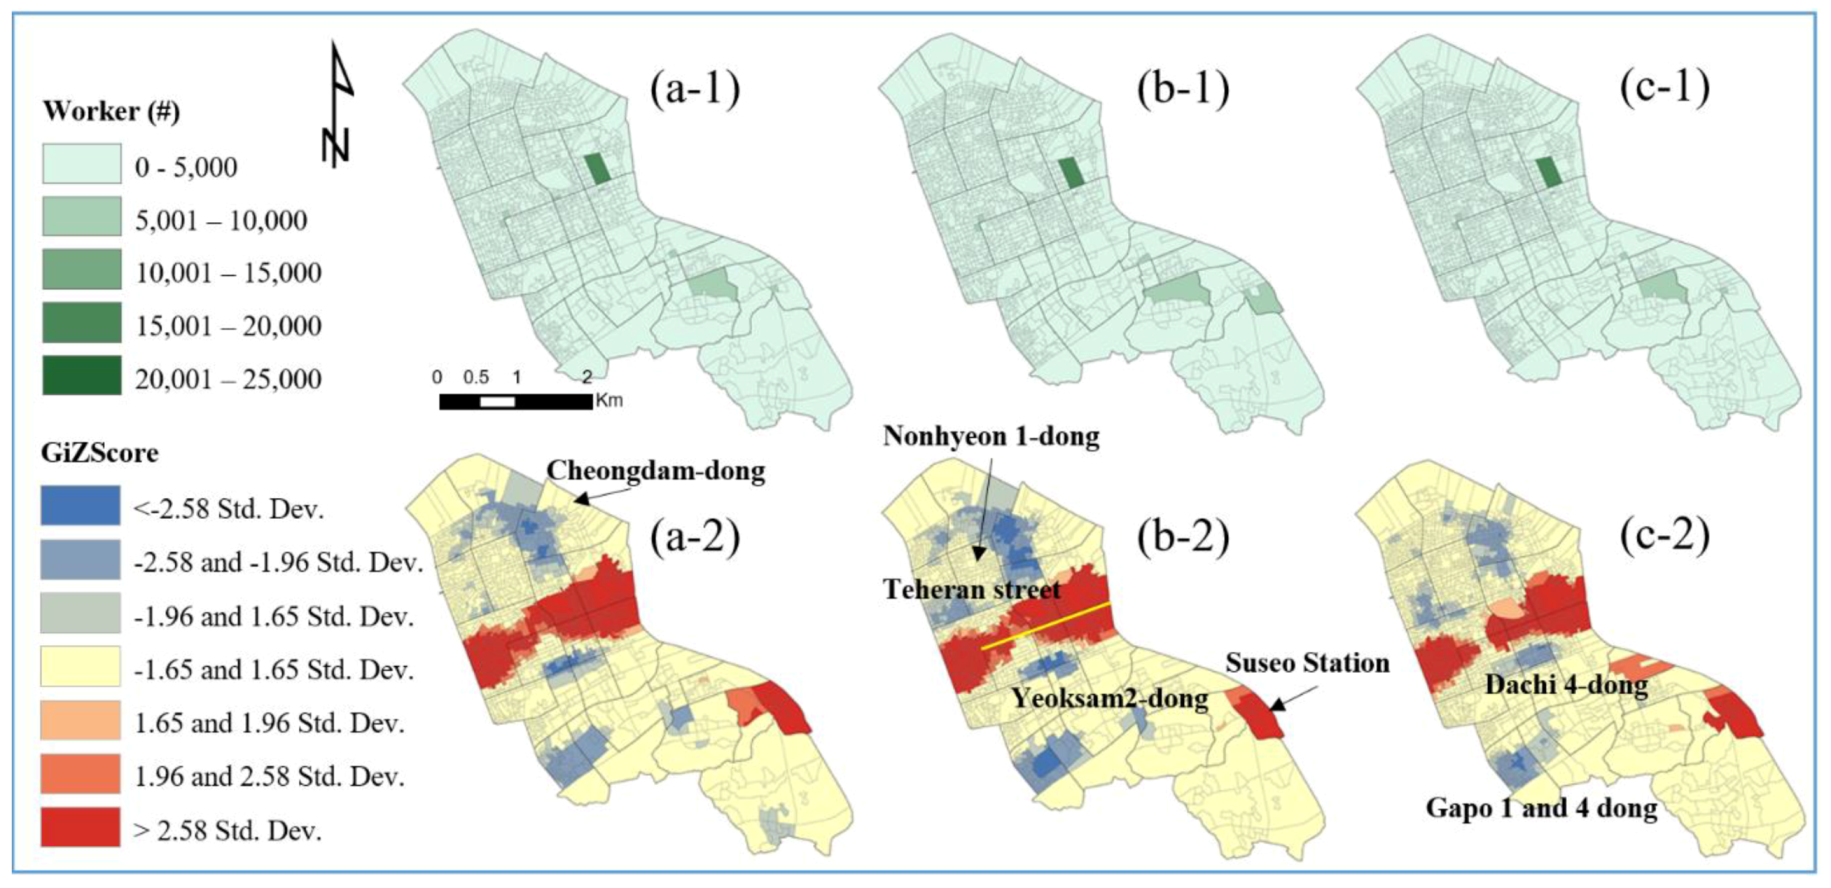
Figure 1b illustrates a population density map describing how many individuals are in a given area, and
Figure 1c shows the number of workers in the current basic unit districts (BUDs).
The population is slightly spatially dispersed but mostly centralized in the study area. Most workers are clustered at the center but are slightly dispersed. The COAs were delimited through AZP algorithms, which consider the statistical homogeneity and heterogeneity of the geographic feature and industry-related factors such as the number of employees and workplaces. The AZP has a computationally intensive procedure, which seeks to optimize areas such as zonal compactness or social homogeneity and recombine a large set of block polygons into a smaller set of output areas [
35]. The algorithm uses iterative processes to split, merge, and recombine objects until a smaller set of census output areas are determined. Moreover, the algorithm optimizes COAs that are delimited by considering population sizes (population of more than 500) and indices of social and economic homogeneity. Therefore, COAs have been consistently updated over the past 10 years; consequently, the existing number of COAs increased from 390,000 to 460,000 [
48].
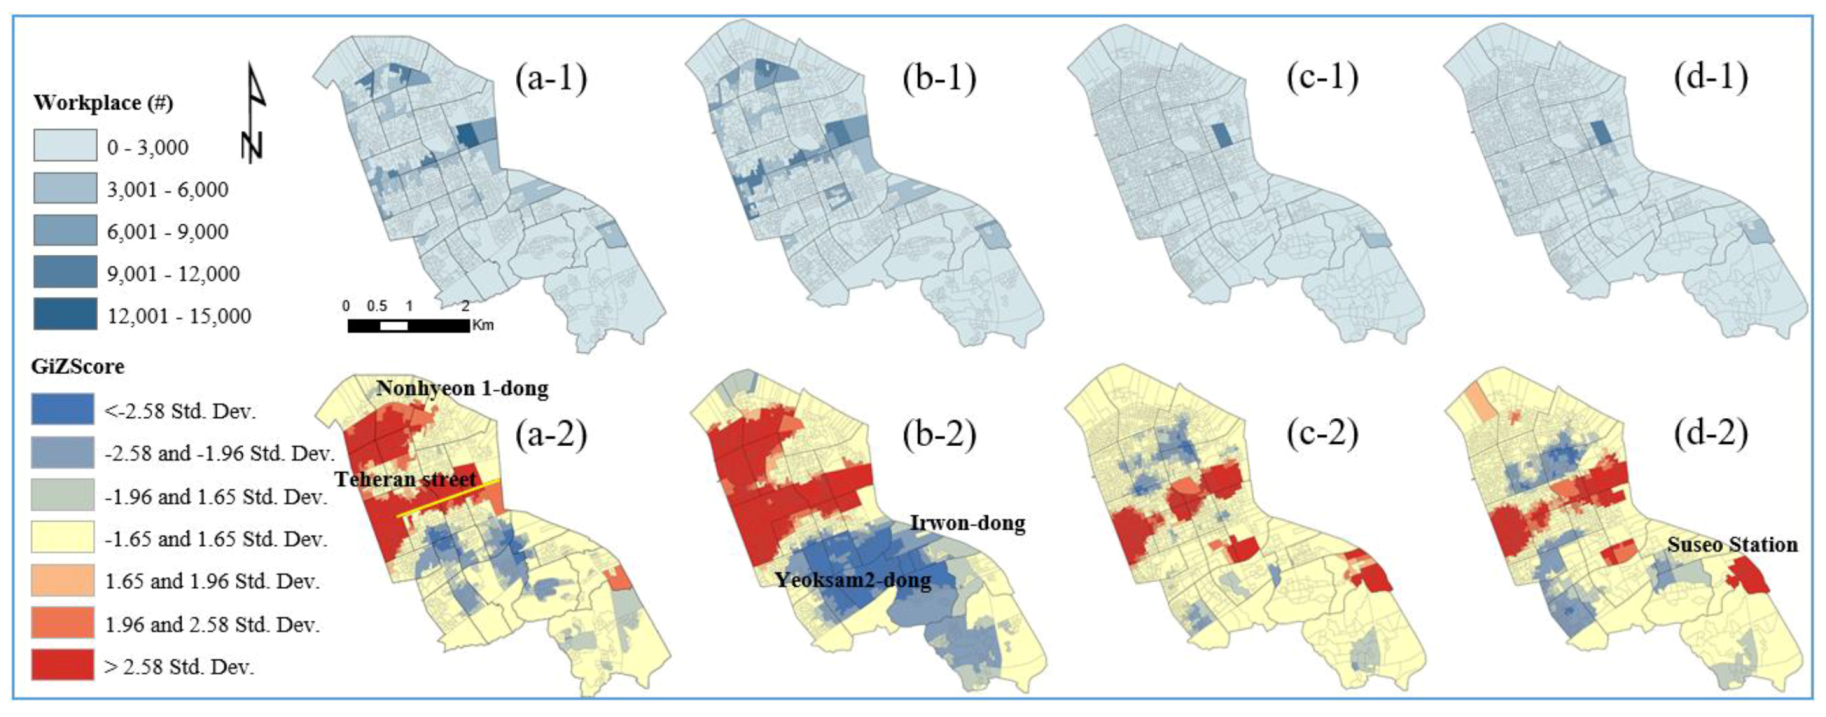
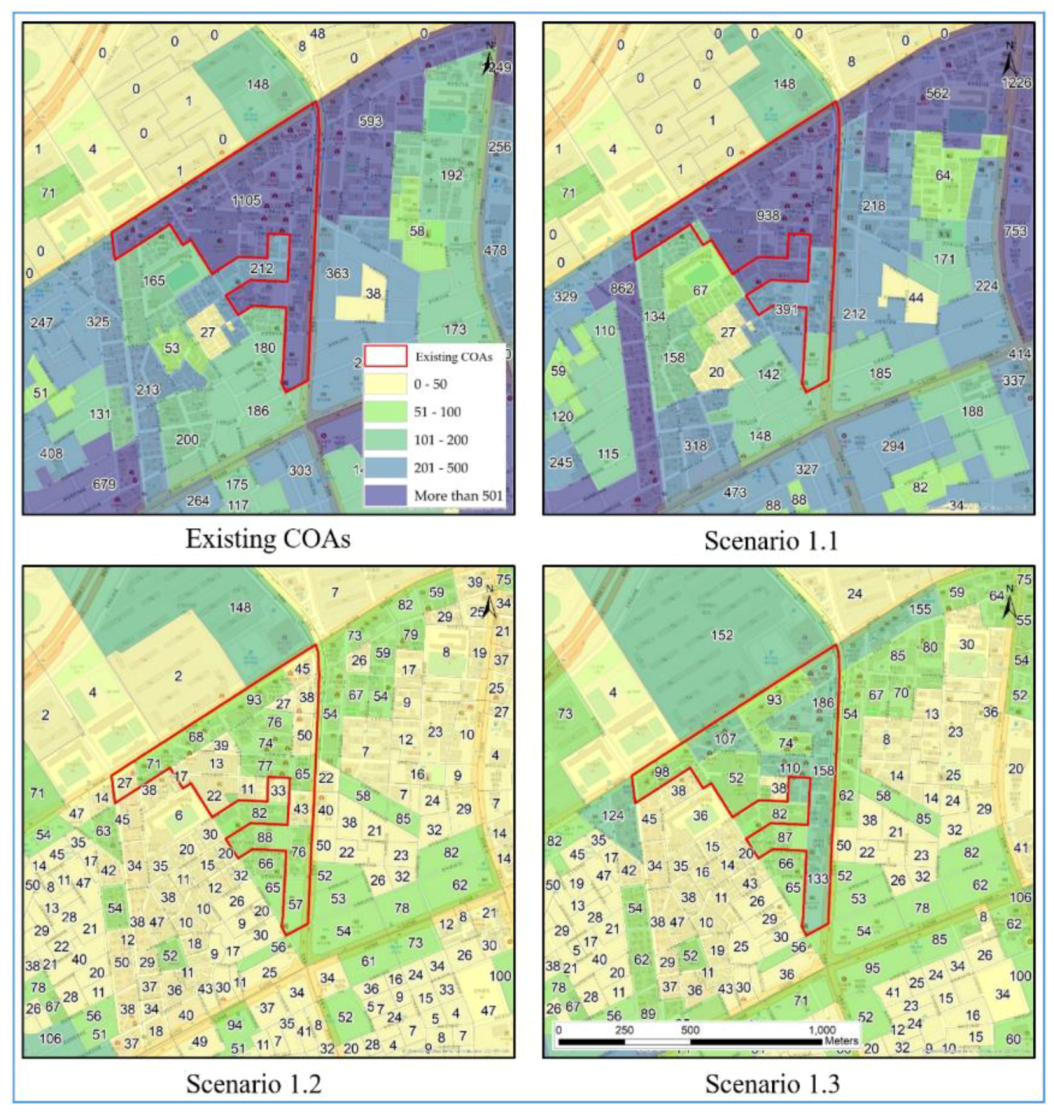
Despite these efforts, there are still various problems in the analysis of community development and business districts, particularly regarding the use of statistical summaries associated with the number of workers and workplaces in the existing COAs. For example, when using statistical summaries in the existing COAs, the number of summaries can often be overestimated or underestimated because of the doughnut phenomenon, which occurs as businesses and people move into the outskirts of the city [
29]. Furthermore, if the number of workers in the smallest geographic unit is small (e.g., a few employees in an economic zone), the number cannot be published publicly because of privacy issues. Thus, it is necessary to improve the existing AZP algorithms by considering the number of employees and workplaces.
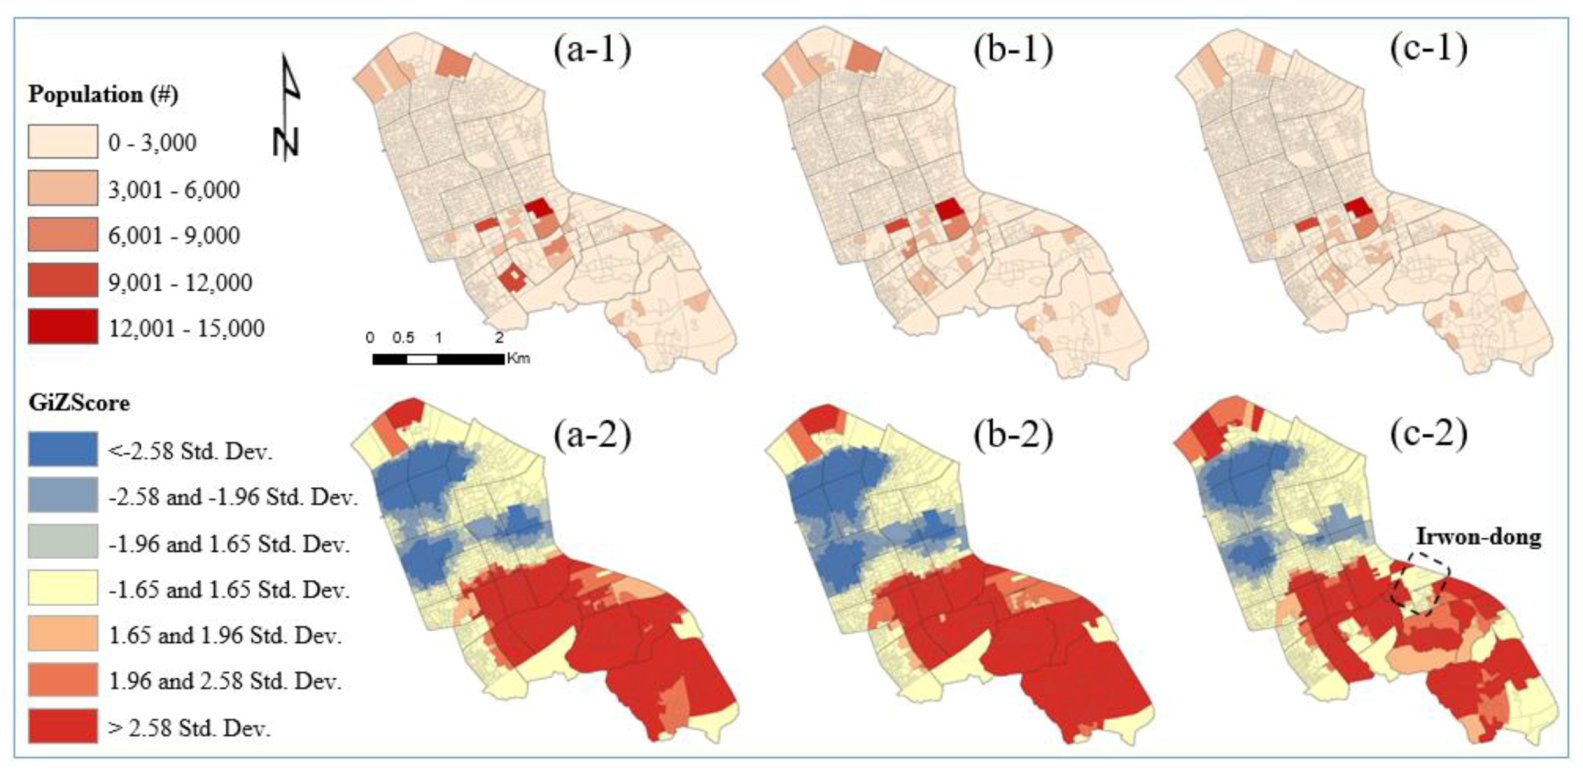
As shown in
Figure 1d,e, when referring to the existing COAs (
Figure 1e), the number of employees in the dashed line is estimated as “Not available” (NA), but the population size in
Figure 1d is approximately 8800, which is large enough. The total number was summed from the population size in the BUD, which is the smallest geographic unit officially used in South Korea [
23,
49]. However, the statistical summaries of employees are not available because the numbers are so low that it will be easy for the public to determine. Consequently, they have underestimated values. Furthermore, when considering different homogeneities, the sizes of the census output areas may vary, but they will also cause overestimated or underestimated statistical summaries.
The geography field has addressed this modifiable areal unit problem (MAUP), which affects aggregated geographical boundaries [
50,
51]. The MAUP refers to the fact that the observed values will vary depending on how the census output areas are delimited. Note that the MAUP is composed of a scale and a zoning effect. The scale effect refers to the size of the aerial units, whereas the zoning effect occurs when the number of spatial units of the measure remains the same; however, there are changes in the boundaries and shapes [
52]. The zoning effect can lead to differences in the analytical results of the same input data [
53,
54]. The problem presented in
Figure 1 is associated with the zoning effect. The delimitation of the census output area plays a key role in estimating the exact statistical information, particularly for business analysis. Although the AZP algorithm considered the statistical homogeneity and heterogeneity, industry-related factors are more important for analyzing the area of trade happening in economic places. The existing aggregated districts cannot guarantee the homogeneity of the geographic areas because there are many differences between the total population and the number of workers in the existing COAs; therefore, the numbers of workers or workplaces can be overestimated or underestimated. The current criteria used in the hierarchy of census geographic units are uncertain.


