Article

A Modified Model for Predicting the Strength of Drying-Wetting Cycled Sandstone Based on the P-Wave Velocity

1
National Field Observation and Research Station of Landslides in Three Gorges Reservoir Area of Yangtze River, China Three Gorges University, Yichang 443002, China
2
State Key Laboratory of Geomechanics and Geotechnical Engineering, Institute of Rock and Soil Mechanics, Chinese Academy of Sciences, Wuhan 430071, China
3
Hydrogeological & Engineering Geological Reconnaissance Institute of Hubei Province, Yichang 443000, China
*
Authors to whom correspondence should be addressed.
Sustainability 2020, 12(14), 5655; https://doi.org/10.3390/su12145655
Submission received: 16 June 2020 / Revised: 10 July 2020 / Accepted: 11 July 2020 / Published: 14 July 2020
(This article belongs to the Section Hazards and Sustainability)

Abstract

:
The drying-wetting cycles caused by operation of the Three Gorges Reservoir have considerable effect on the deterioration of reservoir bank rock mass, and the degradation of reservoir rock mass by the drying-wetting cycle is becoming obvious and serious along with the periodic operation. At present, the strength of the rock prediction research mainly focuses on the uniaxial strength, and few studies consider the drying-wetting effect and confining pressure. Therefore, in this paper, typical sandstone from a reservoir bank in the Three Gorges Reservoir area is taken as the research object, while the drying-wetting cycle test, wave velocity test and strength test are carried out for the research on the strength prediction of sandstone under the action of the drying-wetting cycle. The results show that the ultrasonic wave velocity Vp of the sandstone has an exponential function relation with the drying-wetting cycle number n, and the initial stage of drying-wetting cycles has the most significant influence on the wave velocity. Under different confining pressures, the compressive strength of sandstone decreases linearly with the increase of the drying-wetting cycle numbers, and the plastic deformation increases gradually. The damage variable of the sandstone has a power function relation with the increase of drying-wetting cycle numbers. A traditional strength prediction model based on P-wave velocity was established combined with the damage theory and Lemaitre strain equivalence hypothesis; in view of the defects of the traditional strength prediction model, a modified model considering both the drying-wetting cycle number and confining pressures was proposed, where the calculated results of the modified model are closer to the test strength value, and the prediction error is obviously decreased. This indicated that the modified model considering the drying-wetting cycle number and confining pressure is reasonable and feasible.

1. Introduction

Periodic operation of the Three Gorges Reservoir has changed the geological environment, which can easily lead to geological disasters, such as landslides, causing huge economic losses and social impacts. According to relevant statistics, ever since the completion of the Three Gorges Dam, periodic fluctuation of water level in the reservoir has induced a large number of slope disasters, of which there are more than 2490 large-scale collapses and landslides [1,2]. The national sustainable development strategy encourages joint efforts for great protection rather than disruptive development, and studying the degradation process of rock in the hydro-fluctuation belt at the reservoir bank. Thus, to analyze the influences of periodic operation of the reservoir on rock strength in the slope is an important premise for discussing the slope stability of the reservoir bank in the Three Gorges Reservoir area.
Due to periodic fluctuation of water levels, rock mass in the hydro-fluctuation belt of the reservoir bank is alternately dried or wetted for a long time. Such a fatigue load can lead to cumulative damage to rock mass in the hydro-fluctuation belt of the reservoir bank, aggravating the degradation process [3,4]. In recent years, scholars throughout the world have carried out a lot of researches on effects of drying–wetting cycles on rock materials and obtained a series of research results. The physical and mechanical properties of ignimbrites in Central Anatolia under 50 drying-wetting cycles were studied, and researchers found that the weight, porosity, water, P-wave velocity and uniaxial compressive strength had varying degrees of change [5]. Creep properties of siltstone under drying–wetting cycles were investigated and researchers found that with the increase of the number of drying–wetting cycles, the axial creep strain and axial steady-state creep rate of siltstone non-linearly rise, while instantaneous deformation modulus decrease logarithmically [6]. The loading and unloading mechanisms of mudstone in Andes Colombia were studied under drying–wetting cycles [7]. By taking sandstone as a research object, a series of tests under drying–wetting cycles with acid solution with pH of 7, 5 and 3 were conducted [8], and the results demonstrated that deviatoric stress is positively correlated with uniaxial compressive strength and cohesion, and also showed a negative correlation with constant materials and angles of internal friction. The strength characteristics of argillaceous sandstone under drying–wetting cycles in an acid environment and simulated properties, such as particle contact and crack distribution of the specimens at peak strength during a triaxial compression test were researched by utilizing a particle flow code in 2 dimensions (PFC2D) program [9]. By utilizing the computed tomography (CT) scanning technique, combined with the Brazil disk split tests and uniaxial compression tests, the macro mesoscopic mechanical parameters under drying–wetting cycles and the damage mechanisms of strength of sandstones were discussed [10]. Some tested results showed that the weakening effects of water on soft rock are mainly reflected by the decrease of contact stress between skeleton particles and clay minerals, as well as the cohesion and angle of internal friction of clay minerals [11]. The mechanical properties of sandstone under drying–wetting cycles were studied and a 2-12-1 three-layer neural network model was established by Li [12]. According to [13], a test was performed on mechanical properties of sandstone under drying–wetting cycles in water environments with different pH values and [13] then proposed a three-dimensional degradation equation for the relationships of mechanical parameters with pH values and the number n of drying–wetting cycles. The creep characteristics of sandstone under coupled stress-water pressure were also studied by Luo [14].
In the above research, physical and mechanical properties of rock mass under drying–wetting cycles were analyzed by using test technologies, such as strength testing, electron microscopy and CT scanning. It is emphasized that the change of the water environment has a fatal impact on the strength of rocks. Also, different methods were adopted by researchers to build models predicting the strength of rocks under the action of water. A point load test in different directions was conducted by Heidari et al. [15] and the uniaxial compressive strength and tensile strength of gypsum rock were predicted by using a regression analysis method. Based on the geological nature of rock, the literature [16], using regression analysis and a back-propagation (BP) neural network, predicted the uniaxial compressive strength of carbonate rock and verified the rationality of the prediction model through gray correlation analysis. In addition, based on porosity, density, longitudinal wave velocity, Poisson’s ratio and point load index, the uniaxial strength of carbonate rock was predicted separately through multivariate linear regression analysis and an artificial neural network [17]. The results showed that prediction effects of the neural network method are better than those of the regression analysis method. By using neural networks, machine learning, fuzzy systems and regression analysis [18,19,20], the uniaxial compressive strength and modulus of elasticity in calcareous mudstones were predicted and researchers found that neuro-fuzzy inference system is more suitable for predicting the uniaxial compressive strength and modulus of elasticity. In line with [21], Asheghi classified 197 groups of quarry rocks in Iran by using the index of density, porosity, longitudinal wave velocity, pointing load index and water absorption rate. Based on this, by combining a generalized feed forward network (GFFN) with independent component analysis (ICA), they proposed an ICA–GFFN hybrid algorithm for predicting the uniaxial compressive strength of rocks.
As a kind of non-destructive testing technology, the testing of ultrasonic waves is mainly used for rock mechanics testing [22,23], and dynamic warnings of rockburst [24,25], and some scholars also conducted research on the prediction of rock strength by using ultrasonic waves. For example, by considering rebound value and longitudinal wave velocity, the uniaxial compressive strength of sandstone was predicted through a linear regression method [26,27,28,29,30,31,32], but the research on prediction of rock strength mainly considers the uniaxial compressive strength of rock, while the rock strength is rarely predicted by taking drying–wetting cycles and confining pressure into account. Therefore, by taking the typical sandstone as a research object and using a damage theory, a modified model for predicting strength based on wave velocity under the combined effects of drying–wetting cycles and confining pressures through the tests was developed. The results demonstrate that the modified model is better and more reasonable for predicting strength.

2. Experiment

2.1. Test Materials

The typical sandstone in the slope on the bank of the Three Gorges Reservoir Region was used in the test. The rock blocks taken from the same region were processed into standard cylindrical samples with a size of 50 mm in diameter and 100 mm in length strictly in the laboratory in line with the published Specifications for Rock Tests in Water Conservancy and Hydroelectric Engineering [33]. After drying for the first time and cooling to room temperature, longitudinal wave velocity of the rock samples was tested to screen and exclude the samples with obvious defects and large discreteness. Through X-ray diffraction measurement and analysis, the main components of the rock samples were found to be quartz (48%), feldspar (25%), calcite (9%), mica (12%), kaolinite (4%) and hematite (2%). The X-ray diffraction pattern is shown in Figure 1.

2.2. Test Scheme

By sampling in the slope with the typical sandstone, the ultrasonic waves were tested after preparing the rock into the standard samples according to test specification in the laboratory, so as to preliminarily screen the samples with small levels of discreteness. After that, the test of drying–wetting cycles and macro-mechanical test were performed. The specific test process was as follows:
(1)
The screened rock samples were put in a drying oven at the constant temperature 105 °C for 24 h. After the samples cooled down to the room temperature and we weighed the samples, we could get the mass m1 for each sample. We dried the samples for another 24 h and weighed them, then we could get the mass m2. We could not stop drying until (m1m2)/m2 ≤ 0.001. The process to get the mass of samples m1 and m2 is called the successive measurements process. After that, the initial drying state was obtained. Then, the wave velocity was also measured with the RSM-SY5 ultrasonic testing analyzer.
(2)
The rock samples from after the initial drying were vacuumized and saturated by using a vacuum saturator to keep the reading of vacuum pressure at 100 kPa. The measurement started from the time when no bubbles escaped. The samples were vacuumized and saturated for 4 h and rested for 24 h. After saturation, water on the surface of the rock samples was dried off and the mass was measured and recorded.
(3)
After measuring mass and wave velocity of the saturated samples, the rock samples were dried again in a drying oven at a constant temperature of 105 °C. The drying was repeated until the mass change between two successive measurements was no larger than 0.1% of the last measurement, which indicated that one drying–wetting cycle was finished. The drying-wetting process is shown in Figure 2.
(4)
After determining mass and wave velocity of the dried samples, a test of drying–wetting cycles was conducted according to the above process. After reaching the preset times (0, 4, 8, 12, 16, 20), confining pressures were set to be 0, 5, 10 and 15 MPa for the compressive test with the displacement-control model. The displacement rate was controlled at 0.005 mm/s, considering the effect of the displacement rate on the failure mode and peak strength of the rock, according to the Specifications for Rock Tests in Water Conservancy and Hydroelectric Engineering.
The RMT-150C rock test system adopts automatic servo control technology, it integrates electronic, sensor, mechanical and computer technology and an automatic control system and can complete a variety of rock tests. The test data from the system are saved automatically when the test is finished. The main technical parameters of the RMT-150C rock test system are shown in Table 1.
The whole test procedure is demonstrated in Figure 3.

3. Results

3.1. Ultrasonic Characteristics

The wave velocity test was conducted on the rock samples subjected to different drying–wetting cycles. The relationship between average wave velocity and the number of drying–wetting cycles is shown in Figure 4.
The Figure 4 shows that as the drying–wetting cycle number rose, the wave velocity decreased non-linearly and its change trend could be expressed by the exponential function as Equation (1) shows, with fitting coefficient of 0.934. It could be seen from the blue line which reflects the derivative of the black line that with the increase of the drying–wetting cycle number, the ultrasonic wave velocity increased with a negative rate. Furthermore, the increase rate reduced with the rise of drying–wetting cycle number, while the initial drying-wetting cycle stage has the greatest influence on the rock sample wave velocity. As the wave velocity reflects the overall integrity and compactness degree of the rock samples, the results show that the drying-wetting cycle reduces the compactness degree, and the integrity of the sample is damaged to some extent.
V n = 1439.95 + 927.49 × 0.925 n

3.2. Strength Characteristics

After the compression test was completed, through data sorting and analysis, stress-strain curves of sandstone samples under different drying-wetting cycles and different confining pressure were obtained, and are shown in Figure 5. It can be seen that under the same drying-wetting cycle number, as shown in Figure 5a, the strength of sandstone sample increases with the rising of confining pressure, and the axial strain gradually increases when it reaches the peak strength. It can also be seen that under the same confining pressure (such as 15 MPa), with the increase of the drying-wetting cycle number, the strain range at the yield stage of the stress-strain curves of the sandstone sample gradually increases, indicating that with the increase of the drying-wetting cycle number, the sandstone shows obvious ductile deformation characteristics.
The stress-strain curve in Figure 5 can be used to obtain the peak compressive strength of the sandstone samples under different confining pressures and drying-wetting cycles, as shown in Figure 6. It can be seen that under the same confining pressure, the peak strength of sandstone decreases gradually with the increase of the drying-wetting cycle number, and the peak strength σ f ( x , n ) of sandstone under different confining pressures is linearly related to the number n of the drying-wetting cycle, which can be fitted with the linear Equation (2), Equation (3), Equation (4) and Equation (5), respectively, where the x of σ f ( x , n ) is the confining pressure (MPa), and the n is the drying-wetting cycle number. It is also not difficult to find that under the same drying-wetting cycle number, with the increase of the confining pressure, the reduction rate of peak strength decreases gradually. The relationship between the reduction rate of peak strength Δ σ and confining pressure σ 3 can be expressed by linear Equation (6), with a fitting degree of 0.8696, as shown in Figure 7.
σ f ( 0 , n ) = 0.8100 × n + 49.459
σ f ( 5 , n ) = 0.8002 × n + 76.109
σ f ( 10 , n ) = 0.7065 × n + 99.827
σ f ( 15 , n ) = 0.5406 × n + 114.33
Δ σ = 0.018 × σ 3 + 0.8496
The peak strength of sandstone under the drying–wetting cycle was affected by both the drying–wetting cycle number n and confining pressure σ 3 . The drying–wetting cycle leads to the development and expansion of the micro-cracks in the rock samples, resulting in the reduction of its peak strength. However, the increase of confining pressure, to some extent, inhibited the expansion of the micro-cracks, and even closed the locally opened cracks. Under low confining pressure, the decrement of peak strength of the rock samples resulting from the rise of drying–wetting cycle number was greater than the increment attributed to the rising confining pressure, showing that the influence of the drying–wetting cycle is dominant. In the case of high confining pressure, the increment of peak strength of the rock samples induced by the rise of confining pressure was greater than the decrement of peak strength due to the increase of the drying–wetting cycle number, indicating that it is mainly affected by confining pressure. It is the gradual increase of confining pressure that weakens the effect of drying–wetting cycle, which is manifested as the gradual reduction of the decrease rate of the peak strength.

4. Models for Predicting Rock Strength Based on Wave Velocity

4.1. Traditional Model for Predicting Strength Based on Wave Velocity

When characterizing the degree of strength degradation of rock mass, the damage variable D is generally used and the calculation formula of D is shown as Equation (7) [34]
D = 1 ( V p / V f ) 2
where D represents the damage variable of the rock mass. D = 0 indicates that rock mass is intact and not damaged; D = 1 suggests that damage of rock mass reaches the limit value, namely the crushing state. Vp and Vf denote the wave velocities of the damaged and intact rock masses, respectively.
Formula (8) shows the rock damage constitutive relationship based on the hypothesis of strain equivalence of Lemaitre [35]. By replacing Dpn in Equation (8) with D in Equation (7), the traditional strength predicting model for rock based on wave velocity after the nth drying–wetting cycle (Vpn) can be obtained, namely Equation (9)
σ p n = σ o × ( 1 D p n )
σ p n = σ o × ( V p n / V f ) 2
where Dpn indicates the damage variable of the rock mass after the nth drying–wetting cycle calculated according to the ultrasonic wave velocity; σpn represents the compressive strength of rock under the nth drying–wetting cycle calculated by Dpn; Vpn denotes the ultrasonic wave velocity of sandstone after the nth drying–wetting cycle.

4.2. Error Analysis of Traditional Prediction Model

The peak strength of sandstone under drying–wetting cycles was predicted through the traditional strength predicting model. Also, by using the wave velocity of the initial rock samples (without undergoing the drying–wetting cycle) as wave velocity Vf, data of wave velocity of sandstones after multiple drying–wetting cycles were substituted into Equation (10) to calculate the damage variable of the rock samples. It could be found that damage variable Dpn of the rock samples was the function of the drying–wetting cycle number n, which could be fitted by the power function and the variance R2 = 0.864, as shown in Figure 8.
The damage variable Dpn of sandstones calculated based on wave velocity under the drying–wetting cycles showed the largest increase rate in the initial stage of a drying–wetting cycle. With the increase of the drying–wetting cycle number, the increase rate of damage variable gradually slowed down and finally tended to be stable. The influence of the wet and dry cycle on sandstone is obvious in the early experiment stage, but weakens gradually in the later stage. Also, the physical significance of n is related to the operation cycle of the Three Gorges reservoir, and directly affects the strength of the rock. So n would not go to infinity for practical reasons.
D p n = 0.115 × n 0.515
By substituting the wave velocity values of the rock samples undergoing different drying–wetting cycles into Equation (9), the strengths of sandstone predicted by the traditional strength predicting model based on wave velocity were obtained. Moreover, the relative errors of the predicted strengths and tested values were calculated, as demonstrated in Figure 9. It could be observed that the strength values of sandstone predicted by the traditional strength predicting model based on the wave velocity deviated greatly from the tested values. Furthermore, the prediction error rose with the increase of the drying–wetting cycle number n and confining pressure σ 3 , and the maximum relative error of the predicted values is 47.4%.

4.3. Proposed Model for Predicting Strength Based on Wave Velocity

Under different drying–wetting cycles, the corresponding relationship between peak strength of the sandstone and the damage variable under different confining pressures (0, 5, 10 and 15 MPa) is displayed in Figure 10. There is a significant correlation between the peak strength σ f ( x , n ) and damage variable Dpn under different confining pressures, which can be expressed in a unified form of power function, as shown in Equation (11)
σ f ( x , σ 3 ) = a σ 3 × ( c D p n ) b σ 3
where n represents the drying–wetting cycle number; a σ 3 and b σ 3 are constants relating to the confining pressure; c is the damage threshold value. For the sandstones of the test, c = 1.0. Under different confining pressures, parameters a σ 3 and b σ 3 in Equation (11) are demonstrated in Table 2.
The relationships of parameters a σ 3 and b σ 3 in Equation (11) with the confining pressure are shown in Figure 11.
It could be seen that the relationships parameters a σ 3 and b σ 3 and the confining pressure can be described by linear and exponential functions, where the fitting degrees are 0.9827 and 0.999, respectively. Therefore, parameters a σ 3 and b σ 3 could be expressed as the functions of confining pressure, as illustrated in Equation (12) and Equation (13). Also, the coefficient value of a1, a2, b1, b2 and b3 is 4.2819, 53.768, 0.4725, 9.4493 and 0.02124, respectively.
a σ 3 = f 1 ( σ 3 ) = a 1 × σ 3 + a 2
b σ 3 = f 2 ( σ 3 ) = b 1 × e ( σ 3 / b 2 ) + b 3
By combining Equations (11)–(13), the peak strength of σf sandstones under multiple drying–wetting cycles and different confining pressures could be expressed as a united composite function of confining pressure σ3 and the drying–wetting cycle number n, as shown in Equation (14). Then, the Equation (14) is the proposed strength predicting model based on the wave velocity, which can be used to predict the peak strength of sandstone under a different drying–wetting cycle number n and confining pressures σ3
σ f ( σ 3 , n ) = f 1 ( σ 3 ) × ( c D p n ) f 2 ( σ 3 )
where σ f ( σ 3 , n ) represents the peak strength considering confining pressure and the drying–wetting cycle number; f 1 ( σ 3 ) and f 2 ( σ 3 ) are constants relating to the confining pressure; a σ 3 and b σ 3 , c are the threshold values of the test results. Dpn represents the damage variable under different confining pressures, which can be expressed in a unified form of power function, as shown in Equation (10).
Figure 12 displays the comparisons between predicted values obtained by the traditional strength predicting model and the modified model based on the wave velocity, the tested values and the relative prediction errors. It can be seen that the error in the traditional strength prediction model generally increases with the increase of σ3. This result happens under the condition that if the confining pressure is not zero, the prediction error range of the traditional strength prediction model is 15–50% and its maximum value is 47.4%, while the drying–wetting cycle number n is 20 and confining pressures value is 15 MPa. The error in the modified strength prediction model is 10.48% only when the drying-wet cycle is 20 and the confining pressure is 0 Mpa, and the prediction error under other conditions is within 10%. Compared with the traditional strength prediction model, the predicted error of the modified model is greatly reduced, and the predicted values of the modified model are closer to the experimental values. This indicated that the modified strength prediction model based on the wave velocity is better.

4.4. Validation of the Proposed Model

To verify the validity of the method of the proposed model, the data in the literature [36] were used. The peak strength σ f ( σ 3 , n ) can also be expressed as the formula (14). Also, f 1 ( σ 3 ) , f 2 ( σ 3 ) were expressed as formulas (12) and (13), respectively. The coefficient values of a1, a2, b1, b2 and b3 are 5.1644, 39.184, 0.09175, 5.29714 and 0.02018, respectively.
Calculated from the data in the literature [36], the threshold value of c for these test data is 0.43, which is shown in Figure 13. D p n is the evolution law of damage variable calculated by the P-wave velocity with the drying-wetting cycle number n, which depends on the nature of the rock itself, while the evolution law of D p n is shown as formula (15) for the rock in [36].
D p n = 0.43 × ( 1 e n / 0.512 )
The comparison of test peak strength in the literature [36] and predicted strength according to formula (14) are shown in Figure 14. Because the types of rocks used in the tests are different, the coefficient values of a1, a2, b1, b2, b3 and c are determined by the rock itself. The verification results show that the proposed model is more applicable than the traditional model, especially for the conditions with more dry and wet cycles and a higher confining pressure.

5. Conclusions

The main conclusions drawn from the present study can be summarized as follow:
(1)
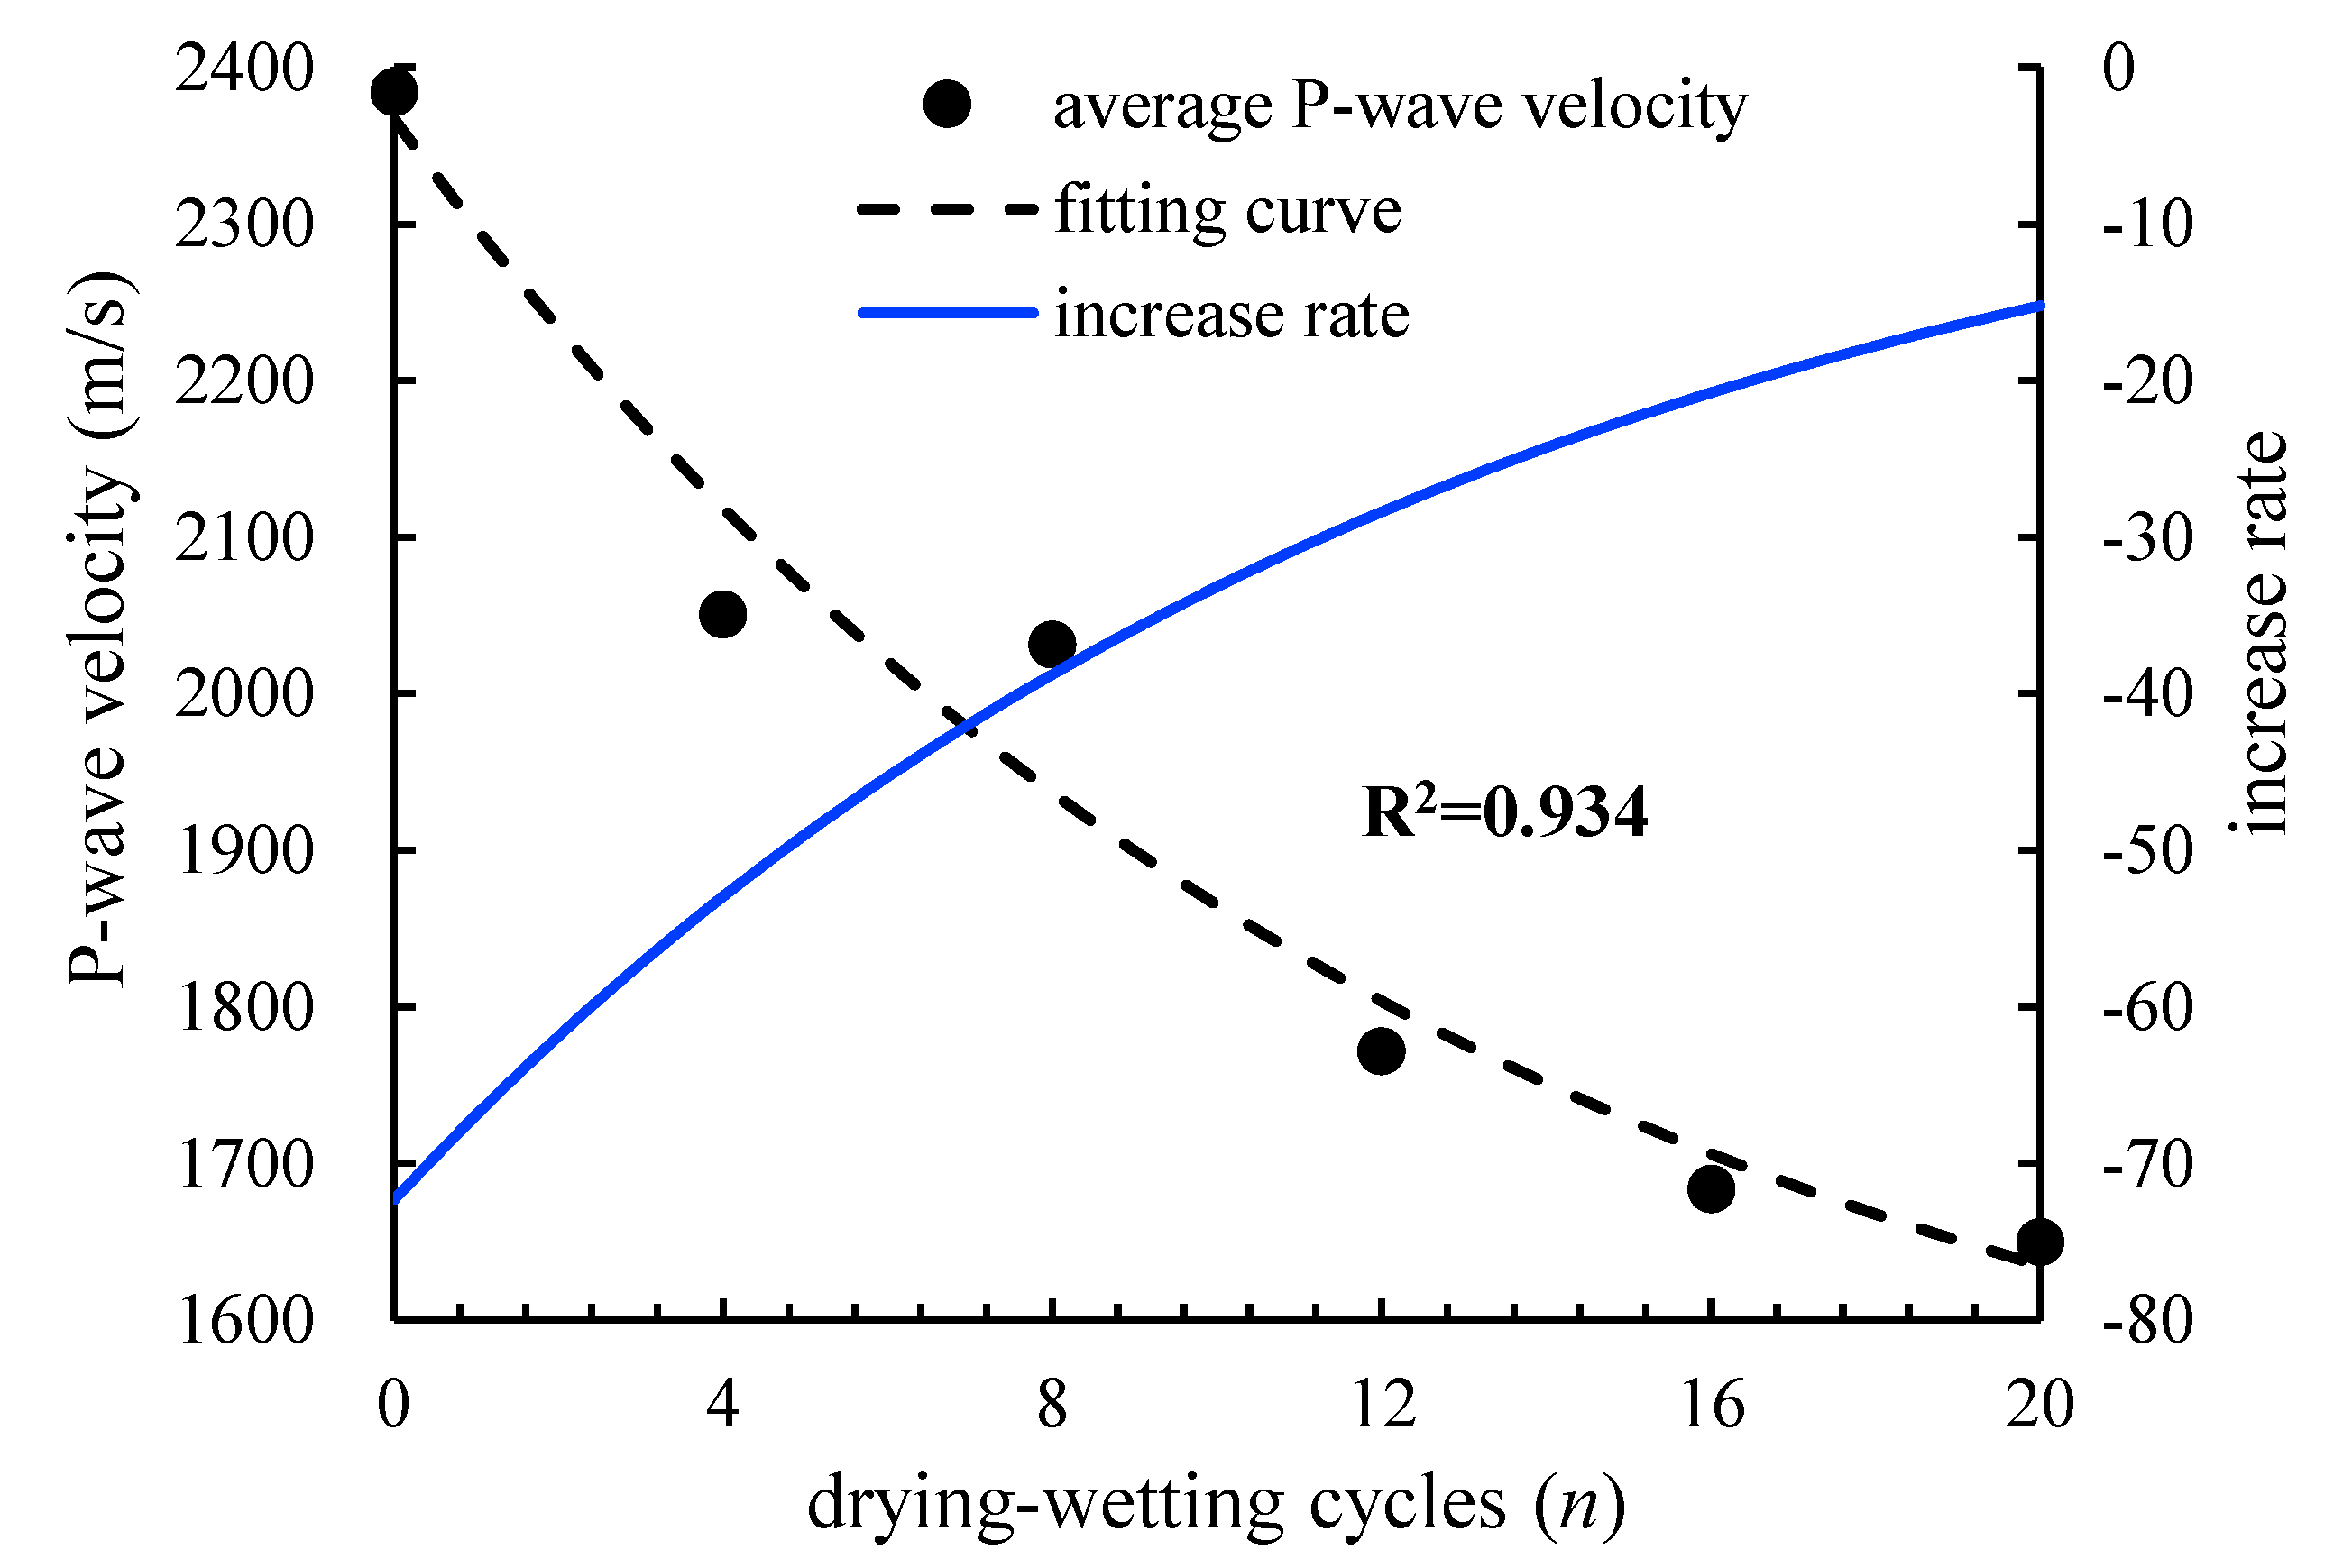
The drying-wetting cycle causes the development and expansion of the internal micro-cracks in sandstone, resulting in the decrease of the integrity and compactness of sandstone samples. The ultrasonic wave velocity decreases exponentially with the increase of the drying-wetting cycle number.
(2)
With the same drying-wetting cycle number, the peak strength of sandstone samples increases with the increase of the confining pressure, and the corresponding peak strain increases gradually. With the increase of drying-wetting cycles, the strain range at the yield stage of the stress-strain curves of the sandstone sample gradually increases, which shows obvious ductile deformation characteristics. The peak strength of the drying-wetting cycle sandstones decreases linearly with the increase of the drying-wetting cycles.
(3)
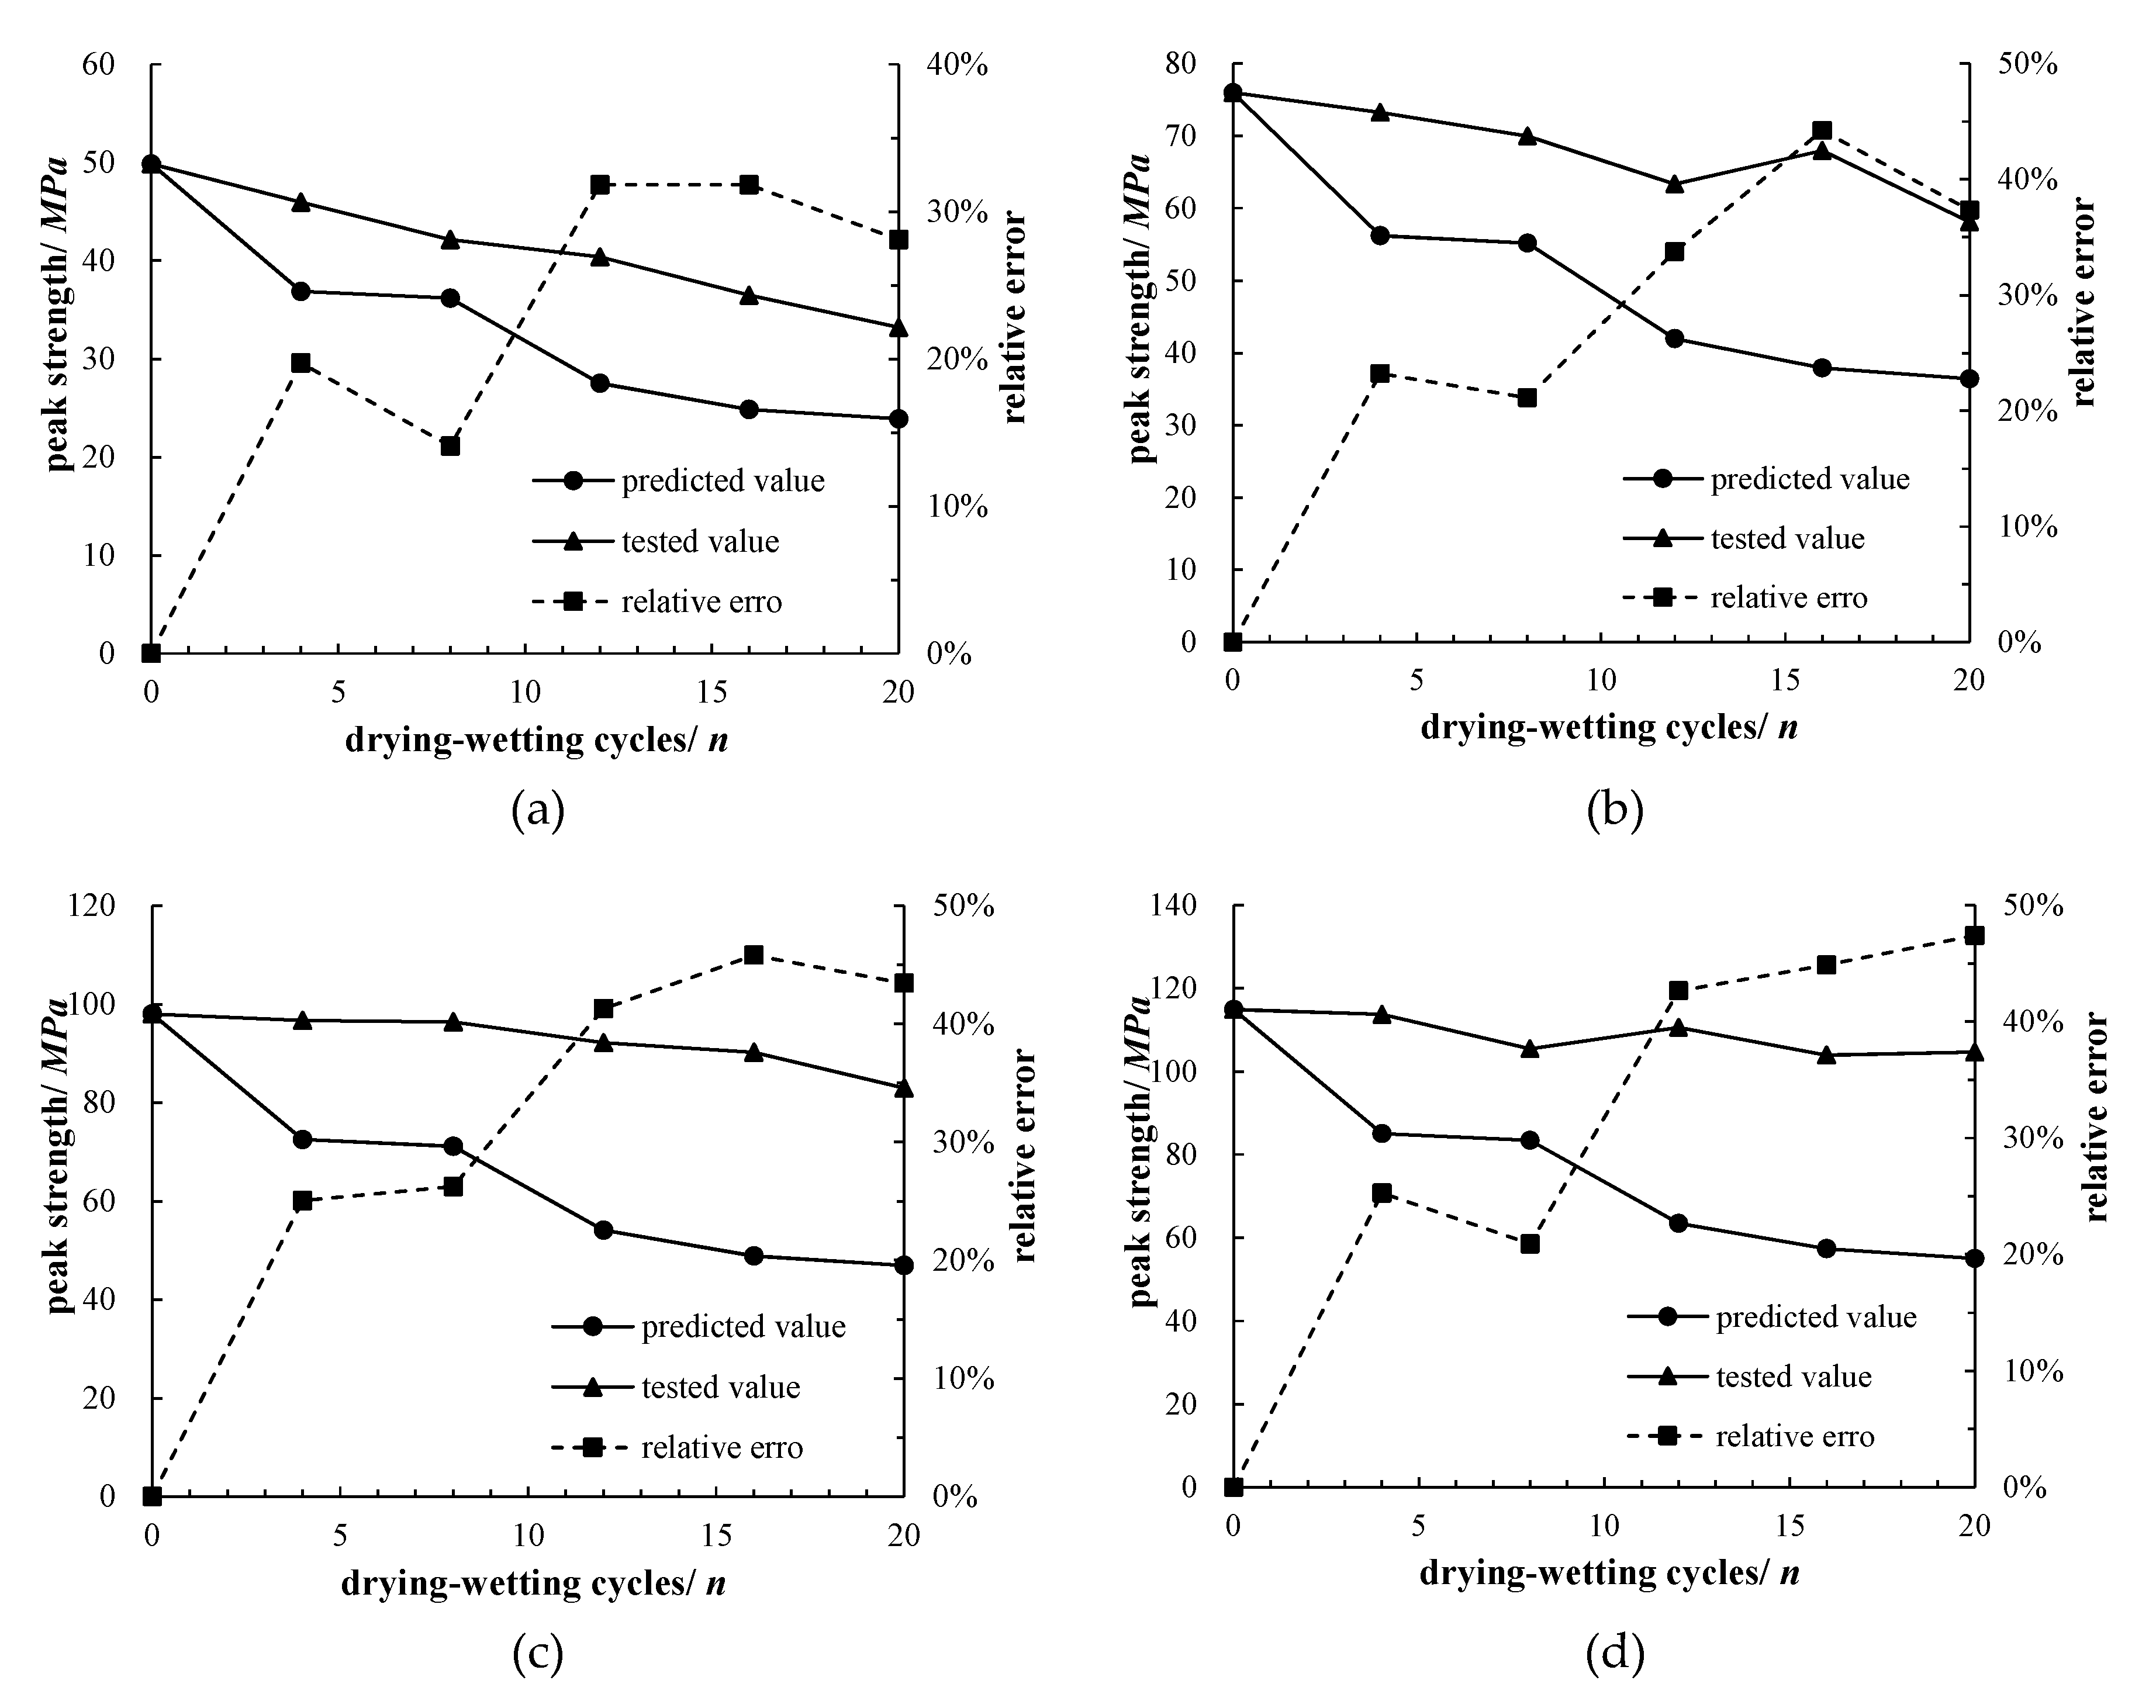
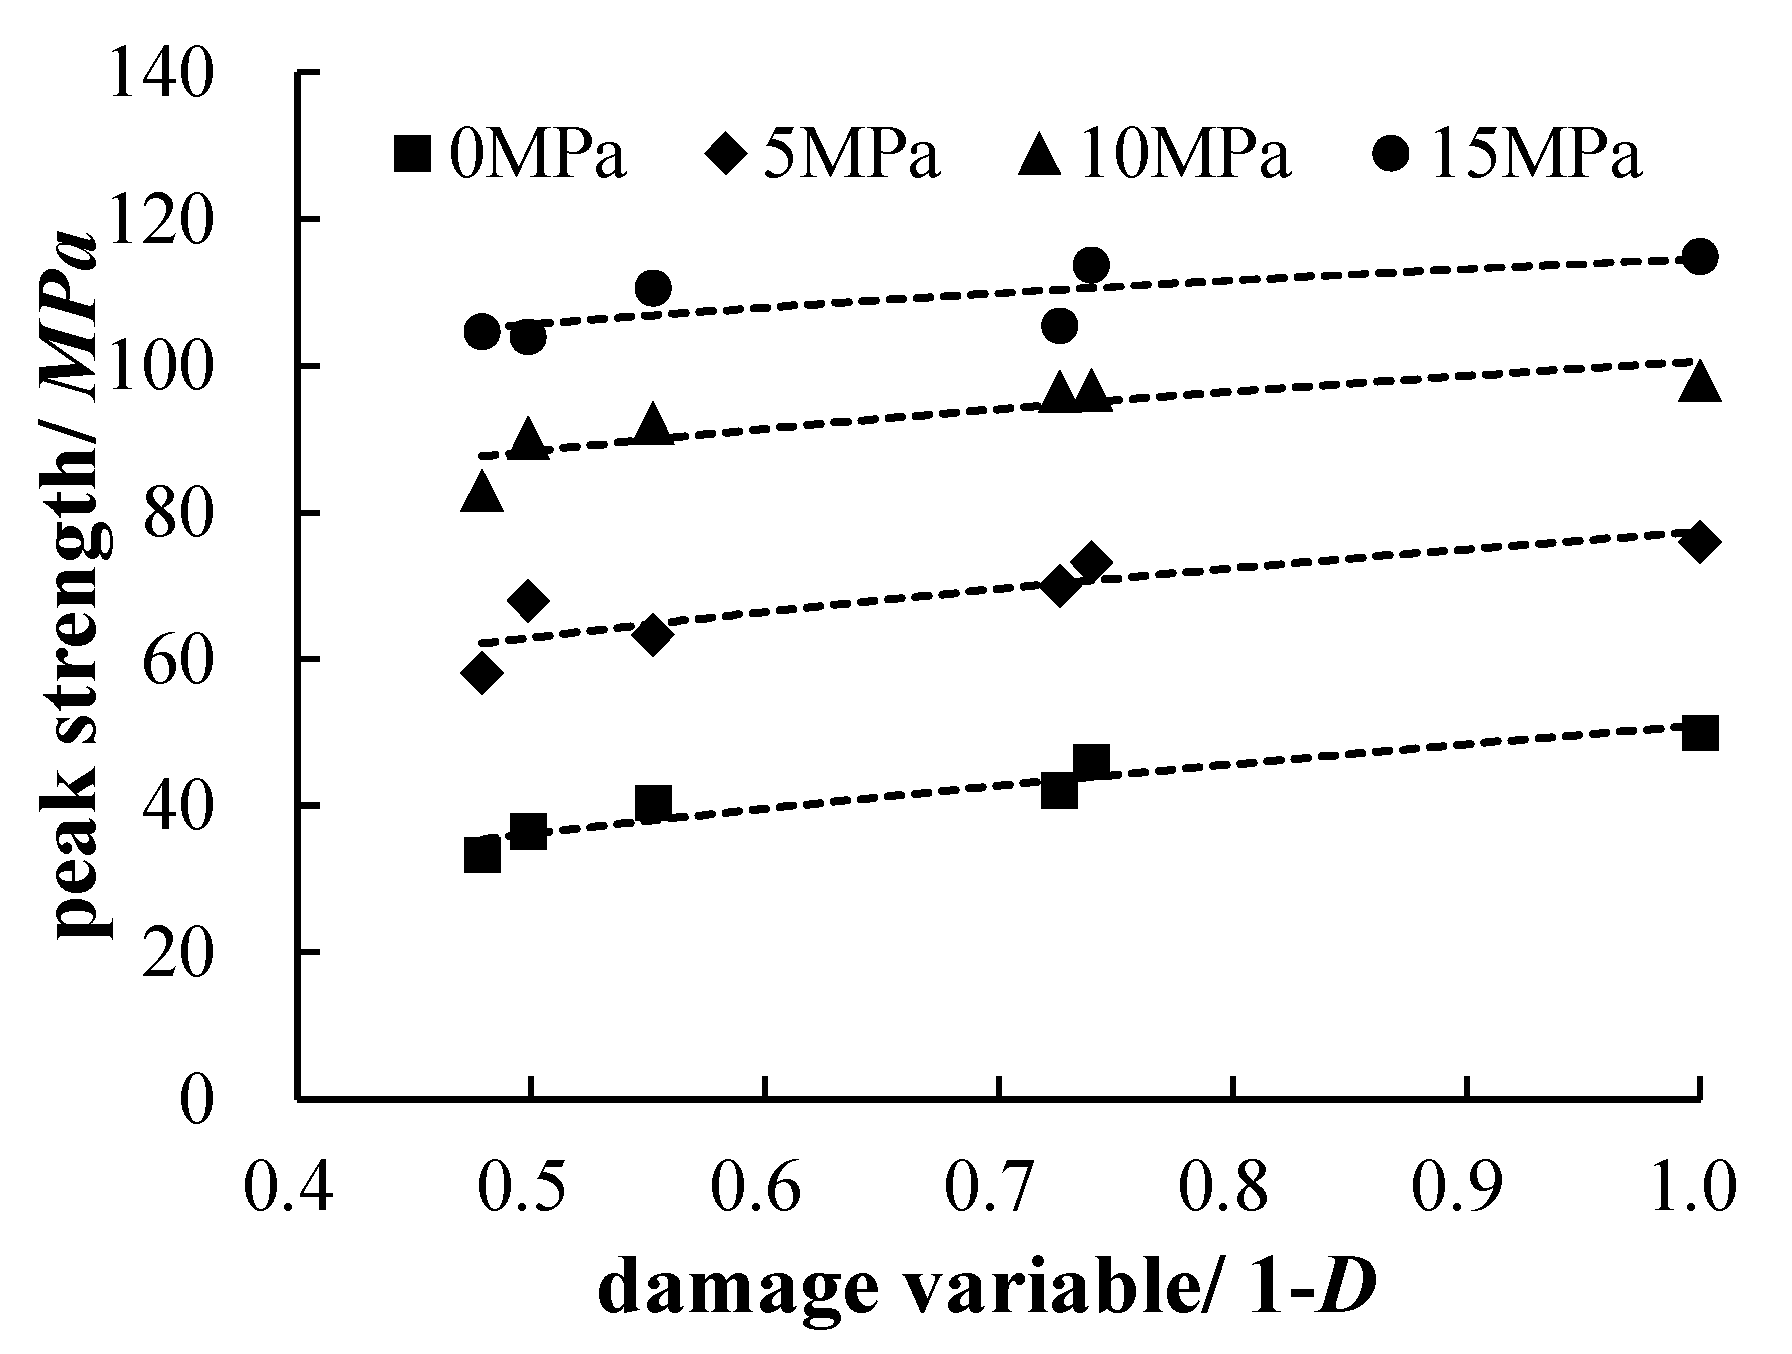
The damage variable of sandstones undergoing the drying-wetting cycle has a power function relationship with the drying-wetting cycle number. Also, the initial drying-wetting cycle stage has the most significant influence on the P-wave velocity of the sandstones. There is a large error rate difference between the test and predicted values of the traditional strength prediction model based on the P-wave velocity.
(4)
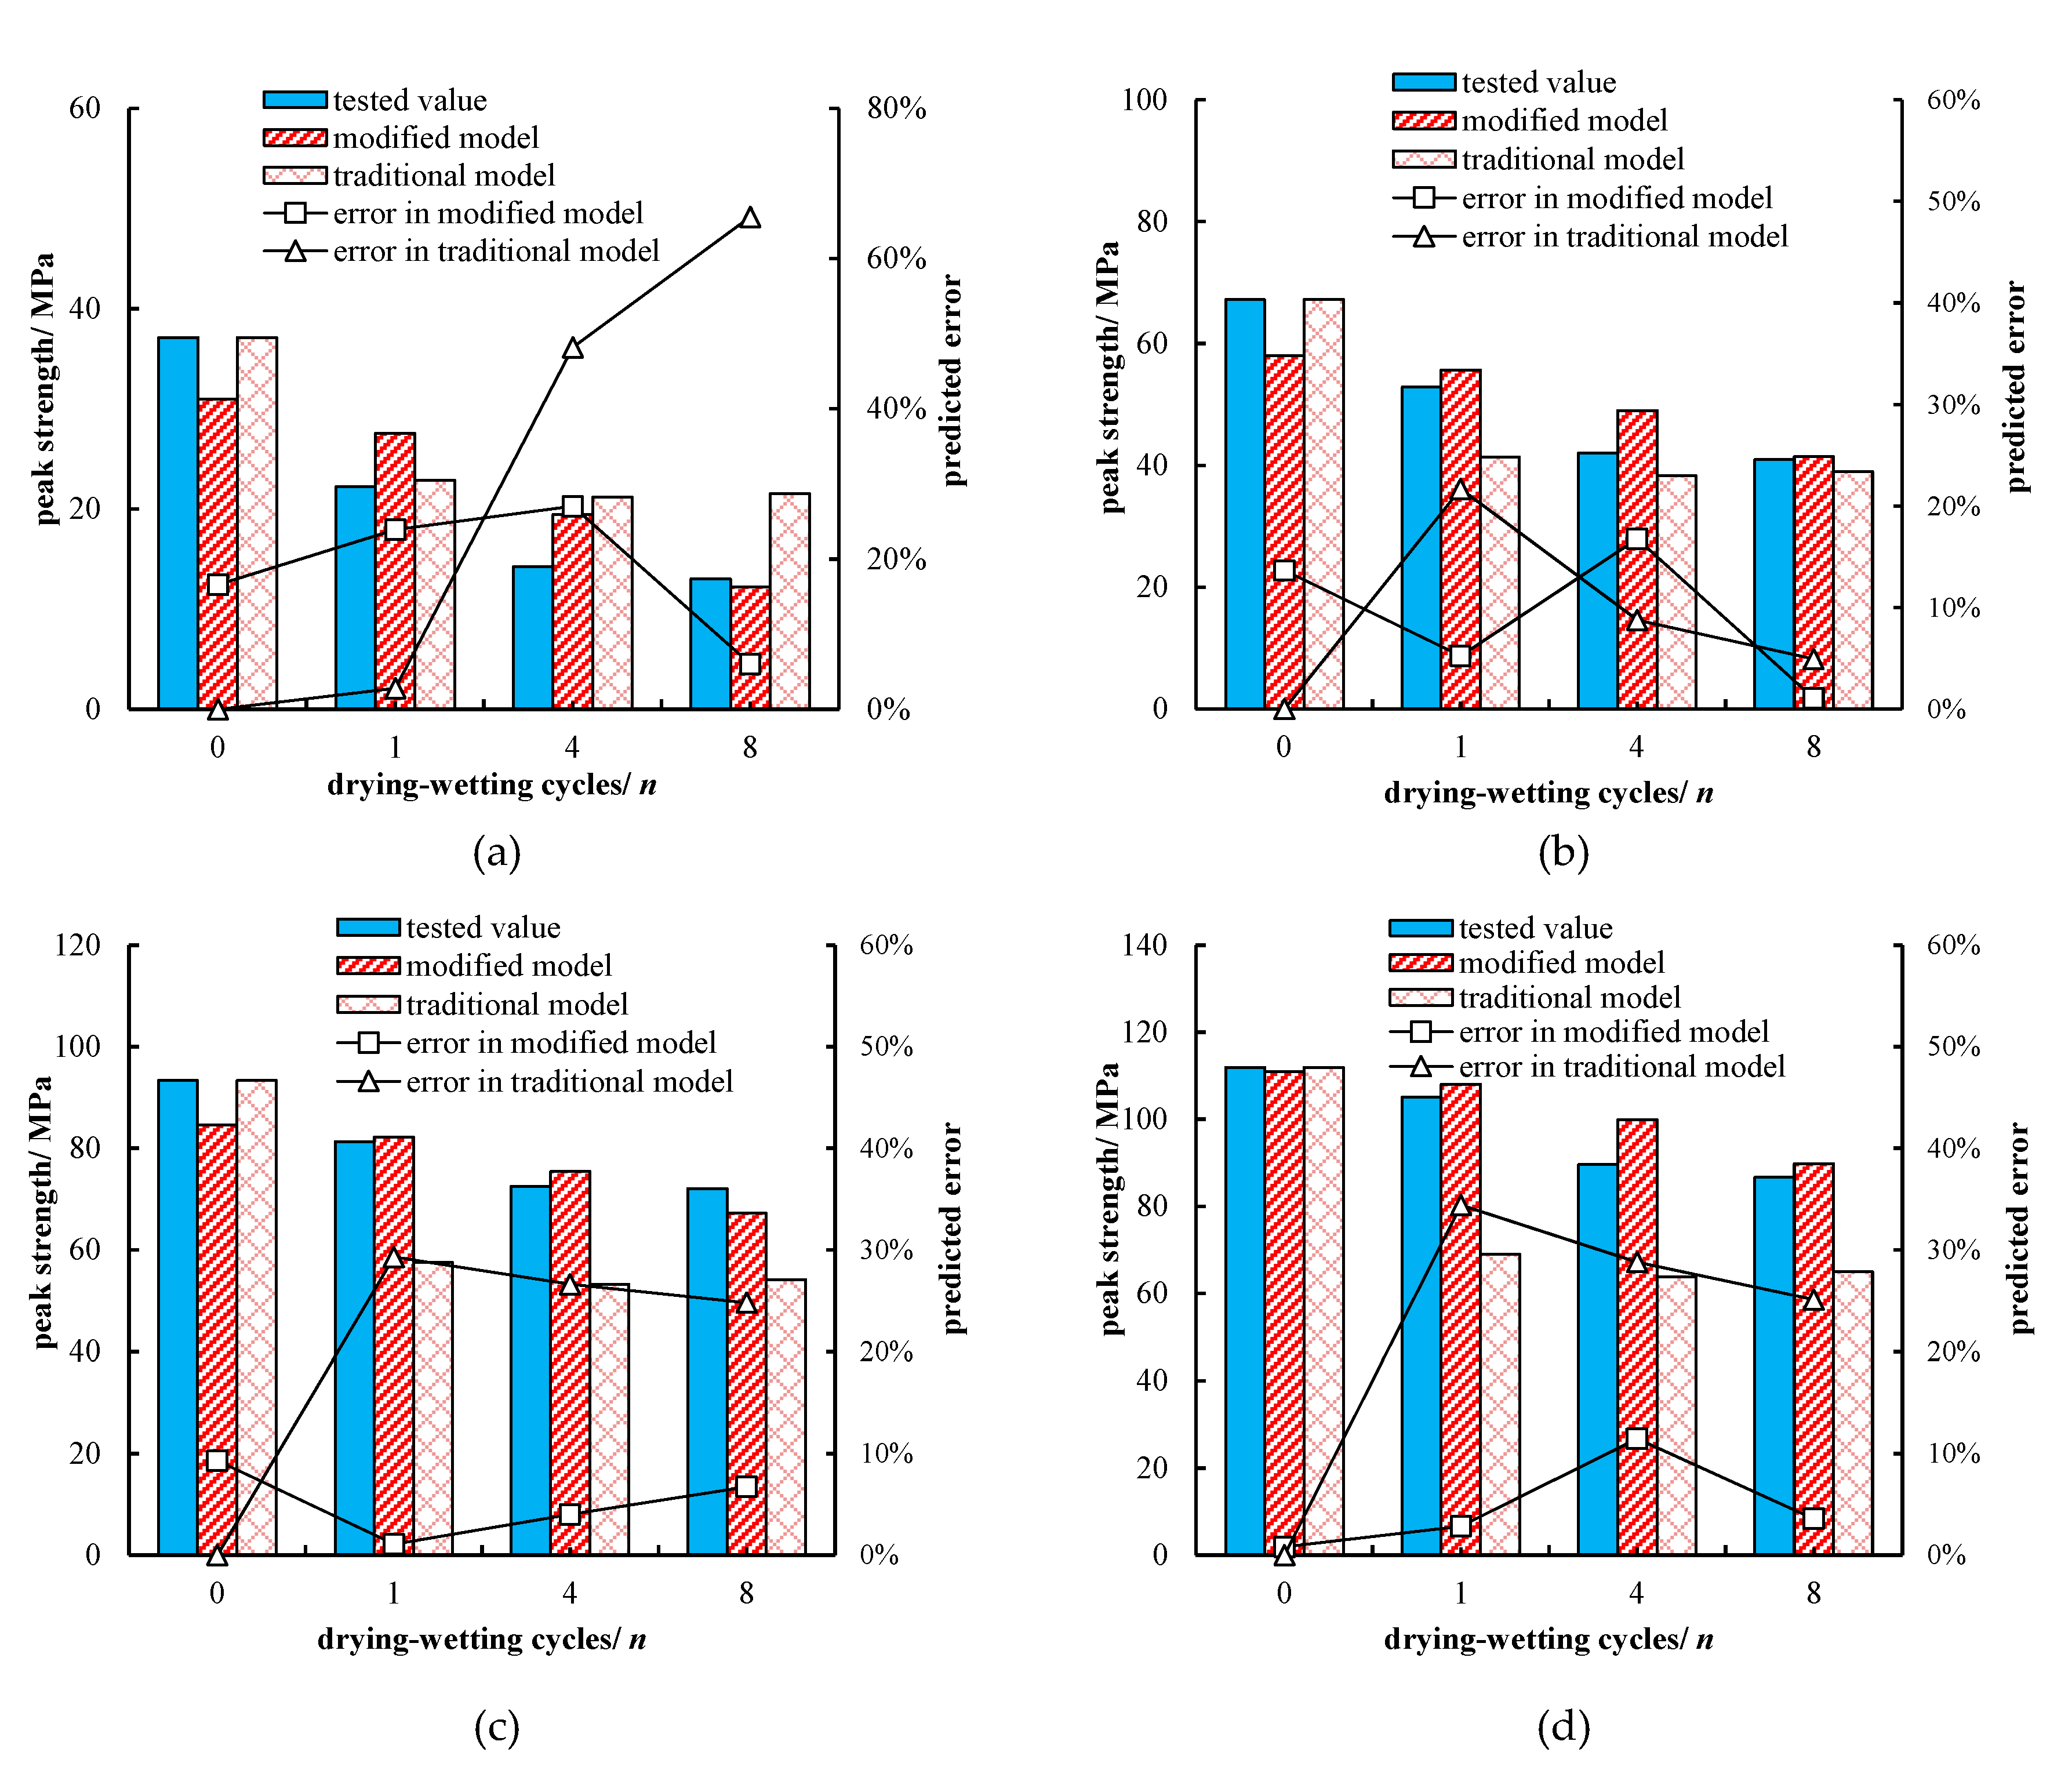
The peak strength of sandstones is a united composite function of the confining pressure and drying–wetting cycle number. The modified strength prediction model considering the drying–wetting cycle number and confining pressures was established based on the traditional strength prediction model. Compared with the traditional strength prediction model, the error of the modified model is greatly reduced and the prediction effect is better. The results show that it is reasonable and feasible to predict the strength of sandstones while considering the effect of the drying-wetting cycle and confining pressures by using the modified strength prediction model based on the P-wave velocity.

Author Contributions

Investigation and sampling, Z.-H.X. and Y.-M.H.; methodology, Q.-C.S., G.-L.F. and Z.-H.X.; writing—original draft preparation, Z.-H.X., Q.-C.S.; writing—review and editing, G.-L.F. and G.-D.Z.; data curation, Z.-H.X. and Q.-C.S. All authors have read and agreed to the published version of the manuscript.

Funding

This research was funded by the National Natural Science Foundation of China (grant numbers 51909136 and 51709256); Hubei Provincial Natural Science Foundation of China, grant numbers 2019CFB327 and 2019CFB332; the Open Research Fund of National Field Observation and Research Station of Landslides in Three Gorges Reservoir Area of Yangtze River, China Three Gorges University, grant number 2018KTL11.

Acknowledgments

The authors gratefully acknowledge the support by Young Talents Development Plan of Hubei province.

Conflicts of Interest

The authors declare no conflict of interest.

References

  1. Peng, T.; Xu, G.; Xia, D.Q. Trend of geological hazards and countermeasure of disaster reduction in the Three Gorges Reservoir Area. J. Mt. Sci. 2004, 22, 719–724. [Google Scholar] [CrossRef]
  2. Yang, C.; Hu, Z.X.; Huang, D.; Guo, F. Failure mechanism of primary support for a shallow and asymmetrically loaded tunnel portal and treatment measures. J. Perform. Constr. Facil. 2020, 34, 1–13. [Google Scholar] [CrossRef]
  3. Gratchev, I.; Pathiranagei, S.V.; Kim, D.H. Strength properties of fresh and weathered rocks subjected to wetting–drying cycles. Geomech. Geophys. Geo-Energy Geo-Resour. 2019, 5, 211–221. [Google Scholar] [CrossRef] [Green Version]
  4. Chen, X.; He, P.; Qin, Z. Strength Weakening and energy mechanism of rocks subjected to wet–dry cycles. Geotech. Geol. Eng. 2019, 37, 3915–3923. [Google Scholar] [CrossRef]
  5. Özbek, A. Investigation of the effects of wetting–drying and freezing–thawing cycles on some physical and mechanical properties of selected ignimbrites. Bull. Eng. Geol. Environ. 2013, 73, 595–609. [Google Scholar] [CrossRef]
  6. Ma, Q.Y.; Yu, P.Y.; Yuan, P. Experimental study on creep properties of deep siltstone under cyclic wetting and drying. Chin. J. Rock Mech. Eng. 2018, 37, 593–600. [Google Scholar] [CrossRef]
  7. Torres-Suarez, M.C.; Alarcon-Guzman, A.; Berdugo-De Moya, R. Effects of loading-unloading and wetting-drying cycles on geomechanical behaviors of mudrocks in the Colombian Andes. J. Rock Mech. Geotech. Eng. 2014, 6, 257–268. [Google Scholar] [CrossRef] [Green Version]
  8. Fu, Y.; Yuan, W.; Liu, X.R.; Miao, L.L.; Xie, W. Deterioration rules of strength parameters of sandstone under cyclical wetting and drying in acid-based environment. Rock Soil Mech. 2018, 39, 3331–3339. [Google Scholar] [CrossRef]
  9. Liu, X.R.; Li, D.L.; Wang, Z.; Zhang, L. The effect of dry-wet cycles with acidic wetting fluid on strength deterioration of shaly sandstone. Chin. J. Rock Mech. Eng. 2016, 35, 1543–1554. [Google Scholar] [CrossRef]
  10. Fu, Y.; Wang, Z.J.; Liu, X.R.; Yuan, W.; Miao, L.L.; Liu, J.; Dun, Z.Y. Meso damage evolution characteristics and macro degradation of sandstone under wetting-drying cycles. Chin. J. Geotech. Eng. 2017, 39, 1653–1661. [Google Scholar] [CrossRef]
  11. Zhou, C.Y.; Li, K.W.; Xiang, Z.W.; Li, J.M. Analysis of mesoscopic frictional contacts in soft rocks under water-stress interaction. Rock Soil Mech. 2015, 36, 2458–2466. [Google Scholar] [CrossRef]
  12. Li, K.G.; Zheng, D.P.; Huang, W.H. Mechanical behavior of sandstone and its neural network simulation of constitutive model considering cyclic drying-wetting effect. Rock Soil Mech. 2013, 34, 168–173. [Google Scholar] [CrossRef]
  13. Wang, Z.J.; Liu, X.R.; Fu, Y. Deterioration of mechanical parameters of argillaceous sandstone under wetting-drying cycles in acidic environment. Chin. J. Geotech. Eng. 2016, 38, 1152–1159. [Google Scholar] [CrossRef]
  14. Luo, Z.S.; Li, J.L.; Wang, L.H.; Assefa, E.; Deng, H.F. Study on the creep characteristics of sandstone under coupled stress-water pressure. Period. Polytech. Civil Eng. 2019, 63, 1038–1051. [Google Scholar] [CrossRef]
  15. Heidari, M.; Khanlari, G.R.; Kaveh, M.T. Predicting the uniaxial compressive and tensile strengths of gypsum rock by point load testing. Rock Mech. Rock Eng. 2012, 45, 265–273. [Google Scholar] [CrossRef]
  16. Lu, G.D.; Yan, E.C.; Wang, H.L. Prediction on uniaxial compressive strength of carbonate based on geological nature of rock. J. Ji Lin Univ. 2013, 43, 222–228. [Google Scholar] [CrossRef]
  17. Madhubabu, N.; Singh, P.K.; Kainthola, A.; Mahanta, B.; Tripathy, A.; Singh, T.N. Prediction of Compressive Strength and elastic modulus of carbonate rocks. Measurement 2016, 88, 202–213. [Google Scholar] [CrossRef]
  18. Mahdiabadi, N.; Khanlari, G. Prediction of uniaxial compressive strength and modulus of elasticity in calcareous mudstones using neural networks, fuzzy systems, and regression analysis. Period. Polytech. Civil Eng. 2019, 63, 104–114. [Google Scholar] [CrossRef]
  19. Jahed Armaghani, D.; Asteris, P.G.; Askarian, B.; Hasanipanah, M.; Tarinejad, R.; Huynh, V.V. Examining Hybrid and Single SVM Models with Different Kernels to Predict Rock Brittleness. Sustainability 2020, 12, 2229. [Google Scholar] [CrossRef] [Green Version]
  20. Mahmoud, A.A.; Elkatatny, S.; Al Shehri, D. Application of Machine Learning in Evaluation of the Static Young’s Modulus for Sandstone Formations. Sustainability 2020, 12, 1880. [Google Scholar] [CrossRef] [Green Version]
  21. Asheghi, R.; Abbaszadeh Shahri, A.; Khorsand, Z.M. Prediction of uniaxial compressive strength of diferent quarried rocks using metaheuristic algorithm. Arab. J. Sci. Eng. 2019, 44, 8645–8659. [Google Scholar] [CrossRef]
  22. Wang, Z.J.; Liu, X.R.; Fu, Y.; Yuan, W.; Miao, L.L. Comprehensive screening method of ultrasonic-rebound-density for two kinds of rock specimens. Chin. J. Rock Mech. Eng. 2018, 37, 3575–3583. [Google Scholar] [CrossRef]
  23. Xu, Z.H.; Zhang, G.D.; Sun, Q.C.; Wu, H.; Tan, T.X. Experimental Research on Strength Degradation of Red Sandstone under Dry-wet Cycle Conditions. Chin. J. Highw. Transp. 2018, 31, 226–233. [Google Scholar] [CrossRef]
  24. Feng, G.L.; Feng, X.T.; Chen, B.R.; Xiao, Y.X.; Liu, G.F.; Zhang, W.; Hu, L. Characteristics of microseismicity during breakthrough in deep tunnels: Case study of Jinping-II hydropower station in China. Int. J. Geomech. 2020, 20, 04019163. [Google Scholar] [CrossRef]
  25. Feng, G.L.; Feng, X.T.; Chen, B.R.; Xiao, Y.X.; Zhao, Z.N. Effects of structural planes on the microseismicity associated with rockburst development processes in deep tunnels of the Jinping-II Hydropower Station, China. Tunn. Undergr. Space Technol. 2019, 84, 273–280. [Google Scholar] [CrossRef]
  26. Hayat, M.B.; Ur Rehman, A.; Ali, D.; Saleem, A.; Mustafa, N. Developing empirical models for uniaxial compressive strength prediction by using non-destructive test results. J. Min. Sci. 2019, 55, 883–892. [Google Scholar] [CrossRef]
  27. Heidari, M.; Mohseni, H.; Jalali, S.H. Prediction of uniaxial compressive strength of some sedimentary rocks by fuzzy and regression models. Geotech. Geol. Eng. 2018, 36, 401–412. [Google Scholar] [CrossRef]
  28. Abdelhedi, M.; Jabbar, R.; Mnif, T.; Abbes, C. Ultrasonic velocity as a tool for geotechnical parameters prediction within carbonate rocks aggregates. Arab. J. Geosci. 2020, 13, 1–11. [Google Scholar] [CrossRef]
  29. Kahraman, S. Evaluation of simple methods for assessing the uniaxial compressive strength of rock. Int. J. Rock Mech. Min. Sci. 2001, 38, 981–994. [Google Scholar] [CrossRef]
  30. Jahed Armaghani, D.; Mohd Amin, M.F.; Yagiz, S.; Faradonbeh, R.S.; Abdullah, R.A. Prediction of the uniaxial compressive strength of sandstone using various modeling techniques. Int. J. Rock Mech. Min. Sci. 2016, 85, 174–186. [Google Scholar] [CrossRef]
  31. Yagiz, S. P-wave velocity test for the assessment of some geotechnical properties of rock materials. Bull. Mater. Sci. 2011, 34, 947–953. [Google Scholar] [CrossRef]
  32. Abdelhamid, M.M.A.; Li, D.; Ren, G. Predicting Unconfined Compressive Strength Decrease of Carbonate Building Materials against Frost Attack Using Nondestructive Physical Tests. Sustainability 2020, 12, 1379. [Google Scholar] [CrossRef] [Green Version]
  33. Ministry of Water Resources of the People’s Republic of China. SL264-2001, Specifications for Rock Tests in Water Conservancy and Hydroelectric Engineering; China WaterPower Press: Beijing, China, 2001. (In Chinese) [Google Scholar]
  34. Han, F.; Ji, H.; Zhang, W. Relationship between the acoustic characteristics and damage variable in the process of uniaxial loading and unloading. J. Univ. Sci. Technol. Beijing 2007, 29, 452–455. [Google Scholar] [CrossRef]
  35. Lemaitre, J. How to use damage mechanics. Nucl. Eng. Design 1984, 80, 233–245. [Google Scholar] [CrossRef]
  36. Zhang, Z.H.; Jiang, Q.H.; Zhou, C.B.; Liu, X.T. Strength and failure characteristics of Jurassic Red-Bed sandstone under cyclic wetting–drying conditions. Geophys. J. Int. 2014, 198, 1034–1044. [Google Scholar] [CrossRef]
Figure 1. X-ray diffraction pattern.
Sustainability 12 05655 g001
Figure 2. The drying-wetting process.
Sustainability 12 05655 g002
Figure 3. Schematic diagram of the test process.
Sustainability 12 05655 g003
Figure 4. The relationship of the P-wave velocity and drying-wetting cycles.
Sustainability 12 05655 g004
Figure 5. The stress-strain curves undergoing drying-wetting cycles: (a) 0 cycle; (b) 4th cycle; (c) 8th cycle; (d) 12th cycle; (e) 16th cycle; (f) 20th cycle.
Sustainability 12 05655 g005
Figure 6. Peak strength of samples undergoing different drying-wetting cycles under different confining pressures.
Sustainability 12 05655 g006
Figure 7. Relationship of the reduction rate of peak strength and confining pressure.
Sustainability 12 05655 g007
Figure 8. The relationship of damage variable Dpn and drying-wetting cycles.
Sustainability 12 05655 g008
Figure 9. The predicted and tested peak strength based on the traditional strength prediction model: (a) 0 MPa; (b) 5 MPa; (c) 10 MPa; (d) 15 MPa.
Sustainability 12 05655 g009
Figure 10. The relationship of the peak strength and damage variable in different confining pressures.
Sustainability 12 05655 g010
Figure 11. The relationship between parameters a σ 3 , b σ 3 and the confining pressure: (a) parameter a σ 3 ; (b) parameter.
Sustainability 12 05655 g011
Figure 12. Comparison of strengths predicted by the models based on wave velocity and error analysis: (a) 0 MPa; (b) 5 MPa; (c) 10 MPa; (d) 15 MPa.
Sustainability 12 05655 g012
Figure 13. The evolution law of the damage variable D’pn based on [36].
Sustainability 12 05655 g013
Figure 14. Validation results: (a) 0 MPa; (b) 5 MPa; (c) 10 MPa; (d) 15 MPa.
Sustainability 12 05655 g014
Table 1. The main technical parameters of the RMT-150C rock test system.
ParametersValue
Vertical maximum output1000 kN, 100 kN (2 levels)
Horizontal maximum output500 kN, 100 kN (2 levels)
Vertical piston stroke50 mm
Horizontal piston stroke50 mm
Range of confining pressure0–50 MPa
Range of deformation rate0.0001–1.0 mm/s (13 levels)
Loading rate0.01–100.0 kN/s (13 levels)
Confining pressure rate0.001–1.0 MPa/s (10 levels)
Fatigue frequency0.001–1.0 Hz (10 levels)
Frame stiffness5000 kN/mm
Table 2. Parameter values of different confining pressures.
Parameter0 MPa5 MPa10 MPa15 MPa
a σ 3 50.96977.370100.600114.590
b σ 3 0.49410.29800.18750.1168

