Abstract
Littoral wetlands are globally important for sustainable development; however, they have recently been identified as critical hotspots of nitrous oxide (N2O) emissions. N2O flux from subtropical littoral wetlands remains unclear, especially under the current global warming environment. In the littoral zone of Lake Poyang, a simulated warming experiment was conducted to investigate N2O flux. Open-top chambers were used to raise temperature, and the static chamber-gas chromatograph method was used to measure N2O flux. Results showed that the littoral zone of Lake Poyang was an N2O source, with an average flux rate of 8.9 μg N2O m−2 h−1. Warming significantly increased N2O emission (13.8 μg N2O m−2 h−1 under warming treatment) by 54% compared to the control treatment. N2O flux in the spring growing season was also significantly higher than that of the autumn growing season. In addition, temperature was not significantly related to N2O flux, while soil moisture only explained about 7% of N2O variation. These results imply that N2O emission experiences positive feedback effect on the ongoing warming of the climate, and abiotic factors (e.g., soil temperature and soil moisture) were not main controls on N2O variation in this littoral wetland.
1. Introduction
The global temperature has increased by 0.85 °C over the past three decades and is projected to increase by 0.3–4.8 °C by the end of the 21st century [1]. Climate warming may exert great influences on greenhouse gas (GHG) fluxes in wetlands [2,3] due to the large carbon and nitrogen stocks/emissions and the high temperature sensitivity [4,5,6]. Nitrous oxide (N2O) is a long-lived GHG, a dominant ozone-depleting substance, and an environmental air pollutant, which not only contributes to climate change but also impacts human health [7,8]. Although carbon dioxide (CO2) is the most abundant GHG in the atmosphere, the global warming potential of N2O is approximately 265 times higher than that of CO2 over a 100-year timescale [9]. The concentration of atmospheric N2O reached new highs in 2018 at 331 ppb, and natural sources (e.g., wetlands, forests, and oceans) contributed about 60% of global N2O emissions [10]. However, the global N2O budget is far from being fully understood due to the lack of available data from all natural ecosystems [11], especially in the largely unexplored littoral wetlands.
The impacts of climate warming on N2O flux are complex, with positive [12], negative [13], or neutral [14] effects having been reported in previous studies. This is because warming may affect multiple processes, such as the characteristics of soil and microbial activities, which may further alter the pristine balance of N2O production and consumption [12,13,14,15,16]. For example, Chen et al. (2017) found that warming could transform an alpine swamp meadow from an N2O sink to an N2O source [15]; Qiu et al. (2018) reported that warming can stimulate N2O emission by increasing soil labile carbon, soil nitrogen mineralization, and the biomass of N2O-producing microbes [16]. Moreover, soil temperature and soil moisture are two key factors affecting the dynamics of GHG and are highly sensitive to climate warming [17,18]. Experimental warming usually tends to increase soil temperature and decrease soil moisture and thereby stimulates N2O emission by increasing available nitrogen and microbial activities [19,20]. However, another study has shown that warming has no impact on N2O flux due to the uncertain effects of warming on soil moisture in different periods [21]. These inconsistent results indicate the inconclusive results regarding the response of N2O flux to the soil environment under warming treatment. Therefore, we need more in-depth studies regarding the dependency of N2O flux on soil temperature and soil moisture to improve our understanding of the N2O cycle in wetlands under a future warming environment.
To date, most studies of the N2O cycle have been conducted in cropland [22], grassland [23], or forest [24] ecosystems as well as boreal wetlands [25] rather than in subtropical or tropical wetlands. Littoral wetlands usually act as biogeochemically active transition zones between terrestrial and aquatic ecosystems [26] and emit more N2O than pelagic areas from lakes [27]. Vegetated littoral wetlands are reported to be the hotspots of N2O emission, with mean N2O flux rate of 284 μg N2O m−2 h−1 across China’s lakes [27]. Lake Poyang, the largest subtropical freshwater lake in China, includes a littoral zone and pelagic area. With the seasonal fluctuation of water level, the littoral zone of Lake Poyang varies between the uninundated condition and the inundated condition and thus experiences dramatic variability in its biogeochemical cycle [28,29]. To our knowledge, previous studies of GHG fluxes are still insufficient in Lake Poyang. These studies have mainly focused on the temporal variations of plant-mediated carbon (CO2 and CH4) fluxes in this littoral wetland [30,31,32], but available data of N2O flux are scarce, and the response of N2O flux to climate warming also remains unknown. These unbalanced and inadequate studies urge us to assess N2O emission from the perspective of this subtropical littoral wetland, especially with the consideration of the effect of current climate warming.
To address these knowledge gaps, we conducted a simulated warming experiment in the littoral zone of Lake Poyang during the uninundated period. We hypothesised that (1) the littoral zone of Lake Poyang is an N2O source during the uninundated period, (2) warming has a positive effect on N2O emission in this littoral wetland, and (3) soil temperature and soil moisture are the main controls on N2O flux in the littoral zone of Lake Poyang during the uninundated period.
2. Materials and Methods
2.1. Study Site
This study was conducted in the littoral zone of Lake Poyang (29°27′00″ N, 116°01′14″ E), the largest subtropical freshwater lake in China. Located in a subtropical monsoon climatic zone, this region’s annual precipitation ranges from 1566 mm to 1847 mm, and annual mean air temperature ranges from 15 °C to 18 °C [29]. Lake Poyang is an ephemeral lake which experiences drastic seasonal changes in its water level. Lake Poyang comprises a permanent water body and seasonally flooding littoral zone. As shown in Figure 1, the littoral wetland is usually inundated when the water level is relatively high (June to August) and uninundated when the water level is relatively low (September to the next May). During the uninundated period, the littoral zone of Lake Poyang is dominated by Carex species, which has two growing seasons: the autumn growing season, from September to December, and the spring growing season, from February to May. The main vegetation of this site is Carex cinerascens, followed by Eleocharis valleculosa, Cardamine lyrata and Potentilla limprichtii. This littoral wetland is covered with meadow soil on the ground surface, characterized as sandy loam. Table 1 shows the main characteristics of soil in this littoral wetland. Additionally, this study area was an unexplored nature reserve of Jiangxi Province, China, and there was no water on the ground during the entire experimental period.
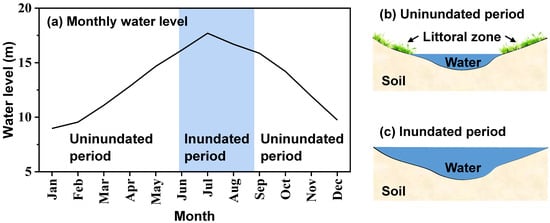
Figure 1.
Variation of (a) surface water level and (b,c) inundation area of Lake Poyang. Panel (a) shows the average monthly water level from 1953 to 2015 at Xingzi station (a representative hydrological station of Lake Poyang). Panel (b,c) are the schematic diagrams of the inundation area of Lake Poyang for (b) the uninundated period and (c) the inundated period.

Table 1.
Soil characteristics under control and warming (mean ± standard error). TN: total nitrogen; SOC: soil organic carbon.
2.2. Experimental Design
The experiment was manipulated as a completely random design with two different treatments: control and warming. Each treatment was replicated in four blocks. In total, eight plots were established with an area of 2 m × 2 m for each plot. The distance between any block was over 5 m and that between each adjacent plot was over 2 m. A passive experimental warming device—open-top chambers (OTCs)—was used to simulate a warming environment following the instructions of the International Tundra Experiment [33,34]. OTCs have been verified effectively and are widely used in multiple terrestrial ecosystems, including forests [35], grasslands [36,37], and wetlands [2,38]. In this experiment, OTCs were made of transparent synthetic glass with a 5 mm thickness. OTCs were 80 cm tall and hexagonal with a top area of 0.6 m2 and a bottom area of 2.6 m2. At the end of August 2018, OTCs were installed and kept in place throughout the whole experimental period.
2.3. Gas Sampling and Analysis
N2O flux was measured using the opaque static chamber and gas chromatograph technique during the uninundated period from September 2018 to May 2019. The static chamber was made of PVC, including two parts: a top chamber and a base collar. The base collar was equipped with a groove on the top and was buried under ground at a 10 cm depth before the experimental site was inundated. The top chamber was 30 cm in height and 30 cm in diameter. The groove was filled with some water and fitted to the top chamber to generate a closed environment. Then, gas samples were collected from the closed chamber using a 50 mL syringe every 10 min for half an hour. Measurements were conducted between 9:00 to 15:00 local time, twice a month (except February and April 2019). Gas samples were taken to a laboratory and analyzed within three days after sampling. A gas chromatograph (Agilent 7890B, Agilent Technologies, CA, USA) equipped with an electron capture detector was used to analyze N2O concentration. N2O flux was calculated with R [39] and the package “flux” [40]. The normalized root-mean-square error (NRMSE) and coefficient of determination (R2) were used to screen the flux data following the procedure of Minke et al. (2016) [41]. In total, 1% of the measurements were therefore rejected.
2.4. Environmental Parameters
A micrometeorological station (HOBO USB Micro Station, Onset Computer Corporation, Bourne, MA, USA) was established at the study site to record precipitation (S-RGB-M002) and air temperature (both control and warming plots, S-TMB-M002) at an interval of 30 min by a data logger (H21-USB). Surface soil (5 cm depth) temperature and moisture in both control and warming plots were recorded automatically every 10 min using a 5TE sensor and Em50 data logger (Decagon Devices, Pullman, WA, USA). In addition, the air temperature of the top chamber, soil temperature, and soil moisture at a 5 cm depth were measured manually for each plot by a thermometer inserted into the top chamber and a portable ProCheck device (Decagon Devices, Pullman, WA, USA), respectively, when sampling gas.
Soil samples were collected from each plot at depths of 0–10 cm in May 2019. In the laboratory, soil samples were air-dried, root-removed, and sieved through a 2 mm mesh for further analysis. Soil pH was measured in ultrapure water at a water to soil ratio of 2.5:1, using a pH meter (PHS-3C, INESA Instrument, Shanghai, China). For the analysis of soil -N and -N, 10 g soil was extracted with 100 mL of 2 mol L−1 KCl solution. Then, the solution was shaken for one hour and stood for 30 min. After the soil suspension was filtered, soil -N and -N were analyzed with the Continuous Flow Analyzer (San plus, SKALAR, Breda, The Netherlands). For the analysis of soil organic carbon (SOC), 10 mL of 3 mol L−1 HCl was added to an approximately 0.5 g soil sample for 12 h to remove the carbonates. Then, the soil sample was centrifuged and washed with ultrapure water several times until it became neutral. It was freeze-dried and sieved through a 0.075 mm mesh. Approximately 10 mg of soil was taken into a tin cup, and SOC was analyzed with the Elemental Analyzer (EA300, EuroVector, Pavia, Italy). In addition, another 10 mg soil sample was weighed after being sieved directly through a 0.075 mm mesh, and total nitrogen (TN) was also measured by the Elemental Analyzer.
2.5. Data Analysis
A linear mixed-effect model with repeated measurements was applied to test the effect of warming on N2O flux using R [39] and the package “lme4” [42]. The model was constructed with the fixed factors of warming by sampling date and the random factors of plot nested within block. In addition, the effects of environmental parameters on N2O flux were also analyzed with the model, in which air temperature, soil temperature and soil moisture were taken as the fixed factors and plot nested within block were taken as the random factors. Regression analysis was applied to test the potential dependency of N2O flux on air temperature, soil temperature, and soil moisture. All significant differences were considered at the 0.05 level.
3. Results
3.1. Environmental Parameters
Total precipitation was 806.6 mm during the experimental period, with more than 60% of precipitation occurred in the spring growing season (Figure 2a). Warming increased average air temperature by 1.6 °C (Figure 2b).
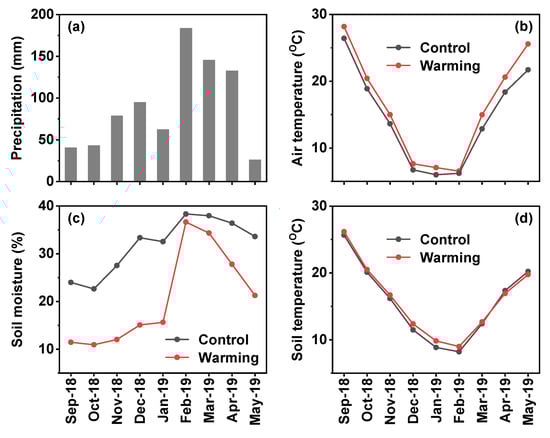
Figure 2.
Variation of (a) monthly precipitation in the study site and monthly (b) air temperature, (c) soil moisture and (d) soil temperature in the control plot and warming plot.
Soil moisture decreased by 11% and soil temperature increased by 0.4 °C under the warming treatment compared to control (Figure 2c,d). The warming effect of OTCs on air temperature was stronger in the spring growing season than in the autumn growing season; the inverse was true for soil moisture and soil temperature. Soil pH, -N, -N, TN, and SOC were not significantly affected by warming (Table 1). Despite the statistical significance, warming increased -N by 27% and -N by 40% compared to the control.
3.2. Effect of Warming on N2O Flux
Over the entire period, N2O flux ranged from –1.5 to 21.9 μg m−2 h−1 under the control treatment and 0.9 to 41.3 μg m−2 h−1 under the warming treatment (Figure 3). The lowest and highest values of N2O flux occurred in November 2018 and May 2019, respectively. The average N2O flux was 8.9 μg m−2 h−1 under the control treatment, indicating that the littoral zone of Lake Poyang was an N2O source during the uninundated period.
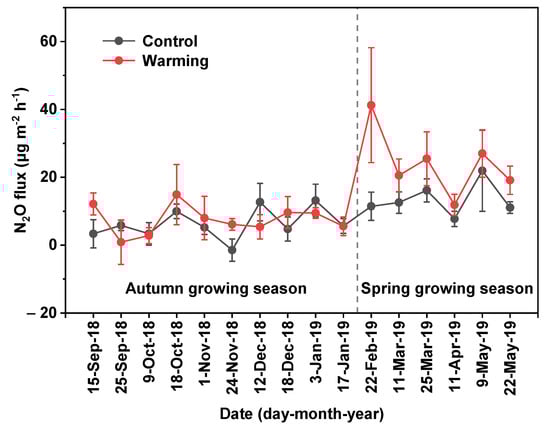
Figure 3.
Temporal variation of N2O flux in the uninundated period under the control and warming treatments. The bars indicate standard error.
According to the analysis results of the linear mixed-effects model, we found that warming had a significant effect on N2O flux, as did the sampling date (Table 2). However, the warming effect did not vary with sampling date. The average N2O flux was 13.8 μg m−2 h−1 under warming treatment. Compared with N2O flux under control treatment, warming significantly increased N2O flux by 54% (Figure 4). From the different growing seasons, the average N2O flux under control treatment was 6.2 μg m−2 h−1 in the autumn growing season and 13.1 μg m−2 h−1 in the spring growing season, respectively. N2O flux increased by 19% under the warming treatment in the autumn growing season (7.4 μg m−2 h−1), but not significantly, while it significantly increased by 85% under the warming treatment in the spring growing season (24.2 μg m−2 h−1) (Figure 4). In addition, the N2O flux under both treatments in the spring growing season was significantly higher than in the autumn growing season (Figure 4).
Table 2.
Statistical results of the linear mixed-effects model for N2O flux.
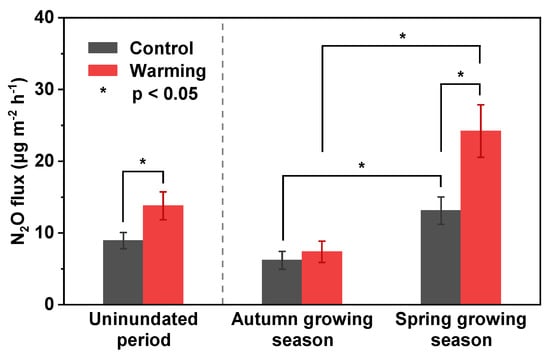
Figure 4.
Average N2O flux under the control and warming treatments. The uninundated period includes two growing seasons: the autumn growing season and the spring growing season. The bars indicate standard error.
3.3. Dependency of N2O Flux on Soil Temperature and Soil Moisture
A significant correlation was observed between N2O flux and soil moisture, while the relationship between N2O flux and temperature (air temperature and soil temperature) was undetectable (Table 2). For both treatments, soil moisture had a significant positive correlation with N2O flux and explained about 7% of N2O flux variation (Figure 5). There was no significant correlation between N2O flux and soil moisture under control treatment. Moreover, a significant positive correlation was found between N2O flux and soil moisture under warming treatment, indicating that warming could increase the relationship between N2O flux and soil moisture.
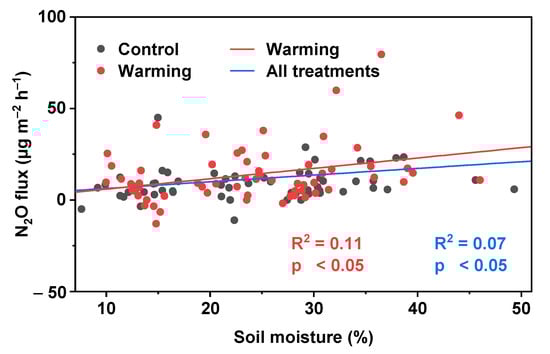
Figure 5.
Relationship between N2O flux and soil moisture.
4. Discussion
4.1. N2O Flux from Different Wetlands
Previous studies have reported a great variability of N2O emission or uptake from different wetlands due to various environmental factors [15,30,43,44,45,46,47,48,49]. Overall, swamps, peatlands, and marshes in cold regions usually acted as an N2O sink or an N2O source, while most littoral wetlands emitted N2O and showed high variation among different locations (Table 3). On the one hand, subtropical and tropical wetlands usually have warmer weather and store more carbon than cold wetlands [50]. This warm environment is more suitable for microbial activity, and thus more N2O is emitted from subtropical and tropical wetlands. On the other hand, littoral wetlands usually experience drastic water level fluctuation and have frequent organic matter transfers between water bodies and lands [26]. These unique thermal conditions and water regimes may determine the greater amount of N2O emission from warm littoral wetlands than other wetlands.
Table 3.
Comparison of N2O flux among different wetlands from other studies.
In this study, the littoral zone of Lake Poyang was an N2O source during the uninundated period, with a mean flux rate of 8.9 ± 1.1 μg N2O m−2 h−1. This result confirms our first hypothesis and is also in line with the result reported by Hu et al. (2016) in the south littoral zone of Lake Poyang [30]. Moreover, N2O flux in the littoral zone of Lake Poyang was much lower than that of Lake Huahu in the Qinghai-Tibetan Plateau [49], which may be attributed to the lower available nitrogen and the non-waterlogged conduction in this study site during the sampling period. When considering the inundated period, N2O flux from the water-air interface in the same littoral zone of Lake Poyang was 29.6 ± 10.7 μg N2O m−2 h−1 (unpublished data), which was more than three times the flux in the uninundated period. Therefore, N2O emission in the littoral zone of Lake Poyang may be greatly influenced by water regimes, meaning that this impact cannot be overlooked when estimating the whole lake’s N2O budget.
4.2. Effect of Warming on N2O Flux
Consistent with previous results in other wetlands [2,15], we found that warming significantly increased N2O flux in this littoral wetland during the uninundated period. This result confirmed our second hypothesis that warming had a positive effect on N2O emission. In the present study, the littoral zone of Lake Poyang varied between being a sink and a source of N2O on an intra-annual timescale. Warming transformed this littoral wetland to a net N2O source during the experimental period. In addition, warming had a much stronger impact on N2O flux in the spring growing season than in the autumn growing season. N2O production is primarily regulated by two microbial activities—nitrification and denitrification—which are highly sensitive to temperature [51]. Warming increased air temperature by 1.6 °C and soil temperature by 0.4 °C, especially during the spring growing season, which can promote both microbial processes. Moreover, N2O flux was significantly related to soil moisture, only accounting for 7% of N2O flux variation, but not to soil temperature. Thus, the third hypothesis was rejected. In other words, N2O flux may be mainly affected by biotic factors (e.g., plants and microbes), rather than abiotic factors (e.g., soil temperature and soil moisture) in the littoral zone of Lake Poyang during the uninundated period.
A recent study found that plant biomass can explain 17–30% of N2O flux variation in the littoral zone of Lake Poyang [30]. In addition, we found that warming increased the content of soil -N and soil -N, which were the two main substrates supporting the processes of nitrification and denitrification. Therefore, warming may lead to more N2O production than N2O consumption, which further determines N2O emission to some extent. Unfortunately, we are currently unaware of the effects of microbial activities on N2O flux in this littoral wetland. These results suggest that future research should pay more attention to N2O emission pathways and related functional microbes.
4.3. Implication of N2O Emission in the Littoral Wetland under Climate Warming
There are great spatial and temporal variabilities in N2O production, consumption, and emission across different wetlands [52,53], making estimations of N2O budgets uncertain and difficult. Given the impacts of global climate change and anthropic activities, the nitrogen cycle has been drastically disrupted, and this has increased the inventory of N2O [54,55]. As such, it is necessary to investigate N2O flux from various wetlands to fully understand the global N2O budget. Moreover, littoral wetlands have been identified as hotspots of N2O emission according to numerous studies [27,49]. Analogously, the littoral zone of Lake Poyang was an N2O source in the present study, and short-term warming can largely promote N2O emission. Unfortunately, the global temperature rise is likely to exceed 2.0 °C by the end of this century under different Representative Concentration Pathways [1], consequently increasing N2O emission from such littoral wetlands and generating a positive feedback effect to climate warming. Therefore, subtropical littoral wetlands may transform from a relatively weak N2O source to a strong N2O source depending on the level of future climate warming.
Despite not considering two other GHGs—CO2 and CH4—in this study, the contribution of N2O to climate warming should not be ignored due to its large global warming potential. Hu et al. (2016) also concluded that N2O should be integrated into the estimation of net GHG emission for the same lake [30]. In addition, warming effects on GHG fluxes will not always be consistent for a continuous long-term period [18]. Here, we only present a short-term warming experiment, but we do not know how N2O flux will respond to long-term warming in this littoral wetland. Therefore, the investigation of the key GHGs (CO2, CH4, and N2O) and long-term measurements are required to draw more comprehensive results in such littoral wetlands.
5. Conclusions
This study investigated N2O emission and examined the effect of climate warming on N2O flux in a subtropical littoral wetland. We concluded that the littoral zone of Lake Poyang was an N2O source and that warming significantly increased N2O emission by 54%, indicating that N2O has a positive feedback effect on climate warming. Temperature had no impact on N2O variation, while soil moisture only explained 7% of N2O variation. Moreover, our result indicates that the impacts of the growing season and water regime on N2O should be considered when estimating the whole lake’s N2O budget.
Author Contributions
Conceptualization, J.C. and L.X.; methodology, J.C. and M.J.; software, J.C.; validation, J.C., L.X., M.J., J.J. and Y.X.; formal analysis, J.C.; investigation, J.C. and M.J.; resources, J.C., M.J. and Y.X.; data curation, J.C.; writing—original draft preparation, J.C.; writing—review and editing, L.X. and Y.X.; visualization, J.C.; supervision, L.X. and J.J.; project administration, L.X., J.J. and Y.X.; funding acquisition, L.X. and J.J. All authors have read and agreed to the published version of the manuscript.
Funding
This research was funded by the National Key Research and Development Program of China (grant number 2018YFE0206400 and 2018YFC0407606), National Natural Science Foundation of China (grant number 41971137 and 41771235), STS Key Projects of the Chinese Academy of Sciences (grant number KFJ-STS-QYZD-098), Science and Technology Planning Project of Qinghai Province (grant number 2019-HZ-818) and China Three Gorges Corporation (grant number 201903145).
Acknowledgments
The authors want to thank their colleagues at the Poyang Laboratory for Wetland Ecosystem Research, Chinese Academy of Sciences for their help with the filed work. The authors also thank the Technology Service Center of Nanjing Institute of Geography and Limnology, Chinese Academy of Sciences for supporting the analysis of soil samples.
Conflicts of Interest
The authors declare no conflict of interest.
References
- IPCC. Climate Change 2013: The Physical Science Basis: Contribution of Working Group I to the Fifth Assessment Report of the Intergovernmental Panel on Climate Change; Stocker, T.F., Qin, D., Plattner, G.-K., Tignor, M., Allen, S.K., Boschung, J., Nauels, A., Xia, Y., Bex, V., Midgley, P.M., Eds.; Cambridge University Press: Cambridge, UK; New York, NY, USA, 2013. [Google Scholar]
- Laine, A.M.; Mehtätalo, L.; Tolvanen, A.; Frolking, S.; Tuittila, E.-S. Impacts of drainage, restoration and warming on boreal wetland greenhouse gas fluxes. Sci. Total Environ. 2019, 647, 169–181. [Google Scholar] [CrossRef]
- Ward, S.E.; Ostle, N.J.; Oakley, S.; Quirk, H.; Henrys, P.A.; Bardgett, R.D. Warming effects on greenhouse gas fluxes in peatlands are modulated by vegetation composition. Ecol. Lett. 2013, 16, 1285–1293. [Google Scholar] [CrossRef] [PubMed]
- Schlesinger, W.H. An estimate of the global sink for nitrous oxide in soils. Glob. Chang. Biol. 2013, 19, 2929–2931. [Google Scholar] [CrossRef]
- Saunders, D.L.; Kalff, J. Nitrogen retention in wetlands, lakes and rivers. Hydrobiologia 2001, 443, 205–212. [Google Scholar] [CrossRef]
- Davidson, E.A.; Janssens, I.A. Temperature sensitivity of soil carbon decomposition and feedbacks to climate change. Nature 2006, 440, 165–173. [Google Scholar] [CrossRef] [PubMed]
- Ravishankara, A.R.; Daniel, J.S.; Portmann, R.W. Nitrous oxide (N2O): The dominant ozone-depleting substance emitted in the 21st century. Science 2009, 326, 123–125. [Google Scholar] [CrossRef]
- Fluegge, K. Does environmental exposure to the greenhouse gas, N2O, contribute to etiological factors in neurodevelopmental disorders? A mini-review of the evidence. Environ. Toxicol. Pharmacol. 2016, 47, 6–18. [Google Scholar] [CrossRef]
- Massara, T.M.; Malamis, S.; Guisasola, A.; Baeza, J.A.; Noutsopoulos, C.; Katsou, E. A review on nitrous oxide (N2O) emissions during biological nutrient removal from municipal wastewater and sludge reject water. Sci. Total Environ. 2017, 596, 106–123. [Google Scholar] [CrossRef]
- WMO. Greenhouse Gas Bulletin: The State of Greenhouse Gases in the Atmosphere Based on Global Observations through 2018; WMO: Geneva, Switzerland, 2019. [Google Scholar]
- Lenhart, K.; Behrendt, T.; Greiner, S.; Steinkamp, J.; Well, R.; Giesemann, A.; Keppler, F. Nitrous oxide effluxes from plants as a potentially important source to the atmosphere. New Phytol. 2019, 221, 1398–1408. [Google Scholar] [CrossRef]
- Voigt, C.; Lamprecht, R.E.; Marushchak, M.E.; Lind, S.E.; Novakovskiy, A.; Aurela, M.; Martikainen, P.J.; Biasi, C. Warming of subarctic tundra increases emissions of all three important greenhouse gases—Carbon dioxide, methane, and nitrous oxide. Glob. Chang. Biol. 2017, 23, 3121–3138. [Google Scholar] [CrossRef]
- Liu, L.; Hu, C.; Yang, P.; Ju, Z.; Olesen, J.E.; Tang, J. Experimental warming-driven soil drying reduced N2O emissions from fertilized crop rotations of winter wheat–soybean/fallow, 2009–2014. Agric. Ecosyst. Environ. 2016, 219, 71–82. [Google Scholar] [CrossRef]
- Zhao, Z.; Dong, S.; Jiang, X.; Liu, S.; Ji, H.; Li, Y.; Han, Y.; Sha, W. Effects of warming and nitrogen deposition on CH4, CO2 and N2O emissions in alpine grassland ecosystems of the Qinghai-Tibetan Plateau. Sci. Total Environ. 2017, 592, 565–572. [Google Scholar] [CrossRef]
- Chen, X.; Wang, G.; Zhang, T.; Mao, T.; Wei, D.; Song, C.; Hu, Z.; Huang, K. Effects of warming and nitrogen fertilization on GHG flux in an alpine swamp meadow of a permafrost region. Sci. Total Environ. 2017, 601–602, 1389–1399. [Google Scholar] [CrossRef] [PubMed]
- Qiu, Y.; Jiang, Y.; Guo, L.; Burkey, K.O.; Zobel, R.W.; Shew, H.D.; Hu, S. Contrasting warming and ozone effects on denitrifiers dominate soil N2O emissions. Environ. Sci. Technol. 2018, 52, 10956–10966. [Google Scholar] [CrossRef] [PubMed]
- Chen, X.; Wang, G.; Huang, K.; Hu, Z.; Song, C.; Liang, Y.; Wang, J.; Song, X.; Lin, S. The effect of nitrogen deposition rather than warming on carbon flux in alpine meadows depends on precipitation variations. Ecol. Eng. 2017, 107, 183–191. [Google Scholar] [CrossRef]
- Zhu, X.; Luo, C.; Wang, S.; Zhang, Z.; Cui, S.; Bao, X.; Jiang, L.; Li, Y.; Li, X.; Wang, Q.; et al. Effects of warming, grazing/cutting and nitrogen fertilization on greenhouse gas fluxes during growing seasons in an alpine meadow on the Tibetan Plateau. Agric. For. Meteorol. 2015, 214–215, 506–514. [Google Scholar] [CrossRef]
- Shi, F.; Chen, H.; Chen, H.; Wu, Y.; Wu, N. The combined effects of warming and drying suppress CO2 and N2O emission rates in an alpine meadow of the eastern Tibetan Plateau. Ecol. Res. 2012, 27, 725–733. [Google Scholar] [CrossRef]
- Chen, X.; Wang, G.; Zhang, T.; Mao, T.; Wei, D.; Hu, Z.; Song, C. Effects of warming and nitrogen fertilization on GHG flux in the permafrost region of an alpine meadow. Atmos. Environ. 2017, 157, 111–124. [Google Scholar] [CrossRef]
- Hu, Y.; Chang, X.; Lin, X.; Wang, Y.; Wang, S.; Duan, J.; Zhang, Z.; Yang, X.; Luo, C.; Xu, G.; et al. Effects of warming and grazing on N2O fluxes in an alpine meadow ecosystem on the Tibetan plateau. Soil Biol. Biochem. 2010, 42, 944–952. [Google Scholar] [CrossRef]
- Yue, Q.; Wu, H.; Sun, J.; Cheng, K.; Smith, P.; Hillier, J.; Xu, X.; Pan, G. Deriving emission factors and estimating direct nitrous oxide emissions for crop cultivation in China. Environ. Sci. Technol. 2019, 53, 10246–10257. [Google Scholar] [CrossRef]
- Dijkstra, F.A.; Morgan, J.A.; Follett, R.F.; LeCain, D.R. Climate change reduces the net sink of CH4 and N2O in a semiarid grassland. Glob. Chang. Biol. 2013, 19, 1816–1826. [Google Scholar] [CrossRef] [PubMed]
- Chen, D.; Fu, X.-Q.; Wang, C.; Liu, X.-L.; Li, H.; Shen, J.-L.; Wang, Y.; Li, Y.; Wu, J.-S. Nitrous oxide emissions from a masson pine forest soil in subtropical central China. Pedosphere 2015, 25, 263–274. [Google Scholar] [CrossRef]
- Vogt, J.; Wu, J.; Altdorff, D.; Le, T.B.; Gong, Y. Nitrous oxide fluxes of a boreal abandoned pasture do not significantly differ from an adjacent natural bog despite distinct environmental conditions. Sci. Total Environ. 2020, 714, 136648. [Google Scholar] [CrossRef] [PubMed]
- Larmola, T.; Alm, J.; Juutinen, S.; Martikainen, P.J.; Silvola, J. Ecosystem CO2 exchange and plant biomass in the littoral zone of a boreal eutrophic lake. Freshw. Biol. 2003, 48, 1295–1310. [Google Scholar] [CrossRef]
- Li, S.; Bush, R.T.; Santos, I.R.; Zhang, Q.; Song, K.; Mao, R.; Wen, Z.; Lu, X.X. Large greenhouse gases emissions from China’s lakes and reservoirs. Water Res. 2018, 147, 13–24. [Google Scholar] [CrossRef]
- Zhao, X.; Liu, Y. Variability of surface heat fluxes and its driving forces at different time scales over a large ephemeral lake in China. J. Geophys. Res. Atmos. 2018, 123, 4939–4957. [Google Scholar] [CrossRef]
- Gu, C.; Mu, X.; Gao, P.; Zhao, G.; Sun, W.; Li, P. Effects of climate change and human activities on runoff and sediment inputs of the largest freshwater lake in China, Poyang Lake. Hydrol. Sci. J. 2017, 62, 2313–2330. [Google Scholar] [CrossRef]
- Hu, Q.; Cai, J.; Yao, B.; Wu, Q.; Wang, Y.; Xu, X. Plant-mediated methane and nitrous oxide fluxes from a carex meadow in Poyang Lake during drawdown periods. Plant Soil 2016, 400, 367–380. [Google Scholar] [CrossRef]
- Zhang, Q.; Gu, X.; Singh, V.P.; Chen, X. Evaluation of ecological instream flow using multiple ecological indicators with consideration of hydrological alterations. J. Hydrol. 2015, 529, 711–722. [Google Scholar] [CrossRef]
- Liu, S.; Chen, Y.; Liu, J. Methane emissions from the littoral zone of Poyang Lake during drawdown periods. J. Freshw. Ecol. 2019, 34, 37–48. [Google Scholar] [CrossRef]
- Hollister, R.D.; Webber, P.J. Biotic validation of small open-top chambers in a tundra ecosystem. Glob. Chang. Biol. 2000, 6, 835–842. [Google Scholar] [CrossRef]
- Marion, G.M.; Henry, G.H.R.; Freckman, D.W.; Johnstone, J.; Jones, G.; Jones, M.H.; Lévesque, E.; Molau, U.; Mølgaard, P.; Parsons, A.N.; et al. Open-top designs for manipulating field temperature in high-latitude ecosystems. Glob. Chang. Biol. 1997, 3, 20–32. [Google Scholar] [CrossRef]
- Xu, Z.; Wan, C.; Xiong, P.; Tang, Z.; Hu, R.; Cao, G.; Liu, Q. Initial responses of soil CO2 efflux and C, N pools to experimental warming in two contrasting forest ecosystems, Eastern Tibetan Plateau, China. Plant Soil 2010, 336, 183–195. [Google Scholar] [CrossRef]
- Li, N.; Wang, G.; Yang, Y.; Gao, Y.; Liu, G. Plant production, and carbon and nitrogen source pools, are strongly intensified by experimental warming in alpine ecosystems in the Qinghai-Tibet Plateau. Soil Biol. Biochem. 2011, 43, 942–953. [Google Scholar] [CrossRef]
- Zong, N.; Geng, S.; Duan, C.; Shi, P.; Chai, X.; Zhang, X. The effects of warming and nitrogen addition on ecosystem respiration in a Tibetan alpine meadow: The significance of winter warming. Ecol. Evol. 2018, 8, 10113–10125. [Google Scholar] [CrossRef] [PubMed]
- Nielsen, C.S.; Michelsen, A.; Strobel, B.W.; Wulff, K.; Banyasz, I.; Elberling, B. Correlations between substrate availability, dissolved CH4, and CH4 emissions in an arctic wetland subject to warming and plant removal. J. Geophys. Res. Biogeosci. 2017, 122, 645–660. [Google Scholar] [CrossRef]
- R Core Team. R: A Language and Environment for Statistical Computing, R version 3.6.1; R Foundation for Statistical Computing: Vienna, Austria, 2019. [Google Scholar]
- Jurasinski, G.; Koebsch, F.; Guenther, A.; Beetz, S. Flux Rate Calculation from Dynamic Closed Chamber Measurements. R package version 0.3-0. 2014. Available online: https://CRAN.R-project.org/package=flux (accessed on 15 July 2020).
- Minke, M.; Augustin, J.; Burlo, A.; Yarmashuk, T.; Chuvashova, H.; Thiele, A.; Freibauer, A.; Tikhonov, V.; Hoffmann, M. Water level, vegetation composition, and plant productivity explain greenhouse gas fluxes in temperate cutover fens after inundation. Biogeosciences 2016, 13, 3945–3970. [Google Scholar] [CrossRef]
- Bates, D.; Mächler, M.; Bolker, B.M.; Walker, S.C. Fitting linear mixed-effects models using lme4. J. Stat. Softw. 2015, 67, 1–48. [Google Scholar] [CrossRef]
- Gong, Y.; Wu, J.; Vogt, J.; Le, T.B. Warming reduces the increase in N2O emission under nitrogen fertilization in a boreal peatland. Sci. Total Environ. 2019, 664, 72–78. [Google Scholar] [CrossRef]
- Juszczak, R.; Augustin, J. Exchange of the greenhouse gases methane and nitrous oxide between the atmosphere and a temperate peatland in central Europe. Wetlands 2013, 33, 895–907. [Google Scholar] [CrossRef]
- Yu, J.; Liu, J.; Sun, Z.; Sun, W.; Wang, J.; Wang, G.; Chen, X. The fluxes and controlling factors of N2O and CH4 emissions from freshwater marsh in Northeast China. Sci. China-Earth Sci. 2010, 53, 700–709. [Google Scholar] [CrossRef][Green Version]
- Li, Y.; Wang, D.; Chen, Z.; Hu, H. Comprehensive effects of a sedge plant on CH4 and N2O emissions in an estuarine marsh. Estuar. Coast. Shelf Sci. 2018, 204, 202–211. [Google Scholar] [CrossRef]
- Hirota, M.; Senga, Y.; Seike, Y.; Nohara, S.; Kunii, H. Fluxes of carbon dioxide, methane and nitrous oxide in two contrastive fringing zones of coastal lagoon, Lake Nakaumi, Japan. Chemosphere 2007, 68, 597–603. [Google Scholar] [CrossRef]
- Huttunen, J.T.; Juutinen, S.; Alm, J.; Larmola, T.; Hammar, T.; Silvola, J.; Martikainen, P.J. Nitrous oxide flux to the atmosphere from the littoral zone of a boreal lake. J. Geophys. Res.-Atmos. 2003, 108, 104421. [Google Scholar] [CrossRef]
- Chen, H.; Wang, M.; Wu, N.; Wang, Y.F.; Zhu, D.; Gao, Y.H.; Peng, C.H. Nitrous oxide fluxes from the littoral zone of a lake on the Qinghai-Tibetan Plateau. Environ. Monit. Assess. 2011, 182, 545–553. [Google Scholar] [CrossRef] [PubMed]
- Mitsch, W.J.; Bernal, B.; Nahlik, A.M.; Mander, Ü.; Zhang, L.; Anderson, C.J.; Jørgensen, S.E.; Brix, H. Wetlands, carbon, and climate change. Landsc. Ecol. 2013, 28, 583–597. [Google Scholar] [CrossRef]
- Duan, P.P.; Song, Y.F.; Li, S.S.; Xiong, Z. Responses of N2O production pathways and related functional microbes to temperature across greenhouse vegetable field soils. Geoderma 2019, 355, 113904113904. [Google Scholar] [CrossRef]
- Jorgensen, C.J.; Struwe, S.; Elberling, B. Temporal trends in N2O flux dynamics in a Danish wetland—Effects of plant-mediated gas transport of N2O and O2 following changes in water level and soil mineral-N availability. Glob. Chang. Biol. 2012, 18, 210–222. [Google Scholar] [CrossRef]
- Kato, T.; Hirota, M.; Tang, Y.H.; Wada, E. Spatial variability of CH4 and N2O fluxes in alpine ecosystems on the Qinghai-Tibetan Plateau. Atmos. Environ. 2011, 45, 5632–5639. [Google Scholar] [CrossRef]
- Canfield, D.E.; Glazer, A.N.; Falkowski, P.G. The evolution and future of earth’s nitrogen cycle. Science 2010, 330, 192–196. [Google Scholar] [CrossRef]
- Gruber, N.; Galloway, J.N. An earth-system perspective of the global nitrogen cycle. Nature 2008, 451, 293–296. [Google Scholar] [CrossRef] [PubMed]


© 2020 by the authors. Licensee MDPI, Basel, Switzerland. This article is an open access article distributed under the terms and conditions of the Creative Commons Attribution (CC BY) license (http://creativecommons.org/licenses/by/4.0/).