Article

The Hydrochemical and Isotopic Evolution of the Surface Water and Groundwater for Impoundment in the Xiluodu Reservoir, Jinsha River, China

1
School of Earth Sciences and Engineering, Hohai University, No. 8 Focheng West Road, Nanjing 211100, China
2
PowerChina Chengdu Engineering Corporation Limited, No. 1 Huanhua north road, Chengdu 610072, China
*
Author to whom correspondence should be addressed.
Sustainability 2020, 12(14), 5805; https://doi.org/10.3390/su12145805
Submission received: 15 June 2020 / Revised: 15 July 2020 / Accepted: 16 July 2020 / Published: 19 July 2020

Abstract

:
The construction of a large reservoir with a high dam may cause irreversible changes in the water flow system and even affect the original environmental balance. Xiluodu reservoir, as a representative of the high arch dam reservoirs in China, clearly has this potential issue. Based on the monitoring data of the hydrochemistry and stable isotopes of the water (δD, δ18O) in the Xiluodu reservoir, this study presents the evolution of the hydrochemical and isotopic characteristics of the surface water and groundwater in the reservoir before and after impoundment using cluster analysis and saturation index analysis. The main cations in the reservoir water and groundwater change from Ca2+ and Mg2+ to Ca2+ and Na+, respectively, while the ratio of HCO 3 - to the total anions dropped from 0.86 to 0.7 as the main anion. The cluster analysis results show the high correlation between the groundwater and surface water before and after water impoundment. The calculation of saturation indices indicates that the hydrogeochemical process of the groundwater includes a different trend of the dissolution of minerals. The study of deuterium excess shows that the evaporation of the groundwater near the reservoir decreased after impoundment. Based on the above results and the recharge elevation, this research concludes that the interaction between the surface water and groundwater before and after impoundment is prominent and different. The groundwater replenished the river water before impoundment, while this relationship reversed after impoundment. This evolution process is caused by reservoir storage, and the drainage system and other conditions make this evolution possible. In addition, the influence of interaction evolution on the regional water decreases continuously along the dam site, and some areas even have irreversible changes.

1. Introduction

China is listed by the United Nations as one of the thirteen most water-scarce countries in the world. The main problems of water resources are the low per capita possession, the uneven spatial and temporal distribution and the serious water pollution [1,2,3,4]. In order to make full use of limited water resources to support the rapid development of the economy and the process of urbanization, many reservoirs with large installed capacities and storage capacities were built or have been under construction since the last century [5,6,7,8,9].
The impoundment of a reservoir can reverse the groundwater system around the reservoir, leading to the irreversible change of the nature of its hydraulics and hydrochemistry. Furthermore, it can change the stress fields of the local groundwater, and then affect the balance of the original surrounding environment. Thus, it is of vital importance to record the chemical evolution in order to determine the characteristics of groundwater flow when it migrates from the intake area to the discharge area, as the groundwater flow is concealed. There is a strong connection between groundwater and surface water, which is an essential part of analyzing the water balance and water flow systems of an area. Making the interaction between surface water and groundwater clear not only plays an important role in the managing quantity and quality of local water resources; it also provides evidence for the evolution of regional water flow systems after the reservoir impoundment. The interaction between groundwater and surface water can be revealed by reviewing the hydrochemical and isotope evolution of groundwater and surface water [10,11,12,13,14].
It has been demonstrated that both natural and human factors influence groundwater evolution strongly. For instance, recent studies have shown that the specific hydrogeochemical processes are determined by different hydrogeological environments relating to topographical, geological and meteorological conditions [15,16,17,18,19]. In addition, the chemistry of groundwater relies on human activities, such as the exploitation of industry, agriculture and other huge projects [20,21,22]. The influence of the above factors on the chemical evolution of groundwater can be evaluated by the spatial and temporal changes of the concentration of the main dissolved ions on the groundwater seepage diameter [23,24,25,26].
In addition to the hydrochemical method, specific isotope data have been proved to be a useful method to determine the origins of water. Hydrogen and oxygen isotope content (δD and δ18O) and their ratios in precipitation are of vital importance in understanding the changes in natural isotopic concentrations in the hydrological cycle [27,28]. Generally speaking, the changes of phase from vapor to liquid or ice lead to the variation of D/H or 18O/16O ratios [29]. δD and δ18O are linearly related, satisfying δD = 8δ18O + 10; namely, the global atmospheric water line (GMWL) [27]. In most cases, deuterium surplus (d-excess, d), which is expressed as d = δD − 8δ18O, is determined as the deviation of a line with a slope of eight but a non-zero intercept. It comes from diffusion fractionation during evaporation [28]. Hydrogen and oxygen isotopes and their relationships have been widely used to obtain information about the recharge sources of surface water and groundwater, such as the elevation of the recharge area and the relationship between different recharge sources [19,22,30,31,32,33,34,35].
Xiluodu reservoir is located in the north of the Yunnan–Guizhou Plateau, and it is the main stream of the Jinsha River. The research of [36,37,38] evaluated the hydrogeological conditions of this reservoir before and after the impoundment, and [39,40] described the chemical character of the groundwater around Baihetan reservoir, which is at the upper zone of the reservoir along the Jinsha River. Furthermore, [41] studied the causes and distribution characteristics of SO 4 2 - content differences in groundwater on both sides of Wudongde reservoir at the upstream of the Jinsha River. Moreover, [42] investigated the efflorescence process along the Jinsha River, using hydrochemistry and carbon isotopes. Many scholars have studied the hydrochemical and isotopic characteristics of surface water and groundwater in some regions of China, India, Greece, Iraq and other countries [11,13,15,17]. This paper used hydrochemical, isotopic and multivariate analyse techniques, and aimed to (1) find out the hydrochemical and isotopic characteristics of surface water and groundwater before and after impoundment; (2) determine the evolution rules of the interaction between surface water and groundwater during the impoundment; (3) clarify the regularity, characteristics, differences, causes and impact on the environment of these interactions. The research results are of great significance for understanding the regional hydrochemical evolution, and ensuring the long-term safe and stable operation of the dam.

2. Study Area

2.1. Physical Geography

Xiluodu reservoir is located between 103°30’ and 104°30’ E longitude and 28°40’ and 29°20’ N latitude (Figure 1a). It is built on the main stream of the Jinsha River (Figure 1b), which is in the upper reaches of the Yangtze River. The dam of the reservoir is 285.5 m high. The reservoir began to be filled in 2013, and the range of the reservoir level during a storage cycle is 540 m to 600 m.
Yongsheng synclinal basin covers an area of 750 km2 (Figure 1c). It is high in the north and south, with an altitude over 3000 m. The reservoir is located in the west wing of the core of the Yongsheng syncline basin. Judging from the relationship of the groundwater recharge and discharge, the basin can be considered as an independent hydrogeological unit, except for the Jinsha River passing through it [38]. The dam site starts at the Doushaxi ditch and goes down to the Xiluodu ditch, which covers 4 km. The mountains on both sides of the river are thick, and the cross-section of the river valley is relatively symmetrical (Figure 1d) [36]. The study area is located in the subtropical climate zone. According to the survey report, the annual precipitation in the area ranged from 586 mm to 850 mm in 2001, which was concentrated in May to October. The annual evaporation is 934 mm to 2139 mm, and the annual average temperature was 12 °C to 20 °C in 2001. The vertical zonation of the climate is obvious.

2.2. Geology and Hydrogeology

The emergence layer of the dam site (Figure 1d) is mainly the Upper Permian Emeishan basalt (P2β). The Yangxin limestone of the Maokou formation in the upper part of the lower Permian series (P1m) exists in the riverbed near the Doushaxi ditch, upstream of the dam site and the northern and southern part of the synclinal basin, while the sand shale of the Xuanwei formation of the upper Permian series (P2x) remains in the valley shoulder of each bank. There is a disconformable contact between the different layers. Loose deposits of quaternary systems (Q) with various origins are not integrated on the above bedrock. The Permian limestone (P1m) embeds 70 m below the dam foundation, the total thickness of which is about 500 m, while the thickness revealed by drilling is 260–280 m. The drilling shows that the limestone layer mainly contains carbonate minerals, such as calcite and some clay minerals. There is a layer of mud shale sediments (P2βn) about 3–5 m between P2β and P1m, which are marine continental strata [38]. Preliminary investigation showed that the middle part of P2βn contains a small amount of pyrite crystal (FeS2), and the lower part is pale illite clay rock. There is no fault distribution in the area, and the main structural planes are interlayer, intra-layer dislocation interfaces and joint fissures.
The annual average water level of the Jinsha River is about 370 m under natural conditions. The river water level varies greatly, and the variation period is short. The groundwater level on both sides of the basin is higher than the river level most of the time, and the amplitude of the seasonal variation of the groundwater level is more obvious than that of the river level, the maximum variation of which in a year is about 30 m, so the relative magnitude of the groundwater level and the river water level will change with the season. According to the characteristics of the recharge, runoff and discharge of groundwater, the groundwater flow system in the basin can be divided into a local water flow system and a regional water flow system under natural conditions [37]. The local flow system includes the local flow system of the pore medium, fracture medium and fracture–karst medium. The regional water mainly receives precipitation from the high-elevation limestone outcropping area at the edge of the basin (the high-elevation limestone outcropping area) and then flows to the limestone outcropping area in the reservoir for drainage through the limestone layer. The basalt groundwater of the upper Permian Emeishan (the basalt groundwater) is mostly stored in the form of vein water before impoundment. The limestone layer is the main aquifer in the basin, and plays a major role in controlling the process of groundwater recharge and drainage in the region.

3. Methods

3.1. Sampling and Analysis

Twenty sampling points were used at the Xiluodu reservoir between 1996–1999 before impoundment, including fifteen groundwater samples debunking limestone (GB01–GB15), three river water samples (SB1–SB3), a Doushaxi ditch sample (SB4) and a Xiluodu ditch sample (SB5) (Figure 2a). Sixteen samples were collected from the Xiluodu reservoir in April of 2019 after impoundment, which consists of fourteen groundwater samples debunking limestone (GA01–14), a reservoir water sample (SA1) and a Jinsha River water sample (SA2) (Figure 2b). All sampling points were mainly set based on the geological conditions near the dam site area and the feasibility of sampling. The sampling points were fixed in real-time using GPS.
The pH value of each sample was measured in situ with a microcomputer acidity pH-temperature measuring instrument (HI9124, Hanna Instruments). The main hydrogeochemical compositions, Na+, K+, Ca2+ and Mg2+, were measured by inductively coupled plasma optical emission spectrometry, while SO 4 2 - and Cl were analyzed by ion chromatography (LC-10A, Shimadzu), HCO 3 - by titration. All samples were satisfied with a charge balance error within 10%, which is consistent with the equilibrium according to [43]. Stable isotopes of δD and δ18O were measured by the LGR water isotope analyzer, and results were conveyed in ‰ according to the Vienna mean sea water standard (VSMOW, 0‰). The standard deviation of each parameter measured had be listed, except for the group of water samples whose samples are less than or equal to 3, according to the mathematical mean of standard deviation. The data of all samples are listed in Table 1.

3.2. Data Treatment for Multivariate Analysis

The saturation index (SI) is an important indicator of the degree of mineral dissolution [44,45]. In this study, the changing of the mineral phase saturation index in the groundwater of the Xiluodu reservoir was simulated in order to analyze the hydrogeochemical processes and their influence on water quality. The cluster analysis helps analyze the water samples and infer the similarity between them, and further identify major chemical trends [46,47,48]. Moreover, the interaction between the groundwater and surface water, and the hydraulic connection between the samples could be judged combined with geological conditions.

4. Results

In this section, the types of groundwater and surface water are determined by the piper diagrams. The samples of surface water and groundwater are clustered into different groups according to correlation analysis. PHREEQC, a simulation software, is employed to calculate mineral saturation indices in equilibrium with groundwater. In addition, the δD, δ18O and d-excess values in the surface water and groundwater are discussed.

4.1. The Characteristics of the Surface Water and Groundwater before Impoundment

4.1.1. Hydrochemical Features

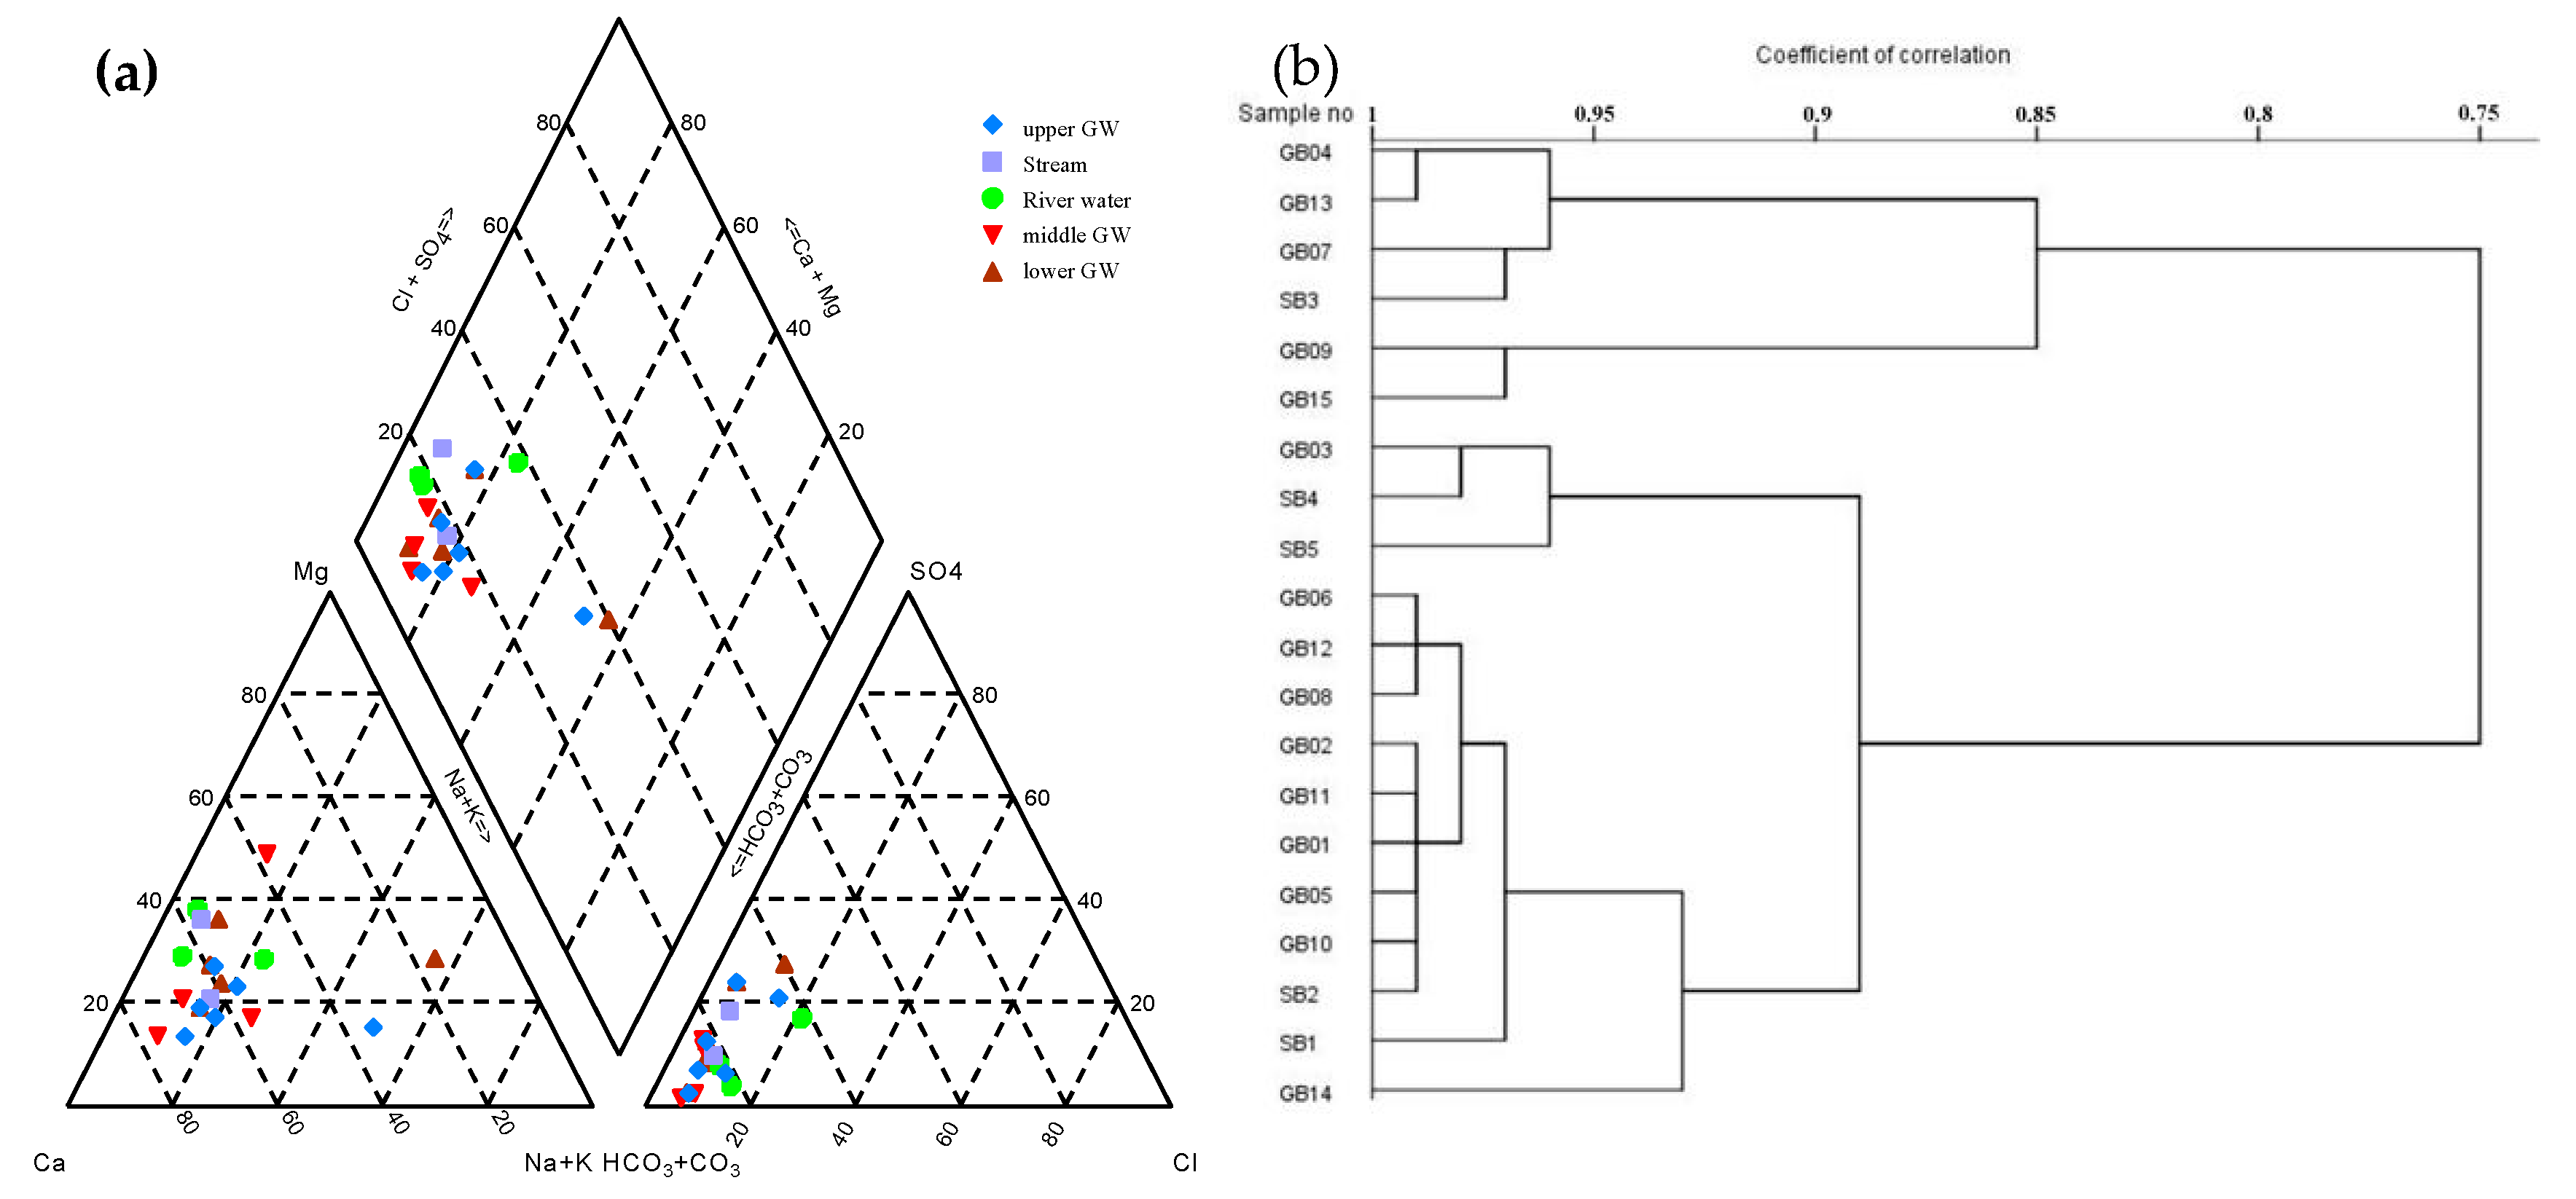
The content of the main hydrochemical components of all of the water samples are listed in Table 1. Figure 3a reveals that the hydrochemical type of the river water is Ca-Mg-HCO3, which is the same as that of both the ditch waters (Doushaxi ditch and Xiluodu ditch). The even total dissolved solids (TDS) value of all the river water samples is 235 mg/L, while those of both the ditch waters are 115 mg/L and 161 mg/L, respectively.
According to Figure 3a, the pattern of groundwater in the upstream zone of the dam (GB01–GB06), the dam site (GB07–GB10) and the downstream dam zone (GB11–GB15) (from the upstream to the downstream) is mainly Ca-Mg-HCO3. The distribution of the TDS in the groundwater resembles that of the ions (Table 1). The TDS value of the groundwater from upstream to downstream ranges from 200 to 300 mg/L, 180 to 300mg/L and 190 to 330 mg/L, respectively. This calculation indicates that there is a strong connection between Na+ and Cl (n = 15, R2 = 0.8), which shows that Na+ and Cl are mainly from the dissolution of NaCl, while the other cations and anions show a weak connection, which reveals the diversity of the ion sources.
The results of the cluster analysis are shown in Figure 3b. When the correlation coefficient is over 0.9, all samples are divided into four groups. The first group consists of GB04, GB07, GB13 and SB3, as the first three samples are taken from the Jinsha River as the regional drainage reference point, while the water of SB3 is affected by the groundwater discharge. GB09 and GB15 are in the second group. The water is from the deep limestone groundwater from the drilling at the riverbed, and it shows different compositions from the shallow limestone groundwater. The ingredients of the third group (SB4, SB5) are nearly the same, as they are all recharged by precipitation and discharge into the Jinsha River through surface runoff. All other samples are the fourth group, and are hosted in the limestone of the basin, except SA1 and SA2, which are recharged partly by the limestone aquifers on both sides of the river through the limestone outcropping area in the reservoir.
Based on the CO2 partial pressure, the ratio of Ca2+/Na+, and the reactant phases consisting of anhydrite, aragonite, calcite, dolomite, halite and gypsum, partial samples of GB01–GB15 were chosen to simulate the flow path of the groundwater. Table 2 presents the mineral saturation states for a representative range of groundwater samples. Some investigators have suggested that SI is a little untrustworthy as a pointer of the precipitation state of minerals [49]. Thus, precipitation is fully considered by the PHREEQC in order to make sure that it can reveal the different features of the geochemical reactions when the water–rock reactions are simulated. The SI of minerals revealed in Table 2 is consistent with that simulated by the PHREEQC, which shows that the major minerals, such as calcite, are all in the dissolution process, accompanied by the release of CO2, and the corresponding SI values are less than −0.2.

4.1.2. Isotopic Characteristics

The local meteoric water line (LMWL, δD = 7.44δ18O + 6.36, R2 = 0.93) (Figure 4) is determined on the basis of the average monthly atmospheric stable isotope content observed by the Global Precipitation Isotope Monitoring Website, from 1985 to 2018, at various observation points [50]. As the Yongsheng basin is located in the same area and the climate conditions are similar, this formula can be used to represent the isotope relationship of atmospheric precipitation in the basin. The research of [27] determined the global meteoric water line (GMWL), and figured it out as δD = 8δ18O + 10. It can be seen from Figure 4 that the slope and intercept of the LMWL are smaller than that of the GMWL, which indicates there is a second evaporation during the precipitation, and the evaporation is unbalanced.
The values of δ18O and δD in the river water and the Doushaxi ditch water are listed in Table 3. The apparent diversity shows that the recharge of the river water and ditch water is different. The value of δ18O and δD climbs steadily from upstream to downstream. All of the samples are distributed near the GMWL and LMWL, except the river water, which shows that the ditch water and groundwater come from precipitation, while the river water is from other areas. All of the groundwater samples fit the formula δD = 6.4007δ18O−4.2444 (n = 15, R2 = 0.996).
The value of δD and δ18O in precipitation decreases with the rise of the elevation, and the two have a good linear relationship, i.e., an altitude effect. The recharge altitude can be determined according to the altitude effect [51,52]. The value of d-excess in the river water and ditch water shows a great difference, relating to different recharge altitudes. The recharge altitude of the river water is about 2200 m (Table 3), which is the comprehensive effect of atmospheric precipitation in the upstream of the Jinsha River basin, nearly a thousand kilometers away. The recharge altitude of the Doushaxi ditchwater is around 850 m, showing it forms a surface runoff with precipitation. The recharge altitude of the groundwater ranges from 700 m to 1000 m, as it is synthetically supplied by the high-elevation limestone outcropping area, the supply elevation of which is about 2000 m, and atmospheric precipitation infiltration in the limestone outcropping area in the reservoir, with a 350–800 m recharge elevation.

4.2. The Characteristics of the Surface Water and Groundwater after Impoundment

4.2.1. Hydrochemical Features

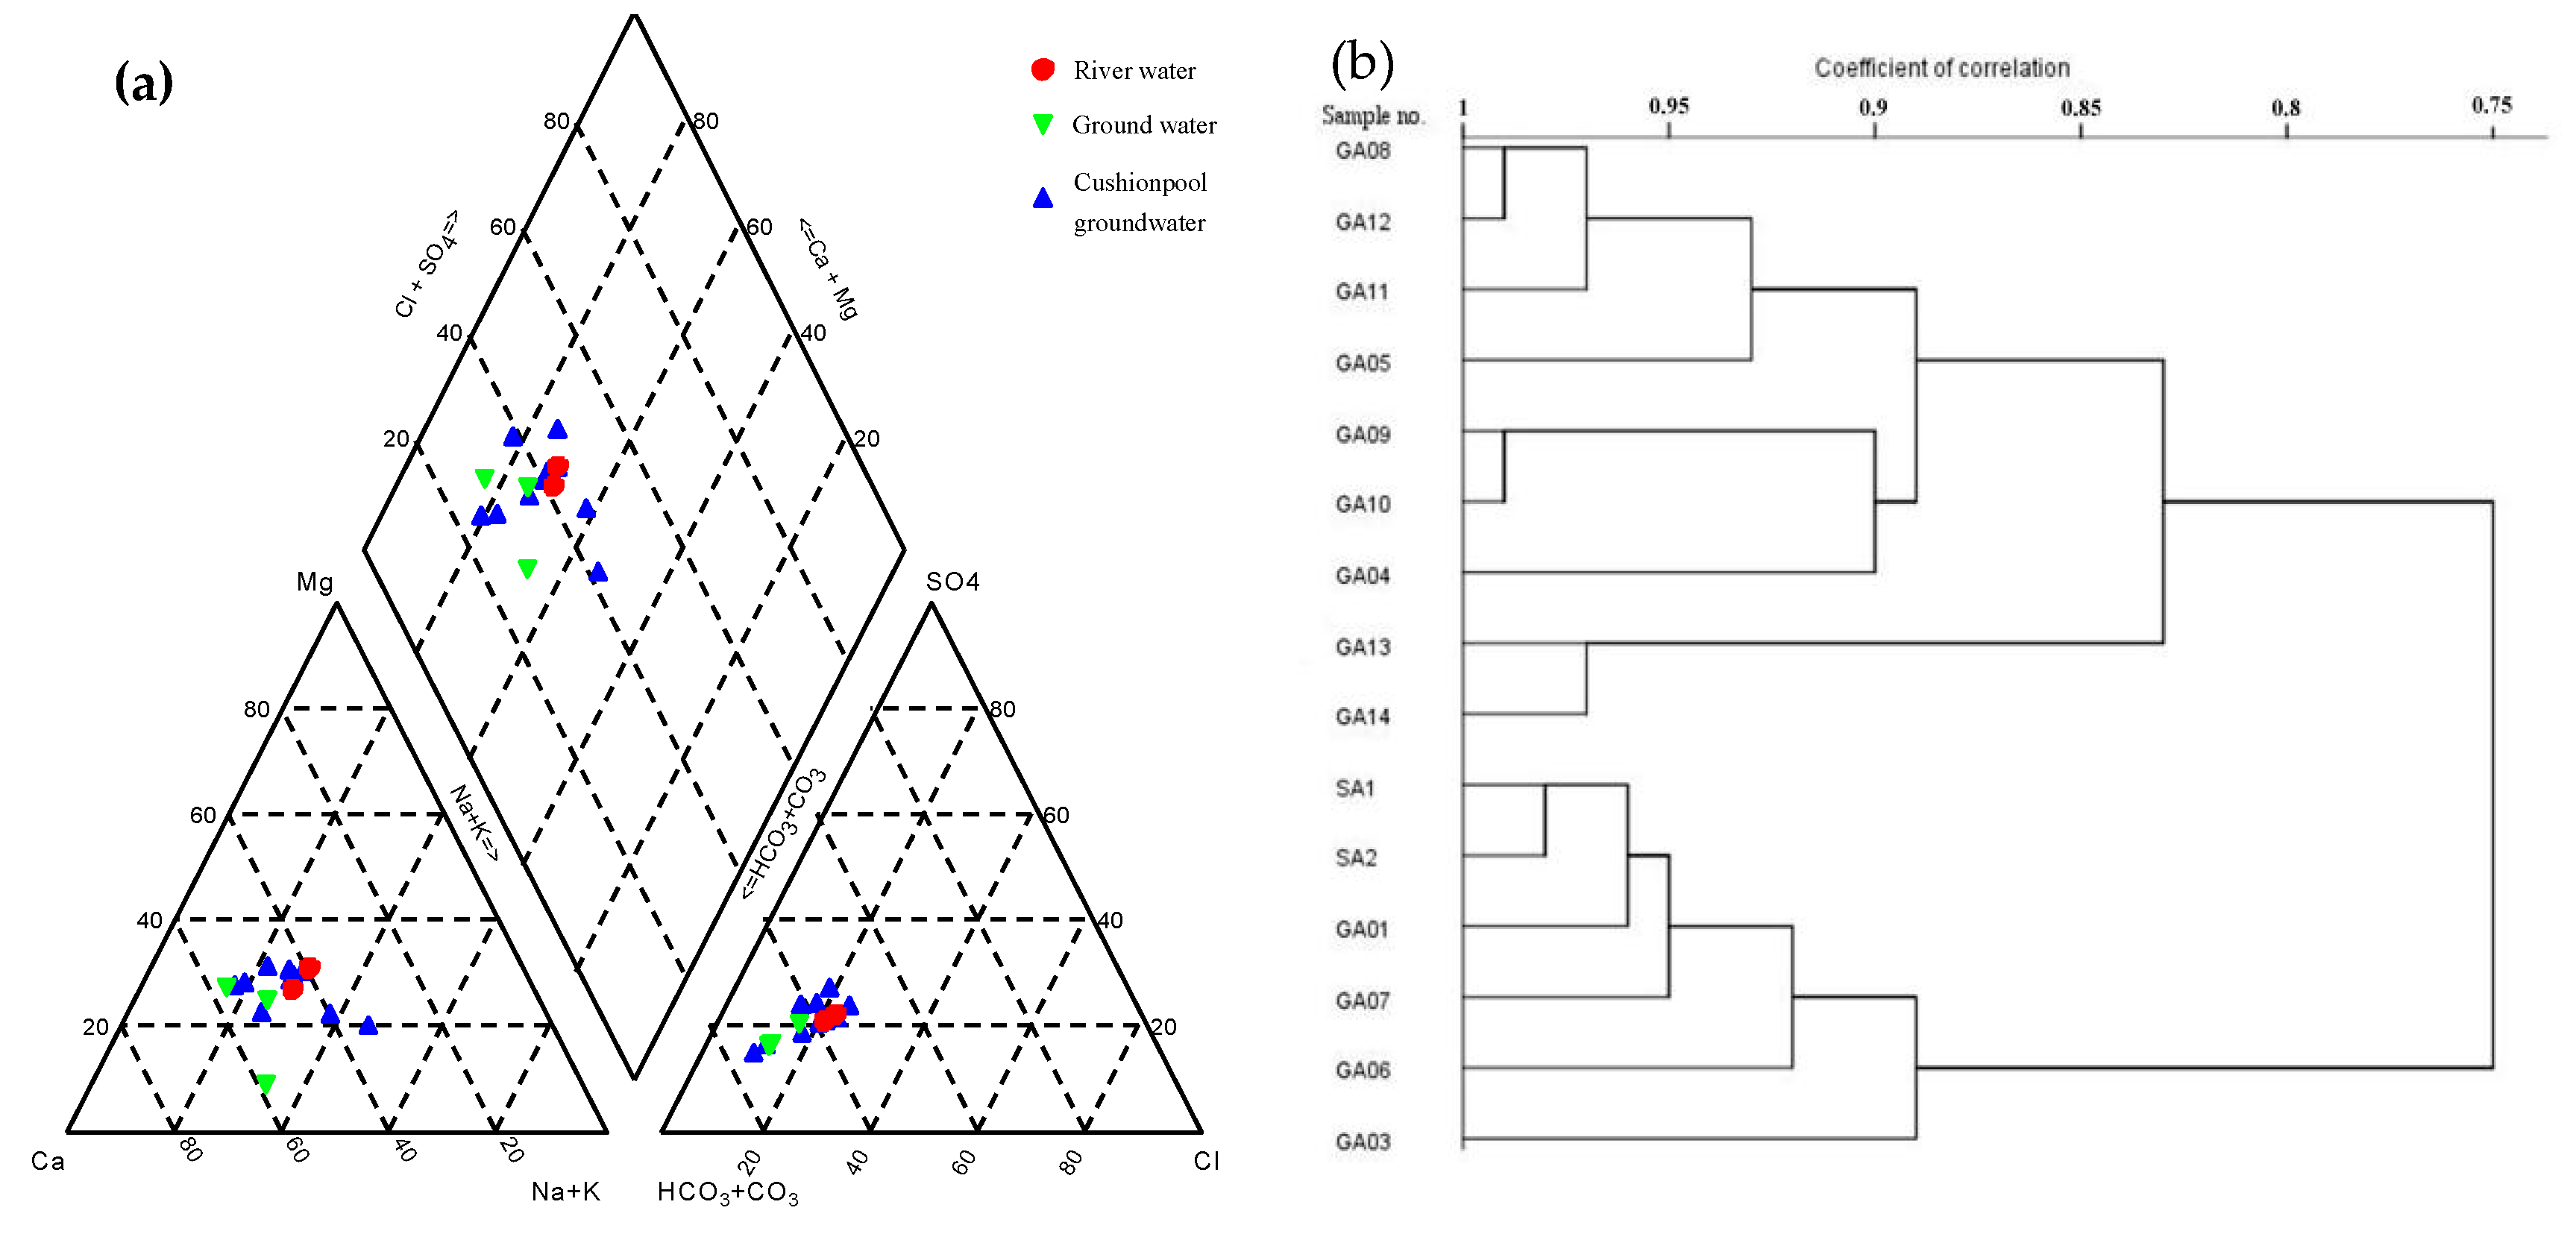
The TDS of the reservoir water (SA1) and river water (SA2) is around 360 mg/L, and the pH of both is over 8.1. The two items apparently increase compared with the previous groundwater (SB1–SB5) (Table 1). The Ca2+, Na+ and Cl in the surface water rise evidently, while the HCO 3 - shows the opposite trend, and the type of the two surface waters is Ca-Na-HCO3-Cl (Figure 5a).
Compared with the former data, the content of Ca2+, Na+, SO42- and Cl- climbs speciously while HCO 3 - drops (Table 1). Due to the improper storage of the GA02 water sample, the test result has a large error, so it isn’t included in the analysis. The types of groundwater in the right bank, left bank and near the cushion pool are Ca-Mg-Na-HCO3, Ca-Na-HCO3 and Ca-Na-HCO3-SO4, respectively (Figure 5a), while the TDS values are 328 mg/L, 239 mg/L and 284.2 mg/L, respectively. This fits the space distribution of chemical ions (Table 1). The relationship between different ions in the groundwater near the cushion pool is weak (n = 10, R2 < 0.4), showing that there is a complex source in the groundwater. The ratio between SO 4 2 - and Cl- is 1.7, while that between HCO 3 - and SO 4 2 - is around 0.3. The value of SO 4 2 - in the groundwater near the cushion pool is relatively high, indicating that a sulfide mineral is dissolved in the study area.
When the correlation coefficient is over 0.85, all of the water samples are parted into three groups (Figure 5b). The first group includes the reservoir water, river water and several groundwater samples, indicating that the reservoir is the main origin of the downstream river. The limestone at the near-shore slope on both sides of the strait is closer to other limestone receiving water supply from the reservoir. The reservoir water leaked along with the drainage tunnel with a low altitude near the cushion pool. The groundwater of the second group is the mixture flow of the first and third groups. All other samples belong to the third group, which is the groundwater in limestone, matching the trend of the hydrochemical pattern in this area. When the correlation coefficient is over 0.8, the first part is the surface water and the other part is the groundwater in the limestone near the reservoir.
Partial samples of GA01–GA14 were used to simulate the flow path (Table 3). The anhydrite, gypsum and rock salt dissolve, and CO2 is released from upstream to downstream. In addition, the aragonite, calcite and calcite begin to settle with a diminishing supersaturated state. The value of pCO2 (−3.25–−1.14) is higher than that of air (−3.5) after impoundment, indicating that the groundwater can dissolve more carbonate rock. The precipitation after storage may be due to kinetic effects during degassing or gypsum dissolution [53], so the minerals are likely to settle after becoming saturated as a result of the thick permeable rock.

4.2.2. Isotopic Characteristics

The value of δ18O and δD shows that the sources of the groundwater for the right and left bank are different. The difference between GA01 and GA03 is because GA01 is supplied by the reservoir water. The differences in isotopic values and the diversity of the groundwater’s hydrochemical types confirm each other, verifying that the source of the groundwater in the area is controlled by multiple sources. The groundwater matches δD = 7.5258δ18O + 4.4091 (n = 14, R2 = 0.77) after impoundment, which is obviously different from that before the impoundment.
The d-excess (d) in the groundwater has a wide range, with an average value of 10.4‰. The d-excess of the groundwater near the cushion pool is higher than that in both banks. The recharge altitude after impoundment ranges from 1600 m to 2300 m (Table 3), showing the recharge source of groundwater is the high-elevation limestone outcropping area and the reservoir, the elevation of both of which is greater than or near 2000 m.

5. Discussion

5.1. The Interaction between Surface Water and Groundwater before Impoundment

5.1.1. Hydrochemical Characteristics

The same hydrochemical types (Ca-Mg-HCO3) of river water, ditch water and groundwater should be related to the equilibrium of long-term interaction between the surface water and groundwater under natural conditions before impoundment. The relatively low TDS content of the ditch water shows that it only receives atmospheric infiltration to form surface runoff, resulting from the weak water–rock effect. Considering the fact that the groundwater level is higher than that of the river water, as well as the similarity of the proportion of the main ion content and the TDS value between the river water and the groundwater (Table 1), we conclude that the river water has not only been mainly replenished by the upstream of the Jinsha River but also received some groundwater recharge. The results of the PHREEQC simulation show that the major minerals, such as calcite, are unsaturated, indicating that the groundwater has the potential to dissolve more minerals.
It is worth noting that the contents of ions (Na+ and SO 4 2 - ) in GB01, GB03, GB04, GB07, GB13 and GB14 are significantly different from those in other samples (Table 1). Further studies found that all the six sampling points were located in the right bank or near the right bank of the Jinsha River before impoundment (Figure 2a). A lot of evidence shows that this phenomenon is related to the different saturation state of the P2βn layer in the left and right banks. Some river water directly goes to the downstream of the Jinsha River following layers on the right bank, because of an approximate right-angled turning in the Doushaxi ditch (Figure 1c). This results in the accumulation of right bank groundwater, which is confirmed by survey data. Affected by the accumulation, the P2βn layer on the right bank above the limestone is saturated under natural conditions, while the riverbed and the left bank of the P2βn layer are partially saturated. The reaction degree of Na+ and SO 4 2 - is completely different due to different environmental conditions.

5.1.2. Stable Isotope Ratios

The isotopic characteristics of the river water, ditch water and groundwater and the corresponding recharge elevations are quite different, indicating that they have complex supply relationships. According to the isotope characteristics (Table 3), it can be judged that the ditch water mainly comes from local atmospheric precipitation. It can be seen from Table 3 that the source of the groundwater is not river water or ditch water. Instead, the rainfall infiltration replenishes the high-elevation limestone outcropping area, and then flows underground to the limestone layers along the limestone aquifer on both sides of the dam site, as a result of the local geological conditions. As the elevation of the limestone outcropping area in the reservoir is about 300 m, part of the rainfall would be directly supplied into the groundwater runoff. Therefore, the isotopic characteristics of the limestone groundwater are between the two mixed sources; namely, the high-elevation limestone outcropping area and the limestone outcropping area in the reservoir. The isotopic values of the water samples of groundwater and ditch water are all near the LMWL and slightly lower than the LMWL, indicating that there is weak evaporation in the basin along the Jinsha River, which matches to the general conclusion [54]. The subtropical climate in Yongsheng syncline basin—which is hot in summer, with long sunshine periods, concentrated rainstorms and drastic temperature changes—leads to the occurrence of evaporation.
The deviation of the LMWL of the river water (Figure 4) and the supply elevation is more than 2000 m (Table 3), which indicates that the river water mainly accepts the surface water and groundwater recharge along the upstream of the Jinsha River. The survey data show that the change of the river water has been similar for many years, which shows one peak and one valley during the year. During the normal period, the groundwater level on both sides of the basin is higher than that of the river. The river water level rises for a short period during the flood season, and there is a short-term or partial reversal of the groundwater level of the bank slope, which means the groundwater in the dam site is supplied by the Jinsha River. Therefore, the groundwater and the river water are closely related to and interact with each other. However, as the atmospheric rainfall characteristics of the upstream of the Jinsha River are different from that of the basin, the d-excess of SB3 is obviously different from the other samples.

5.2. The Interaction between the Surface Water and Groundwater after Impoundment

5.2.1. Hydrochemical Characteristics

The hydrochemical features of the river water and the reservoir water changed from Ca-Mg-HCO3 to Ca-Na-HCO3-Cl (Table 1), which shows the hydrochemical evolution caused by impoundment. The reasons for the great increase in the Na+ and SO 4 2 - concentrations may be related to the P2βn layer, which contains illite (including Na2O) and pyrite (FeS2). The left and right bank of the P2βn layer, which were previously in different states, all become saturated after impoundment, so the reaction conditions of the minerals changed. In addition, the enhancement of the groundwater’s hydraulic gradient improves the water–rock interaction, so the dissolution of the mineral reactions increases. Many artificial hydraulic structures made of concrete around the reservoir, and the vast quantity of living and production garbage—such as excreta and chemical fertilizers—are associated with the increase of Na+ and Cl. The increasing pressure of the limestone aquifer (nearly 200 m measured on site) increases the dissolution of calcium bearing minerals; that is, the content of Ca2+ increases.
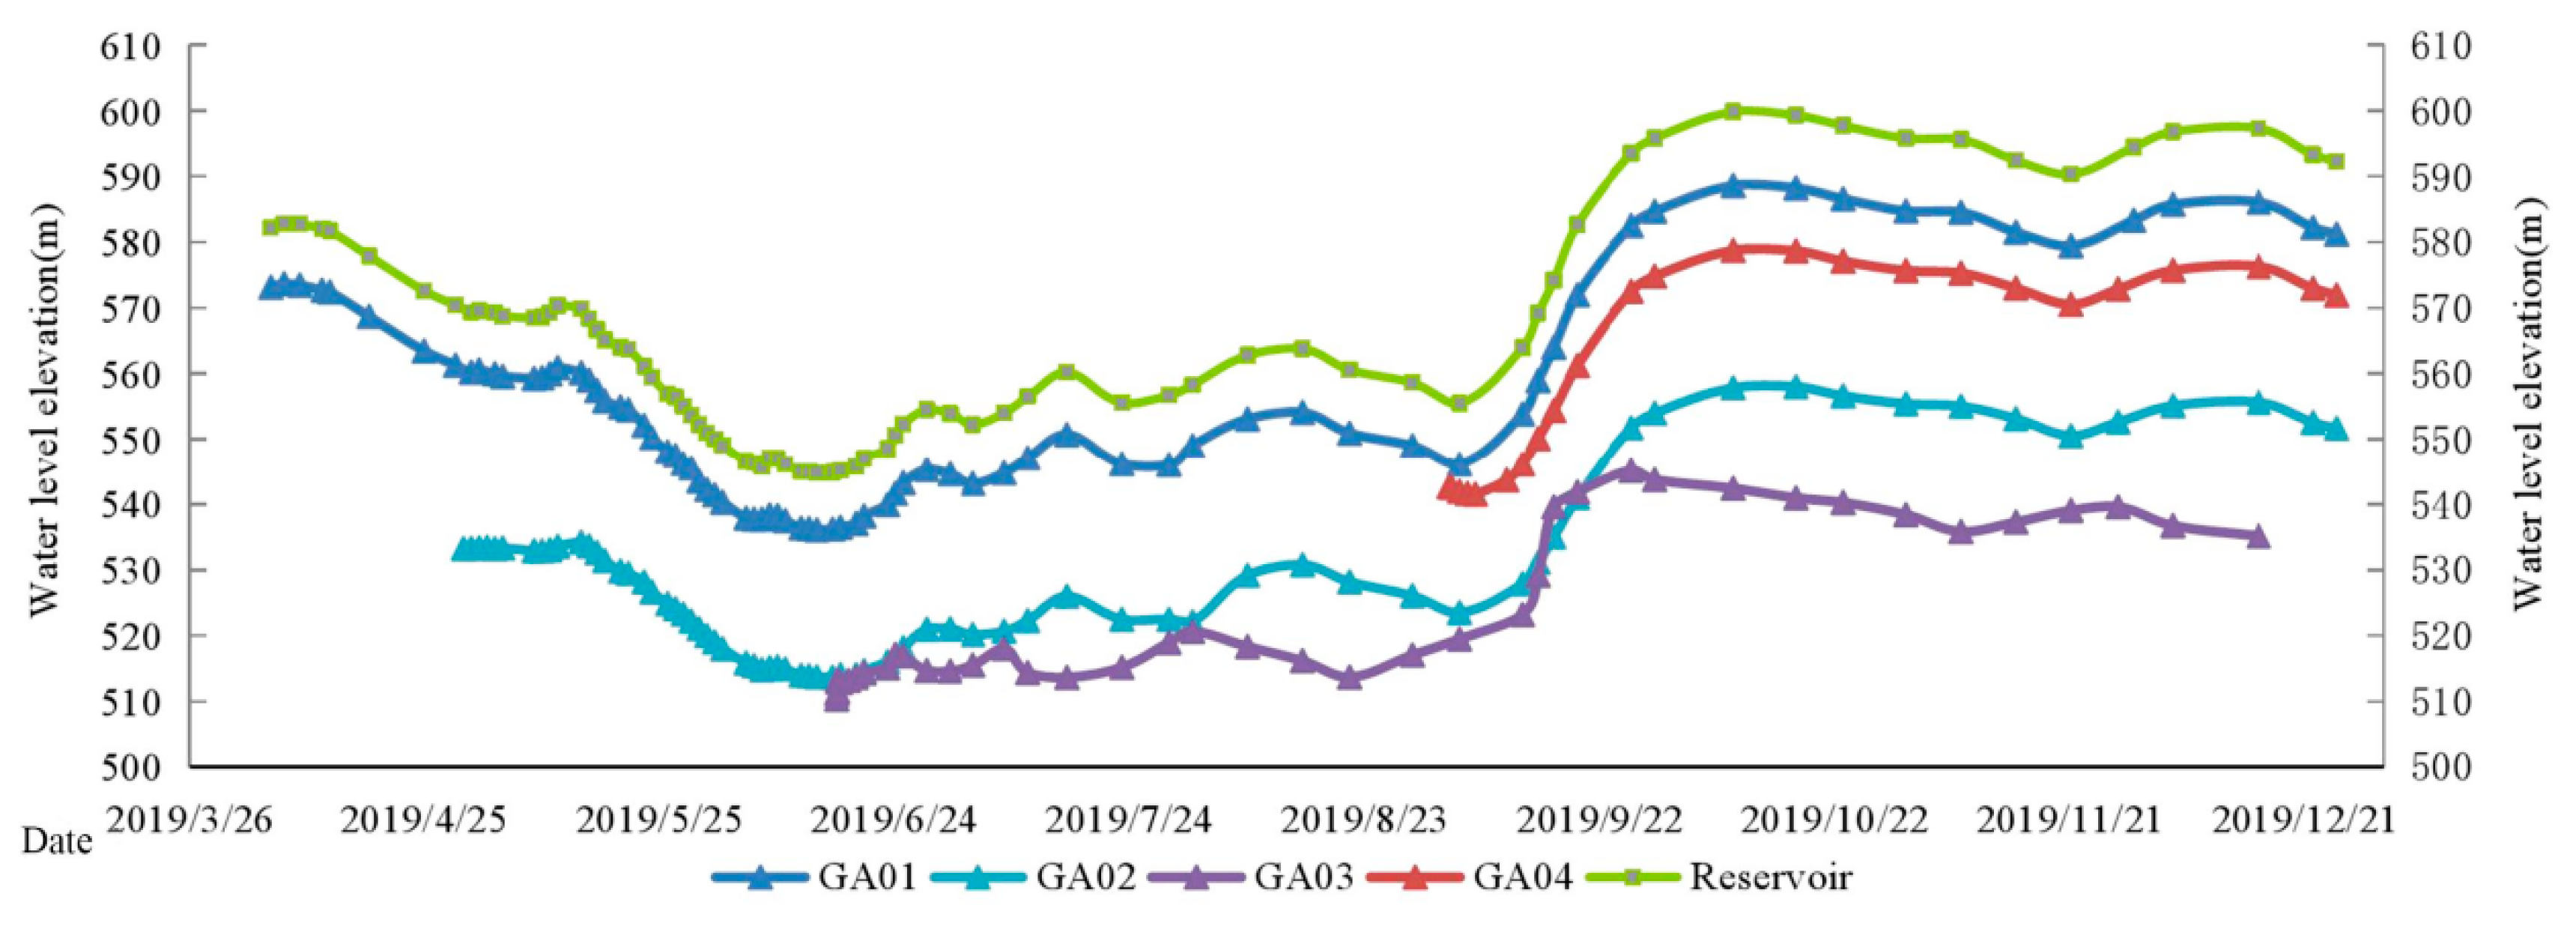
The hydrochemical characteristics of the groundwater are basically the same as those of the reservoir water after impoundment (Table 1), and the correlation analysis of the water samples showed that they are highly correlated (Figure 5b). The investigation showed that there is a good hydraulic connection between the two under natural conditions, and that the connection still exists after impoundment. Moreover, there is a high consistency between the long-view data of the limestone groundwater level and the reservoir water level (Figure 6). As the reservoir water level is higher than that of limestone groundwater, the reservoir water replenishes the limestone groundwater on both sides. However, there are some differences in the hydrochemical types of groundwater between the two sides, which indicate that the groundwater of the two sides should not only be replenished by the reservoir water, but also be replenished by other sources. The groundwater of the left and right banks was supplied by the limestone outcrops in the northwest and southeast of the dam site, respectively, so their hydrochemical characteristics were different. The replenishment of the downstream river water in the dam site area mainly comes from the tail water discharge of the upstream of the reservoir water, seepage around the dam, groundwater discharge through the engineering drainage facilities, atmospheric rainfall and the surface runoff of the mountains on both sides.
After impoundment, the groundwater is active in the water–rock interaction, with the dissolution of minerals as the main hydrogeochemical process. However, calcite and other calcium-bearing minerals are saturated due to the increase of Ca2+ and further form precipitation, which tends to decrease significantly from the upstream to the downstream (Table 2). The upstream pressure is small and the precipitation is strong, while the downstream pressure is the opposite, indicating that the characteristics of the hydrochemistry are affected by the pressure change.

5.2.2. Stable Isotope Ratios

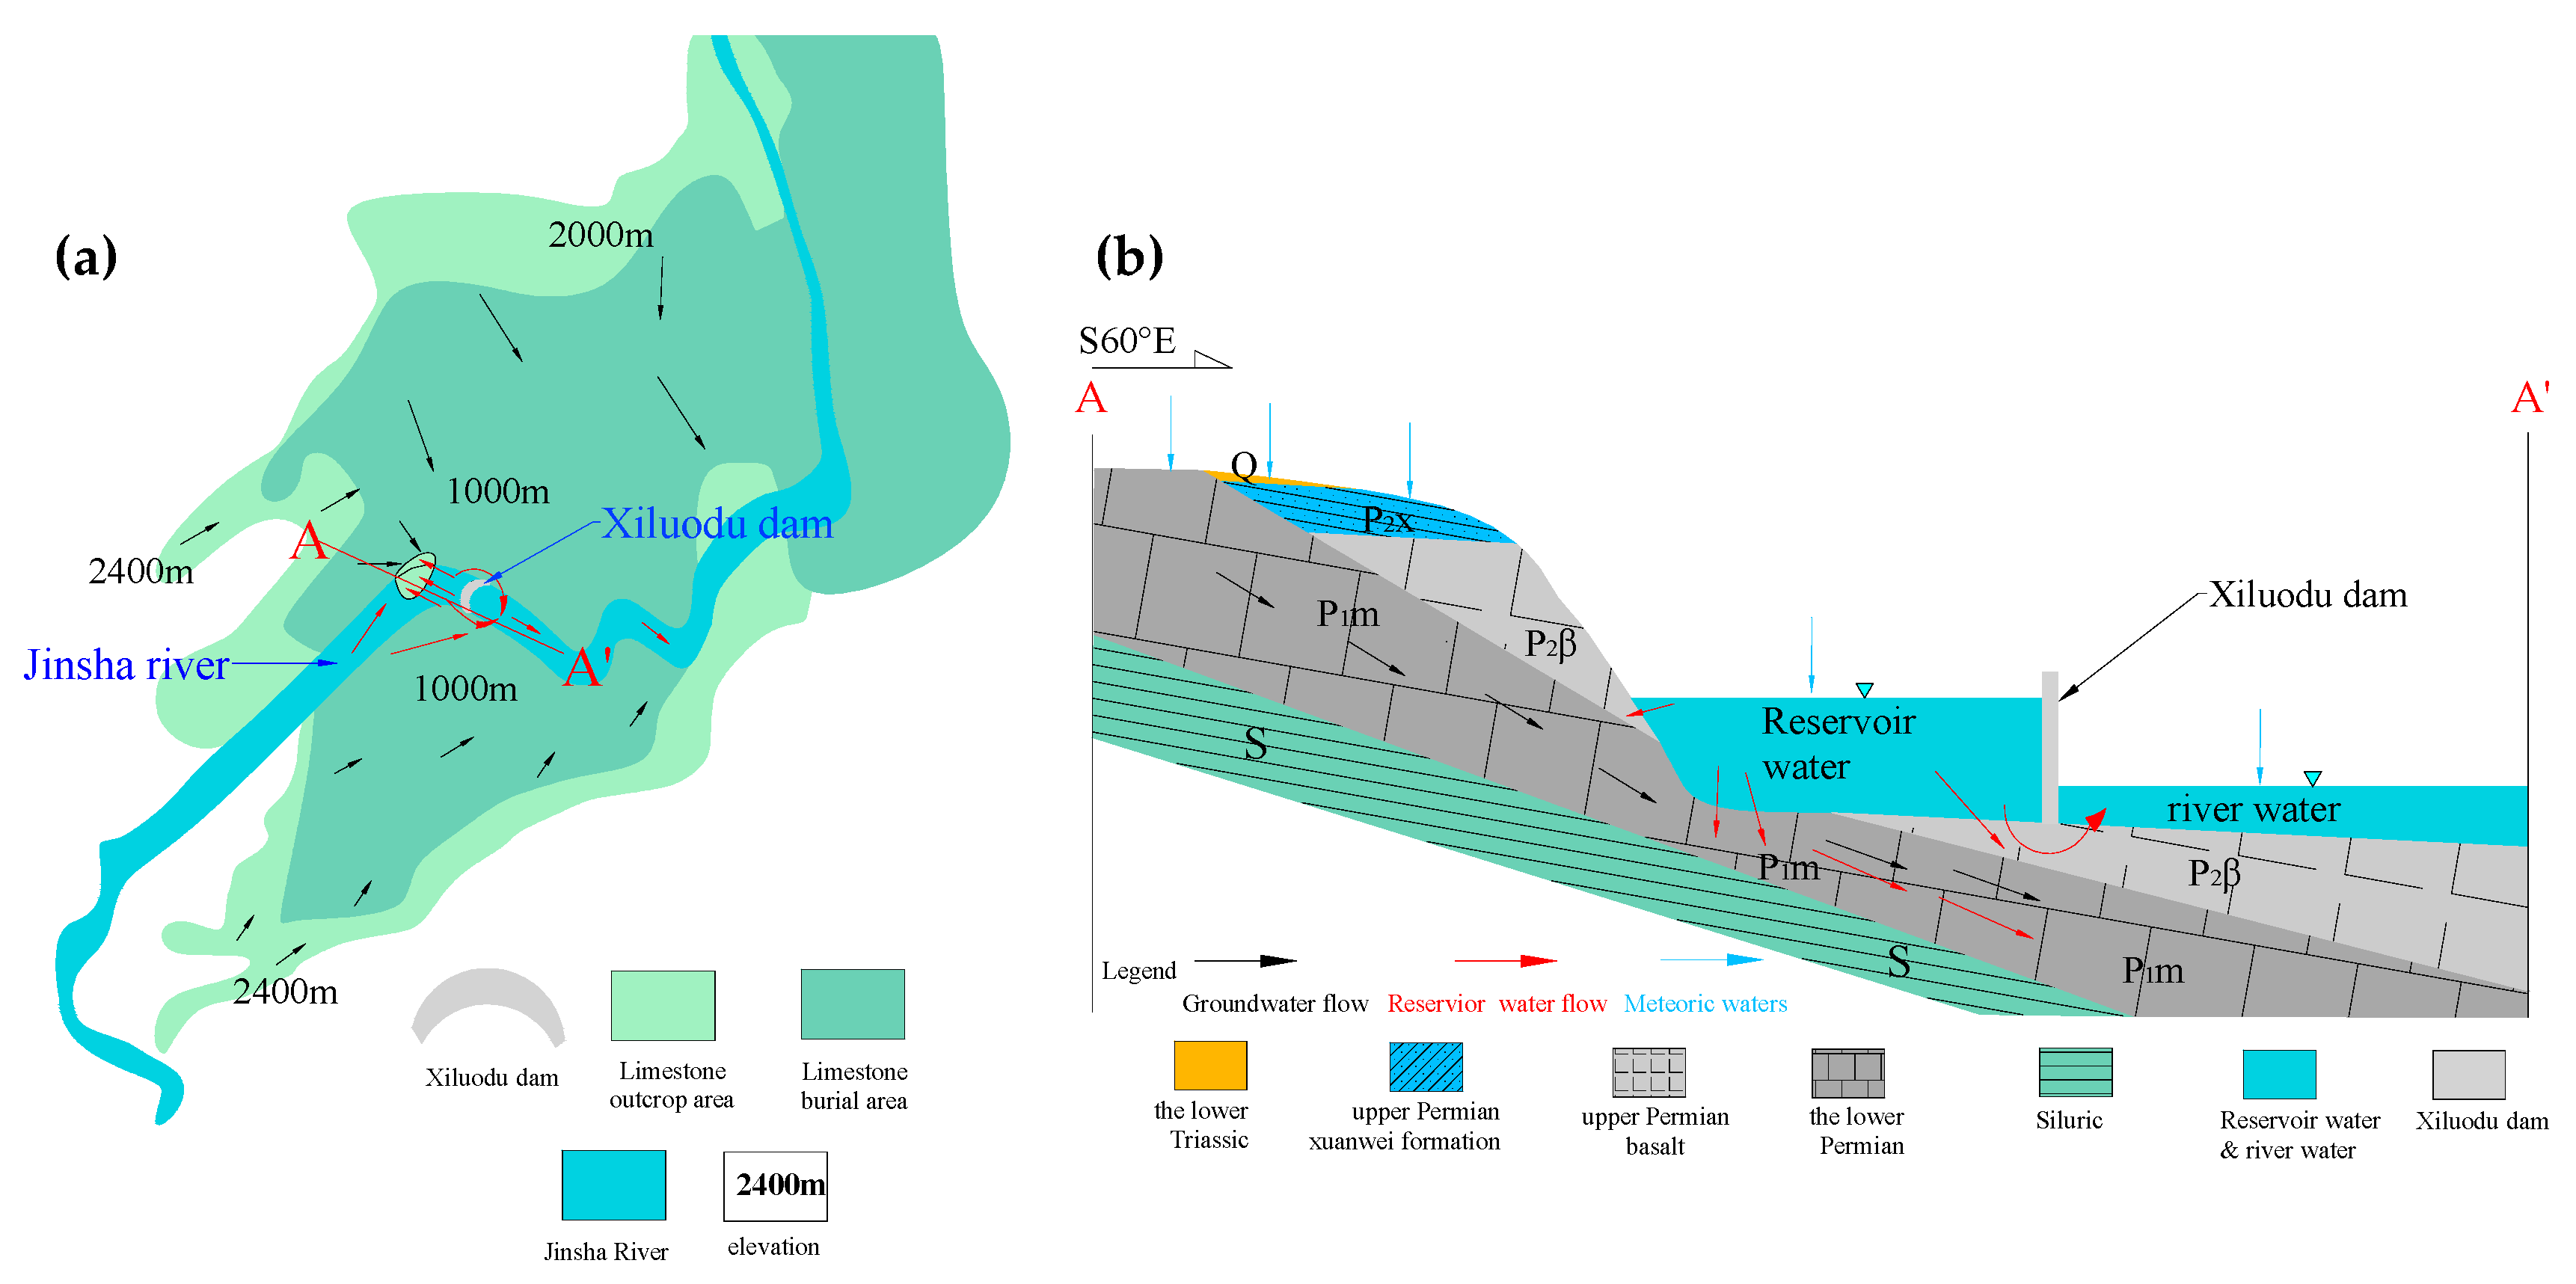
According to the isotopic characteristics of the groundwater, the recharge elevation of the two are both calculated to be more than 2000 m, so it was determined that the groundwater on both sides of the basin is still controlled by the recharge of the high-elevation limestone outcropping area at the basin’s edge, the elevation of which is more than 2000 m (Figure 7a). The fact that the isotopic characteristics of the groundwater are different on both sides and downstream of the reservoir indicates that the downstream groundwater is affected by the reservoir water more than the groundwater of both sides of the reservoir.
The d-excess of the groundwater samples (GA07, GA09, GA10, GA11) is significantly larger than that before impoundment (Table 3), and the isotope value deviated from the LMWL more, indicating that groundwater evaporation is weakened and unbalanced evaporation is enhanced. We speculate that the reason is that the limestone outcropping area in the reservoir is partly submerged by the reservoir water after impoundment, so the evaporation area is reduced, causing the groundwater evaporation in the dam site area to be weakened. The limestone layer, in addition to the high-elevation limestone outcropping area (Figure 7a) and the limestone outcropping area in the reservoir, are buried in another relative water-resisting layer before and after impoundment, including the Xuanwei group (P2x), the Silurian system (S) and the mud shale (P2βn), so that only weak evaporation exists in this part of the limestone layer, which can be ignored.

5.3. The Evolution Laws, Reasons and Influences of the Interaction Between the Surface Water and Groundwater

The research shows that the interaction between surface water and groundwater is prominent and different before and after impoundment. Before impoundment, the groundwater was replenished by rainfall infiltration in the high-elevation limestone outcropping area and discharged into the Jinsha River from the limestone outcropping area in the reservoir by underground runoff. The river water was mainly replenished by the groundwater and the ditch water along the Jinsha River, then discharged to the downstream along the river. After impoundment, the groundwater in the reservoir mixed recharged by the groundwater of the high-elevation limestone outcropping area and the reservoir water while the reservoir water mainly from the surface water and groundwater of upstream along the river as well as the ditch water of the reservoir bank. Downstream the river supply is mainly from the upstream tail water discharge, seepage water around the dam and groundwater through engineering drainage discharge (Figure 7b) while the source of ditch water supply has always been precipitation. The interaction between the surface water and groundwater is prominent and has obvious changes due to impoundment. In the past, the regional groundwater replenished the river water, but now the reservoir water replenishes the groundwater reversely within a limited area and a period of time.
The influence of the reservoir impoundment on the interaction within the basin is decreasing along with the dam site. First, the groundwater in the dam site received the reservoir water recharge for a period of time. Eventually, the reservoir water and the regional groundwater will reform a dynamic balance. During this process, the groundwater in the reservoir bank, which directly receives the reservoir water recharge, will undergo irreversible changes, including the groundwater level and the hydrochemical type. Secondly, the basalt aquifer in the basin, which is not rich in water, will change irreversibly as it receives the replenishment of the reservoir water, which is raised by the water level. However, the middle zone, between the dam site area and the high-elevation limestone outcropping area, does not directly accept the reservoir water supply and forms a groundwater exchange. It will also form a temporary change of the groundwater level due to the rising of the reservoir water level. As the regional water flow system tends to balance, this change will slowly recover and the ultimate change will be relatively small. The main groundwater recharge source (atmospheric rainfall infiltration) in the high-elevation limestone outcropping area has not changed and has the largest elevation, so the groundwater in this area is basically unchanged. The reservoir impoundment makes the regional groundwater flow system change adaptively, and this change will eventually form a new dynamic balance between the reservoir water and the regional groundwater.
The fundamental reason for the evolution of the interaction between the surface water and groundwater is that the reservoir impoundment changes the boundary conditions of the regional seepage field. The changes and characteristics of the regional seepage field can be verified and analyzed by the changes of the absolute and relative contents of the major ions and stable isotopes (δD, δ18O, d) in the surface water and the groundwater before and after impoundment. The study of this specific form of interaction requires the analysis of the evolution law of the above seepage field, combined with the regional hydrogeological conditions and human factors. The impoundment has changed the natural hydrogeological condition that the groundwater level is higher than the river. It means that the groundwater of the dam site area cannot recharge the reservoir water through the limestone outcropping area in the reservoir, while the reservoir water can reverse recharge the groundwater caused hydraulic gradient. The conclusion that the groundwater in the dam site accepts the reservoir water replenishment can be reached through the similar chemical characteristics of the groundwater and reservoir water (Table 1), as well as the high consistency between the groundwater level and reservoir water level (Figure 6). The artificial drainage facilities in the mountains enable the original groundwater to be discharged downstream through the facilities, so that the aquifer has enough space to receive the reservoir’s replenishment.
The reservoir impoundment has a great influence on the water flow system of the basin. First, the interaction between the surface water and groundwater was changed, which changed the recharge relationship between the groundwater and the reservoir water. Secondly, it changed the water’s chemical type and the content of each ion of the surface water and groundwater. For example, the water–rock interaction is more intense in the mud-shale (P2βn) after impoundment, which makes the content of Na+ and SO 4 2 - in the groundwater significantly increase after impoundment. These changes of ion content further affected the hydrogeochemical process. For example, due to the increase of the content of Ca2+, calcium-containing minerals such as calcite, which were originally unsaturated, are in the state of supersaturation after impoundment, and then precipitation occurs. In addition, the impoundment also made the regional groundwater aquifer system change from the original single limestone fracture–fissure medium into a dual basalt–limestone medium. The basalt reservoir has poor water storage according to the natural hydrogeological condition. Therefore, the groundwater flow field was dominated by the limestone aquifer before impoundment, which was a single groundwater aquifer system of limestone fracture–karst medium, and the interaction was mainly between the river water and limestone groundwater. The rise of the reservoir water making the reservoir water contact with the basalt layer means that the basalt layer on the bank of the reservoir is able to accept the lateral pressure supply of the reservoir water (Figure 7b), resulting in the groundwater level of the basalt layer rising accordingly, as is consistant with the monitoring results. With the increase of groundwater in the basalt layer, the basalt groundwater will have a greater impact on the regional groundwater system, so the regional groundwater system will become a dual basalt–limestone medium. There is also a local water flow system of a pore medium in the basin, which is mainly distributed in the loose sediments. This system directly receives rainfall infiltration recharge, so it does not directly change under the influence of the reservoir storage. However, the possibility that impoundment may cause changes in local climatic conditions and thus affect the intensity of the rainfall and evaporation cannot be excluded.

6. Conclusions

Hydrochemistry, stable isotope, Q-cluster and saturation index analyses were employed to study the evolution of the interaction between the groundwater and surface water in the Xiluodu reservoir site before and after impoundment. The hydrochemical type of the Jinsha River changed from Ca-Mg-HCO3 to Ca-Na-HCO3-Cl, while the type of the groundwater changed from Ca-Mg-HCO3 to a mixture of Ca-Na-HCO3 and Ca-Mg-SO4. The saturated state of the minerals varied with time and space according to the calculation of the saturation index. The differences between isotope values, d-excess, the GMWL and LMWL show that there exists a certain degree of evaporation of surface water and groundwater. It was determined that there is a continuous and significant interaction between the surface water and groundwater along the bank of the basin. The recharge relationship between the surface water and groundwater in the dam site reversed after impoundment.
The influence of the impoundment decreases outwardly along the dam site, and the water flow system in some areas even saw an irreversible change. The occurrence of the above phenomenon is caused by the impoundment of the reservoir, and the geological conditions and facilities enable it to continue to develop. The influence of the interaction evolution on the environment includes the regional water supply relationship, the change of the hydrochemical characteristics and the change of the hydrogeochemical process. The groundwater aquifer system changed from a single limestone fracture–karst medium into a dual basalt–limestone medium.

Author Contributions

Z.Z. (Ziwen Zhou) and Z.Z. (Zhifang Zhou) conceived and designed the study; Z.Z. (Ziwen Zhou), Z.Z. (Zhifang Zhou), H.X. and M.L. collected the data and performed the investigation; Z.Z. (Ziwen Zhou) analyzed the data; Z.Z. (Ziwen Zhou) wrote the paper with the assistance of Z.Z. (Zhifang Zhou). All authors have read and agreed to the published version of the manuscript.

Funding

This research was supported by National Natural Science Foundation of China (91747204).

Acknowledgments

The field tests and historical data collection were supported by PowerChina Chengdu Engineering Corporation Limited. Useful suggestions and help were provided by Jinming Zhang. Jiabin Zuo and Master Jian Wang of Hohai University are also acknowledged.

Conflicts of Interest

The authors declare no conflict of interest regarding the publication of this paper.

References

  1. Deng, W.; Bai, J.H.; Yan, M.H. Problems and countermeasures of water resources for sustainable utilization in China. Chin. Geogr. Sci. 2002, 12, 289–293. [Google Scholar] [CrossRef]
  2. Chen, J.; Xia, J. Facing the challenge: Barriers to sustainable water resources development in China. Hydrol. Sci. J. 1999, 44, 507–516. [Google Scholar]
  3. Jiang, Y. China’s water scarcity. J. Environ. Manag. 2009, 90, 3185–3196. [Google Scholar] [CrossRef] [PubMed]
  4. Zhang, H.; Jin, G.; Yu, Y. Review of river basinwater resource management in China. Water 2018, 10, 425. [Google Scholar]
  5. Chang, J.; Leung, D.Y.C.; Wu, C.Z.; Yuan, Z.H. A review on the energy production, consumption, and prospect of renewable energy in China. Renew. Sustain. Energy Rev. 2003, 7, 453–468. [Google Scholar] [CrossRef]
  6. Huang, H.; Yan, Z. Present situation and future prospect of hydropower in China. Renew. Sustain. Energy Rev. 2009, 13, 1652–1656. [Google Scholar] [CrossRef]
  7. Ma, H.; Oxley, L.; Gibson, J.; Li, W. A survey of China’s renewable energy economy. Renew. Sustain. Energy Rev. 2010, 14, 438–445. [Google Scholar] [CrossRef]
  8. Liu, W.; Lund, H.; Mathiesen, B.V.; Zhang, X. Potential of renewable energy systems in China. Appl. Energy 2011, 88, 518–525. [Google Scholar] [CrossRef] [Green Version]
  9. Wang, Q.; Chen, Y. Status and outlook of China’s free-carbon electricity. Renew. Sustain. Energy Rev. 2010, 14, 1014–1025. [Google Scholar] [CrossRef]
  10. Haile, E.; Fryar, A.E. Evolution chimique de l’eau souterraine dans l’aquifère de Wilcox du Nord de la Plaine Cotière du Golf, Etats-Unis d’Amérique. Hydrogeol. J. 2017, 25, 2403–2418. [Google Scholar] [CrossRef]
  11. Han, D.M.; Song, X.F.; Currell, M.J.; Yang, J.L.; Xiao, G.Q. Chemical and isotopic constraints on evolution of groundwater salinization in the coastal plain aquifer of Laizhou Bay, China. J. Hydrol. 2014, 508, 12–27. [Google Scholar] [CrossRef]
  12. Klassen, J.; Allen, D.M. Assessing the risk of saltwater intrusion in coastal aquifers. J. Hydrol. 2017, 551, 730–745. [Google Scholar] [CrossRef]
  13. Mohanty, A.K.; Rao, V.V.S.G. Hydrogeochemical, seawater intrusion and oxygen isotope studies on a coastal region in the Puri District of Odisha, India. Catena 2019, 172, 558–571. [Google Scholar] [CrossRef]
  14. Werner, A.D. On the classification of seawater intrusion. J. Hydrol. 2017, 551, 619–631. [Google Scholar] [CrossRef]
  15. Matiatos, I.; Paraskevopoulou, V.; Lazogiannis, K.; Botsou, F.; Dassenakis, M.; Ghionis, G.; Alexopoulos, J.D.; Poulos, S.E. Surface–ground water interactions and hydrogeochemical evolution in a fluvio-deltaic setting: The case study of the Pinios River delta. J. Hydrol. 2018, 561, 236–249. [Google Scholar] [CrossRef]
  16. Abdou Babaye, M.S.; Orban, P.; Ousmane, B.; Favreau, G.; Brouyère, S.; Dassargues, A. Characterization of recharge mechanisms in a Precambrian basement aquifer in semi-arid south-west Niger. Hydrogeol. J. 2019, 27, 475–491. [Google Scholar] [CrossRef] [Green Version]
  17. Ali, K.K.; Ajeena, A.R. Assessment of interconnection between surface water and groundwater in Sawa Lake area, southern Iraq, using stable isotope technique. Arab. J. Geosci. 2016, 9, 648. [Google Scholar] [CrossRef]
  18. Cao, W.G.; Yang, H.F.; Liu, C.L.; Li, Y.J.; Bai, H. Hydrogeochemical characteristics and evolution of the aquifer systems of Gonghe Basin, Northern China. Geosci. Front. 2018, 9, 907–916. [Google Scholar] [CrossRef]
  19. Guo, Q.; Zhou, Z.; Wang, S. The source, flow rates, and hydrochemical evolution of groundwater in an alluvial fan of Qilian Mountain, Northwest China. Water (Switzerland) 2017, 9, 912. [Google Scholar] [CrossRef] [Green Version]
  20. Chitsazan, M.; Aghazadeh, N.; Mirzaee, Y.; Golestan, Y. Hydrochemical characteristics and the impact of anthropogenic activity on groundwater quality in suburban area of Urmia city, Iran. Environ. Dev. Sustain. 2019, 21, 331–351. [Google Scholar] [CrossRef]
  21. Guo, Q.; Zhou, Z.; Huang, G.; Dou, Z. Variations of groundwater quality in the multi-layered aquifer system near the Luanhe river, China. Sustainability 2019, 11, 994. [Google Scholar] [CrossRef] [Green Version]
  22. Liu, F.; Song, X.; Yang, L.; Zhang, Y.; Han, D.; Ma, Y.; Bu, H. Identifying the origin and geochemical evolution of groundwater using hydrochemistry and stable isotopes in the Subei Lake basin, Ordos energy base, Northwestern China. Hydrol. Earth Syst. Sci. 2015, 19, 551–565. [Google Scholar] [CrossRef] [Green Version]
  23. Engel, M.; Penna, D.; Bertoldi, G.; Vignoli, G.; Tirler, W.; Comiti, F. Controls on spatial and temporal variability in streamflow and hydrochemistry in a glacierized catchment. Hydrol. Earth Syst. Sci. 2019, 23, 2041–2063. [Google Scholar] [CrossRef] [Green Version]
  24. Huang, Y.; Zhou, Z.; Wang, J.; Dou, Z.; Guo, Q. Spatial and temporal variability of the chemistry of the shallow groundwater in the alluvial fan area of the Luanhe river, North China. Environ. Earth Sci. 2014, 72, 5123–5137. [Google Scholar] [CrossRef]
  25. Ledesma-Ruiz, R.; Pastén-Zapata, E.; Parra, R.; Harter, T.; Mahlknecht, J. Investigation of the geochemical evolution of groundwater under agricultural land: A case study in northeastern Mexico. J. Hydrol. 2015, 521, 410–423. [Google Scholar] [CrossRef] [Green Version]
  26. Xiao, K.; Li, H.; Shananan, M.; Zhang, X.; Wang, X.; Zhang, Y.; Zhang, X.; Liu, H. Coastal water quality assessment and groundwater transport in a subtropical mangrove swamp in Daya Bay, China. Sci. Total Environ. 2019, 646, 1419–1432. [Google Scholar] [CrossRef] [PubMed]
  27. Craig, H. Isotopic variations in meteoric waters. Science 1961, 133, 1702–1703. [Google Scholar] [CrossRef]
  28. Dansgaard, W. stable isotopes in precipitation. Tellus 1964, 16, 436–468. [Google Scholar] [CrossRef]
  29. Luz, B.; Barkan, E. Variations of 17O/16O and 18O/16O in meteoric waters. Geochim. Cosmochim. Acta 2010, 74, 6276–6286. [Google Scholar]
  30. Han, D.; Currell, M.J. Delineating multiple salinization processes in a coastal plain aquifer, northern China: Hydrochemical and isotopic evidence. Hydrol. Earth Syst. Sci. 2018, 22, 3473–3491. [Google Scholar] [CrossRef] [Green Version]
  31. Liu, Y.; Yamanaka, T.; Zhou, X.; Tian, F.; Ma, W. Combined use of tracer approach and numerical simulation to estimate groundwater recharge in an alluvial aquifer system: A case study of Nasunogahara area, central Japan. J. Hydrol. 2014, 519, 833–847. [Google Scholar] [CrossRef]
  32. Peng, T.R.; Lu, W.C.; Chen, K.Y.; Zhan, W.J.; Liu, T.K. Groundwater-recharge connectivity between a hills-and-plains’ area of western Taiwan using water isotopes and electrical conductivity. J. Hydrol. 2014, 517, 226–235. [Google Scholar] [CrossRef]
  33. Adomako, D.; Gibrilla, A.; Maloszewski, P.; Ganyaglo, S.Y.; Rai, S.P. Tracing stable isotopes (δ2H and δ18O) from meteoric water to groundwater in the Densu River basin of Ghana. Environ. Monit. Assess. 2015, 187, 1–15. [Google Scholar] [CrossRef] [PubMed]
  34. Hao, S.; Li, F.; Li, Y.; Gu, C.; Zhang, Q.; Qiao, Y.; Jiao, L.; Zhu, N. stable isotope evidence for identifying the recharge mechanisms of precipitation, surface water, and groundwater in the Ebinur Lake basin. Sci. Total Environ. 2019, 657, 1041–1050. [Google Scholar] [CrossRef] [PubMed]
  35. Zhao, X.; Li, F. Isotope evidence for quantifying river evaporation and recharge processes in the lower reaches of the Yellow River. Environ. Earth Sci. 2017, 76, 1–15. [Google Scholar] [CrossRef]
  36. Zhou, Z.; Wang, J. Comprehensive evaluation of environmental hydrogeology of the Jinshajiang Xiluodu reservoir. Geol. J. China Univ. 2002, 8, 227–235. [Google Scholar]
  37. Wang, J.; Zhou, Z. Study on environmental groundwater quality in Xiluodu reservoir. Geol. J. China Univ. 2000, 2, 11–15, (In Chinese with English abstract). [Google Scholar]
  38. Zhuang, C.; Zhou, Z.F.; Li, M.W.; Wang, J.G. Prediction of valley shrinkage deformation in Xiluodu Hydropower Plant based on the hydraulic responses of a confined aquifer. Yantu Gongcheng Xuebao/Chinese J. Geotech. Eng. 2019, 41, 1472–1480, (In Chinese with English abstract). [Google Scholar]
  39. Zhang, G.; Hu, W.J.; Li, Q.; Liu, J.J.; Wang, F.; Zhou, L. Groundwater chemical characteristics of the qiaojia district in the Jinshajiang river valley, Yunnan, China. Carsol. Sin. 2017, 36, 340–345. (In Chinese) [Google Scholar]
  40. Li, S.X.; Yan, Z.W.; Lao, W.K.; Yi, W. Chemical characteristics of qiaojia county buckwheat river basin and the Jinsha River right bank karst water. Water Conserv. Sci. Technol. Econ. 2014, 20, 5–9. (In Chinese) [Google Scholar]
  41. Luo, Z.J.; Zhang, H.; Li, H.Z.; Wang, T.L. Analysis of origin and distribution characteristics of SO42- in dam site area of wudong hydropower station. Hydrogeol. Eng. Geol. 2011, 38, 32–37. (In Chinese) [Google Scholar]
  42. Tao, Z.; Zhao, Z.; Zhang, D.; Li, X.; Wang, B.; Wu, Q.; Zhang, W.; Liu, C. Chemical weathering processes in the sanjiang (the Jinshajiang, lancangjiang and nujinag) basins in southwest China. J. Ecol. 2015, 34, 2297–2308, (In Chinese with English abstract). [Google Scholar]
  43. Huh, Y.; Tsoi, M.Y.; Zaitsev, A.; Edmond, J.M. The fluvial geochemistry of the rivers of eastern Siberia: I. Tributaries of the Lena River draining the sedimentary platform of the Siberian Craton. Geochim. Cosmochim. Acta 1998, 62, 1657–1676. [Google Scholar] [CrossRef]
  44. Coetsiers, M.; Walraevens, K. Chemical characterization of the Neogene Aquifer, Belgium. Hydrogeol. J. 2006, 14, 1556–1568. [Google Scholar] [CrossRef]
  45. Guo, Q.; Zhang, J.; Hu, Z.; Zhou, Z. Hydrochemical and Isotopic Evolution of Groundwater Flowing Downstream of the Daqing River (Liaodong Bay, China). J. Coast. Res. 2020, 36, 608–618. [Google Scholar] [CrossRef]
  46. Gan, Y.; Zhao, K.; Deng, Y.; Liang, X.; Ma, T.; Wang, Y. Groundwater flow and hydrogeochemical evolution in the Jianghan Plain, central China. Hydrogeol. J. 2018, 26, 1609–1623. [Google Scholar] [CrossRef]
  47. Güler, C.; Thyne, G.D. Delineation of hydrochemical facies distribution in a regional groundwater system by means of fuzzy c-means clustering. Water Resour. Res. 2004, 40, 1–11. [Google Scholar] [CrossRef] [Green Version]
  48. Wu, X.; Zheng, Y.; Zhang, J.; Wu, B.; Wang, S.; Tian, Y.; Li, J.; Meng, X. Investigating Hydrochemical Groundwater Processes in an Inland Agricultural Area with Limited Data: A Clustering Approach. Water 2017, 9, 723. [Google Scholar] [CrossRef] [Green Version]
  49. Plummer, L.N.; Busby, J.F.; Lee, R.W.; Hanshaw, B.B. Geochemical Modeling of the Madison Aquifer in Parts of Montana. Water Resour. Res. 1990, 26, 1981–2014. [Google Scholar] [CrossRef]
  50. Global Network of Isotopes in Precipitation. Available online: http://www-naweb.iaea.org/napc/ih/IHS_resources_gnip.html (accessed on 21 October 2018).
  51. Walton-Day, K.; Poeter, E. Investigating hydraulic connections and the origin of water in a mine tunnel using stable isotopes and hydrographs. Appl. Geochem. 2009, 24, 2266–2282. [Google Scholar] [CrossRef]
  52. Yeh, H.F.; Lee, C.H.; Hsu, K.C. Oxygen and hydrogen isotopes for the characteristics of groundwater recharge: A case study from the Chih-Pen Creek basin, Taiwan. Environ. Earth Sci. 2011, 62, 393–402. [Google Scholar] [CrossRef]
  53. Su, C.; Wang, Y.; Pan, Y. Hydrogeochemical and isotopic evidences of the groundwater regime in Datong Basin, Northern China. Environ. Earth Sci. 2013, 70, 877–885. [Google Scholar] [CrossRef]
  54. Kattan, Z. Characterization of surface water and groundwater in the Damascus Ghotta basin: Hydrochemical and environmental isotopes approaches. Environ. Geol. 2006, 51, 173–201. [Google Scholar] [CrossRef]
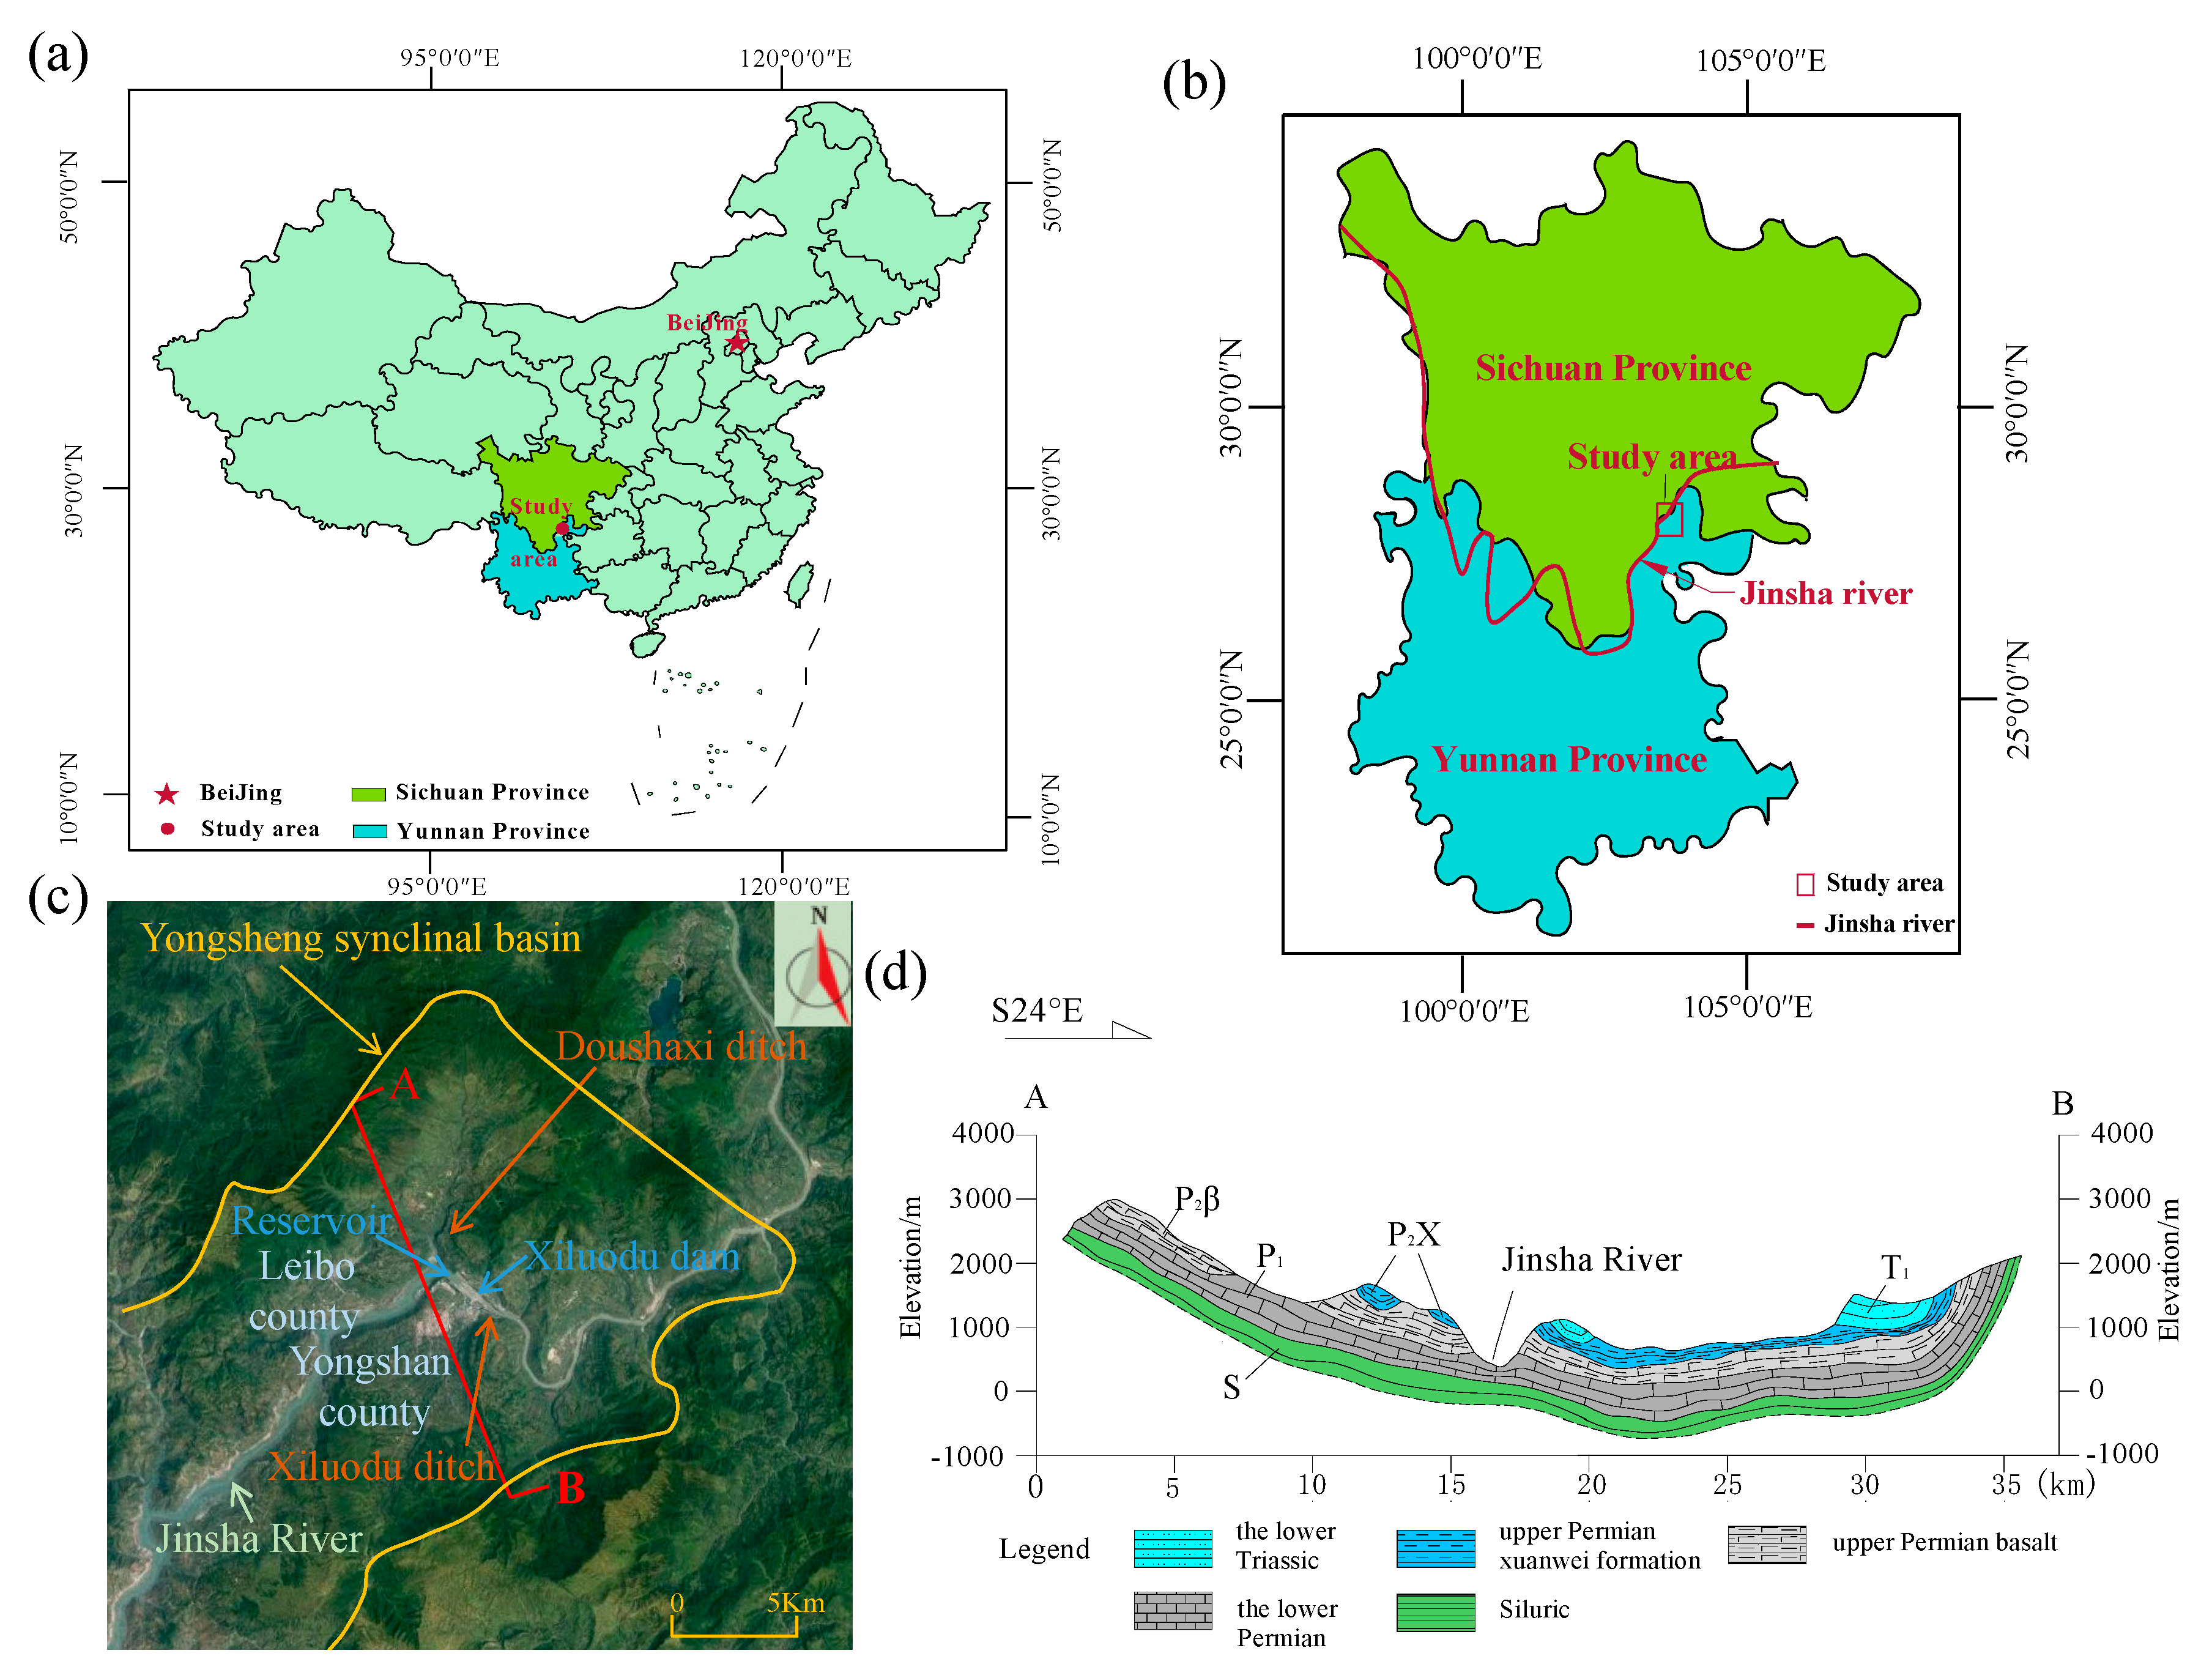
Figure 1. (a) Location map of the study area; (b) The main stream of the Jinsha River; (c) A regional plan of Yongsheng syncline basin; (d) A geological section of the Yongsheng syncline basin.
Sustainability 12 05805 g001
Figure 2. Location diagram of the sampling points. (a) Before impoundment; (b) After impoundment.
Sustainability 12 05805 g002
Figure 3. Characteristics of the water samples before impoundment. (a) Piper trilinear diagram of the groundwater quality; (b) Q-diagram of the cluster analysis of the water samples.
Sustainability 12 05805 g003
Figure 4. The relationship between δ18O and δD of the water samples from the basin.
Sustainability 12 05805 g004
Figure 5. Characteristics of water samples after impoundment. (a) Piper trilinear diagram of groundwater quality; (b) Q-diagram of the cluster analysis of the water samples.
Sustainability 12 05805 g005
Figure 6. Time process line of the groundwater level and the reservoir water level.
Sustainability 12 05805 g006
Figure 7. Schematic diagram of the water flow system after impoundment in the basin. (a) Plane graph; (b) Profile map.
Sustainability 12 05805 g007
Table 1. The location of each sampling point, and the parameters and main components of water sample.
Water TypeSample No.LongitudeLatitudepHTDS
(mg/L)
Main Ion Content (mg/L)
K+Na+Ca2+Mg2+Cl- SO 4 2 - HCO 3 -
Ground
water
previous
GB01103°38′30″28°15′43″7.02233.711.131.17.712.18.2139.7
GB02103°38′43″28°15′34″7.82063.09.230.75.06.08.2134.2
GB03103°38′41″28°15′14″8.41447.121.415.04.08.515.862.2
GB04103°38′52″28°15′22″7.13063.911.850.98.97.544.7168.4
GB05103°38′59″28°15′28″6.91962.47.133.43.86.02.5130.9
GB06103°39′05″28°15′32″7.11912.26.627.77.74.613.9118.4
GB07103°39′00″28°15′10″7.23006.318.841.87.66.022.5186.7
GB08103°39′04″28°15′14″6.91911.64.735.53.84.512.5118.4
GB09103°39′12″28°15′21″7.42842.26.719.215.18.52.4219.7
GB10103°39′18″28°15′27″7.01871.75.130.95.76.72.4124.5
GB11103°39′24″28°15′16″7.72092.98.730.57.46.410.1133.0
GB12103°41′21″28°15′07″7.11901.26.627.77.74.613.9118.4
GB13103°39′13″28°15′08″7.13063.911.850.98.97.544.7168.4
GB14103°39′24″24°14′44″7.92228.024.37.27.813.839.9111.1
GB15103°39′50″28°14′50″6.53302.98.644.318.29.94.8231.3
SD--0.557.02.16.012.24.02.714.943.8
Surface water previousSB1103°38′05″28°15′42″8.12475.115.633.711.924.325.6120.7
SB2103°39′36″28°14′57″8.02021.03.130.912.613.14.3126.7
SB3103°40′24″28°14′27″7.92571.64.842.711.711.712.0162.9
SB4103°38′07″28°16′22″7.91151.54.417.03.43.96.268.3
SB5103°40′07″28°14′39″7.51611.02.923.08.95.017.892.7
SD--0.259.51.75.39.93.88.28.735.8
Ground
water
late
GA01103°38′31″28°15′14″8.23391.326.147.114.026.143.3171.0
GA02103°39′15″28°15′44″10.75581.579.04.01.212.241.00.0
GA03103°38′58″28°15′03″8.13170.815.348.114.019.032.1174.0
GA04103°39′27″28°15′32″8.02391.820.233.13.013.322.3125.0
GA05103°39′07″28°15′15″8.22921.522.643.011.133.344.2123.0
GA06103°39′13″28°15′20″8.03181.016.948.014.622.047.5154.0
GA07103°39′08″28°15′09″8.43352.230.239.017.536.946.4153.0
GA08103°39′14″28°15′14″8.22851.923.835.013.827.037.3137.0
GA09103°39′20″28°15′19″8.12681.417.334.013.715.027.1150.0
GA10103°39′16″28°15′05″8.12591.114.236.011.612.723.6151.0
GA11103°39′20″28°15′09″8.12921.323.535.015.024.233.9148.0
GA12103°39′27″28°15′14″8.12881.324.735.014.628.838.2135.0
GA13103°39′23″20°15′03″8.62411.733.522.07.919.535.9109.0
GA14103°39′28″28°15′05″8.12641.530.929.09.823.044.9114.0
SD--0.779.00.416.011.54.77.78.342.6
Surface water
late
SA1103°38′37″28°15′36″8.33582.533.240.018.935.947.9171.0
SA2103°39′42″28°14′54″8.13602.232.746.016.738.951.3165.0
Table 2. Values of the SI for key minerals in the limestone aquifer.
Sample No.AnhydriteAragoniteCalcitepCO2DolomiteGypsumHalite
GB01−3.59−0.90−0.76−1.85−1.77−3.37−8.42
GB02−3.58−0.120.02−2.67−0.40−3.36−8.81
GB09−4.35−0.53−0.38−2.06−0.52−4.13−8.80
GB12−3.39−0.91−0.77−2.02−1.75−3.17−9.07
GB15−3.75−1.07−0.92−1.14−1.88−3.53−8.63
GA01−2.770.500.65−2.991.12−2.55−7.73
GA02−2.880.430.57−2.880.96−2.66−8.10
GA03−3.120.070.21−2.91−0.27−2.90−8.12
GA07−2.820.560.7−3.251.41−2.6−7.52
GA08−2.930.300.44−3.080.83−2.71−7.75
GA09−3.070.230.38−2.940.71−2.85−8.14
GA11−2.980.230.38−2.950.73−2.76−7.81
Table 3. δ18O and δD values of water samples before and after water impoundment, as well as the supply elevation.
Water TypeSample No.Elevation (m)δ18O (‰)δD (‰)d-Excess (‰)Recharge Elevation (m)
Groundwater
previous
GB01424.3−8.9−61.49.8911.5
GB11404.3−7.9−55.18.1670.5
GB15405.7−8.5−58.39.7788.5
Surface
water
previous
SB03380.0−11.4−97.4−6.22207.5
SB04380.0−8.6−60.58.3854.9
Groundwater
late
GA03389.9−12.6−94.86.02119.3
GA04387.8−11.8−86.97.51829.7
GA07335.0−13.9−101.59.72337.2
GA09335.0−12.2−85.112.51735.8
GA10335.0−11.9−82.113.11625.8
GA11335.0−13.3−92.513.92007.2
SD-0.837.16--