Abstract
Conventional diamond interchanges are facing ever-growing challenges related to traffic operations and safety risks due to increasing traffic volumes and worsening congestions. The agencies are well aware of the high socioeconomic (e.g., user delay cost, fuel cost, and high accident rates) and environmental losses (traffic emissions due to vehicles queuing) associated with the conventional interchange design. This paper provides insight into the different factors that affect the sustainability performance (operational and safety) of a conventional interchange through its redesign into the Diverging Diamond Interchange (DDI) with the increased left-turn demand. It also assesses the need to redesign an interchange to improve the efficiency. Two interchanges that have DDI designs were selected for investigations, and the required data were collected from the relevant agency. The average delay and the capacity were used as the Measures of Effectiveness (MOEs) for data analysis. Numerous factors, that affected these MOEs, were used to design an experiment. This experiment included different levels of volumes, geometric designs, and signal plans. The micro-simulation software (VISSIM 8.0) was employed to calibrate and validate the existing conditions through several steps, including signal optimization and driving behavior parameter optimization. The analysis of the results detected the key thresholds of switching from the conventional design to the innovative design under 90 different scenarios. Finally, the sustainability evaluation of DDI and Conventional Design Interchange was conducted based on their operation and safety performance comparison. The results and findings of this research will act as a guideline for decision-makers regarding when they should consider switching from the conventional interchange design to an innovative design.
1. Introduction
Around the world, highway systems were designed to tolerate and accommodate traffic patterns that no longer can be handled. The traffic demand in recent decades has been continuously increasing because of the exponential growth in the population. Consequently, many highway interchanges along on the system have been suffering from increased traffic and long delays, which is amplified by the high left-turn volume onto the arterials. In addition to the socio-economic (increase in user costs associated with traffic delays and rising safety issues) and environmental (increase in traffic emissions) losses, such growth in traffic volumes has led to an accelerated rate of deterioration of the infrastructure network (increase in pavement maintenance cost). Highway agencies are striving for safer, robust, and innovative designs for sustainable interchanges [1]. Although achieving sustainability is easier in the design of new interchanges, the renewal of existing facilities can help in reducing both the delays and associated environmental impacts [2]. A sustainable redesign can improve both the operational and environmental performance and the safety of the users [3].
Transportation engineers have been researching new countermeasures to improve the operational and safety performance on highways. Constrained by limited resources, researchers and professionals had to develop several countermeasures to relieve congestion and improve the level of service (LOS) in such designs [4]. The conventional countermeasure that has been adopted by traffic engineers, categorized as the first approach, is to mitigate the congestion with double left-turn lanes, increasing the cycle length, signal coordination and signal synchronization [5]. Modifications to any design, such as widening the right-of-way and improving alternative routes, are expensive and disruptive [6]. Adjustments to cycle lengths and signal coordination can only provide marginal improvements at saturated intersections [5]. When the conventional measures prove to be inadequate or unfeasible, grade separation may be considered as a second countermeasure. Considering grade separation as a feasible countermeasure to traffic operations challenges at major intersections leads to significant improvements in the traffic conditions. However, this approach cannot be implemented in many cases due to the time and costs related to the construction of grade separation design [7].
After trying to solve congestion by using the previous countermeasures, with no sustainable or optimal solution, transportation engineering professionals in recent decades have been striving to develop unconventional designs to remedy the congestion problem that has mainly been caused by the high left-turn volume on the cross streets at the interchanges, categorized as the third countermeasure. The Diverging Diamond Interchange (DDI) is considered to be one of the sustainable designs of warrants that efficiently improves the traffic performance and accommodates heavy traffic patterns with less cost. This is typically done by shifting the left and through movements to the opposite side of the right-of-way, causing a reduction in the number of signal phases and conflict points at the interchange. It has been proven by other research that the principle of this innovative re-design can improve traffic operations and safety beyond the capabilities of other conventional designs [4].
There are worthy research studies that have been done to analyze and evaluate the operational and safety performance of the DDI. Tanackov et al. [8] evaluated the structure and safety issues of the left-turn maneuver in the intensive flow conditions of the conventional diamond interchange. Although the drivers’ adaptation to the DDI remains a challenge to date, DDI improves the overall safety performance [9]. A recent study modeled the safety performance of the new super DDI design for both the vehicles and the pedestrians [10]. Most of the past studies were done based on comparing the performance between the innovative designs with their conventional design [2,11]. There were a few of these studies that tested this design to guide the authority for when it should convert from one design to another based on the performance comparison between both designs [4,12]. However, these studies did not build their guidelines based on technical assessments that reflect the need and justification for redesigning the Conventional Diamond Interchange (CDI).
The main purpose of this research is to have a better understanding of the DDI and the different factors that affect the interchange operational performance due to increased left-turn demand. It also assesses the need and justification for redesigning the interchange to improve the sustainability. For this purpose, an extensive literature review of existing studies was done in order to understand the principles of this innovative design and determine the methodology that needs to be followed to achieve the aim of the study. Accordingly, two interchanges were selected to be candidate locations that already have implemented DDI designs and collect the required data to calibrate and validate the models. In addition, two Measures of Effectiveness (MOEs) were identified to be used in this study: capacity and average delay. These MOEs are affected by many factors, which led to an experimental design. For experimental design, a range of volume conditions, geometric elements, and signal plans were set and the MOEs were used to reach the goal of the study. VISSIM (version 8.0) is the micro-simulation software that was selected to perform the analysis at the microscopic level. The calibration and validation of the models were done by using the field data under a set of optimized driver behavior parameters and signal plans. The simulation models were then ran using different volume scenarios. The results were then analyzed to compare the performance of the DDI compared to the CDI. Also, the results were used to detect the tipping points of switching from the CDI to the DDI warrants. The results and findings of this research are guidelines for decision makers as to when they should consider switching from the CDI to the DDI based on these specific parameters.
2. Methodology
2.1. Diverging Diamond Interchange Design
The DDI design, also known as Double Crossover Diamond (DCD), was introduced by Chlewicki in 2003 [13]. The first DDI in the United States was constructed in Springfield, Missouri, 2009 [14]. The fundamental concept of the DDI is shifting the through and left-turn movements from the right side of the road to the left side. The shifting happens by intersecting the mainline of the road by a protected phase before entering the interchange (see Figure 1) [15]. The DDI design allows a simple operation with two signal phases, allowing the efficient processing of traffic flow, especially for interchanges with high left-turn demand. The DDI design also allows the vehicles to make a left-turn to on-ramp (see no. 7 in Figure 1) without any conflict with vehicles approaching from the other direction [16].
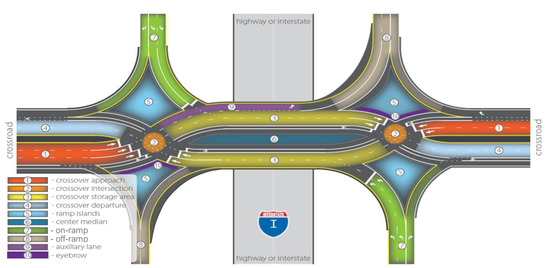
Figure 1.
Layout of Diverging Diamond Interchange (DDI) (UDOT DDI Guidelines [10]).
The DDI design supports sustainability in several ways. First, a lower number of signal phases, from 3 or 4 to 2 phases, reduces the no-vehicle-moving time (i.e., red-time), which eventually lowers the congestion rate and improves user mobility (less delays and user cost savings) through the interchange. Second, DDI achieves a drastic decline in the traffic that needs to stop for left-turning in the case of conventional interchange design. By allowing free-flow left-turn movement, the improved DDI design significantly enhances quality of life by minimizing noise and vibration levels. Third, the intersections are known to be the sensitive points in terms of environmental pollution, with the highest likelihood of braking and acceleration in any highway network. Although DDI handles the same, or probably more, traffic in comparison to the conventional design, the reduced number of stops certainly reduces vehicular emissions.
2.2. Measures of Effectiveness (MOE)
Previous studies used several Measures of Effectiveness (MOEs) to compare different designs. In addition, several MOEs have been tested to identify the best measures related to the DDI design and the experiment. The MOEs reported in previous studies are queue length (through and left-turn), through and left-turn delay, and capacity (through and left-turn). As the present study focused on the operational evaluation of the DDI, two MOEs were found to be useful to detect the switching point from the CDI to DDI, average delay, and capacity (maximum throughput of movements). These MOEs can be affected by many factors, such as traffic volumes, geometric designs, and signal plans. Subsequently, an experimental design, considering these factors, was set up to evaluate the operations of the DDI.
2.3. Monitoring Locations and Data Collection
Since the DDI concept is relatively new and no innovative interchange designs have been implemented in Florida to date, the candidate locations for the study were selected outside the state. However, the Florida Department of Transportation (FDOT) is planning for 26 DDIs to be implemented by 2030. There are several locations with the new designs along the U.S. In most of the cases, either sufficient data are not available or they are difficult to access. Two main challenges were faced in this task: i) it was not easy to find the locations that have already implemented the DDI and ii) although some agencies and authorities have collected the required data for the implemented designs, it was challenging to identify those who were interested in data sharing. Fortunately, the Federal Highway Administration (FHWA) proposed two locations with their data; (i) I-285 and Ashford Dunwoody, Atlanta, GA, and (ii) I-85 and Pleasant Hill, Atlanta, GA. The data for these locations are origins and destinations (O-D) matrices, turning movement counts, average travel times, average speeds, and traffic delays measured in the field was obtained from FHWA.
2.4. The Design of Experiments
As two MOEs were used in the present study, including capacity and average delay. These MOEs are affected by many factors, such as a range of traffic volume conditions (i.e., 500, 750, 1000, 1250, and 1500), geometric elements (spacing distance and the number of lanes), and signal plans. In the present research, the dependence of MOE on these factors generated several (around 90) different scenarios that were evaluated with the help of the multi-level factorial design.
2.5. Simulation Tool
There is a need to select an appropriate tool that has the ability to perform detailed analysis at the microscopic level [17]. There are many traffic microsimulation tools that have been used by many researchers, but the most commonly used microsimulation software in the previous studies is VISSIM. VISSIM (version 8.0) is the tool that was used for the simulation and evaluation of the candidate locations. VISSIM is a tool that is a time-based, stochastic simulation of individual vehicles, which has many functions: the ability to simulate the innovative designs, ability to simulate signal control plans and/or import signal plans from other tools, the capability of running the simulation for different replications and random seeds easily, and other factors.
3. Results
3.1. Traffic Model Calibration, and Verification
There are many simulation parameters that affect the reliability and accuracy of simulating any design when using VISSIM. The parameters that were considered while designing and running the models were the number of replications, simulation period, seeding number, calibration, and validation of the simulation model [18,19]. By reviewing the previous research to determine the minimum and maximum number of each parameter, an accurate way to calibrate and validate such design models was obtained. The replication number is very helpful, while improving the accuracy of the designed models and minimizing the error between the field data and model outputs (demand/capacity and MOEs). In practice, 10 replications have been widely used. Factorial experiments are used for scenarios with more than two levels of each factor. Since we used a multi-factorial design with five levels of traffic volume, two types of number of lanes (left-turn and through) for each spacing distance (850, 1200, and 1550) resulted in 90 stand-alone scenarios. As each scenario was unique, this does not require multiple replications, statistically. Therefore, we used one replication for each scenario. Detailed analyses are presented below in Section 3.4.
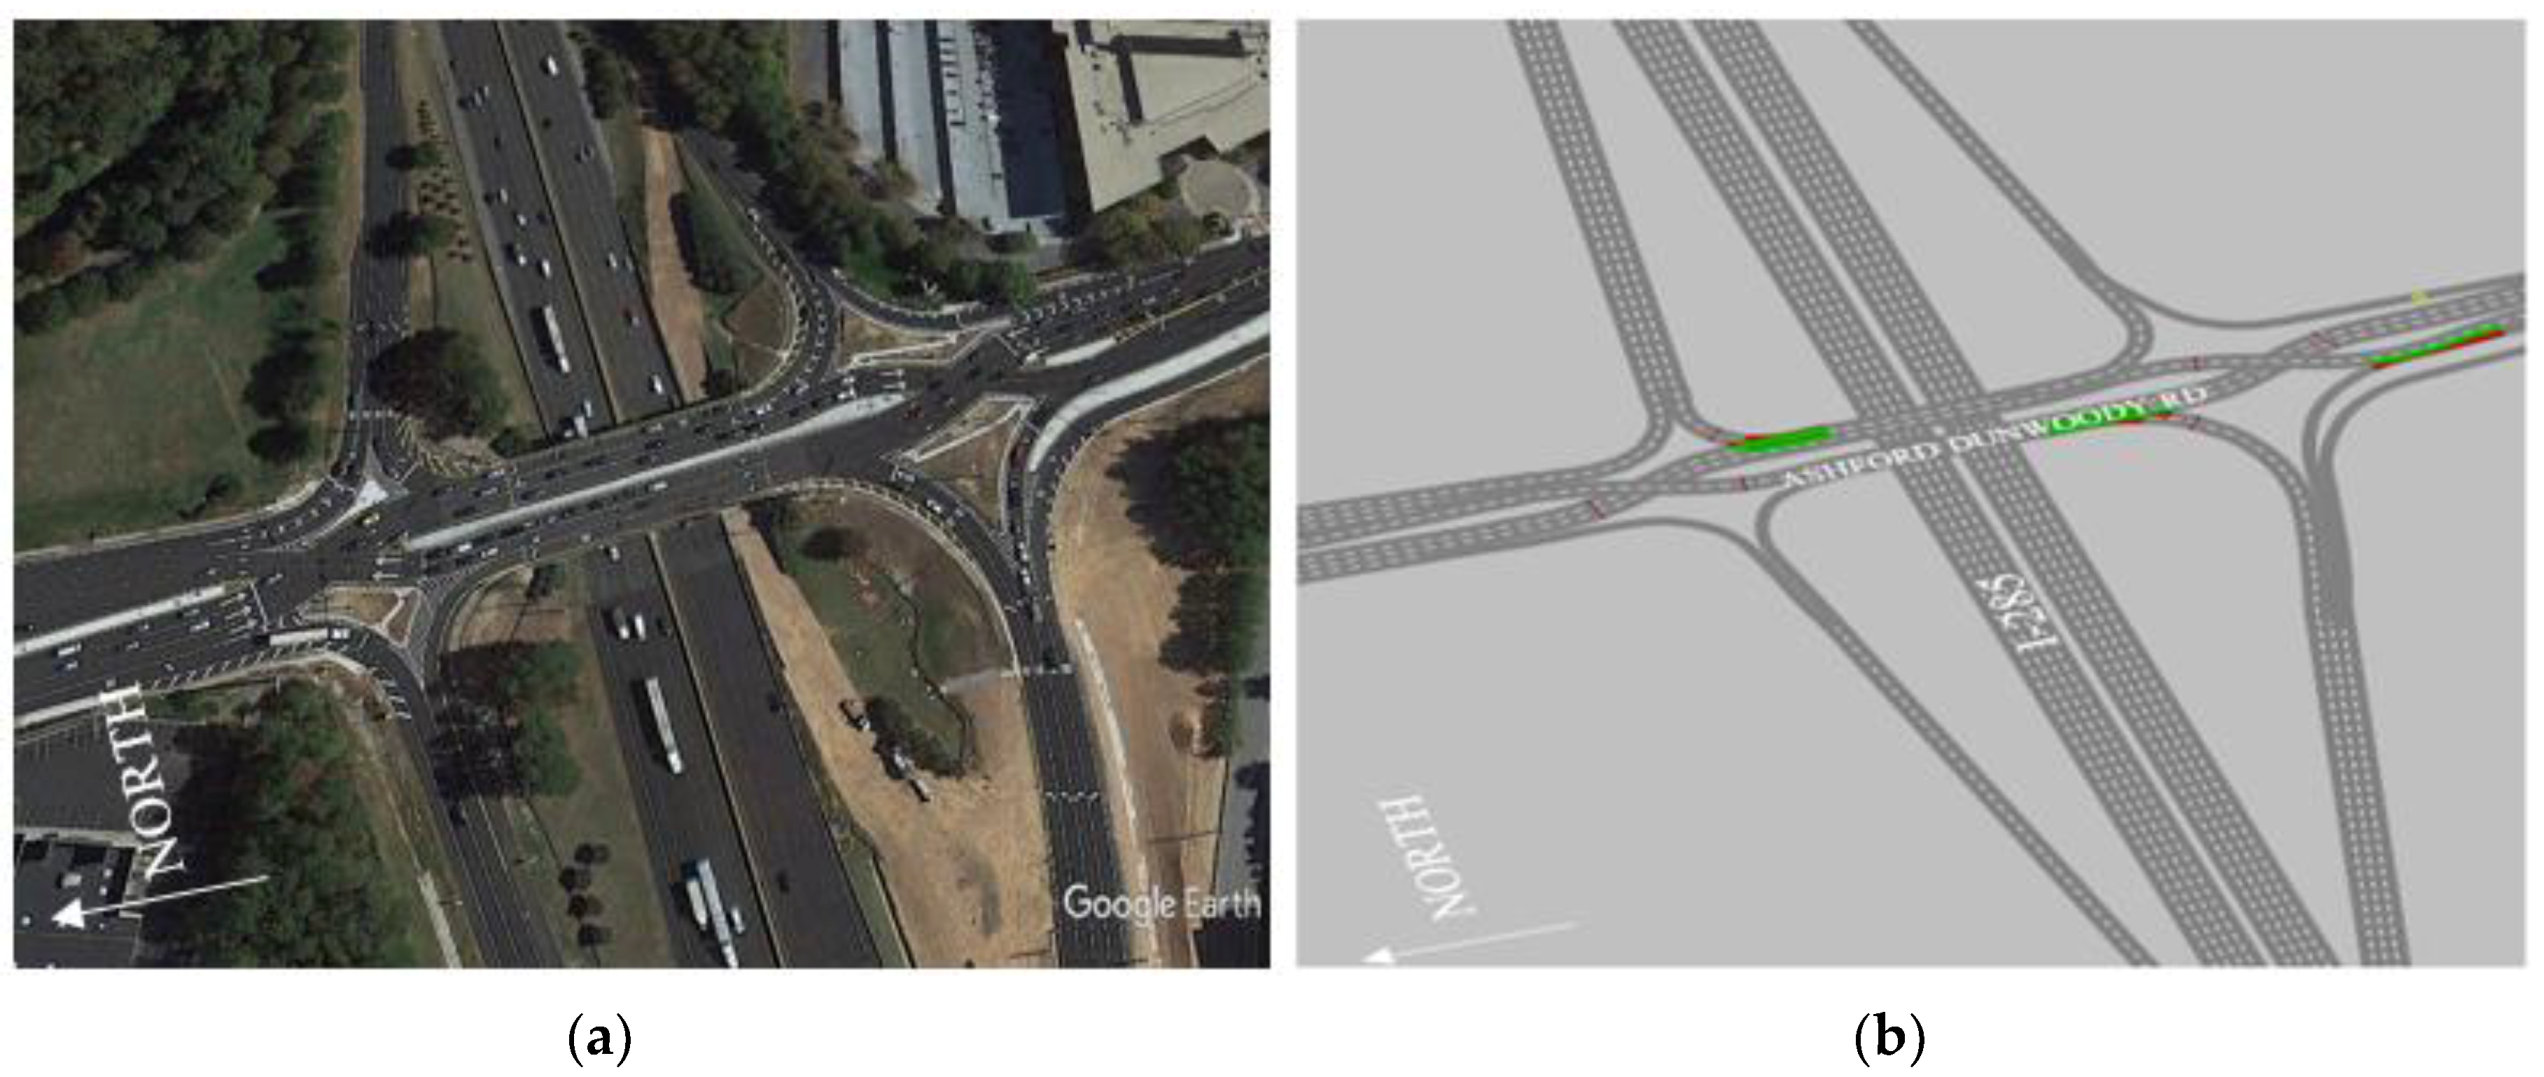
Different simulation period times have been used by other studies, varying between 15 and 360 min, while 75 min was found to provide enough simulation time to run the model. Principally, the first 15 min of the simulation time ensures that the system is fully operational, and the model is reliable for use [7]. Maintaining the simulation parameters throughout the simulation period leads to more reliable simulation outputs. The driver behavior parameters are among the most effective parameters for simulating any design using the microsimulation software. The proposed interchange was simulated, using the field data obtained for the actual geometric design, for calibrating and validating the coded model. Both the models for the DDI and its CDI design were modeled, calibrated, and validated (see Figure 2).

Figure 2.
Description of the study area showing the Ashford Dunwoody Rd and I-285 DDI Location, Atlanta, GA, (a) aerial photograph from Google Earth, (b) geometric model in VISSIM 8.
3.2. Signal Timing Optimization
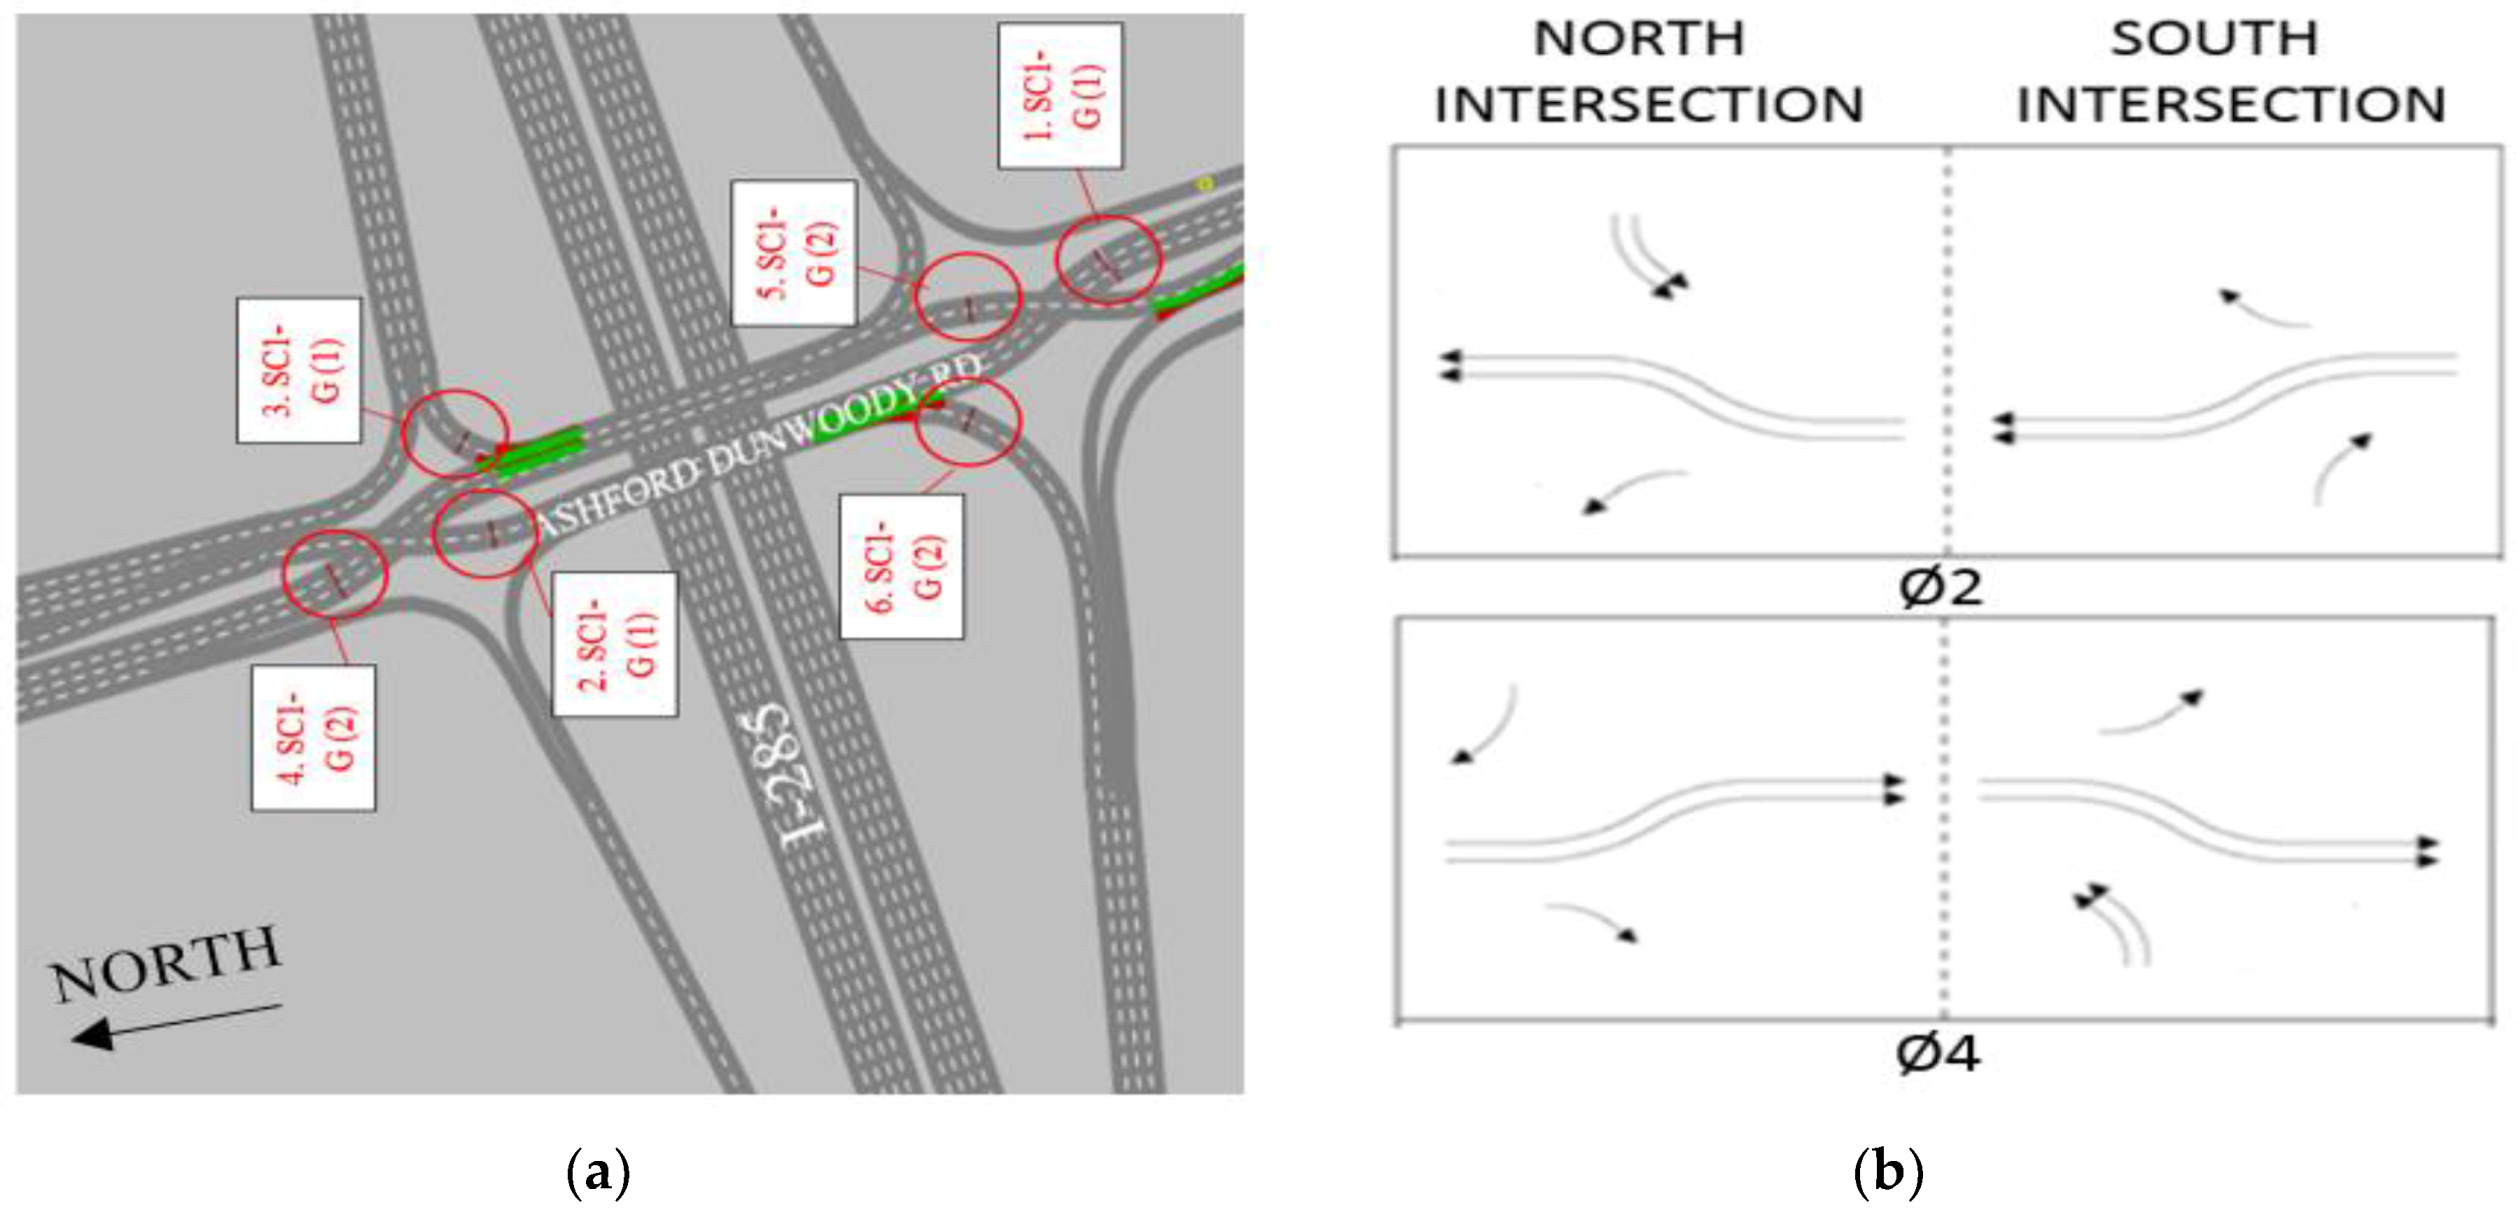
Since the signal timing for the studied location was not available, there was a need to optimize the signal to ensure the model outputs match the field data. The signal timing plans of the DDI can be optimized using either Synchro software or manually. While optimizing the signals, it was found that Synchro does not perform signal optimization for an interchange signal phase. However, the signal optimization was performed by considering the two crossovers of the DDI as two separate intersections [20,21]. In the present study, the signal optimization was performed manually by using VISSIM. Since this design can be operated with two-phase control, with each phase dedicated to the alternative opposing movements; the signal plan used was a fixed time plan. As shown in Figure 3, the DDI is operated with one signal controller and two phases [22,23,24]. The second phase allows the northbound traffic to cross the south and north crossovers and west off-ramp traffic to make left and right turn (using yield sign) without any conflicts. The same happens for the south- and east-bound traffic with the fourth phase. Since the purpose of this study is evaluating the performance of the left-turn movement, the pedestrian phase was not included.
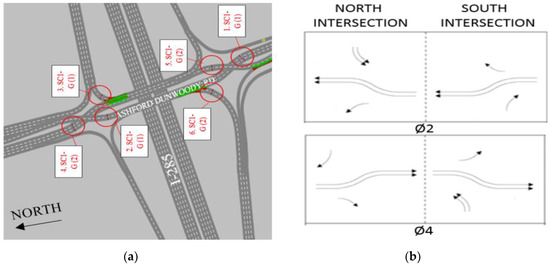
Figure 3.
Information on Interchange signalization, (a) Signal Controller Locations, (b) signal phasing for DDI.
Seven different cycle length scenarios were used to optimize the signal plan under different levels of volume. Three of these scenarios had a 60 s cycle length, one a 75 s cycle length, one an 80 s cycle length, and two a 90 s cycle length with different green times (g/c) which were 30/60, 40/60, 35/60, 40/75, 40/80, 45/90, and 54/90, respectively. The green time includes 3 s yellow and 1 s all red time. The signal timing scenario with the least left-turn delay, highest capacity of the left-turn traffic, and the highest match percentage between the input and output data of the model were selected as the optimized signal plans (as the comparison index). Since this research was seeking better performance for all approaches and no preference was given to any movement. The 60 s cycle length with a 30 s green time for each phase was selected to be the optimized signal plan, despite some cycle lengths showing better performance for specific movements. For the CDI, the same steps were followed to optimize the signal timing with three phases, two signal controllers, and 12 candidate cycle length scenarios (60, 90, and 120 s) with different g/c ratios. The selection criteria of the optimal signal plan were the same as the DDI criteria and the 90 s cycle length was selected as the optimal signal timing, which showed the highest throughput and least delay.
3.3. Driver Behavior Parameters
In order to calibrate the coded models and improve its reliability to mimic the field conditions, there was a need to choose a set of driver behavior parameters and run the model under different values of these parameters and then select the superior set of parameters that will give 95% or more matching between the input (field) and model outputs (demand/capacity and MOEs). Five parameters under the Wiedemann 99 have been identified as the most influential parameters: CC0 = Standstill distance, CC1 = Headway Time, CC2 = Following Variation, CC7 = Oscillation Acceleration, and CC8 = Standstill Acceleration [19,25,26]. Sensitivity analyses were performed to closely examine these five parameters. The results were used to calibrate the models and obtain the optimal set of parameters with the least error (i.e., 5% or less) between the input (field) and output of the model. This approach helped to identify the set of parameters with a substantial impact on the design, which is difficult to identify in real life.
The VISSIM model was initially run with the parameters’ default values, and the percentage difference between the model demand inputs (field) and outputs was found to be 84%. As the acceptable error should be less than 5% [26,27], there was a need for further alterations to the parameters for calibration. Multiple scenarios with different Wiedemann 99 parameter values were run by sensitivity analysis (trial and error) until the calibration of the model was completed. The values of each of the driver behavior parameters were changed two levels higher and two levels lower than the default values (see the row with bold values in Table 1), and the analysis was performed while keeping all the other parameter values constant. In each case, the model outputs (demand/capacity and MOEs) were observed to evaluate their variations with changing inputs within 25 iterations. The parameter value that had the least difference between the input and output was identified as the most significant value: CC0 at value 1.64 ft, CC1 at value 0.7 s, and CC2 at value 6.56 ft. The default values for the other two parameters have been found as the best values to be used for the models. Once the optimal driving behavior parameter set has been identified, the model was run under this set of parameters. The calibrated model showed the percent difference between the real data (demand and MOEs) and model output was less than 3%. These findings are more reliable than the hypothetical studies conducted in the past [28].

Table 1.
Wiedemann 99 Parameters Sensitivity Analysis Scenarios (bolded figures show the default values).
With the models calibrated, there was still a need to validate the developed models to ensure their reliability, so the collected data for the other interchange location were used as the demand input and matched with the calibrated model outputs (volume and other MOEs) within 95% confidence. The error between the real data and model outputs was 4%.
3.4. The Design of Experiments
The MOEs are affected by different factors such as crossover spacing distance, number of lanes, and traffic volume levels which were included in the experimental design and led to 90 different scenarios for each design (see Table 2). Table 2 shows three different scenario groups which were categorized based on the spacing distance between the two crossovers intersections. The three levels of spacing distance between two crossovers were selected based on a review of current installations and studies that have been done and they recommended 850 feet crossover distance or greater [14,20]. Also, two and three levels of number of lanes for the left (LT) and through (Thru) movements, respectively. For each of these scenarios the capacity for through and left turn lanes was vehicle per hour per lane and was varied between 500, 750, 1000, 1250, and 1500 vehicles/h-lane, while allotting 5% of the total volume to the right turners. Each volume per lane scenario multiplied by the number of lanes per approach of that scenario plus 5% for right turn volume which results into the total volume per approach as shown in Table 2.
Table 2.
Experimental Design Parameters and scenarios for DDI and Conventional Diamond Interchange (CDI).
3.5. Scenario Analysis
After the models were calibrated and validated, the scenarios were built based on the three groups of experimental design for achieving a sustainable design of DDI. Eighteen different models were coded for different number of lanes and spacing distance. Each scenario was run under five levels of traffic conditions to simulate peak and off-peak traffic and search for the threshold that makes the DDI design more superior than the CDI. This experiment resulted in 90 scenarios of simulation runs for each design. In addition, the models were used to evaluate the operational performance of the DDI compared to its conventional design in terms of delay and capacity of the left-turn movement.
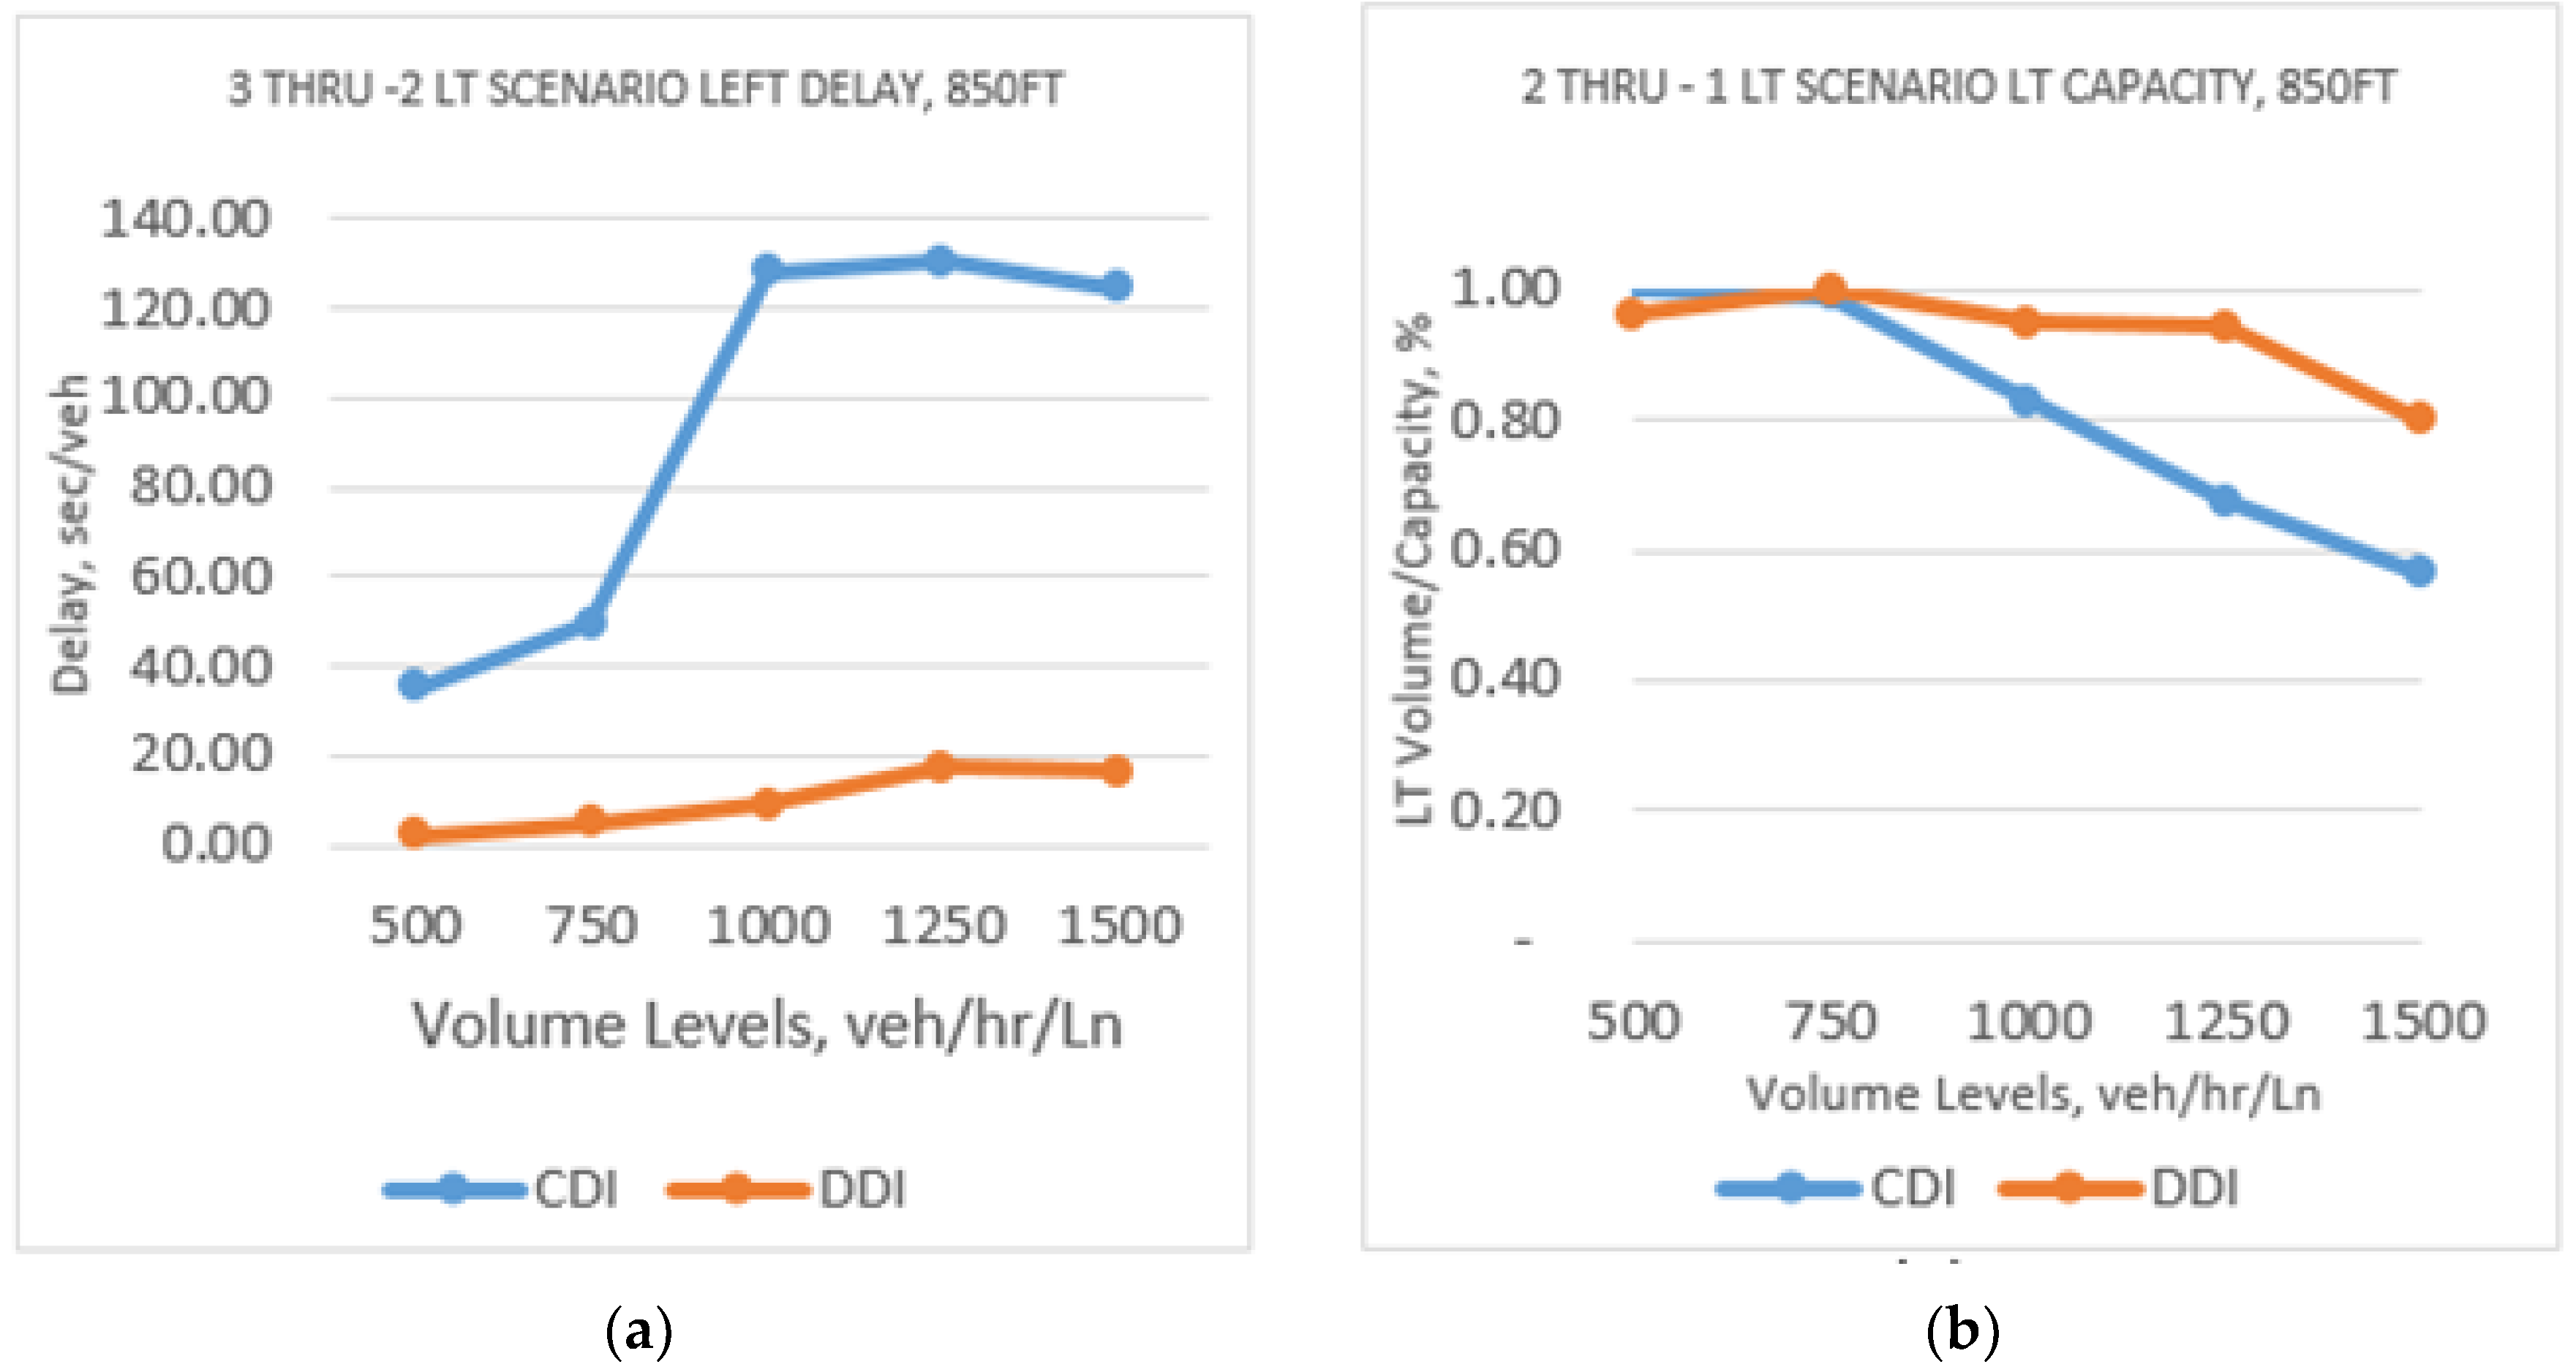
The results of scenario analysis for the Group 1, which share the same crossover distance of 850 ft but different number of lanes and volume levels, are presented in Figure 4a,b. Figure 4a shows that in terms of left-turn delay, the DDI design outperformed the CDI for all levels of traffic volume and crossover distances with superiority more evident at higher traffic volumes. For the left-turn capacity, Figure 4b shows that the DDI outperformed the CDI design. The point at which DDI crossed CDI occurred at different level of volume between 500 and 750 vehicles per hour per lane. Figure 4b shows that the crossing point for the scenario with one left-lane and two through lanes occurred at 750 veh/h per lane. It can also been observed that, as the traffic volume increases beyond 750 veh/h, the difference between the two designs for delay and capacity tremendously increased. It was also clear that as the through volume increased by increasing the number of through lanes with both left-turn lane scenarios, the left-turn capacity for the DDI and CDI were decreasing because of the additional traffic volume. However, increasing the number of left-turn lanes improve the capacity of the DDI more than the CDI when the number of through lanes is constant due to the larger number of signal phases in CDI.
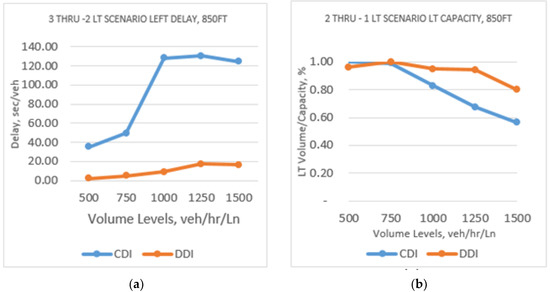
Figure 4.
LT Delay Performance for DDI vs. CDI for different scenarios, (a) 3 THRU—2 LT Scenario Left delay, 850 ft, (b) 2 THRU—1 LT Scenario LT capacity, 850 ft.
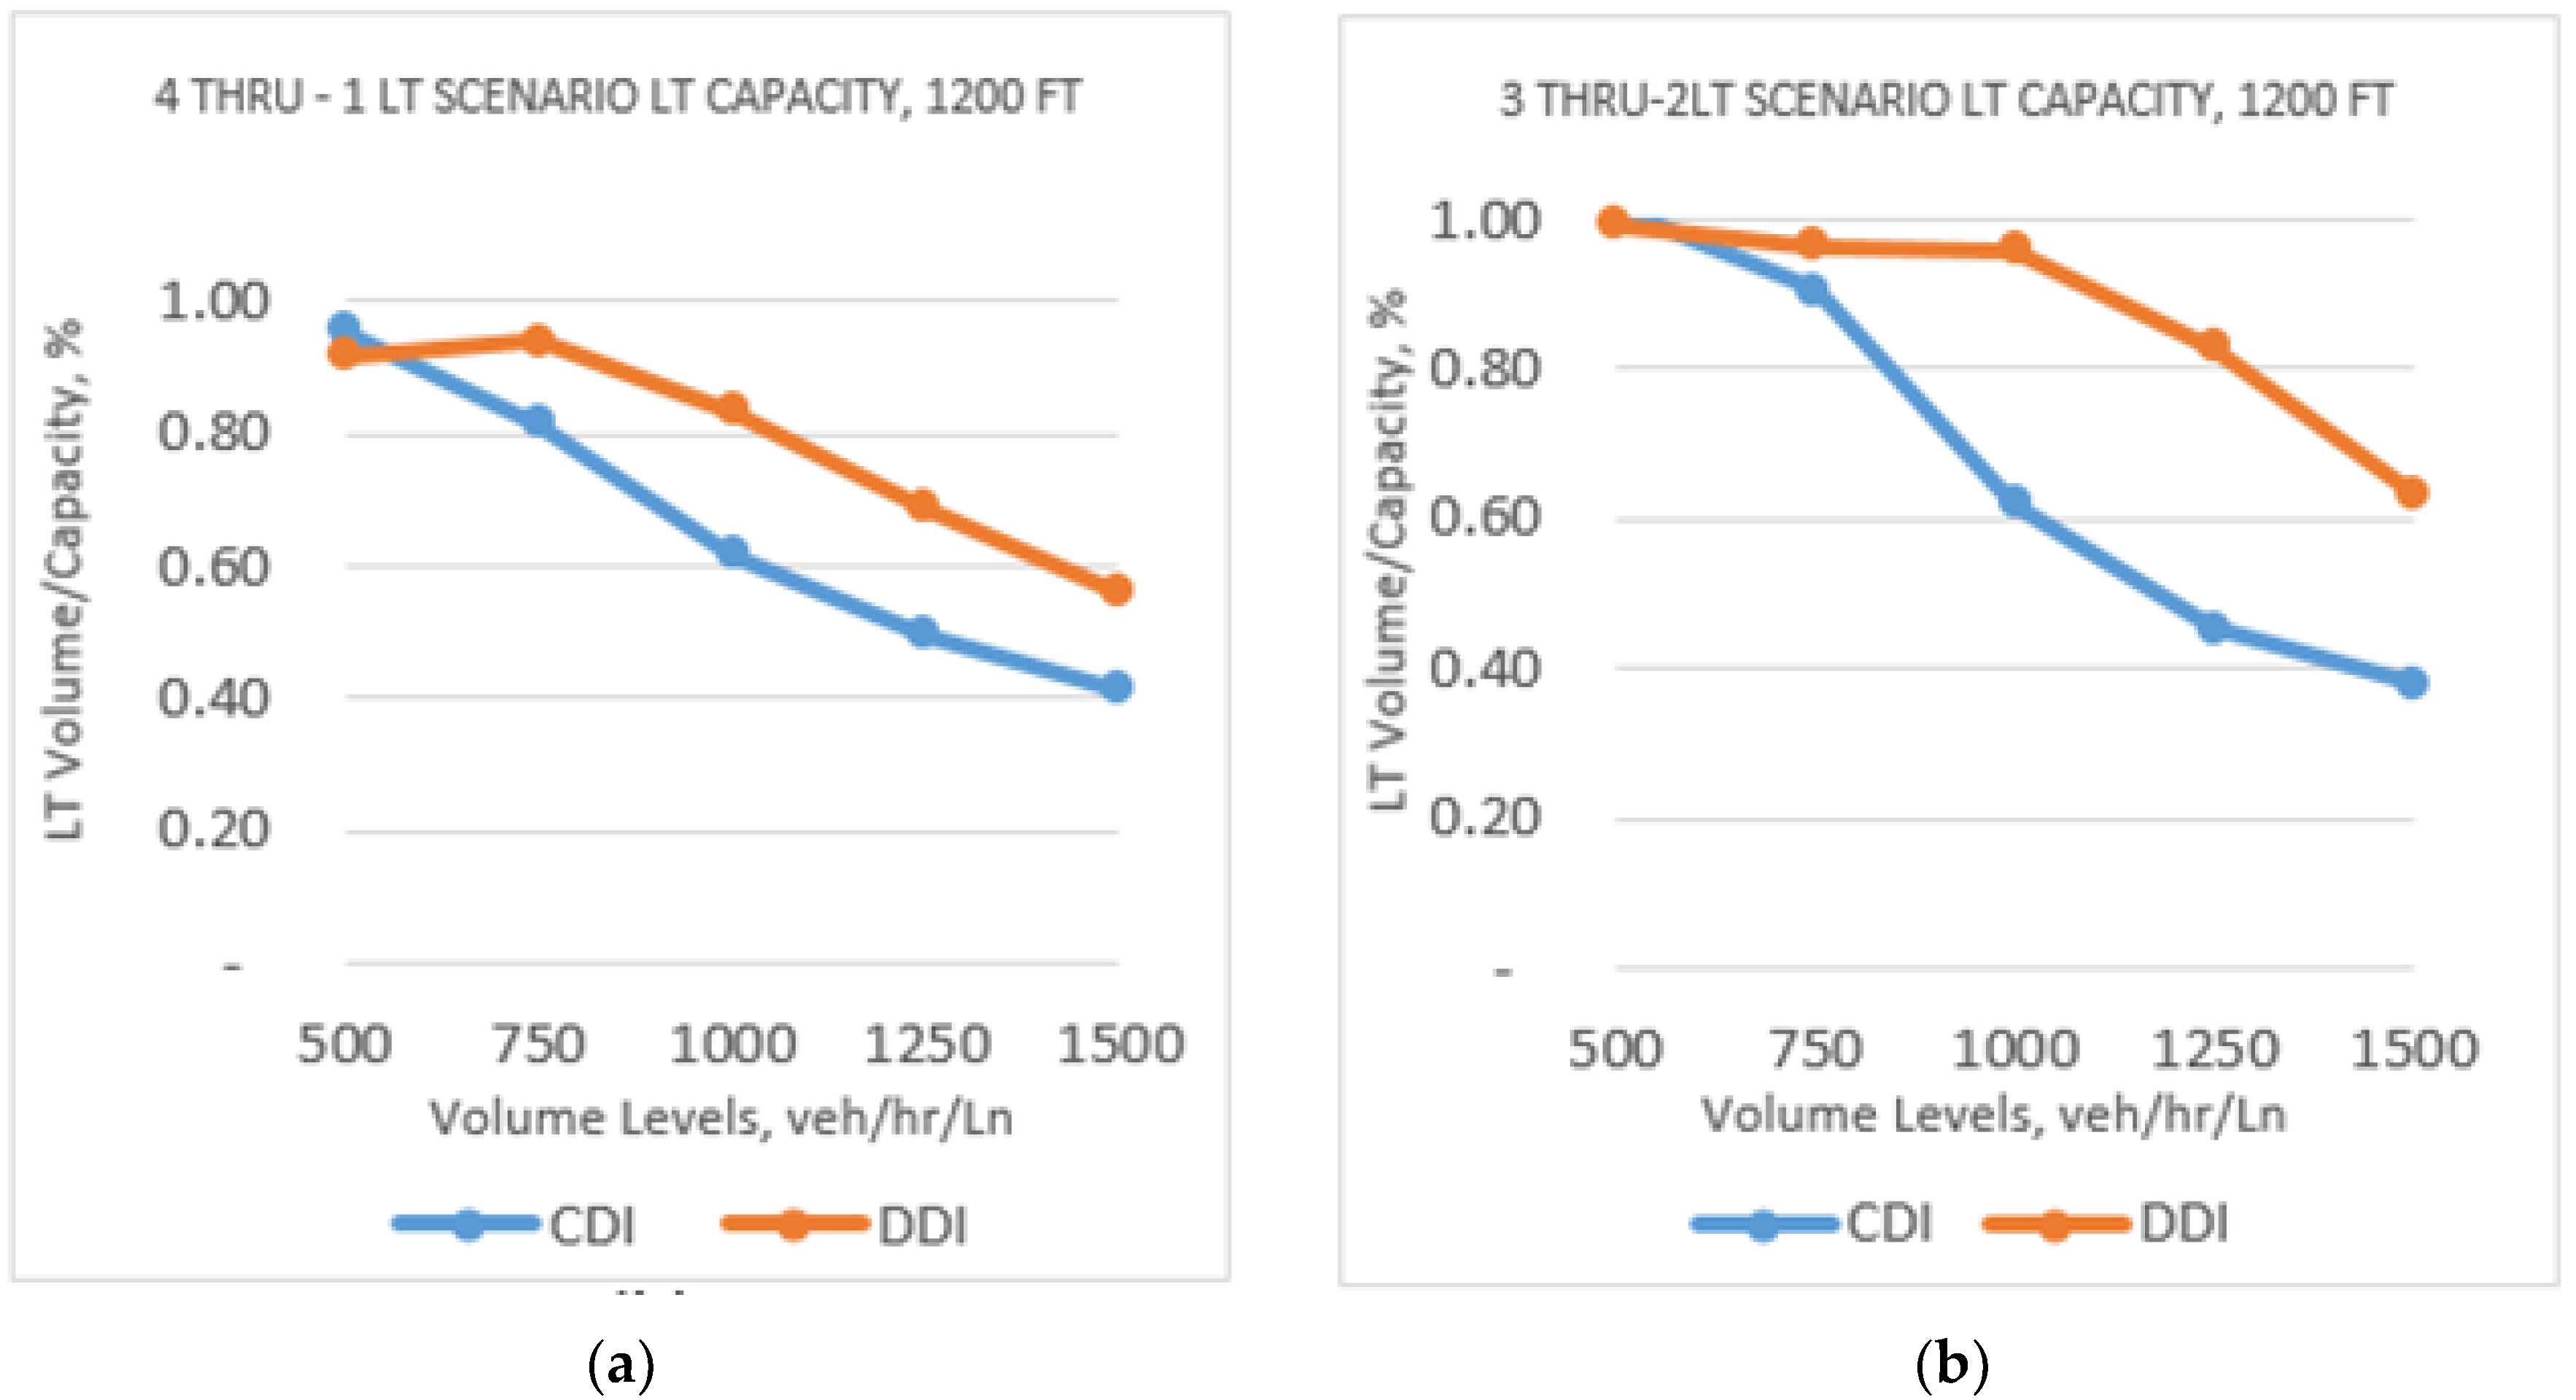
The results of scenario analysis for Group 2, with a 1200 ft crossover distance, are presented in Figure 5a,b. The DDI outperformed the CDI in terms of delay and capacity. It can be seen in the figure that all the left-turn capacity scenarios had crossing points between the two designs. In comparison to Group 1, Figure 5a shows that the crossing point went down to 500 veh/h per lane level while increasing the through lanes and holding the number of left turn lanes constant. This was attributed to the increase in through traffic when increasing the number of through lanes. Figure 5b shows that the crossing points for the two left turn lanes crossed around 500 to 600 vehicle levels due to the increase in the left turn volume.
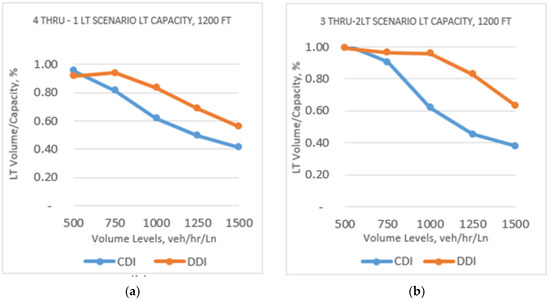
Figure 5.
Performance of LT Capacity for DDI vs. CDI for different scenarios, (a) 4 THRU—1 LT Scenario LT capacity, 1200 ft, (b) 3 THRU—2 LT Scenario LT capacity, 1200 ft.
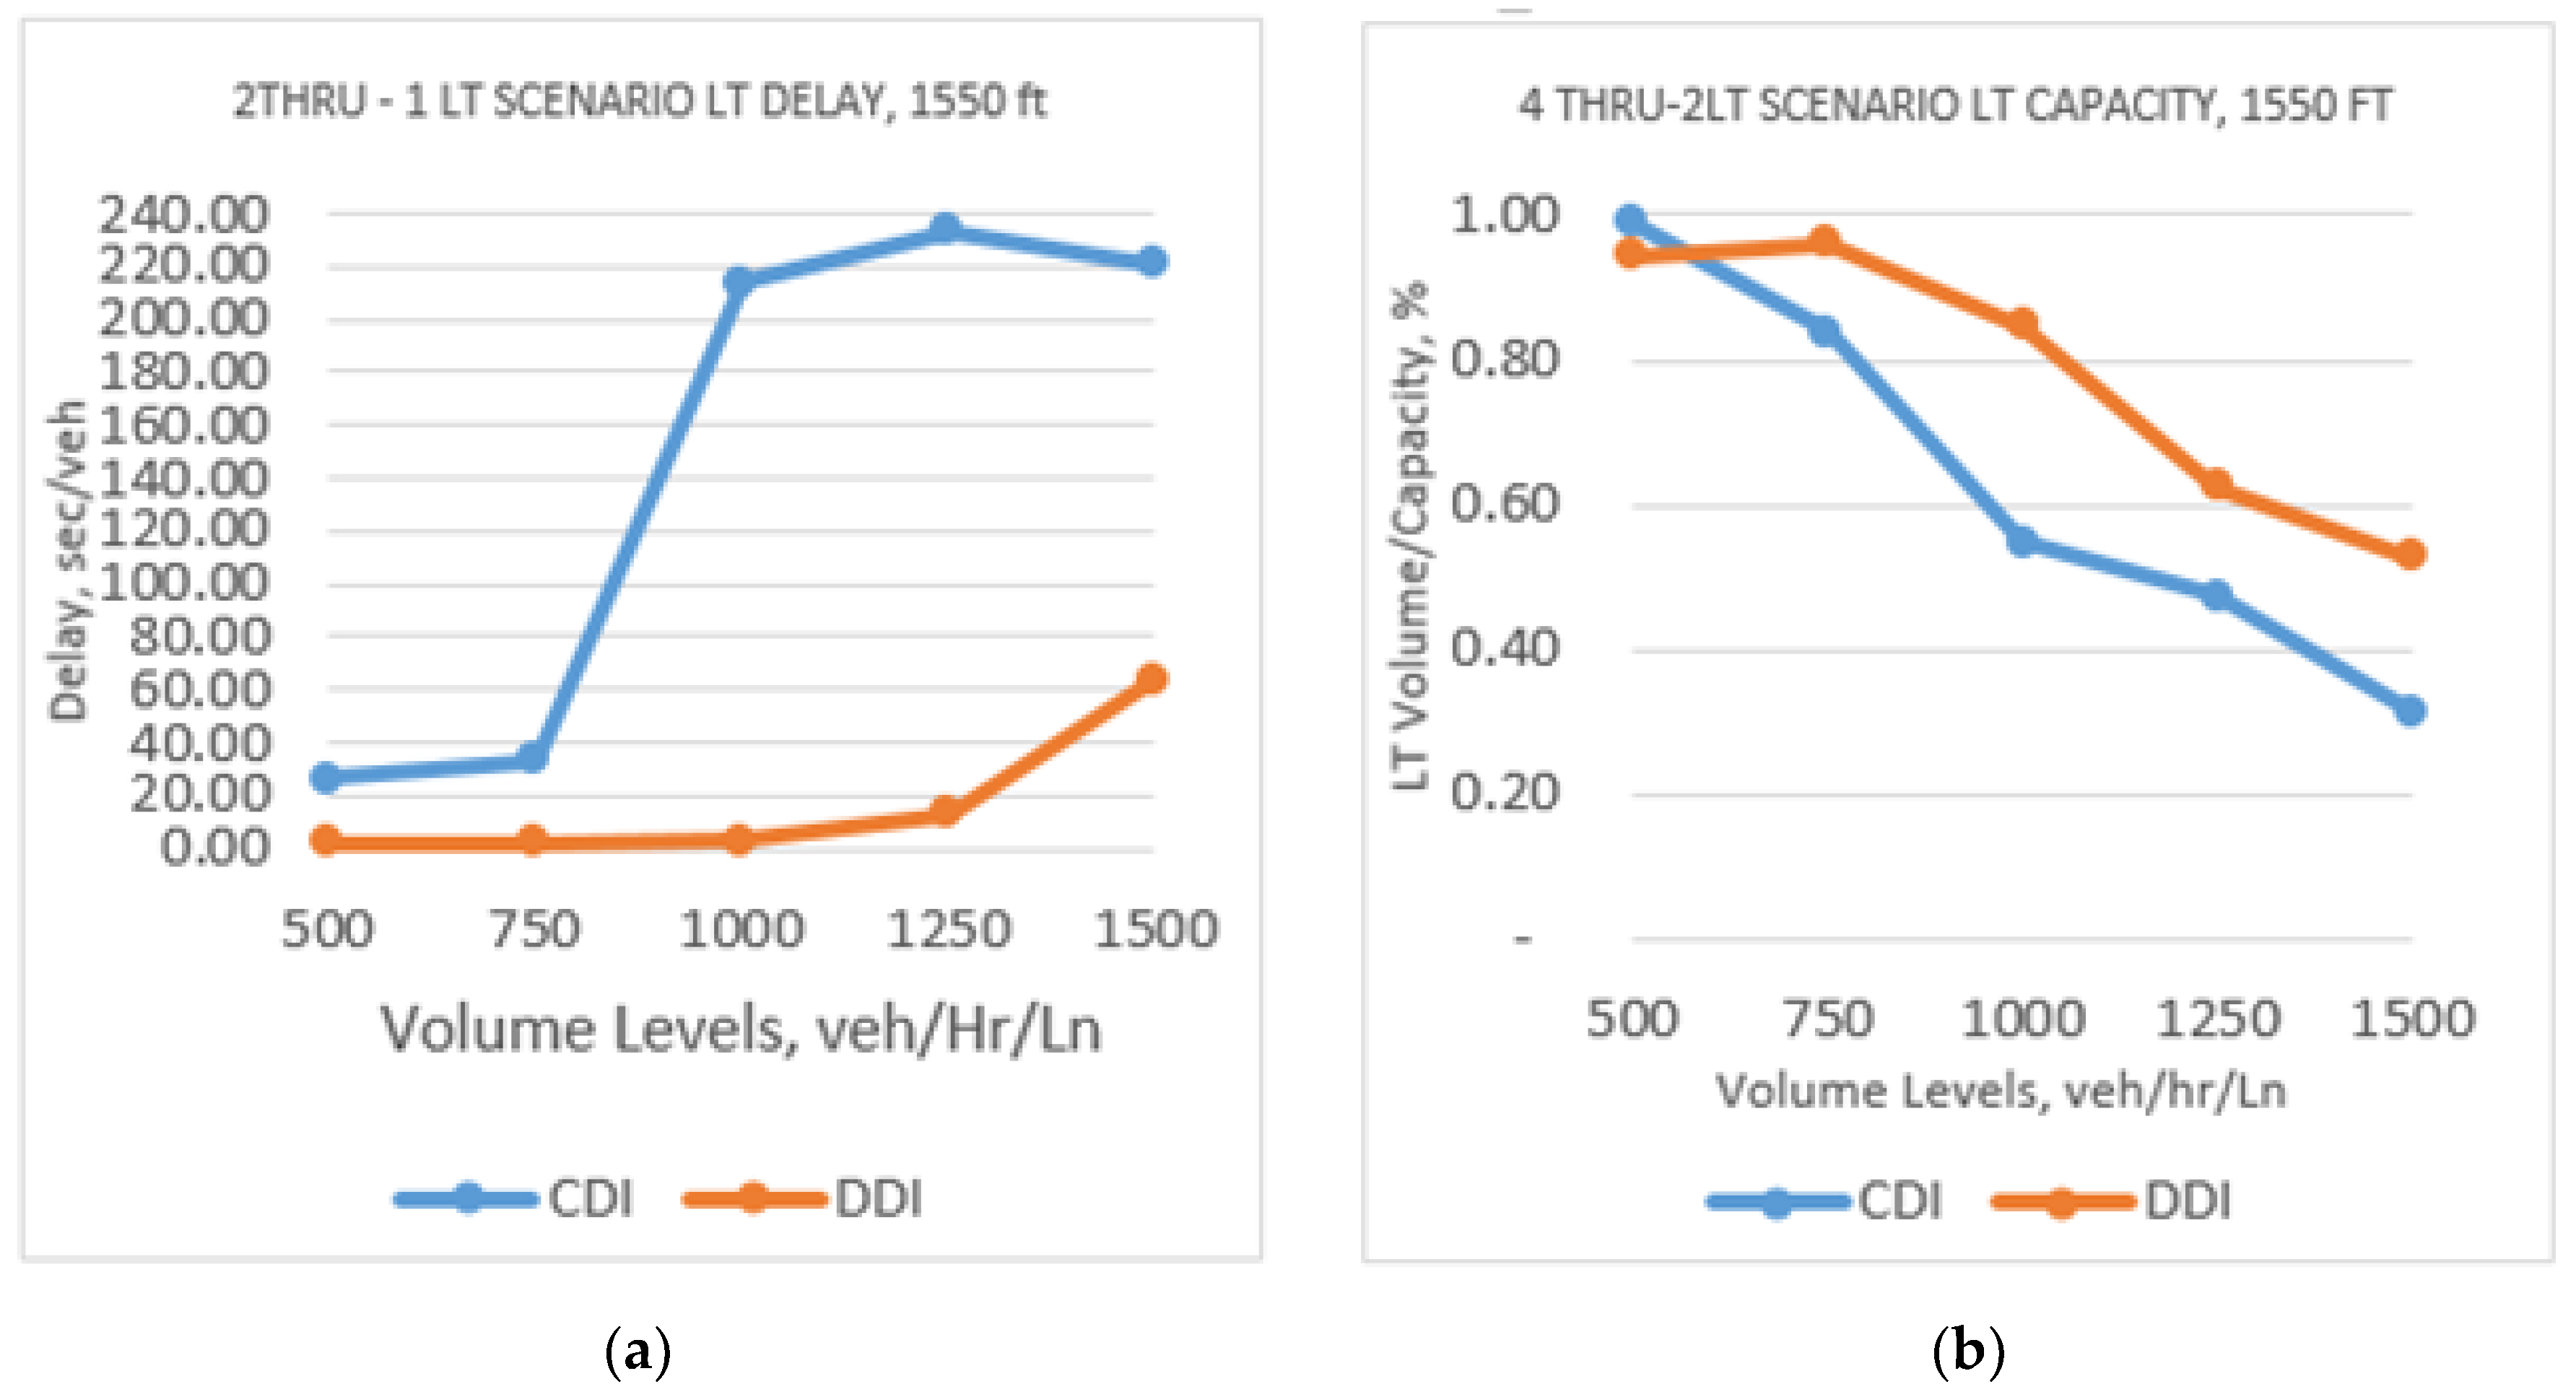
The analysis of the scenarios for Group 3, having the crossover distance of 1550 ft under different traffic volume levels and number of lanes, showed results similar to the other two groups in terms of left-turn delay and capacity (see Figure 6a,b). The comparison of Figure 4a with Figure 6a reveals an interesting finding on the impact of the number of through lanes on traffic delay (sec per vehicle). For 1500 vehicles/h-lane, the traffic delay increased from 20 s/veh (with three through lanes, refer to Figure 4a) to 60 s/veh (with two 2 through lanes, refer to Figure 6a).

Figure 6.
Performance of LT Capacity for DDI vs. CDI for Different Scenarios, (a) 2 THRU—1 LT Scenario LT capacity, 1550 ft, (b) 4 THRU—2 LT Scenario LT capacity, 1550 ft.
However, in terms of left-turn delay, the DDI design outperformed the CDI for all levels of traffic volume and crossover distances with superiority more evident at higher traffic volumes. The crossing point occurred at the 750 volume level for one left turn lane (see Figure 4b) and the threshold dropped to 600 vehicles/h-lane as the number of left turn lanes increased to two (see Figure 6b). For the scenarios of two left lanes, the volume and capacity percentage improves from 0.8 (Figure 5b) to 0.6 (Figure 6b) for 1250 veh/h-lane with an increase in the number of through lanes from three to four.
The crossing point for the two left and two, three, and four through lanes crossed around 500 to 600 vehicle levels due to the increase in the left turn volume. The results also shows that increasing the number of left turn lanes reduced the CDI left turn performance dramatically. At the low volume level, the CDI and DDI performed the same and at some of the scenarios the CDI performed better than the DDI.
In addition to the improved operational performance of DDI for accommodating high traffic volumes, the associated environmental benefits are also achieved. As the DDI design considerably reduces the left turning traffic that stops in case of CDI, the vehicle noise generated because of braking followed by accelerating considerably reduces as well. This phenomenon is more pronounced in the case of 1-left lane scenarios (refer to Figure 4b and Figure 6a), where the traffic yields to merge the interchange or diverge to leave the interchange without being stopped. Likewise, the DDI design reduces vehicular emissions with efficient operations.
4. Discussion
The aim of the presented study was to have better understanding of the DDI and the different factors that affect the signalized interchange performance due to increased left-turn traffic volume. The main goal was to assess the need and justification to redesign an (a sustainable) interchange to improve its efficiency. The experiment was specifically designed to evaluate the operational performance of the new design under different factors and detect the threshold to switch from the CDI to the innovative DDI design. However, it should be noted that other factors need to be taken into account when considering the DDI design such right-of-way, benefit-to-cost ratio, accessibility, pedestrian and bicycle Interaction. For example, the previous studies have shown that the DDIs have a high benefit to cost ratio when compared to a typical interchange designs. The DDIs average construction cost ranged between 14 and 22 million dollars while a typical CDI costs over USD 20 million [29].
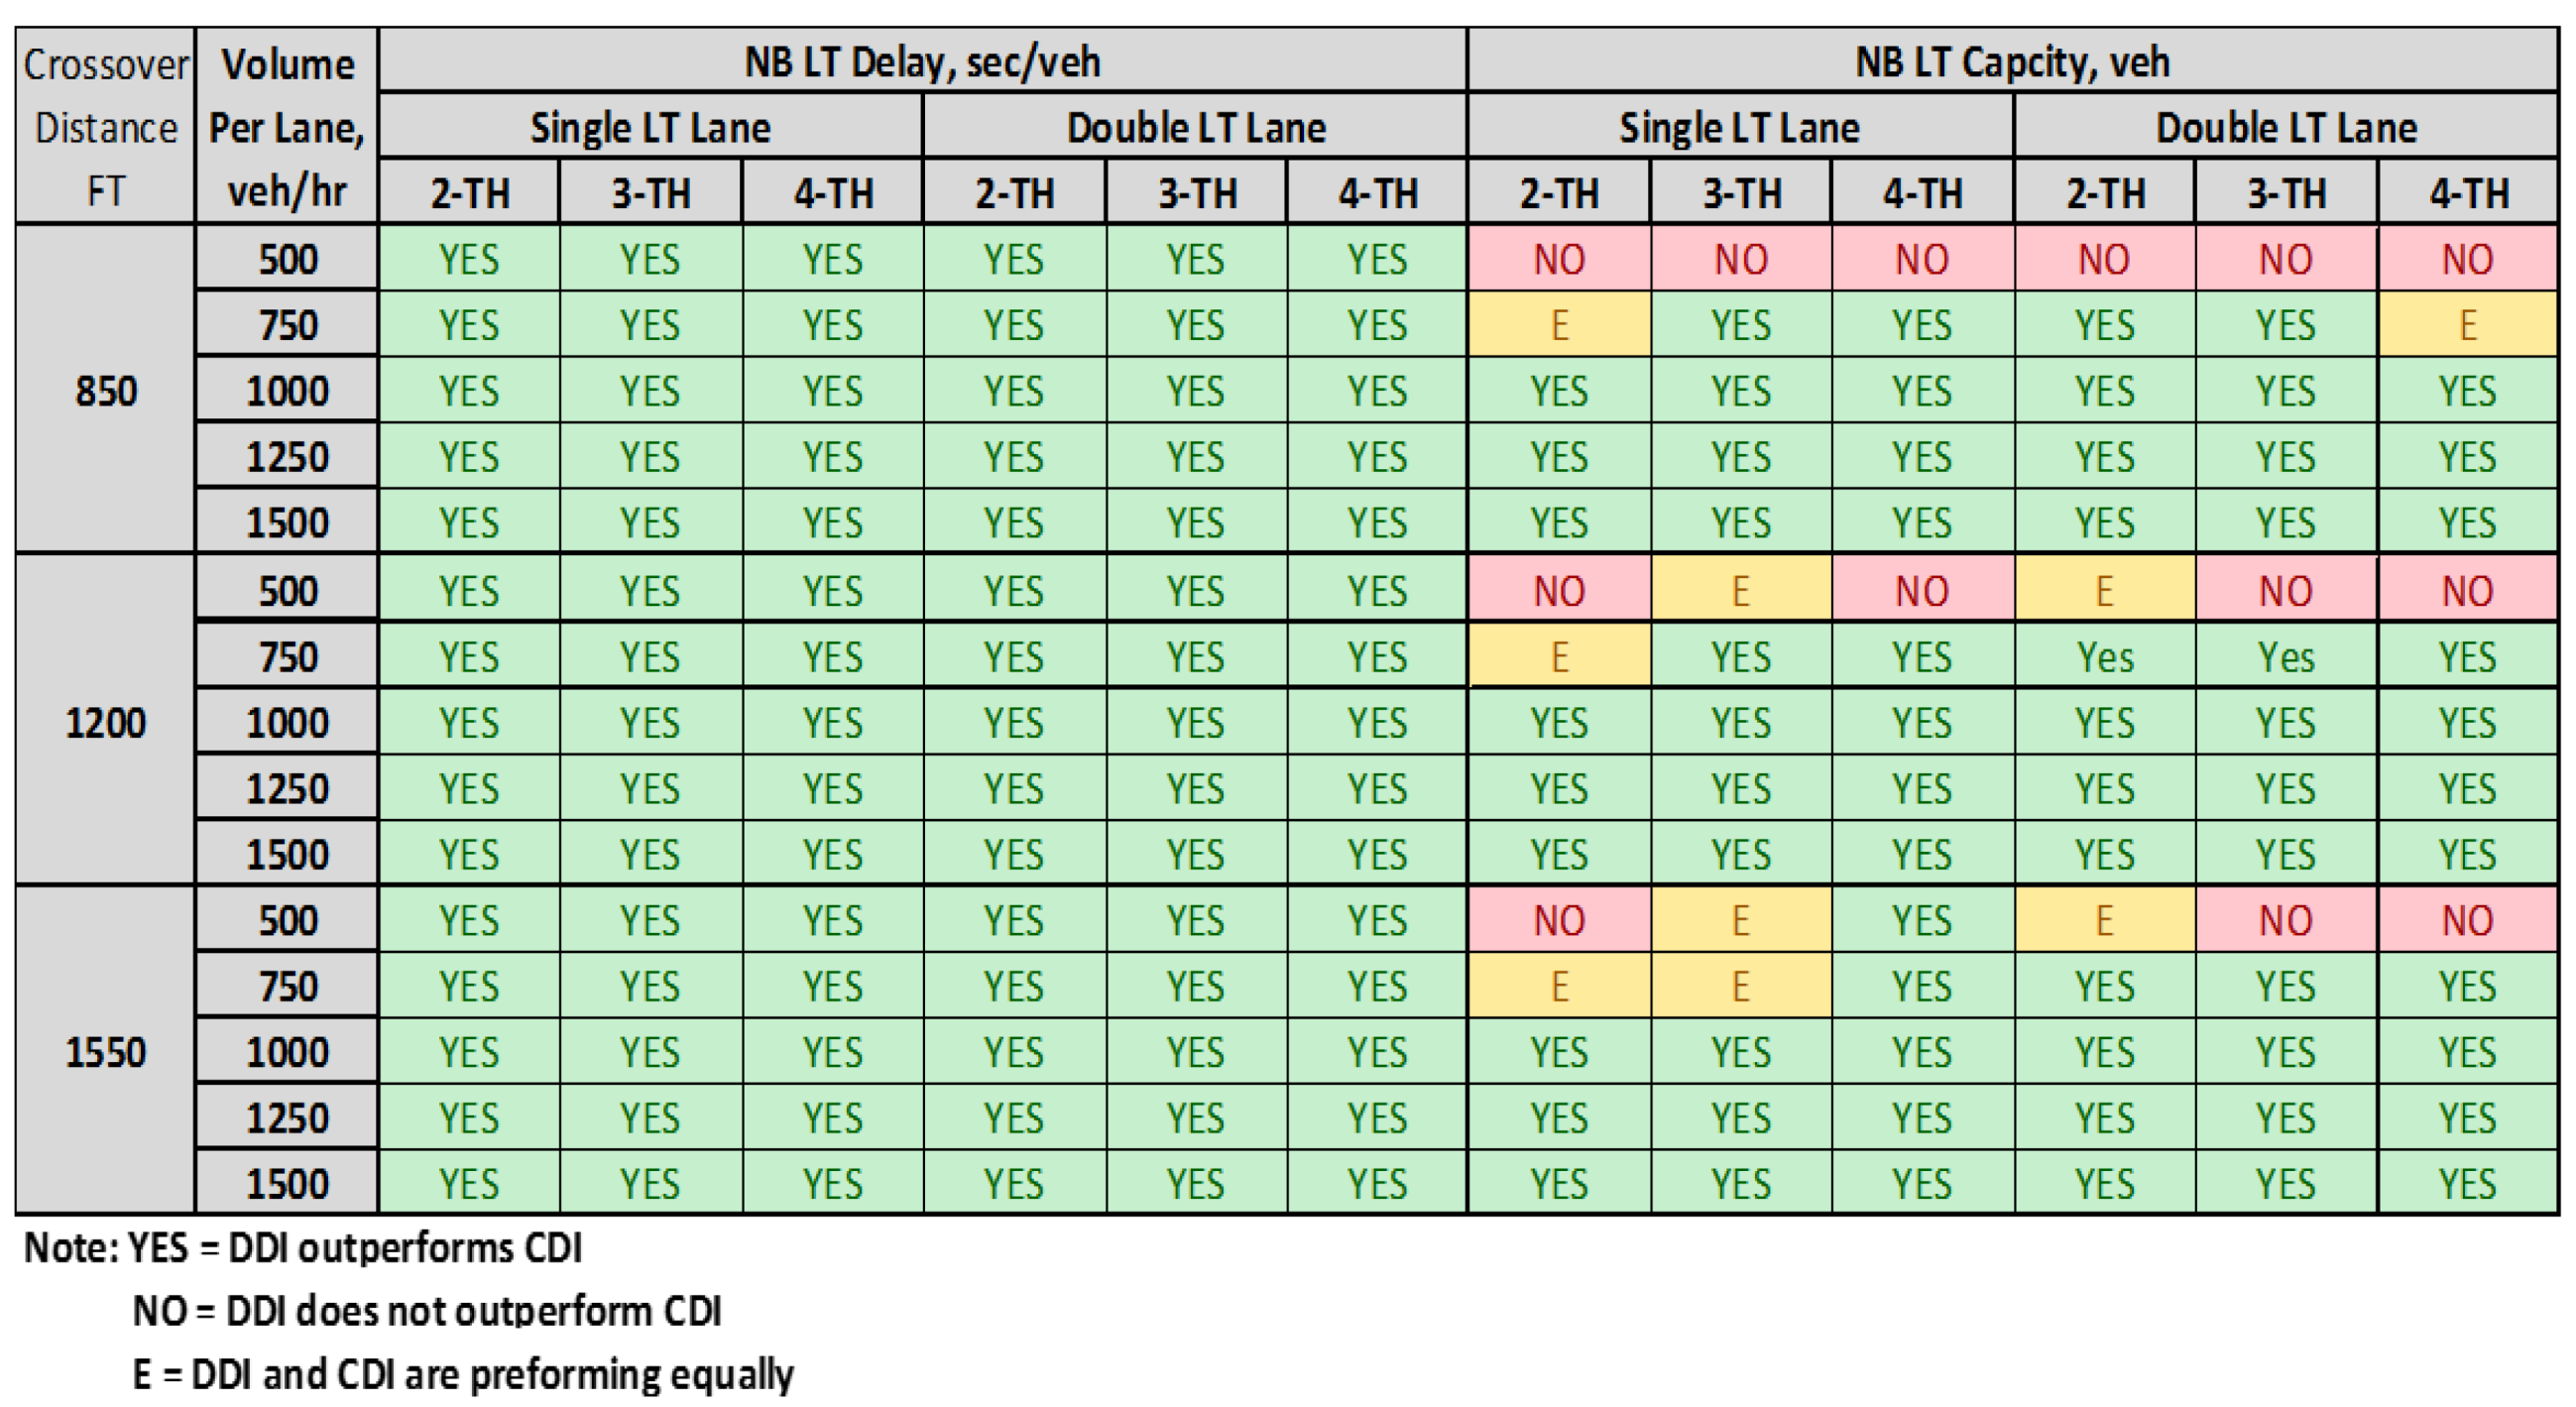
Signal timing optimization is one of the most important factors affecting the performance of an interchange. Several signal plans were optimized for both the designs. A 60 s cycle length was found as the optimal cycle length for the DDI design with two phases and a 90 s cycle length with three phases was found as the optimal cycle length for the CDI design. Five driving behavior parameters were identified by the literature that have a significant effect on the models [19]. A sensitivity analysis was performed to identify the optimal set of values for these five parameters (CC0, CC1, CC2, CC7, and CC8) and three parameters, CC0, CC1 and CC2, had the most influential effect on the design, and the other two had their default values. The left-turn delays in all the scenarios did not show any cross point between the CDI and DDI, but it agreed with the literature that the DDI has a better performance than the CDI (see Table 3) [30].
Table 3.
Summary of the DDI Results obtained from VISSIM 8.0.
All the left-turn capacity percentages showed the crossing point between the CDI and DDI, and it was located between the 500 to 750 vehicles per hour per lane. As the number of through lane parameter is increased, the left-turn delay increases and the efficiency decreases for both designs, but the CDI is more affected, while the DDI is slightly affected. When the distance between the two crossovers is increased, the delay for the DDI is increased but it has no effect on the throughput. The analysis showed that the DDI should not be used with locations experiencing low left-turn demand which supports the previous studies’ findings (see Table 3).
Studies also showed that the DDI is a more sustainable design with improved operation and safety performance, which is why the implementation of this innovative design is increasing in the U.S. [27,30]. Many of these studies evaluated the new design under different MOEs. However, designing a simulation-based experiment to find the threshold to switch from the CDI design to the DDI design for professionals and decision makers is more practical and beneficial. The experiment examined the potential factors, the number of left-turn lanes, number of through lanes, crossover distance, and level of volumes. The left-turn delay and capacity were used as the main MOEs to detect the crossing point between the two designs. The cross point could not be allocated by using the delay, due to the fact that the DDI outperformed the CDI in all scenarios. The left-turn capacity seemed to be the most reliable MOE to identify the cross point and it was found to be between the 500 to 750 vehicle per hour/lane level. In some scenarios, the CDI has better capacity at the low volume level; however, as the level of volume per lane increased, the DDI’s throughput increased by 20–35% and outperformed the CDI.
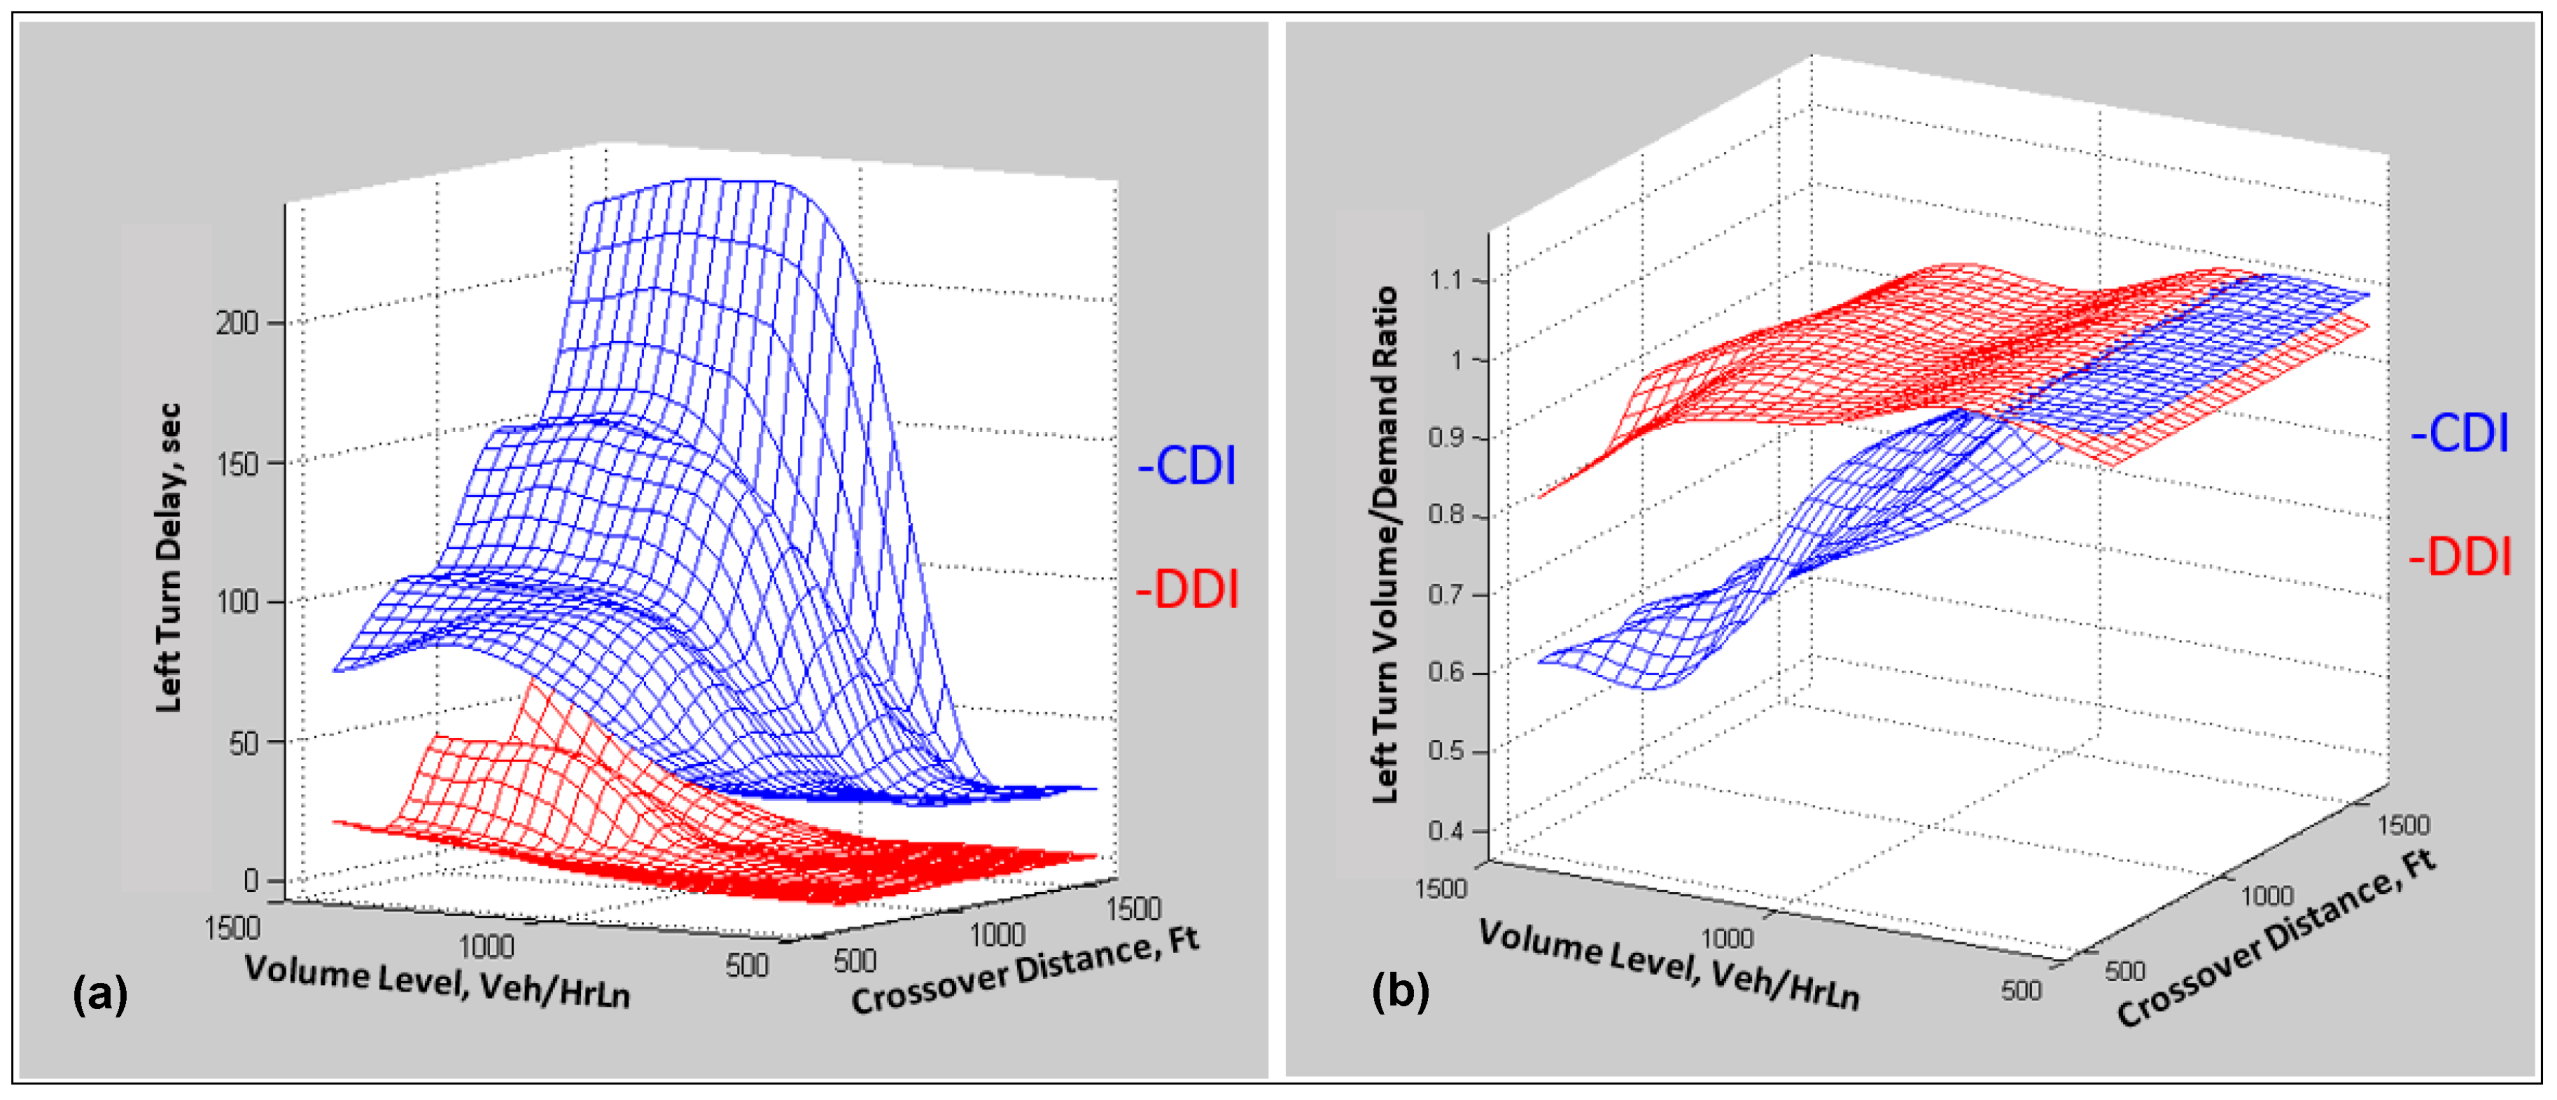
The surface plots in Figure 7 displays the 3D views for two variables’ surfaces at a time, crossover distance and volume level, and the corresponding response variable surface, whether delay or volume to demand ratio. The surface plot shows that the crossover distance parameter did not affect the left turn capacity significantly, especially for the DDI. However, there is a slight improvement in the CDI left turn capacity as the distance increases. On the other hand, the spacing distance increased the left-turn delay for DDI and CDI but it affected the CDI more. Figure 7 shows that, overall, crossover distances between 700 and 1200 provided a lower delay and higher capacity. For DDI, Figure 7a clearly show a significant reduction in left turn delay time while Figure 7b shows a noticeable increase in the ratio between left turn volume and demand. These results manifest the improvements in operational and safety performance of the interchange using DDI design.
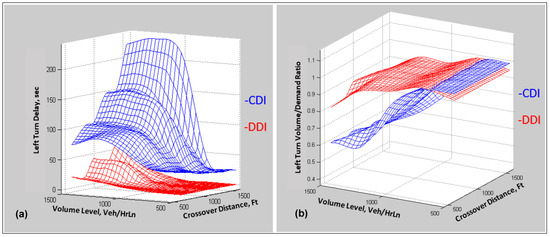
Figure 7.
3D surface views for crossover distance and volume level and corresponding repose to, (a) Left-turn delay, and (b) Ratio between left turn volume and demand.
A lower delay period will not only save the user time and associated fuel cost (i.e., socio-economic benefits), it will also reduce the vehicular emissions (i.e., environmental impact), particularly carbon monoxide (CO) and hydrocarbons (HC), which are produced at a much higher rate during idling in comparison to the cruising condition [31]. Past studies compared the pre- and post-installation conditions for DDI at seven locations in the USA based on several years of traffic data analysis [32,33]. The main findings were, (i) a 33% reduction in the number of crashes for DDI, and (ii) around 60% reduction in the severity of the crashes, i.e., injuries and fatalities. The results of the present study provide useful insight into the operational and safety performance of the more sustainable redesign of DDI.
5. Conclusions and Recommendations
The present research aimed to enhance the understanding of the DDI and the different factors that affect the signalized interchange performance due to increased left-turn traffic volume. The primary objective was to assess the need and justification to redesign a sustainable interchange with improved operational and safety performance.
VISSIM (version 8.0) was used for the evaluation of the two locations proposed by the Federal Highway Administration (FHWA) proposed two locations in Atlanta, GA. For model calibration and verification, the replication number was found to be helpful to improve the accuracy of the designed models and to minimize the error between the field data and model outputs. Seventy-five minutes was found to be enough simulation time to run the model, with the first 15 min ensuring the reliability of the model.
Signal timing optimization is one of the most important factors affecting the performance of an interchange. In the absence of the signal timing for the studied location, several signal plans can be optimized manually for both the designs. In the present study, a 60 s cycle length was found as the optimal cycle length for the DDI design with two phases and a 90 s cycle length with three phases was found as the optimal cycle length for the CDI design.
The number of left-turn lanes, number of through lanes, crossover distance, and level of volumes are the potential factors affecting the operational and safety efficiency of an interchange. The DDI design significantly reduce the left turn delay time and increase the ratio between left turn volume and demand. The socioeconomic benefits of DDI can be achieved with smaller delays that can save the user time and associated fuel cost. A significant reduction in the number of crashes has also been proven with the sustainable redesign of DDI. Environmental impacts are accordingly reduced with lowering vehicular emissions, such as CO and HC. Hence, DDI is a sustainable interchange design surpassing CID in all the three dimensions of sustainability.
The results of this research were also used to develop a statistical model and incorporated into a decision support tool for planners and engineers to determine the operational performance of a DDI compared to a conventional CDI based on the studied parameters such as traffic volume, number of lanes, and some of the geometric designs. However, there are other parameters to be considered such as ROW, benefit to cost ratio, pedestrian and bicycle safety. Safety evaluation of the different designs and geometric configurations of the DDI such as crossover spacing distance and the adjacent intersections can be included in future research. Moreover, we recommend future work to evaluate the impact of changing traffic volumes with time during a day on the DDI performance.
The present study provides evidence for improving the operational and safety performance of congested interchanges using the more sustainable redesign of DDI. The findings of the study will help the concerned agencies and authorities in selecting an appropriate crossover distance to reduce the traffic delays and improve the safety conditions at the interchanges in the USA and elsewhere.
Author Contributions
M.A. developed the methodology, collected and processed traffic data, performed simulations, and prepared the manuscript. H.A.-S. and E.R. were involved in the concept development, supported in data collection and other required resources, supervised the modeling and simulation process, and proofread the manuscript. H.H. contributed in the part of the manuscript related to sustainability, traffic safety, environmental impacts, and helped in paper writing. All authors have read and agreed to the published version of the manuscript.
Funding
This research was funded by Florida Department of Transportation (FDOT) grant number BDV24 TWO 977-09.
Acknowledgments
This paper is a part of a completed research project funded by Florida Department of Transportation (FDOT). A part of this paper was presented in Transportation Research Board (TRB) annual meeting 2018. The first author highly acknowledges the financial support, obtained at Qassim University, which was provided by the Saudi Cultural Bureau in United States under the Higher Education Scholarship Program, Kingdom of Saudi Arabia.
Conflicts of Interest
The authors declare no conflict of interest.
References
- FHA. Diverging Diamond Interchange, An Innovative, Proven Solution for Improving Safety and Mobility at Interchanges. Available online: https://safety.fhwa.dot.gov/intersection/innovative/crossover/brochures/ddi/ (accessed on 15 May 2020).
- Humble, P.L.; Furtado, G. Innovation in Interchange Design—Golden Hill to West. In Proceedings of the Paper prepared for presentation at the 2010—Adjusting to New Realities Conference of the 2010 Annual Conference of the Transportation Association of Canada, Halifax, NS, Canada, 26–29 September 2010. [Google Scholar]
- OCED. Development Intermodal Freight Transport Advisory Group. Intermodal Freight Transport: Institutional Aspects; OECD Publishing: Paris, France, 2001. [Google Scholar]
- El Esawey, M.; Sayed, T. Analysis of unconventional arterial intersection designs (UAIDs): State-of-the-art methodologies and future research directions. Transp. A Transp. Sci. 2013, 9, 860–895. [Google Scholar] [CrossRef]
- Amit, D.; Edara, P.; Bared, J. Performance analysis of parallel flow intersection and displaced left-turn intersection designs. Transp. Res. Rec. J. Transp. Res. Board 2010, 2171, 33–43. [Google Scholar]
- Seonyeong, C.; Rahwanji, S.; Chang, G. Comparison of three unconventional arterial intersection designs: Continuous flow intersection, parallel flow intersection, and upstream signalized crossover. In Proceedings of the 11th International IEEE Conference on Intelligent Transportation System, Beijing, China, 12–15 October 2008. [Google Scholar]
- Reuben, G.; Mier, F.; Friedman, J. Continuous Flow Intersections. Inst. Transp. Eng. (ITE) J. 1994, 64, 35–42. [Google Scholar]
- Tanackov, I.; Deretić, N.; Bogdanović, V.; Ruškić, N.; Jović, S. Safety time in critical gap of left turn manoeuvre from priority approach at TWSC unsignalized intersections. Phys. A Stat. Mech. Its Appl. 2018, 5051, 1196–1211. [Google Scholar] [CrossRef]
- Meuleners, L.B.; Roberts, P. Diverging diamond interchanges: A driving simulator study. Transp. Res. Part. F Traffic Psychol. Behav. 2020, 71, 250–258. [Google Scholar] [CrossRef]
- Molan, A.M.; Hummer, J.E.; Ksaibati, K. Modeling safety performance of the new super DDI design in terms of vehicular traffic and pedestrian. Accid. Anal. Prev. 2019, 127, 198–209. [Google Scholar] [CrossRef] [PubMed]
- Hunter, M.; Guin, A.; Anderson, J.; Park, S.J. Operating performance of diverging diamond interchanges. Transp. Res. Rec. 2019, 2673, 801–812. [Google Scholar] [CrossRef]
- Jarvis, A.; Sayed, T.; el Esawey, M. Operational performance comparison of four unconventional intersection designs using micro-simulation. J. Adv. Transp. 2013, 47, 536–552. [Google Scholar]
- Gilbert, C. New interchange and intersection designs: The synchronized split-phasing intersection and the diverging diamond interchange. In Proceedings of the 2nd Urban Street Symposium: Uptown, Downtown, or Small Town: Designing Urban Streets That Work, Anaheim, CA, USA, 28–30 July 2003. [Google Scholar]
- Utah Department of Transportation. “A UDOT Guide to Diverging Diamond Interchanges” Report. Available online: https://www.udot.utah.gov/main/uconowner.gf?n=14769524027177477 (accessed on 26 April 2016).
- Bastian, S.; Salamati, K.; Hummer, J. Calibration and field validation of four double-crossover diamond interchanges in VISSIM microsimulation. Transp. Res. Rec. J. Transp. Res. Board 2014, 2404, 49–58. [Google Scholar]
- Schroeder, B.; Cunningham, C.; Ray, B.; Daleiden, A.; Jenior, P.; Knudsen, J. Diverging Diamond Interchange: Informational Guide; No. FHWA-SA-14-067; US Department of Transportation: Washington, DC, USA, 2014. [Google Scholar]
- Siddharth, S.; Chatterjee, I. Performance evaluation of the diverging diamond interchange in comparison with the conventional diamond interchange. In Proceedings of the Transportation Scholars Conference, Iowa State University, Ames, IA, USA, 9 November 2007. [Google Scholar]
- Siromaskul, S.; Speth, S.B. A comparative analysis of diverging diamond interchange operations. In Proceedings of the ITE 2008 Annual Meeting and Exhibit Institute of Transportation Engineers (ITE), Anaheim, CA, USA, 17–20 August 2008. [Google Scholar]
- Russo, C.S. The Calibration and Verification of Simulation Models for Toll Plazas. Ph.D. Thesis, Department of civil and environmental engineering, University Of Central Florida, Orlando, FL, USA, 2008. [Google Scholar]
- Xianfeng, Y.; Chang, G.; Rahwanji, S. Development of a signal optimization model for diverging diamond interchange. J. Transp. Eng. 2014, 140, 04014010. [Google Scholar]
- Hu, P.; Tian, Z.Z.; Xu, H.; Andalibian, R. An Advanced Signal Phasing Scheme for Diverging Diamond Interchanges. In Proceedings of the 93rd Annual Meeting of the Transportation Research Board, Washington, DC, USA, 12–16 January 2014. [Google Scholar]
- Hughes, W.; Jagannathan, R.; Sengupta, D.; Hummer, J. Hummer Alternative Intersections/Interchanges: Informational Report (AIIR); Publication No. FHWAHRT-09-060; Turner Fairbank Highway Research Center, Federal Highway Administration, U.S. Department of Transportation: McLean, VA, USA, 2010. [Google Scholar]
- Day Christopher, M.; Bullock, D.M. Cycle-Length Strategies for a Diverging Diamond Interchange in a Coordinated Arterial. J. Transp. Eng. 2016, 142, 04016067. [Google Scholar]
- Pruthvi, M.; Vortisch, P.; Mathew, T.V. Methodology for the Calibration of VISSIM in Mixed Traffic. In Proceedings of the 92nd Annual Meeting of the Transportation Research Board, Washington, DC, USA, 13 January 2013. [Google Scholar]
- Lownes, N.E.; Machemehl, R.B. VISSIM: A multi-parameter sensitivity analysis. In Proceedings of the 38th conference on winter simulation, Winter Simulation Conference, Monterey, CA, USA, 6 December 2006. [Google Scholar]
- Toledo, T.; Koutsopoulos, H.N.; . Davol, A.; Ben-Akiva, M.; Burghout, W.; Andréasson, I.; Johansson, T.; Lundin, C. Calibration and validation of microscopic traffic simulation tools: Stockholm case study. Transp. Res. Rec. J. Transp. Res. Board 2003, 1831, 65–75. [Google Scholar] [CrossRef]
- Tarko Andrew, P.; Inerowicz, M.; Lang, B. Safety and Operational Impacts of Alternative Intersections; Joint Transportation Research Program Publication No. FHWA/IN/JTRP-2008/23; Purdue University: West Lafayette, IN, USA, 2008. [Google Scholar]
- Al-Kaisy, A.F.; Stewart, J.A. New approach for developing warrants of protected left-turn phase at signalized intersections. Transp. Res. Part. A Policy Pract. 2001, 35, 561–574. [Google Scholar] [CrossRef]
- Abou-Senna, H.; Radwan, E.; Tabares, S.; Wu, J.; Chalise, S. Evaluating Transportation Systems Management & Operations (TSM&O) Benefits to Alternative Intersection Treatments. In Florida Department of Transportation Final Report; No. BDV24-977-09; Dept. of Transportation. Research Center: Tallahassee, FL, USA, 2015. [Google Scholar]
- Chilukuri, V.; Siromaskul, S.; Trueblood, M.; Ryan, T. Diverging Diamond Interchange: Performance Evaluation (I-44 and Route 13); No. OR11-012.; Dept. of Transportation: Jefferson City, MO, USA, 2011. [Google Scholar]
- Vesilind, P.A.; Peirce, J.J.; Weiner, R.F. Effect of Engine Operation on Automotive Exhaust Characteristics, Shown as Fraction of Idling Emissions Component CO HC NO, Environmental Pollution and Control; Elsevier: New York, USA, 2013; p. 311. [Google Scholar]
- Hummer, J.E.; Cunningham, C.M.; Srinivasan, R.; Warchol, S.; Claros, B.; Edara, P.; Sun, C. Safety evaluation of seven of the earliest diverging diamond interchanges installed in the United States. Transp. Res. Rec. 2016, 2583, 25–33. [Google Scholar] [CrossRef]
- Claros, B.; Edara, P.; Sun, C. When driving on the left side is safe: Safety of the diverging diamond interchange ramp terminals. Accid. Anal. Prev. 2017, 100, 133–142. [Google Scholar] [CrossRef] [PubMed]

© 2020 by the authors. Licensee MDPI, Basel, Switzerland. This article is an open access article distributed under the terms and conditions of the Creative Commons Attribution (CC BY) license (http://creativecommons.org/licenses/by/4.0/).