Abstract
Loading bays are public spaces reserved for the operation of freight vehicles, and it is well known that there are significant problems concerning their use due to non-compliance with existing regulations. Unlawful use of loading bays leads to double parking, or to parking on the pavement or in restricted areas. This article has two objectives: Firstly, the study and analysis of the use of loading bays (type of demand, parking duration, illegal use, etc.), as well as their use according to their morphology. Secondly, the quantitative assessment of the influence of illegal use with regard to the efficient use of public urban space. Illegal use is quantitatively assessed by calculating the number of loading bays that are used inappropriately and the surface area (m2) of public space used incorrectly. In the analysis carried out in the city of Santander (Spain), it can be observed that the urban morphology of loading zones influences their use: The greater the capacity of the loading zone, the less efficient is its use. Moreover, it is observed that the degree of illegal use within loading zones is very high and that illegally excessive parking durations have a greater impact on the use of the ground space than vehicle type.
1. Introduction
The effects of urban freight transport on city mobility and congestion are significant, giving rise to such additional concerns as increases in air and noise pollution and accidents, among other things. Numerous research papers have attempted to minimize the negative impact this has, not only on traffic and congestion, but also on urban space consumption [1,2,3,4]. Thus, several measures have been proposed aimed at regulating freight vehicle access to cities [5,6], optimizing delivery routes in real time [7] through urban consolidation centers [8], regulating freight vehicle off-hour deliveries [9,10,11] and providing logistics infrastructure and facilities [12,13]. De Marco et al. [14] analyzed a dataset of 70 European cities that have been piloting or rolling out these and other measures, with the objective of providing an updated indication of the status of those measures. In this context, most urban areas reserve part of their public space to facilitate the loading and unloading of materials and/or goods, and these are called loading zones (L/U zones). Each loading zone is composed of a finite number of loading bays (LBs). In other words, the number of loading bays of one loading zone is equal to its capacity. The types of vehicle that may use loading zones in cities are determined by local regulations. The characteristics that such vehicles have may include vehicle weight, for example, in some Spanish cities [15], vehicle size or the levels of pollution emitted by the vehicle, as in some Italian cities [16]. There are also time restrictions on urban loading bays that limit the time window in which their use is permitted, as well as the maximum time period during which a vehicle may be parked [15,16,17]. In order to optimize urban land consumption, several measures have been proposed, aimed at planning and managing loading zones [18,19]. One of these measures is based on a loading bay control system. This measure enable users to reserve a loading bay in advance to ensure that free space will be available when they arrive [20,21]. Furthermore, the public space available for parking in city centers is scarce, both for freight and passenger vehicles. As a consequence, a struggle emerges for their use among the public. One common issue in cities regarding loading bays is that loading bay supply is frequently smaller than transport operator demand [22,23]. This leads to the double parking of freight vehicles, which park illegally on the street [24] because there is not enough loading bay capacity or because the freight vehicle size does not fit in the available space. This results in congestion and increased emissions [25], highlighting the importance of studying the typology of freight vehicles [26].
The problem of parking incoming vehicles in loading bays is mathematically similar to the berth allocation problems of ships in seaports. In cargo ports, berth allocation and quay crane assignment problems have been researched by numerous researchers [27,28,29]. Mauri et al. [30] considered discrete and continuous models for the berth allocation problem (BAP) and proposed an adaptive large neighborhood search (ALNS) heuristic to solve it. The optimal solutions obtained using discrete models are found within lower computational times compared with continuous models. Iris and Lam [31] also address the stochastic variant of this problem. Other researchers investigated this problem using mixed integer non-linear programming [32,33] or by addressing the problem from an environmental point of view [34,35].
Several studies have focused on optimizing the number, size, and/or location of loading bays in cities [36]. Thus, Aiura and Taniguchi [37] determined the optimal location for loading bays by minimizing total costs, which comprised fixed and operational costs, as well as costs caused by delays, parking and waiting, both for freight vehicles and for passenger cars. Ezquerro et al. [38] developed a methodology for evaluating whether or not the number of existing delivery bays was optimal. They estimated the optimal number of delivery bays by applying a two-step methodology: In the first step, an initial estimation was generated using queueing theory. In the second step, a realistic number of delivery bays was obtained through discrete event simulation. Muñuzuri et al. [39] simulated various scenarios for the number and location of loading bays before identifying the scenario capable of improving the current service level. Another way of working on this problem is to match the available supply to the required demand by applying dynamic loading bay assignment models. In doing this, Letnik et al. [23] proposed two assignment models that depended on the premise that only the potential loading bay closest to the receiver is used (placed at an acceptable walking distance to the receiver) or by the use of the second best loading bay location (which is aimed at reducing the waiting time of vehicles before accessing loading bays). This dynamic approach has also been studied by Boussier et al. [40] and Comi et al. [20], among others.
Analysis, comprehension and review of the data collected is vital to any study performed concerning loading zones; they all contribute to the exploration of varied solutions and the efficient design and management of loading bays [41]. Throughout the completion of numerous research projects, many researchers have observed that the degree and/or type of the illegal use of loading bays is high. Cherrett et al. [42] reviewed 30 studies that had been completed in the United Kingdom and examined what effects deliveries and delivery vehicle characteristics had on the use of loading bays. They also studied the effects of the variety of deliveries made throughout the day, the week and the year. Furthermore, four of these studies examined whether loading/unloading activities were performed illegally (e.g., parking in an illegal place, such as at a bus stop or by double parking or exceeding the permitted time period), obtaining the result that illegal use varied from 20% in the Wallington (2005) and Regent Street (2007) studies, to 69% in the Ealing study (2004) and up to 86% in the Market Place study. In the city of Bologna in 2010, data collected in a study indicated that 58% of loading bays were illegally occupied by unauthorized vehicles during the data collection period [34]. Alho and e Silva [43] evaluated the service level of loading bays as well as the illegal parking rates in Lisbon and observed that non-freight vehicles accounted for 80% of demand.
As stated before, one of the consequences of the illegal use of loading bays is that, due to the lack of available space, freight vehicles opt to double park or to park on the pavement or in restricted areas, thereby using urban space inappropriately. Disturbances in city traffic flow and pedestrian mobility are a result of this incorrect use [37]. Alho et al. [44] performed a dynamic simulation with multiple configurations in loading zones, and achieved the restriction of loading zone use to authorized vehicles only to various degrees, so as to be able to compare the resulting disturbances to traffic flow.
Most of the above analyzed research focused on planning loading zone location, design or capacity and on analyzing the effects of illegal loading zone use on traffic. However, as far as the authors know, there is a lack of studies analyzing its effect on the use of public space (efficient use of loading zones implies an efficient use of public space) and how the different compliance rates to usage regulations may affect this efficiency.
For this reason, this article has two objectives: First, to analyze loading zone use in an urban context through the exhaustive analysis of representative loading zones based on the Santander (Spain) city center. The indicators analyzed include: Arrival time, parking duration, vehicle type and parking location, among others. The use of these loading zones is thereby studied according to their morphology in order to understand the degree and type of illegal use taking place, among other data. Based on this analysis, the second objective of this article is to quantitatively assess the influence of such illegal actions on the use of urban public space. To this end, the number of loading bays and the surface area of incorrectly used urban public space (in m2) is obtained for multiple scenarios (different degrees and types of illegal use).
The introduction and state of the art have been presented in this section. Section 2 describes the methodology developed. The data collected and the analysis and comprehension of loading zone usage is carried out in Section 3. With this analysis, the quantitative assessment of the influence of illegal use is developed in Section 4. Finally, the main conclusions are set out in Section 5.
2. Methodology and Case Study Description
The methodology proposed is based on an exhaustive analysis of the data collected on the vehicles using the studied loading zones. Both the characteristics of the loading zones themselves and their use, meaning who uses them and how they are used, are analyzed, differentiating between their legal and illegal use. A discrete event modeling approach is then applied to simulate differing private user and freight vehicle compliance. These data are later applied in order to quantitatively assess the consequences of incorrect loading zone use, both legal and illegal, and to determine the degree of influence exerted by each non-compliance with existing regulations (Figure 1).
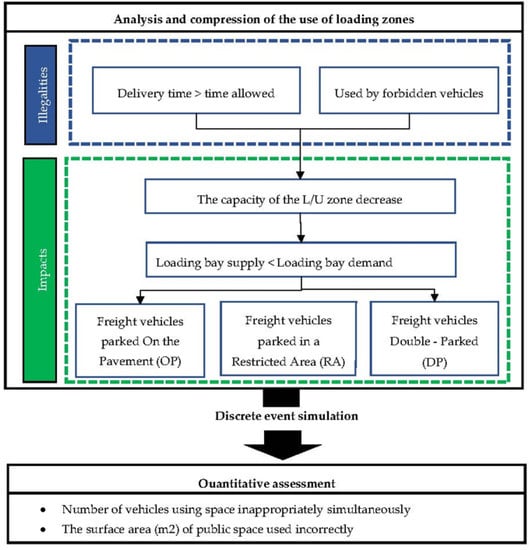
Figure 1.
Diagram of the methodology developed.
As loading zone use may vary not only across cities and/or countries, but also within a city according to the loading zone type, quantity, location, etc., a representative sample of the use of loading zones in the area to be analyzed is essential. Firstly, it should be verified that both freight and passenger vehicles have parking problems in the area. Secondly, data from a representative sample of loading zones should be collected. Studied areas should have different characteristics, both within the loading zone itself and concerning the street where it is located.
The loading zones of the Santander city center were analyzed following this approach. This area, like most urban centers, has significant parking problems [45]. The main land use is commercial and retail use, as well as areas used by restaurants, hotels and offices, and, to a lesser extent, residential and educational use. The Santander city center has both pedestrian and traffic streets. There are 48 loading zones, all of them are curb-side parking spots, i.e., the parking is parallel to the pavement. The 48 loading zones were grouped according the following attributes:
- Location and size of establishments obtained from the Santander Town Hall.
- Location, capacity and regulation of the loading zones, obtained from the Santander City Council and field data.
- Relative location on the street (nearside/farside traffic lights, pedestrian crossings, etc.).
- Existence and characteristics of on-street parking, pavement and physical obstacles.
- Characteristics of the Santander transportation network, e.g., types of streets and intersections, provided by the Santander City Council and field data.
Four groups were built according to the attributes described above. Then, 652 surveys were done on the loading zones of the center of Santander. The proposal was to collect general data about the uses of the loading zones and their surroundings, not only from the surveys given to carriers, but also from the observations collected while the surveys were done. The general collected data confirmed that the loading zones were well classified by the four groups. Furthermore, it indicated what the representative loading zone of each group was based on the behavior of the carriers and the vehicles forbidden in the loading zones (e.g., cars).
Therefore, four loading zones underwent in-depth analysis within this study because they had different characteristics encompassing all of the variety existing in the city center. Information on these loading zones, which covers 19 loading bays, is summarized in Table 1. The locations of the analyzed loading zones are shown in Figure 2. Loading zones are identified throughout the article using the name of the street where they are found. Furthermore, their capacity is stated as “capacity”, understood as the number of loading bays in each loading zone.

Table 1.
Characteristics of the loading zones analyzed.
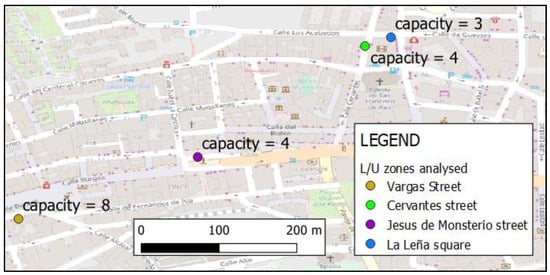
Figure 2.
Location and capacity of the loading zones analyzed.
The characteristics of both the loading zones and the streets where they are located is shown in the following table:
The use of loading bays is regulated by the Traffic Ordinances issued by the Santander City Council [15]. These ordinances establish the following regulations in the four loading zones studied:
- Type of freight vehicles permitted: Vehicles with a gross vehicle weight rating (GVWR) between 1.8–8 tons.
- The window of time reserved for the performance of loading operations: Between 7:00 a.m.–2:00 p.m. on business days.
- Authorized parking time limit: 30 min.
Finally, the data collection was carried out by:
- Recordings from seven business days (from Monday to Saturday) between 7:00 a.m.–2:00 p.m. in the four loading zones studied. They were undertaken with the aim of knowing how vehicles that use the loading bays behave, their types and usage habits.
- Six hundred and fifty-two surveys during a single day in 10 different loading zones, which covered 56 loading bays, in the center of Santander. These surveys were used to verify that the sample of the four loading zones was indeed a representative sample of the city center.
3. Analysis of Loading Bay Usage and Consequences of Illegal Usage
3.1. Vehicle Type and Arrival Rate
The records collected in both loading zones provided information on the type of vehicles that used these loading bays. Vehicles were classified by their characteristics exactly as shown in the following table (Table 2).
Table 2.
Characteristics of the vehicles that used the loading bays.
It was observed that the freight vehicles whose characteristics did not match the permitted span did not use the loading bays. No illegal use of this kind was observed. Conversely, cars did use the loading bays despite the fact that this was prohibited (Figure 3). It was observed that a large number of cars used the loading bays, at a rate reaching 49%, in the Jesus de Monasterio loading zone. This means that the number of available spaces for freight vehicles was reduced.
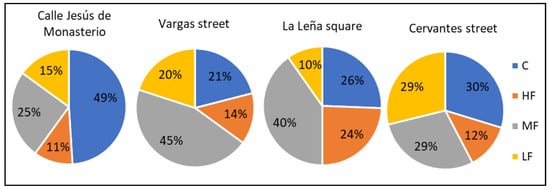
Figure 3.
Types of vehicles that use loading zones.
Regarding the arrival rate, it was therefore analyzed during the time period when loading bays were reserved for freight vehicles (7:00 a.m.–2:00 p.m.). The arrival of freight vehicles is shown in Figure 4, calculated as an average of seven business days. As can be seen, the arrival of freight vehicles was slightly reduced throughout the four loading zones during the earliest hours. In the La Leña Square and Cervantes Street loading zones, demand was more or less constant throughout the morning. The Jesus de Monasterio and Vargas loading zones, in contrast, demonstrated an increase in demand between 11:00 a.m. and 12:00 p.m.
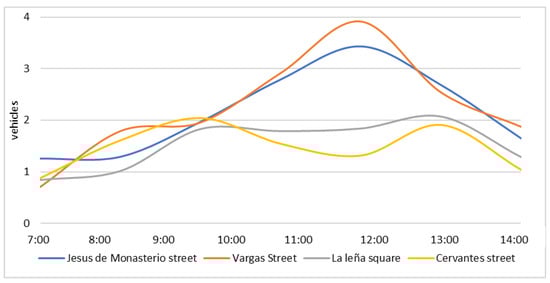
Figure 4.
Freight vehicle demand in the four loading zones analyzed.
3.2. Parking Duration and Loading Zone Occupation
The ordinance that regulates the loading bays analyzed states that vehicles may not be parked for more than 30 min. When the percentage of vehicles that violate this regulation on parking time limits was analyzed, we observed that nearly 30% of the vehicles in Cervantes Street exceeded the 30-min limit: 16% were parked for more than 60 min, equivalent to more than double the duration allowed. In consequence, vehicle rotation in the loading bays decreased. The reasons why the time limits were exceeded are unknown, however, it was observed that less than 5% of the vehicles that were parked for more than 30 min were due to loading and unloading activities.
Parking duration is shown by vehicle type in Figure 5. The average of the four loading zones analyzed is shown because the differences among them were minimal. The probability that light freight vehicles (LFs) exceeded the permitted time limit was approximately 30%. The probability of exceeding 60 min was approximately 15%.
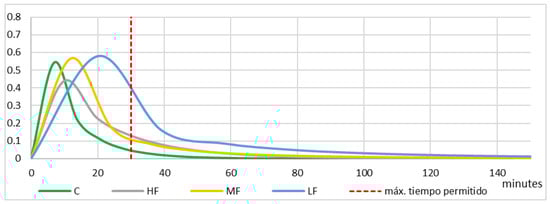
Figure 5.
Probability of parking duration by vehicle type.
The occupation of loading zones and their surrounding areas (double parking, parking in restricted areas and on the pavement) throughout the morning (7:00–14:00) is shown in Figure 6. The average occupation of each zone can be seen in the stacked line chart (average of the seven days analyzed). The bars display maximum occupation. The occupation in L/U zones could be by any type of vehicle (freight vehicle or cars). Both the maximum and average occupation in the L/U zones are shown in blue. The surrounding areas could be also be illegally occupied by any type of vehicle, and in this case, this is represented in green. Furthermore, the capacity of the L/U zones is represented with a yellow line for quick comparison with the current occupation.
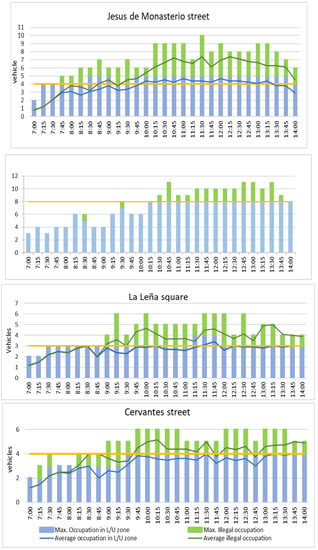
Figure 6.
Occupation of loading zones, double parking, parking on pavements and in restricted areas in the loading zones analyzed.
The average occupation of each loading zone, in terms of capacity, is observed in the graphs found in Figure 6. In other words:
- Average loading zone occupation exceeded capacity in the case of Jesus de Monasterio Street, where the maximum occupation during the better part of the morning was one vehicle more than capacity.
- Average loading zone occupation never reached capacity in the case of Vargas Street, where the maximum was one vehicle less.
- Average loading zone occupation was slightly less than capacity in Cervantes Street.
- Average loading zone occupation was approximately equal to capacity in the case of La Leña Square.
Based on the data collected, the following issues were observed to contribute to the inefficient use of loading zones:
- The greater the zone capacity, the less efficient its use is. This is due to the fact that freight vehicles do not always park in an organized way to optimize zone use. It was observed that when capacity was greater than five vehicles, the loading zone rarely reached capacity.
- The zone morphology, that is, the type of obstacles on either side of the loading zone, if applicable, influences its use. In sum, the most optimal use of the loading zone is observed when there are no physical obstacles, neither bollards nor concrete slabs (in the case of Jesus de Monasterio); if these are necessary, concrete slabs are optimal.
- The variety of vehicles that use loading zones have different lengths; it is thus useful to know the vehicle types that use these loading zones in order to understand the length and generate loading zone capacity. This is one of the reasons that average occupation exceeded capacity in Jesus de Monasterio street, given that 49% of vehicles were cars.
As has been demonstrated above, the current use made of loading bays did not comply with the ordinance that regulates them and the number of infractions committed in loading bays was high. Infractions in loading bays occur due to the types of vehicle that use them and/or the time that said vehicles are parked in them. As a result of the inappropriate use of loading bays, freight vehicles do not have the space they need in order to carry out their activities. Other illegal uses of space are chosen to this end, such as double parking or parking on pavements or in restricted areas. The percentage of vehicles that used loading bays and their surroundings illegally during the study period (7:00 a.m.–2:00 p.m.) is shown in the following table (Table 3) by illegal use.
Table 3.
Illegal use of loading bays and their surroundings.
4. Quantitative Assessment of the Consequences of Illegal Use of Loading Bays
4.1. Scenario Definition and Simulation
The data collected in loading zones confirms the expected: loading bays are illegally used to a large degree, with illegal use observed as follows:
- Use of loading bays by unauthorized vehicles.
- Non-compliance with the maximum time limits.
As a result of these two unlawful actions, vehicles double park, park on the pavement or park in restricted areas, thereby committing another illegal action. In order to quantitatively assess the consequences of the inappropriate use of loading bays, the following scenarios were analyzed, comprising various degrees of compliance and types of illegal use (Figure 7):
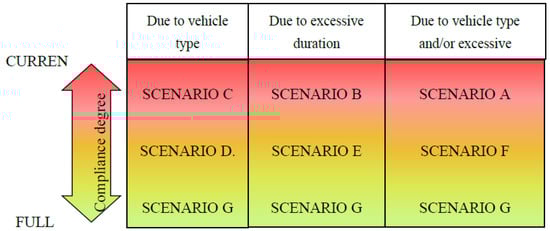
Figure 7.
Diagram of the different scenarios analyzed.
- Scenario A.
- The current situation.
- Scenario B.
- Loading bays are used solely by authorized vehicles (for the time durations that currently exist).
- Scenario C.
- Loading bays are used for a maximum of 30 min (by the same types of vehicles that currently use them).
- Scenario D.
- Freight vehicles are parked for a maximum of 30 min and cars park for a short period of time (normal distribution, N (2,0.5)).
- Scenario E.
- Only freight vehicles park in loading bays, but with a maximum of 35 min because transport operators take the risk of exceeding the permitted time period by 5 min.
- Scenario F.
- Illegal use in scenarios D and E are combined. Freight vehicles park for up to 35 min and cars park for N (2,0.5).
- Scenario G.
- Full compliance: use by authorized vehicles and for the duration allowed.
Scenarios D, E and F represent those scenarios in which loading bays are monitored but the application of regulations is not strict. The consequences of the illegal use of loading bays was quantitatively assessed for these seven scenarios through the study of their effect on the use of public space. This study was performed through the calculation of the number of loading bays used inappropriately at peak times.
All the scenarios were applied to the four loading zones analyzed. This analysis was carried out based on the simulation of the movement of vehicles in loading zones through discrete event simulation; these events were defined as the presence of freight vehicles in loading bays. Rockwell Arena software, a discrete event simulator, was used. This software has already been applied in a wide range of research, including traffic simulation [44]. It allows for simulating various scenarios with different stochastic variables, such as the loading time by merchandise type and the arrival time distribution. The simulation process went as follows:
- Step 1: Vehicles are characterized by type.
- Step 2: Vehicles arrive at the loading zone according to an arrival distribution.
- Step 3: If space is available, they carry out their operations for a specified duration of time. Loading times vary according to the vehicle type and scenario being analyzed.
- Step 4: If the loading zone is not available, vehicles will double park or park on pavements or in restricted areas.
The seven scenarios discussed were simulated by applying this methodology. First, the model was calibrated to replicate the current situation; the validation step was based on a reasonable adjustment test (Pearson’s chi-squared test), confirming that the results obtained in the simulation were adapted to the values obtained with a confidence interval of more than 95%. Then, the other scenarios were simulated based on the current situation with their respective schemas. Performance indicators were obtained from the simulations, such as average loading zone occupation.
Loading zone capacity, or the number of loading bays needed for each of the scenarios, was obtained from the results of the simulations. The number of loading bays obtained from the simulation was compared with the current number of loading bays. The difference between them gave the number of vehicles that were using public space incorrectly. These vehicles could be found in the loading bays themselves or in adjacent lanes (vehicles that were double parked) or parked on pavements or in restricted areas. Using this information, as well as the average space that vehicles occupied, we were able to estimate the space that was being used incorrectly due to the varied illegal uses taking place in loading bays.
4.2. Scenarios Assesment
This methodology was applied to four loading zones that were analyzed for the seven study scenarios. The data collected and analyzed in Section 3.1 were reused and analyzed for this purpose, these being vehicle type, demand, occupation, parking duration by vehicle type, etc.
The data collected in the loading zones were gathered and analyzed, and the methodology was applied, obtaining the following indicators:
- -
- Average loading zone occupation for each of the seven scenarios.
- -
- Average number of vehicles illegally parked (double parked (DP), parked in a restricted area (RA), parked on the pavement (OP)) for each of the seven scenarios, taking into account that the number of loading bays is equal to the current number.
- -
- Number of loading bays necessary for there to be no vehicles parked illegally (DP, RA, OP).
- -
- Number of loading bays being used inappropriately or not used efficiently due to illegal actions.
In order to simulate scenarios C and D, in which vehicles do not park for longer than 30 min, vehicles that exceeded this limit were hypothesized as parked for between 25 and 30 min. The seven aforementioned scenarios were simulated according to these conditions. One hundred (100) replications were run in each simulation scenario in order to account for random scenario factors. In the proposed model, the CPU time on an Intel Core i5 processor is about 30 s for each scenario. In the following graphs, (Figure 8) the average occupation of each loading zone and its surroundings is presented for the seven scenarios and the four loading zones.
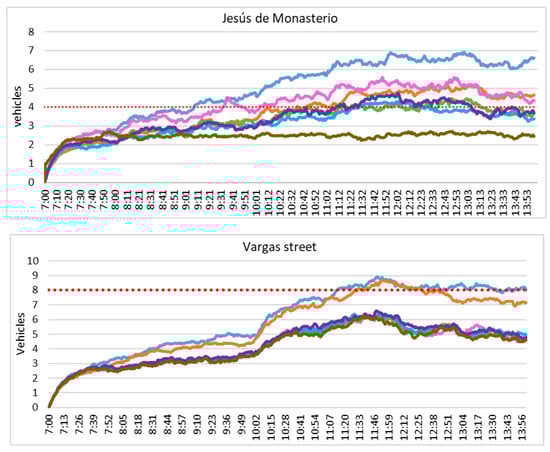
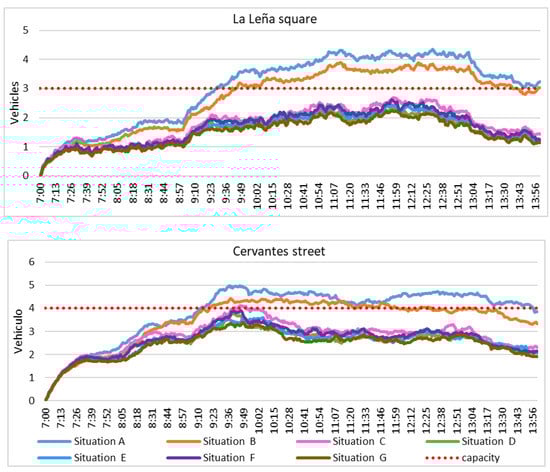
Figure 8.
Average occupation for the four loading zones analyzed in the seven scenarios.
As observed in Figure 8, in general, the same excessive parking duration existed in scenario B as in the current situation even though it did not allow cars to use the loading bay; this scenario hardly improved the current situation. The only loading zone in which a significant improvement occurred was in the Jesus de Monasterio loading zone. This is owed to the high percentage of illegal use in connection with vehicle type (cars), compared to illegal use in terms of excessive parking duration, as well as compared to the other three zones, as described in Table 3. This is why it can be deduced that the effect of illegal use by vehicles due to excessive duration is greater than the effect of illegal use due to vehicle type, taking into account current parking durations (Figure 5).
If we observe scenarios D, E, and F, we see that the degree of illegal use was close to zero. Differences among the three scenarios were minimal, similar to the difference compared to the ideal scenario, scenario G, in which compliance with existing regulations was strictly observed. The Jesus de Monasterio loading zone continued to be the exception for the same reason as mentioned above: the high degree of illegal use due to vehicle type, which was triple the amount of illegal use due to excessive parking duration.
Once the average loading zone occupation in the seven scenarios was obtained, we could derive the average loading bays that were being used inappropriately during peak times in each loading zone, as well as the 95% confidence interval half-width (Table 4). A loading bay has to be used whole, in other words, a freight vehicle needs one loading bay and less of one is not useful for it because it does not have space to park. For this reason, the rounded-up number of loading bays that were being used inappropriately and an estimation of the surface area of public space (in m2) are also presented. The surface area measurement in m2 wasestimated based on the dimensions of the vehicles discussed above (Table 2) and the vehicle types that use each zone (Figure 3), generating an average vehicle occupation of 9.6 m2. Inappropriately used space is understood as the space that is not being used efficiently or that is used for a purpose for which it was not designed, whether it is a space in a loading zone or one where double parking, parking on the pavement or parking in a restricted area take place.
Table 4.
No. of loading activities and m2 of inappropriately used public space in the seven scenarios and for the four loading zones analyzed.
When the results obtained were analyzed, we observed that, in the current situation, an estimated total of 76.8 m2 were incorrectly used throughout the total loading zones analyzed and their surroundings. Moreover, even in an ideal scenario, space within the Vargas loading zone will always be used inappropriately for the reasons discussed previously: This area never achieves capacity (eight freight vehicles) because the vehicles are not able to organize themselves and optimize the use of space, and therefore, there is always unused space. Therefore, this space could be available for other purposes, such as parking spaces for bikes, cars or motorbikes, or for underground rubbish bins, wider sidewalks or additional street furniture.
Furthermore, the percentage of illegalities, by duration and type, were similar—except in the case of Jesus de Monasterio Street, in which the duration was less than type illegalities (Table 3). It was observed that illegalities by parking duration (scenario B) had an equal or a greater impact than illegalities by type of vehicle (scenario C).
These results can be generalized to the whole city center, where there is very little public space, in order to estimate the public space that is currently being used inappropriately. The city center has 48 loading zones, which have been classified into five groups: Four of these were grouped due to their similarities with the four loading zones analyzed in terms of the type of illegal use that would occur there if the loading zone was full. In the fifth group are loading zones in which illegal use of this kind never occurs due to the characteristics of the street. Furthermore, it is known that 10 loading zones have a capacity greater than five. Based on the data analyzed and the results obtained, it is believed that vehicles are unable to organize in loading bays with a capacity of more than five bays, and one of the bays is not used properly. The number of public spaces that are used inappropriately and the average m2 of inappropriately used public space throughout the city center can thereby be estimated. The space used incorrectly in the surroundings of loading zones is specified (Table 5).
Table 5.
Inappropriately used public spaces and surface area throughout the Santander city center.
From this analysis, it can be estimated that a total of 622 m2 of the Santander city center is currently being used incorrectly or inadequately due to loading bay use only. Moreover, even if there are no illegalities, the area of ten loading bays would be unused—96m2—one loading bay unused in each loading zone with a capacity greater than 5 m2. Furthermore, it has been seen that, as a consequence of the characteristics of the surroundings of the loading zones, inappropriate use varies in each zone. The average road that is inappropriately used by the vehicles that double park reaches 125 m2 in the peak times, which may cause traffic disruption. There is more inappropriately used space that impacts on traffic than on pedestrians. The average pavement area that is incorrectly used is only 38 m2, nevertheless, is important for pedestrians. In addition, restricted area that is incorrectly used can generate problems for other users, for example, for buses or taxis, if the restricted area has bus or taxi stops, or for private vehicles if it is an exit from a garage.
Finally, knowing that the city center loading zones comprise 2121 m2, approximately 30% of the urban public space reserved exclusively for the loading and unloading of goods is being used incorrectly. It is possible that the incorrect use is not directly in the loading and unloading zones, but also in surroundings, but it is also an incorrect use.
5. Conclusions
The analysis carried out in this article has highlighted the illegal use of loading bays in an urban context through the analysis of the use and characteristics of loading zones of representative loading zones in the city of Santander (Spain). Using the information obtained, different regulation compliance scenarios have been simulated to assess the consequences of illegal loading bay use and its implication on efficient urban space use.
From the analysis of the use of the four loading zones, it has been observed that the degree of illegal use is very high: between 58% and 44% of vehicles make some kind of unlawful use of the loading bay, whether due to type and/or excessive time durations. Hence, between 34% and 55% of vehicles commit other illegal acts in the spaces adjacent to loading zones, such as double parking or parking on the pavement or in restricted areas. On the other hand, with respect to the quantitative assessment of the inappropriate use of loading bays, it was observed that illegal use due to excessive duration has a greater impact than illegal use due to vehicle type (provided that the percentage of illegal use is similar).
Additionally, the following conclusions have been reached, which may help to define loading zone capacity and characteristics:
- The larger the loading zone capacity, the less efficient its use is. This is due to the fact that the bigger the capacity, the less probable it is that vehicles will park there in an organized way.
- With regard to loading zone characteristics, it was observed that the characteristics of the space on either side of the loading zone influence the use of the zone itself.
The conclusions obtained in this investigation provide several recommendations for the city authorities. These recommendations or strategies for the design of loading zones are:
- The capacity of the loading zone has to be five at most, in other words, five medium freight vehicles parked at the same time.
- Avoid loading zones without pavements or physical objects. If it is necessary to place a physical object on either side of a loading zone in order to protect street furniture, such is waste bins, authorities should use a concrete slab instead of bollards or any other item.
- Authorities should implement measures to control loading zones. Not only to control the type of vehicles that use it, but also to control the duration of parking in order to promote vehicle rotation.
- It is advisable for regulations to be strict so that inappropriate use of urban public space is reduced, both in and around loading zones.
Author Contributions
Conceptualization, S.E. and J.L.M.; methodology, S.E.; software, S.E.; validation, S.E.; formal analysis, S.E., J.L.M. and B.A.; data curation, S.E.; writing—original draft preparation, S.E., J.L.M. and B.A.; writing—review and editing, S.E., J.L.M. and B.A.; supervision, J.L.M. and B.A. All authors have read and agreed to the published version of the manuscript.
Funding
This study and the development of future research are possible thanks to financing from the Santander City Council from the MOBIDATA-SDR project.
Conflicts of Interest
The authors declare no conflict of interest.
References
- Ezquerro, S.; Romero, J.P.; Moura, J.L.; Benavente, J.; Ibeas, Á. Minimizing the Impact of Large Freight Vehicles in the City: A Multicriteria Vision for Route Planning and Type of Vehicles. J. Adv. Transp. 2018, 2018, 1732091. [Google Scholar] [CrossRef]
- Dente, S.; Tavasszy, L. Policy oriented emission factors for road freight transport. Transp. Res. Part D 2018, 61, 33–41. [Google Scholar] [CrossRef]
- Wygonik, E.; Goodchild, A. Urban form and last-mile goods movement: Factors affecting vehicle miles travelled and emissions. Transp. Res. Part D 2018, 61, 217–219. [Google Scholar] [CrossRef]
- Lopez, C.; Zhao, C.-L.; Magniol, S.; Chiabaut, N.; Leclercq, L. Microscopic Simulation of Cruising for Parking of Trucks as a Measure to Manage Freight Loading Zone. Sustainability 2019, 11, 1276. [Google Scholar] [CrossRef]
- Holguín-Veras, J.; Ozbay, K.; Kornhauser, A.; Brom, M.; Iyer, S.; Yushimito, W.; Silas, M. Overall impacts of off-hour delivery programs in New York City Metropolitan Area. Transp. Res. Rec. 2011, 2238, 68–76. [Google Scholar] [CrossRef]
- Holman, C.; Harrison, R.; Querol, X. Review of the efficacy of low emission zones to improve urban air quality in European cities. Atmos. Environ. 2015, 111, 161–169. [Google Scholar] [CrossRef]
- Alvarez, P.; Lerga, I.; Serrano-Hernandez, A.; Faulin, J. The impact of traffic congestion when optimising delivery routes in real time. A case study in Spain. Int. J. Logist. Res. Appl. 2018, 21, 529–541. [Google Scholar] [CrossRef]
- Edwards, J.; McKinnon, A.; Cherrett, T.; McLeod, F.; Song, L. Carbon Dioxide Benefits of Using Collection–Delivery Points for Failed Home Deliveries in the United Kingdom. Transp. Res. Rec. 2010, 2191, 136–143. [Google Scholar] [CrossRef]
- Mommens, K.; Lebeau, P.; Verlinde, T.; Macharis, C. Evaluating the impact of off-hour deliveries: An application of the TRansport Agent-BAsed model. Transp. Res. Part D 2018, 62, 102–111. [Google Scholar] [CrossRef]
- Gopalakrishnan, R.; Alho, A.R.; Sakai, T.; Hara, Y.; Cheah, L.; Ben-Akiva, M. Assessing Overnight Parking Infrastructure Policies for Commercial Vehicles in Cities Using Agent-Based Simulation. Sustainability 2020, 12, 2673. [Google Scholar] [CrossRef]
- Zhao, B.; Zhang, J.; Wei, W. Impact of Time Restriction and Logistics Sprawl on Urban Freight and Environment: The Case of Beijing Agricultural Freight. Sustainability 2019, 11, 3675. [Google Scholar] [CrossRef]
- Jaller, M.; Wang, X.; Holguín-Veras, J. Large urban freight traffic generators: Opportunities for city logistics initiatives. J. Transp. Land Use 2015, 8, 51–67. [Google Scholar] [CrossRef]
- Holguin-Veras, J.; Leal, J.A.; Sánchez-Díaz, I.; Browne, M.; Wojtowicz, J. State of the art and practice of urban freight management: Part I: Infrastructure, vehicle-related, and traffic operations. Transp. Res. Part A 2018, 137, 360–382. [Google Scholar] [CrossRef]
- De Marco, A.; Mangano, G.; Zenezini, G. Classification and benchmark of City Logistics measures: An empirical analysis. Int. J. Logist. Res. Appl. 2018, 21, 1–19. [Google Scholar] [CrossRef]
- Ayuntamiento de Santander. Ordenanza de circulación del Excmo. Ayuntamiento de Santander. 2016. Available online: https://boc.cantabria.es/boces/verAnuncioAction.do?idAnuBlob=300348 (accessed on 25 May 2020).
- Roma, C. Ordinanza Sindicale n.88 del 27 ottobre 2016. 2016. Available online: https://www.comune.roma.it/resources/cms/documents/OS_88_27102016.pdf (accessed on 25 May 2020).
- Hawaii County Code 1983. Chapter 24. Vehicles and traffic. Traffic schedules. Division 6. Available online: https://www.hawaiicounty.gov/home/showdocument?id=52 (accessed on 25 May 2020).
- Browne, M.; Allen, J.; Attlassy, M. Comparing freight transport strategies and measures in London and Paris. Int. J. Logist. Res. Appl. 2007, 10, 205–219. [Google Scholar] [CrossRef][Green Version]
- Domínguez, A.; Holguín-Veras, J.; Ibeas, Á.; dell’Olio, L. Receivers’ response to new urban freight policies. Procedia-Soc. Behav. Sci. 2012, 54, 886–896. [Google Scholar] [CrossRef][Green Version]
- Comi, A.; Buttarazzi, B.; Schiraldi, M.M.; Innarella, R.; Varisco, M.; Rosati, L. DynaLOAD: A simulation framework for planning, managing and controlling urban delivery bays. Transp. Res. Procedia 2017, 22, 335–344. [Google Scholar] [CrossRef]
- McLeod, F.; Cherrett, T. Loading bay booking and control for urban freight. Int. J. Logist. Res. Appl. 2011, 14, 385–397. [Google Scholar] [CrossRef]
- De Oliveira, L.K.; Guerra, E.D. A diagnosis methodology for urban goods distribution: A case study in Belo Horizonte City (Brazil). Procedia-Soc. Behav. Sci. 2014, 125, 199–211. [Google Scholar] [CrossRef]
- Letnik, T.; Farina, A.; Mencinger, M.; Lupi, M.; Bozicnik, S. Dynamic management of loading bays for energy efficient urban freight deliveries. Energy 2018, 159, 916–928. [Google Scholar] [CrossRef]
- Wenneman, A.; Habib, K.M.N.; Roorda, M.J. Disaggregate analysis of relationships between commercial vehicle parking citations, parking supply, and parking demand. Transp. Res. Rec. 2015, 2478, 28–34. [Google Scholar] [CrossRef]
- Iwan, S.; Kijewska, K.; Johansen, B.G.; Eidhammer, O.; Małecki, K.; Konicki, W.; Thompson, R.G. Analysis of the environmental impacts of unloading bays based on cellular automata simulation. Transp. Res. Part D 2018, 61, 104–117. [Google Scholar] [CrossRef]
- Ibeas, A.; Moura, J.L.; Nuzzolo, A.; Comi, A. Urban freight transport demand: Transferability of survey results analysis and models. Procedia-Soc. Behav. Sci. 2012, 54, 1068–1079. [Google Scholar] [CrossRef]
- Iris, Ç.; Pacino, D.; Ropke, S. Improved formulations and an Adaptive Large Neighborhood Search heuristic for the integrated berth allocation and quay crane assignment problem. Transp. Res. Part E: Logist. Transp. Rev. 2017, 105, 123–147. [Google Scholar] [CrossRef]
- Iris, Ç.; Pacino, D.; Ropke, S.; Larsen, A. Integrated Berth Allocation and Quay Crane Assignment Problem: Set partitioning models and computational results. Transp. Res. Part E: Logist. Transp. Rev. 2015, 81, 75–97. [Google Scholar] [CrossRef]
- De, A.; Pratap, S.; Kumar, A.; Tiwari, M.K. A hybrid dynamic berth allocation planning problem with fuel costs considerations for container terminal port using chemical reaction optimization approach. Ann. Oper. Res. 2018, 290, 1–29. [Google Scholar] [CrossRef]
- Mauri, G.R.; Ribeiro, G.M.; Lorena, L.A.N.; Laporte, G. An adaptive large neighborhood search for the discrete and continuous Berth allocation problem. Comput. Oper. Res. 2016, 70, 140–154. [Google Scholar] [CrossRef]
- Iris, Ç.; Lam, J.S.L. Recoverable robustness in weekly berth and quay crane planning. Transp. Res. Part B Methodol. 2019, 122, 365–389. [Google Scholar] [CrossRef]
- De, A.; Choudhary, A.; Turkay, M.; Tiwari, M.K. Bunkering policies for a fuel bunker management problem for liner shipping networks. Eur. J. Oper. Res. 2019. [Google Scholar] [CrossRef]
- De, A.; Mogale, D.G.; Zhang, M.; Pratap, S.; Kumar, S.K.; Huang, G.Q. Multi-period multi-echelon inventory transportation problem considering stakeholders behavioural tendencies. Int. J. Prod. Econ. 2020, 225, 107566. [Google Scholar] [CrossRef]
- Goswami, M.; De, A.; Habibi, M.K.K.; Daultani, Y. Examining freight performance of third-party logistics providers within the automotive industry in India: An environmental sustainability perspective. Int. J. Prod. Res. 2020, 1–10. [Google Scholar] [CrossRef]
- De, A.; Wang, J.; Tiwari, M.K. Fuel bunker management strategies within sustainable container shipping operation considering disruption and recovery policies. IEEE Trans. Eng. Manag. 2019, 99, 1–23. [Google Scholar] [CrossRef]
- Dezi, G.; Dondi, G.; Sangiorgi, C. Urban freight transport in Bologna: Planning commercial vehicle loading/unloading zones. Procedia Soc. Behav. Sci. 2010, 2, 5990–6001. [Google Scholar] [CrossRef]
- Aiura, N.; Taniguchi, E. Planning on-street loading-unloading spaces considering the behaviour of pickup-delivery vehicles and parking enforcement. Paper presented at the Recent Advances in City Logistics 2005. In Proceedings of the 4th International Conference on City Logistics, Langkawi, Malaysia, 12–14 July 2005. [Google Scholar]
- Ezquerro, S.; Comi, A.; Moura, J.L. A methodology for assessing the supply of on-street delivery bays in urban areas. Case Stud. Transp. Policy 2020. under review. [Google Scholar]
- Muñuzuri, J.; Cuberos, M.; Abaurrea, F.; Escudero, A. Improving the design of urban loading zone systems. J. Transp. Geogr. 2017, 59, 1–13. [Google Scholar] [CrossRef]
- Boussier, J.; Cucu, T.; Ion, L.; Breuil, D. Simulation of goods delivery process. Int. J. Phys. Distrib. Logist. 2011, 41, 913–930. [Google Scholar] [CrossRef]
- Dalla Chiara, G.; Cheah, L. Data stories from urban loading bays. Eur. Transp. Res. Rev. 2017, 9, 50. [Google Scholar] [CrossRef]
- Cherrett, T.; Allen, J.; McLeod, F.; Maynard, S.; Hickford, A.; Browne, M. Understanding urban freight activity—Key issues for freight planning. J. Transp. Geogr. 2012, 24, 22–32. [Google Scholar] [CrossRef]
- Alho, A.R.; e Silva, J.d.A. Analyzing the relation between land-use/urban freight operations and the need for dedicated infrastructure/enforcement—Application to the city of Lisbon. Res. Transp. Bus. Manag. 2014, 11, 85–97. [Google Scholar] [CrossRef]
- Alho, A.R.; e Silva, J.d.A.; de Sousa, J.P.; Blanco, E. Improving mobility by optimizing the number, location and usage of loading/unloading bays for urban freight vehicles. Transp. Res. Part D 2018, 61, 3–18. [Google Scholar] [CrossRef]
- Antolín, G.; Ibeas, Á.; Alonso, B.; dell’Olio, L. Modelling parking behaviour considering users heterogeneities. Transp. Policy 2018, 67, 23–30. [Google Scholar] [CrossRef]


© 2020 by the authors. Licensee MDPI, Basel, Switzerland. This article is an open access article distributed under the terms and conditions of the Creative Commons Attribution (CC BY) license (http://creativecommons.org/licenses/by/4.0/).