Abstract
To develop more competitive strategies for different types of remanufacturing companies under the trade-in remanufacturing policy, this paper investigates the impact of the trade-in remanufacturing policy and consumer choice behavior on decisions of a traditional brand remanufacturer and a third-party brand remanufacturer by using a consumer utility model. The results suggest that the trade-in remanufacturing policy increases demand for the third-party brand, but does not increase demand for the traditional brand. Further, although trade-in remanufacturing policy increases both brand prices, it also increases consumer surplus and corporate profits. Neither the traditional brand remanufacturer nor the third-party brand remanufacturer can completely monopolize the remanufacturing market. In this situation, the traditional brand remanufacturer should strive to increase consumer loyalty, and the third-party brand remanufacturer should strive for consumer recognition of third-party remanufactured products.
1. Introduction
The introduction of the trade-in remanufacturing policy for automotive engines has not only attracted traditional automotive engine manufacturers to expand their business into the remanufacturing market, but it also has attracted many third-party automotive engine remanufacturers to enter the market as well. According to survey data from social platforms and the Internet, some consumers have shown a preference for the remanufactured products of traditional automotive engine manufacturers, and some consumers are even loyal to a particular brand [1]. Of course, there are other consumers who prefer remanufactured engines produced by third-party remanufacturers. These consumers believe that third-party remanufacturers’ automotive engines are more cost effective than those of traditional brands. Due to the different preferences of consumers, it will inevitably cause competition between remanufacturing engines of different brands. Both traditional brand automotive engine remanufacturers and third-party automotive engine remanufacturers hope to attract more consumers and have an edge, thereby achieving more profits.
A series of studies have been conducted in the field of brand competition decision research. Scholars find a phenomenon that consumers tend to repurchase previously purchased products, which is called consumer inertia dependence, and discuss the impact of this dependence behavior [2]. Others further explore the impact of this preference behavior on brand competition decisions. Considering the online product reviews, Li and Hitt [3] study the impact of consumer preferences on the long-term consumer purchase behavior and suggest that firms can benefit by adapting their strategies to take into account consumer behaviors. Bronnenberg and Dubé [4] delve into the formation of consumer brand preferences. Some scholars have further studied the impact of deeper brand preferences where brand preferences have been transformed into brand loyalty [5,6,7]. Shen et al. [8] build a cooperation model to study the impacts of brand loyalty on a brand’s business performance and find the optimal brand loyalty levels with respect to the different financial benefits. Using survey data from a university in India, Kamboj et al. [9] study the impact of social networking sites’ participation motivations on brand loyalty and suggest that they have a positive effect on brand loyalty. They also find that brand trust plays a mediator role between them. Scholars also explore the impact of consumer recognition on brand competition decisions. By using data from 300 French consumers, Bartsch et al. [10] investigate the roles of consumer attitudes and identification with brands and highlight the importance of brand identification. Jing [11] studies the effects of customer recognition on firms’ competition in a two-period duopoly and suggests that consumers’ recognition in the second period depends on their realized values in the first period. Scholars also discuss the impact of differences and characteristics among consumer groups. Focusing on the video game industry, Zhu and Zhang [12] discuss the impact of consumer characteristics on product sales and find that companies should develop marketing strategies based on the consumers’ characteristics. Li [13] investigates the effects of adopting pricing that is based on consumer behavior on marketing channel members and finds that this approach increases the consumer surplus but decreases marketing channel members’ profits.
However, most studies only focus on the impact of consumer behavior on brand competition strategies, while few studies also focus on the impact of government intervention on brand competition strategies. The biggest difference between the brand competition decision research of the remanufacturing automotive engines and the brand competition decision research of other products is that the influence of government intervention needs to be considered. In the field of remanufactured automotive engines, government intervention refers to the trade-in remanufacturing policy for remanufactured automotive engines introduced by the government.
In the research on the impact of the trade-in remanufacturing policy, scholars have carried out a series of studies [14,15,16]. Shi et al. [17] investigate the effects of the trade-in remanufacturing policy in a two-stage profit-maximization problem. They find that the optimal trade-in remanufacturing policy may cause low remanufacturing rates. Shu et al. [18] investigate the optimal pricing decision under the remanufacturing subsidy and find that the trade-in remanufacturing policy can encourage customers to replace their existing products. Zhang and Zhang [16] study the impact of the trade-in remanufacturing policy on the economic and environmental benefits and find that adopting this policy for highly strategic customers may negatively affect economic and environmental benefits. Using the dynamic pricing method, Li et al. [19] construct a model to improve a monopolistic original equipment manufacturer’s sales under the trade-in remanufacturing policy and find that the manufacturer prefers customers to participate in this policy. Feng et al. [20] study the effects of whether an original equipment manufacturer adopts the trade-in remanufacturing policy and find that the manufacturer prefers to set up remanufacturing systems under this policy. Han et al. [15] investigate the conditions when firms enter the remanufacturing market under the trade-in remanufacturing policy and find that the government subsidy is a strong incentive. Zhao et al. [21] discuss the effect of the government subsidy on the decisions of the remanufacturer and find that when a remanufacturer shares a proportion of the subsidy with consumers, it can achieve greater profits. Huang [22] investigates the impact of the trade-in remanufacturing policy on profits in a closed-loop supply chain and find that the manufacturer prefers to implementing this policy by himself for the immediate benefits of remanufacturing. Although some scholars have paid attention to a series of effects of the trade-in remanufacturing policy, few studies have discussed the impact of the trade-in remanufacturing policy on remanufacturing brand competition decisions. In particular, the impact of the trade-in remanufacturing policy on remanufacturing brand competition decisions about two different types of remanufacturers is rarely discussed.
Therefore, this paper discusses the impact of the trade-in remanufacturing policy on competition strategies of different automotive remanufacturing engine brands. From the perspective of consumer utility, by constructing and solving utility functions for different types of consumers, this paper investigates the impact of the trade-in remanufacturing policy and consumer choice behavior on the decisions of the traditional brand automotive engine remanufacturer and the third-party automotive engine remanufacturer. Specifically, the paper attempts to answer the following research questions:
(1) How are the decisions of the traditional brand automotive engine remanufacturer and the third-party automotive engine remanufacturer affected by trade-in remanufacturing policy?
(2) From a consumer choice perspective, will the third-party brand remanufacturer gradually eat away at the traditional brand remanufacturer? Or is the traditional brand remanufacturer gradually eating away at the third-party brand remanufacturer?
The findings of this paper provide a theoretical basis and effective suggestions for two types of remanufacturers to make decisions based on their circumstances under the intervention of the government trade-in remanufacturing policy.
2. Model
2.1. Model Description
In the automotive engine remanufacturing market, there are two types of remanufacturers: traditional brand remanufacturers and third-party brand remanufacturers. For example, Volkswagen produces its own remanufactured automotive engines, while third-party automotive engine remanufacturers (such as Bksun) also produce remanufactured engines that match Volkswagen specifications. In order to research consumers’ choice of remanufactured automotive engines produced by traditional brands versus those produced by third-party brands, consumers are divided into two categories. One group of consumers has previously replaced an engine and chose a traditional brand (the proportion is ), while the other group of consumers has never replaced an engine (the proportion is ). Different consumers have the different product value θ. Consumers make decisions by measuring the utility of three choices that include the remanufactured engine from the traditional brand, the remanufactured engine from the third-party brand, and the repair of the original engine. Although third-party remanufactured engines are very popular with some consumers, there are others who have a selective dependence on the traditional brand remanufactured engines [23]. The dependence on the traditional brand is represented by , the loyalty to the traditional brand is represented by , and the acceptance degree of the third-party brand is represented by , where . The price of the traditional brand remanufactured engines is and its wholesale price is , where . The price of the third-party brand remanufactured engines is and its wholesale price is , where and . The government’s trade-in remanufacturing policy is represented by R.
According to the modeling of consumers’ choice behavior for two different brand products [24], the first type of consumers’ utility for three different choices is shown in Figure 1.
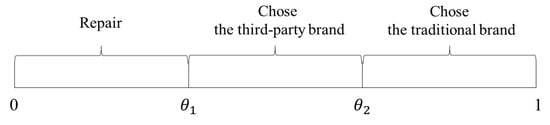
Figure 1.
The first type of customers’ choice behavior.
The specific achievable utility of the three types of behaviors is expressed as follows: For the first type of consumer, the utility of replacing an existing engine with a traditional brand remanufactured engine is
where indicates the first type of consumers’ utility of replacing an existing engine with a traditional brand remanufactured engine.
For the first type of consumers, the utility of replacing an existing engine with a third-party brand remanufactured engine is
where indicates the first type of consumers’ utility of replacing an existing engine with a third-party brand remanufactured engine.
For the first type of consumers, the utility of repairing an existing engine is
where indicates the first type of consumers’ utility of repairing an existing engine. indicates the available utility as a percentage of the original utility after repair, where . The price to pay for repair is , where .
According to the modeling of consumers’ choice behavior for two different brand products [24], the second type of consumers’ utility for three different choices is shown in Figure 2.
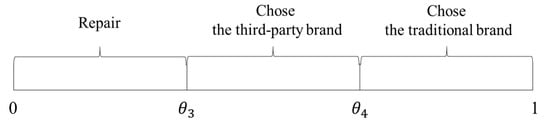
Figure 2.
The second type of customers’ choice behavior.
For the second type of consumers, the utility of replacing an existing engine with a traditional brand remanufactured engine is
where indicates the second type of consumers’ utility of replacing an existing engine with a traditional brand remanufactured engine.
For the second type of consumers, the utility of replacing an existing engine with a third-party brand remanufactured engine is
where indicates the second type of consumers’ utility of replacing an existing engine with a third-party brand remanufactured engine.
For the second type of consumers, the utility of repairing an existing engine is
where indicates the second type of consumers’ utility of repairing an existing engine, where , and .
2.2. Model Solution
According to the consumer utility model constructed in the previous section, we solve the model to obtain the optimal decisions. The proof of this section is provided in Appendix A. First, the optimal price and demand decisions are solved. According to the utility function of the two types of consumers’ different choice behaviors constructed in Section 2.1, the demand for the traditional brand remanufactured engine can be expressed as
The demand for the third-party brand remanufactured engine can be expressed as
The demand for repairing the engine can be expressed as
By solving , the optimal value can be obtained:
By solving , the optimal value can be obtained:
By solving , the optimal value can be obtained:
By solving , the optimal value can be obtained:
The total profit function can be expressed as
The optimal prices of two brands are derived as seen below by solving and :
Substituting and in Equations (15) and (16) into Equations (10)–(13), then Equations (10)–(13) into Equations (7) and (8),
Then, according to the modeling approach of Zhang et al. [25], the consumer surplus can be expressed as
Substituting Equations (10)–(13) into Equation (19),
Moreover, according to the modeling approach of Park et al. [26], the social welfare can be expressed as
By solving ,
Substituting Equation (22) into Equations (15)–(18), the optimal price of the traditional brand remanufactured engine can be expressed as
The optimal price of the third-party brand remanufactured engine can be expressed as
The optimal demand for the traditional brand remanufactured engine can be expressed as
The optimal demand for the third-party brand remanufactured engines can be expressed as
3. Analysis and Discussion
This section demonstrates the effects of trade-in remanufacturing policy and consumer choice behavior on the decisions of the traditional brand automotive engine remanufacturer and the third-party automotive engine remanufacturer.
Proposition 1.
The impact of trade-in remanufacturing policy.
Proposition 1a.
The price of the third-party brand remanufactured engine is lower than the price of the traditional brand remanufactured engine. That is to say, . Moreover, .
Proposition 1a states that the price of the traditional brand remanufactured engine is higher than the price of the third-party brand remanufactured engine, which is in line with the actual situation. The trade-in remanufacturing policy positively impacts on the prices of the traditional brand remanufactured engine and the third-party brand remanufactured engine. As the trade-in remanufacturing subsidy increases, the prices of both brand remanufactured engines increase. The proof of Proposition 1a is provided in Appendix B.
Proposition 1b.
he demand for the traditional brand remanufactured engine is higher than the demand for the third-party brand remanufactured engine. That is to say, . Moreover, and .
Proposition 1b states that the demand for the third-party brand remanufactured engines is higher than the demand for the traditional brand remanufactured engines. The trade-in remanufacturing policy has little effect on the demand for the traditional brand remanufactured engines, but the effect on the demand for the third-party brand remanufactured engines is positive, as shown in Figure 3.
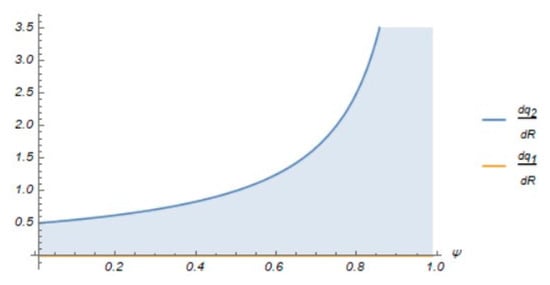
Figure 3.
Influence of on and .
As the trade-in remanufacturing subsidy increases, the demand for the third-party brand remanufactured engines increases. The proof of Proposition 1b is provided in Appendix B.
Proposition 1c.
The total profit function and the consumer surplus rise with the increase of the trade-in remanufacturing subsidy . That is to say, and .
According to Proposition 1a, the prices of both brand remanufactured engines increase with the increase of the trade-in remanufacturing subsidy. However, Proposition 1c states an interesting phenomenon that the consumer surplus does not decrease but increases. The proof of Proposition 1c is provided in Appendix B.
Proposition 2.
The impact of consumer choice behavior on the optimal prices.
Proposition 2a.
As the proportion of consumers who have replaced an engine increases, the prices of both brands of remanufactured engines increase. That is, and . Moreover, when , and when , .
Proposition 2a states that the prices of both brands of remanufactured engines increase with an increase in the proportion of consumers who have replaced an engine. Then, the marginal effects of the proportion of consumers who have replaced an engine on the prices of both brands of remanufactured engines are further discussed, as shown in Figure 4.
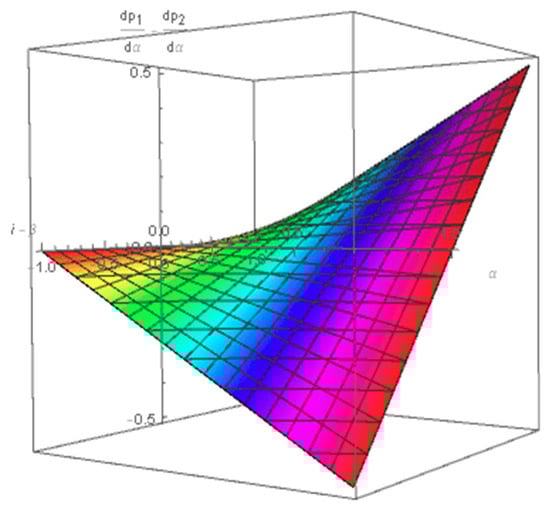
Figure 4.
Influence of on and .
When , . That is to say, when the consumer’s dependence on the traditional brand is greater than the acceptance degree of the third-party brand, the price of the traditional brand increases more than that of the third-party brand with an increase in the proportion of consumers who have replaced an engine. In other words, the more consumers choose the traditional brand, the greater the price of the traditional brand increase with the proportion of consumers who have replaced engines increases.
When , . That is to say, when the consumer’s dependence on the traditional brand is less than the acceptance degree of the third-party brand, the price of the traditional brand increases less than that of the third-party brand with an increase in the proportion of consumers who have replaced an engine. In other words, the more consumers choose the traditional brand, the greater the price of the third-party brand increase as the proportion of consumers who have replaced an engine increases. The proof of Proposition 2a is provided in Appendix C.
Proposition 2b.
As consumers’ loyalty to the traditional brand increases, the price of the traditional brand increases, while the price of the third-party brand does not change. That is to say, .
Proposition 2b states that the price of the traditional brand increases with the increase of consumers’ loyalty to the traditional brand. However, the price of the third-party brand does not change with the increase of consumers’ loyalty to the traditional brand. That is, the more consumers have loyalty to the traditional brand, the more the price of the traditional brand will rise. The proof of Proposition 2b is provided in Appendix C.
Proposition 2c.
As the acceptance degree of the third-party brand increases, the prices of both brands of remanufactured engines increase. That is,
and . Moreover, .
Proposition 2c states that the prices of both brands of remanufactured engines increase with the increase of the acceptance degree of the third-party brand. In addition, the price increase of the third-party brand is greater than the price increase of the traditional brand. The proof of Proposition 2c is provided in Appendix C.
Proposition 2d.
As the dependence on the traditional brand increases, the price of the traditional brand increases, while the price of the third-party brand does not change. That is to say, .
Proposition 2d states that the price of the traditional brand increases with the increase in the dependence on the traditional brand. However, the price of the third-party brand does not change with the increase in the dependence on the traditional brand. That is, the greater the consumer’s dependence on the traditional brand, the more the price of the traditional brand will rise. The proof of Proposition 2d is provided in Appendix C.
Proposition 3.
The impact of consumer choice behavior on the optimal demands.
Proposition 3a.
The impact of the proportion of consumers who have replaced engines on demand is discussed: when
, , and ; when and 0 , ; and when and , .
When , , and . When the consumer’s dependence on the traditional brand is less than the acceptance degree of the third-party brand, the demand for the traditional brand decreases with an increase in the proportion of consumers who have replaced the engine. Additionally, the demand for the third-party remanufacturing brand increases with an increase in the proportion of consumers who have replaced the engine.
When , , needs to be discussed as follows:
(1) When and 0 , ;
(2) When and , ;
When the consumer’s dependence on the traditional brand is greater than the acceptance degree of the third-party brand, the demand for the traditional brand increases with an increase in the proportion of consumers who have replaced the engine. The impact of the proportion of consumers who have replaced engines on the demand for the third-party brand needs to be discussed. When the consumer’s dependence on the traditional brand is greater than the acceptance degree of the third-party brand and , the demand for the third-party brand decreases with an increase in the proportion of consumers who have replaced the engine. When the consumer’s dependence on the traditional brand is greater than the acceptance degree of the third-party brand and , the demand for the third-party brand increases with an increase in the proportion of consumers who have replaced the engine.
In summary, it can be summarized as follows: for the traditional brand, when ,; and when ,, as shown in Figure 5.
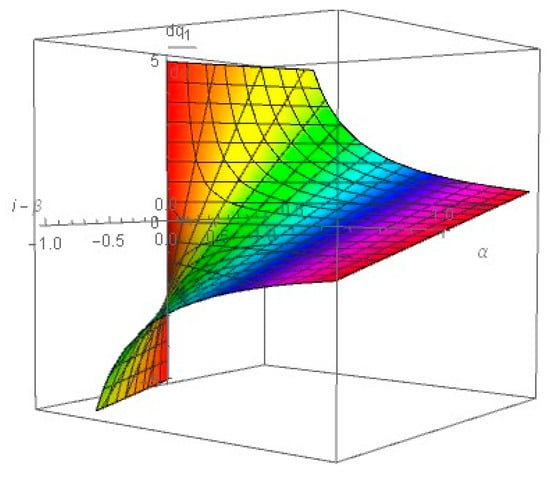
Figure 5.
Influence of on .
For the third-party brand, when , ; when and 0 , ; and when and , . The proof of Proposition 3a is provided in Appendix D.
Proposition 3b.
The impact of consumers’ loyalty to the traditional brand on demand is discussed: when
, , ; when and , , ; and when and , , .
When , , . When the consumer’s dependence on the traditional brand is less than the acceptance degree of the third-party brand, the demand for the traditional brand rises with an increase in the consumer’s loyalty to the traditional brand. Additionally, the demand for the third-party brand decreases with an increase in the consumer’s loyalty to the traditional brand.
When , and need to be discussed as follows:
(1) When and , , and ;
(2) When and , , and .
When the consumer’s dependence on the traditional brand is greater than the acceptance degree for the third-party brand and , the demand for the traditional brand increases with an increase in the consumer’s dependence on the traditional brand. Additionally, the demand for the third-party brand decreases with an increase in the consumer’s dependence on the traditional brand. When the consumer’s dependence on the traditional brand is greater than the acceptance degree of the third-party brand and , the demand for the traditional brand decreases with an increase in the consumer’s dependence on the traditional brand. Additionally, the demand for the third-party brand increases with an increase in the consumer’s dependence on the traditional brand. The proof of Proposition 3b is provided in Appendix D.
Proposition 3c.
As the acceptance degree of the third-party brand increases, the demand for the traditional brand decreases. That is,
. The demand for the third-party brand increases. That is, .
Proposition 3c states that the demand for the third-party brand increases with an increase in the acceptance degree of the third-party brand. Additionally, the demand for the traditional brand decreases with an increase in the acceptance degree of the third-party brand. In other words, the greater the acceptance degree of the third-party brand, the greater the demand for the third-party brand and the smaller the demand for the traditional brand. The proof of Proposition 3c is provided in Appendix D.
Proposition 3d.
As the dependence on the traditional brand increases, the demand for the traditional brand increases. That is,
. The demand for the third-party brand decreases. That is, .
Proposition 3d states that the demand for the traditional brand increases with an increase in the dependence on the traditional brand. Additionally, the demand for the third-party brand decreases with an increase in the dependence on the traditional brand. Combined with Proposition 2d, even under the condition of a rising price of the traditional brand, the demand for the traditional brand also increases. Further, even if the price of the third-party brand has not changed and is much lower than the traditional brand, the demand for the third-party brand decreases. The proof of Proposition 3d is provided in Appendix D.
4. Conclusions
The trade-in remanufacturing policy was introduced to promote the development of the remanufactured automotive engine industry. However, few studies have discussed the impact of the trade-in remanufacturing policy on the competition decision of the different brand engine remanufacturers. Therefore, this paper studies the impact of the trade-in remanufacturing policy and consumer choice behavior on the competitive decisions of the traditional brand automotive engine remanufacturer and the third-party automotive engine remanufacturer by constructing a consumer utility model.
The first conclusion of the theoretical analysis presented here is that the prices of both brands of remanufactured engines increase with the increase of the trade-in remanufacturing subsidy. As the trade-in remanufacturing subsidy increases, the demand for the third-party brand increases, while the demand for the traditional brand does not change. Interestingly, even as prices of both brands rise, the consumer surplus and the total profits also increase.
Second, even if the acceptance degree of the third-party brand is greater than the dependence on the traditional brand, the demand for the traditional brand still increases with the increase of the loyalty to the traditional brand. This suggests that consumers still choose to buy the remanufactured engine of the traditional brand and reduce their purchases of the third-party remanufactured engine. Therefore, the traditional brand should strive to increase consumer loyalty to counter the competition from third-party remanufacturers.
Third, when the acceptance degree of the third-party brand is greater than the dependence on the traditional brand, the demand for the traditional brand decreases and the demand for the third-party brand increases with the increase in the proportion of consumers who have replaced engines. Even when dependence on the traditional brand is greater than the acceptance degree of the third-party brand, as long as consumers have sufficient recognition of the third-party remanufactured engines, the demand for the third-party brand also increases with the increase in the proportion of consumers who have replaced engines. This suggests that third-party remanufacturers can realize their own advantages and can gain market share, while the traditional remanufacturers cannot achieve complete monopoly status.
Our study provides a methodology for two types of remanufacturers to help them make reasonable decisions considering the trade-in remanufacturing policy and consumer choice behavior. Furthermore, our study also offers important managerial implications. For the traditional brand automotive engine remanufacturer, they will inevitably suffer competition from third-party brands after entering the remanufacturing market. They can take measures to increase consumer brand loyalty to achieve a competitive advantage. For third-party automotive engine remanufacturers, in the face of competition from the traditional brands, they can gain competitive advantage by increasing consumer recognition of their products.
Author Contributions
Conceptualization, Z.W. and Y.D.; methodology, Z.W. and Y.D.; software, Z.W.; formal analysis, Z.W., Y.D. and J.H.; resources, J.H.; validation, Y.D. and J.H.; visualization, Z.W.; and project administration, J.H. All authors have read and agreed to the published version of the manuscript.
Funding
This research was funded by the National Natural Science Foundation of China, grant number 71532015.
Conflicts of Interest
The authors declare no conflict of interest.
Appendix A
Proof of the Model.
Substituting into Equations (1) and (2) and solving , the optimal value can be obtained:
Substituting into Equations (2) and (3) and solving , the optimal value can be obtained:
Substituting into Equations (4) and (5) and solving , the optimal value can be obtained:
Substituting into Equations (5) and (6) and solving , the optimal value can be obtained:
Substituting , , , and in Equations (14), (19), and (25)–(26) into Equation (21) and solving , the value can be obtained:
In addition, the value can be obtained:
Because , . Therefore, the social welfare is a concave function of the government’s trade-in remanufacturing policy , and there is an optimal subsidy.
By solving , the optimal government’s trade-in remanufacturing policy can be obtained as shown in Equation (22).
Because of Equations (16) and (24), can be expressed as
Because , . The result can be obtained. This completes the proof of Section 2.2. □
Appendix B. Proof of Proposition 1
Proof of Proposition 1a.
According to Equations (23) and (24),
Therefore, . The result can be obtained.
By solving , the solution can be obtained:
By solving , the solution can be obtained:
Therefore, . The result can be obtained. This completes the proof of Proposition 1a. □
Proof of Proposition 1b.
According to Equations (25) and (26),
Therefore, . The result can be obtained.
By solving , the solution can be obtained:
By solving , the solution can be obtained:
Because , .
Therefore, and . The result can be obtained. This completes the proof of Proposition 1b. □
Proof of Proposition 1c.
By Equation (14) and solving , the solution can be obtained:
Therefore, . The result can be obtained.
By Equation (19) and solving , the solution can be obtained:
Therefore, . The result can be obtained. This completes the proof of Proposition 1c. □
Appendix C. Proof of Proposition 2
Proof of Proposition 2a.
By using Equation (15) and solving , the solution can be obtained:
Because and , .
By using Equation (16) and solving , the solution can be obtained:
Because , .
Therefore, and . The result can be obtained.
According to Equations (14) and (15),
When , and when , .
Therefore, when , and when , . The result can be obtained. This completes the proof of Proposition 2a. □
Proof of Proposition 2b.
By using Equation (15) and solving , the solution can be obtained:
Therefore, .
By using Equation (16) and solving , the solution can be obtained:
Therefore, . The result can be obtained. This completes the proof of Proposition 2b. □
Proof of Proposition 2c.
By using Equation (15) and solving , the solution can be obtained:
Because ,
.
By using Equation (16) and solving , the solution can be obtained:
Because , .
Therefore, and . The result can be obtained.
According to Equations (A21) and (A22),
Because , . Therefore, . The result can be obtained. This completes the proof of Proposition 2c. □
Proof of Proposition 2d.
By using Equation (15) and solving , the solution can be obtained:
Because , .
By using Equation (16) and solving , the solution can be obtained:
Therefore, and . The result can be obtained.
According to Equations (A24) and (A25),
Because , . Therefore, . The result can be obtained. This completes the proof of Proposition 2d. □
Appendix D. Proof of Proposition 3
Proof of Proposition 3a.
When , by solving , the solution can be obtained:
By solving , the solution can be obtained:
Because and , and .
When , according to Equation (A27), . needs to be discussed as follows:
When , the solution can be obtained:
Therefore, when , and ; when , and .
In summary, the result can be obtained:
This completes the proof of Proposition 3a. □
Proof of Proposition 3b.
When , by solving , the solution can be obtained:
By solving , the solution can be obtained:
Because , and .
When , needs to be discussed as follows:
When , the solution can be obtained:
Therefore, when , and ; when , and .
Similarly, when , needs to be discussed as follows:
When , the solution can be obtained as shown in Equation (A29).
Therefore, when , and ; when , and .
In summary, the result can be obtained:
This completes the proof of Proposition 3b.□
Proof of Proposition 3c.
By using Equation (15) and solving , the solution can be obtained:
Because and , .
By using Equation (16) and solving , the solution can be obtained:
Because > 0, , and , .
Therefore, and . The result can be obtained. This completes the proof of Proposition 3c. □
Proof of Proposition 3d.
By using Equation (15) and solving , the solution can be obtained:
Because and , .
By using Equation (16) and solving , the solution can be obtained:
Because and , .
Therefore, and . The result can be obtained. This completes the proof of Proposition 3d. □
References
- China’s Remanufacturing Industry Market Analysis and Forecast Report. Available online: https://www.cevsn.com/research/report/1/827054.html (accessed on 15 July 2020).
- Villas-Boas, J.M. Consumer Learning, Brand Loyalty, and Competition. Mark. Sci. 2004, 23, 134–145. [Google Scholar] [CrossRef]
- Li, X.; Hitt, L.M. Self-Selection and Information Role of Online Product Reviews. Inform. Syst. Res. 2008, 19, 456–474. [Google Scholar] [CrossRef]
- Bronnenberg, B.J.; Dubé, J.P. The Formation of Consumer Brand Preferences. Annu. Rev. Econ. 2017, 9, 353–382. [Google Scholar] [CrossRef]
- So, K.K.F.; King, C.; Sparks, B.A.; Wang, Y. The Role of Customer Engagement in Building Consumer Loyalty to Tourism Brands. J. Travel. Res. 2016, 55, 64–78. [Google Scholar] [CrossRef]
- Japutra, A.; Molinillo, S. Responsible and Active Brand Personality: On the Relationships with Brand Experience and Key Relationship Constructs. J. Bus. Res. 2019, 99, 464–471. [Google Scholar] [CrossRef]
- Kim, J.; Lee, K.H. Influence of Integration on Interactivity in Social Media Luxury Brand Communities. J. Bus. Res. 2019, 99, 422–429. [Google Scholar] [CrossRef]
- Shen, B.; Choi, T.M.; Chow, P.S. Brand Loyalties in Designer Luxury and Fast Fashion Co-Branding Alliances. J. Bus. Res. 2017, 81, 173–180. [Google Scholar] [CrossRef]
- Kamboj, S.; Sarmah, B.; Gupta, S.; Dwivedi, Y. Examining Branding Co-Creation in Brand Communities on Social Media: Applying the Paradigm of Stimulus-Organism-Response. Int. J. Inform. Manag. 2018, 39, 169–185. [Google Scholar] [CrossRef]
- Bartsch, F.; Diamantopoulos, A.; Paparoidamis, N.G.; Chumpitaz, R. Global Brand Ownership: The Mediating Roles of Consumer Attitudes and Brand Identification. J. Bus. Res. 2016, 69, 3629–3635. [Google Scholar] [CrossRef]
- Jing, B. Customer Recognition in Experience VS. Inspection Good Markets. Manag. Sci. 2016, 62, 216–224. [Google Scholar] [CrossRef]
- Zhu, F.; Zhang, X. Impact of Online Consumer Reviews on Sales: The Moderating Role of Product and Consumer Characteristics. J. Mark. 2010, 74, 133–148. [Google Scholar] [CrossRef]
- Li, K.J. Behavior-Based Pricing in Marketing Channels. Mark. Sci. 2018, 37, 310–326. [Google Scholar] [CrossRef]
- Ma, Z.J.; Zhou, Q.; Dai, Y.; Sheu, J.B. Optimal Pricing Decisions under the Coexistence of “Trade Old for New” and “Trade Old for Remanufactured” Programs. Transp. Res. Part E Logist. Transp. Rev. 2017, 106, 337–352. [Google Scholar] [CrossRef]
- Han, X.; Yang, Q.; Shang, J.; Pu, X. Optimal Strategies for Trade-Old-For-Remanufactured Programs: Receptivity, Durability, and Subsidy. Int. J. Prod. Econ. 2017, 193, 602–616. [Google Scholar] [CrossRef]
- Zhang, F.; Zhang, R. Trade-In Remanufacturing, Customer Purchasing Behavior, and Government Policy. Manuf. Serv. Oper. Manag. 2018, 20, 601–616. [Google Scholar] [CrossRef]
- Shi, T.; Gu, W.; Chhajed, D.; Petruzzi, N.C. Effects of Remanufacturable Product Design on Market Segmentation and the Environment. Decis. Sci. 2016, 47, 298–332. [Google Scholar] [CrossRef]
- Shu, T.; Peng, Z.; Chen, S.; Wang, S.; Lai, K.K.; Yang, H. Government Subsidy for Remanufacturing or Carbon Tax Rebate: Which is Better for Firms and a Low-Carbon Economy. Sustainability 2017, 9, 156. [Google Scholar] [CrossRef]
- Li, Y.; Feng, L.; Govindan, K.; Xu, F. Effects of a Secondary Market on Original Equipment Manufactures’ Pricing, Trade-In Remanufacturing, and Entry Decisions. Eur. J. Oper. Res. 2019, 279, 751–766. [Google Scholar] [CrossRef]
- Feng, L.; Li, Y.; Xu, F.; Deng, Q. Optimal Pricing and Trade-In Policies in a Dual-Channel Supply Chain when Considering Market Segmentation. Int. J. Prod. Res. 2019, 57, 2828–2846. [Google Scholar] [CrossRef]
- Zhao, S.; Zhu, Q.; Cui, L. A Decision-Making Model for Remanufacturers: Considering both Consumers’ Environmental Preference and The Government Subsidy Policy. Resour. Conserv. Recy. 2018, 128, 176–186. [Google Scholar] [CrossRef]
- Huang, Y. A Closed-Loop Supply Chain with Trade-In Strategy under Retail Competition. Math. Probl. Eng. 2018, 2018, 1–16. [Google Scholar] [CrossRef]
- Seetharaman, P.B.; Che, H. Price Competition in Markets with Consumer Variety Seeking. Mark. Sci. 2009, 28, 516–525. [Google Scholar] [CrossRef]
- Su, X. A Model of Consumer Inertia with Applications To Dynamic Pricing. Prod. Oper. Manag. 2009, 18, 365–380. [Google Scholar] [CrossRef]
- Zhang, T.; Li, G.; Cheng, T.C.E.; Lai, K.K. Welfare Economics of Review Information: Implications for the Online Selling Platform Owner. Int. J. Prod. Econ. 2017, 184, 69–79. [Google Scholar] [CrossRef]
- Park, S.J.; Cachon, G.P.; Lai, G.; Seshadri, S. Supply Chain Design and Carbon Penalty: Monopoly VS. Monopolistic Competition. Prod. Oper. Manag. 2015, 24, 1494–1508. [Google Scholar] [CrossRef]


© 2020 by the authors. Licensee MDPI, Basel, Switzerland. This article is an open access article distributed under the terms and conditions of the Creative Commons Attribution (CC BY) license (http://creativecommons.org/licenses/by/4.0/).