1. Introduction
Walkable environments are key elements of healthy, sustainable and livable communities [
1,
2,
3]. Benefits of walkable environments include inducing more active lifestyles and improving mental health [
4,
5,
6], enhancing public safety, social capital, social interaction and contributing economic value [
1,
2,
7]. Understanding the benefits of promoting walking in cities—which is regarded as an equitable and non-polluting transport mean—many officials are currently paying attention to implementing new policies and designs that regenerate and create attractive pedestrian environments [
2].
Creating favorable pedestrian environments in industrial and shrinking cities can, however, be considered a challenge. Industrial cities are usually characterized by large industrial zones, extensive transport infrastructure (e.g., railways) and brownfields [
8]. On the other hand, shrinking cities are linked to declining population densities [
9] and to perforations of urban landscapes by vacant spaces and wastelands [
10,
11]. These often led to reduced inner connectivity and reduced accessibility to services and amenities in cities [
12]. In industrial cities that currently face shrinkage, several elements negatively affect the desire to walk, including: pollution [
13]; financially-weak public and private sectors that often lead to disinvestment and lack of maintenance in built environments [
7,
14,
15,
16]; as well as a reduced informal surveillance due to declining population densities, which affects the perceived sense of safety [
17,
18,
19,
20]. Furthermore, the shortage of financial resources among residents in shrinking cities [
16] might affect the type and variety of retail as well as the street activities associated with leisure walking or shopping [
1,
7]. To tackle such issues, common urban design and planning strategies to help shrinking cities create more desirable urban spaces include converting underused built properties with the help of creative industries, adopting green infrastructure, adding bike lanes, pedestrianizing streets and introducing walking-friendly designs [
21,
22]. Promoting walking in such contexts is perceived as a key aspect, as it attracts middle-class families to return into urban spaces [
23], with the potential to reverse population shrinkage.
Nevertheless, health studies demonstrate that walking strongly depends on personal and individual characteristics, as well as on social contexts [
24]. As such, mismatches can emerge between perceived and objectively-assessed walking conditions based on education, income levels and physical activity [
6]. Scholars thus acknowledged that walkable places are not simply generated by improved physical features through block and street designs, because other non-physical elements, such as the perception of street users [
25], the social environment and relevant policy-making [
26,
27] are equally important. A need to more clearly understand the social value of main streets and the way they are perceived in relation to their commercial and physical transformation thus emerged [
2,
28,
29].
This research has been conducted on primary commercial streets (referred here as ‘main streets’) in an industrial city facing shrinkage (Ostrava in Czechia). Assessing walking patterns on main streets is particularly relevant in shrinking cities, because they used to be considered as backbones of commercial development and of social interaction, however main streets are suffering a decline nowadays [
30]. Furthermore, the main streets of Ostrava are in a strong competition with a recently built shopping-mall, which renders a complex setting. This requires empirical research to assess which factors affect the walking patterns and the perceptions of pedestrians on main streets the most. Our main aim is therefore to document what determines street users to have more frequent visits and to linger longer, or, otherwise, what pushes pedestrians away and hinders the goals of reviving main streets in a shrinking city. In street-life studies, interviews with residents, site observation and behavioral mapping were most-often employed [
31,
32,
33,
34]. Nevertheless, recent studies started examining ‘walkability’ (how easy and safe is to walk around in an area [
35]) at macroscale, based on quantitative data about transit accessibility, street network connectivity, land-use mix and population density (see for instance Walk Score
® [
36]). However, such macroscale studies lose the more dynamic and nuanced experiences on the street [
7], as the preference for walking might change across a city block [
2]. Scholars thus argue that understanding how microscale elements of streets impact the desire to walk is further needed [
7,
37,
38,
39]. We thus employ traditional research methods that, although regarded as costly and time-consuming, are better suited to our exploratory focus [
40,
41]. Documenting how main streets are used and perceived by pedestrians can inform built environment regeneration towards creating attractive and walking-friendly environments, which is our overarching objective.
2. Walkable Main Streets
Walking is naturally-performed on a daily basis by people of all ages (from children to seniors), and is regarded as a low-cost and socially-inclusive mode of transport [
42,
43]. From the perspective of urban design, a ‘walkable street’ should primarily be close to various destinations, barrier-free, safe, and providing appropriate pedestrian infrastructure [
43]. Nevertheless, some authors argue that urban design should also recognize other facets of walking that are conducive to placemaking [
42]. In this regard, Forsyth and Southworth [
43] called for walkable environments that are upscale and cosmopolitan, which offer, for instance, scenic architecture and interesting retail. Such streets might also attract the upper-middle classes [
43], but, more importantly, would contribute to the experiential qualities of streets [
42].
Main streets, particularly, are recognized as the very centers of social and economic exchange in cities [
2,
7]. They usually entail a wide variety of small retail and ensure easy pedestrian access to everyday goods and services [
30]. Shopping on main streets is considered an activity of leisure and entertainment, contributing to lively and dynamic public spaces [
29,
44]. However, since the 1970s, shopping-malls and other peripheric big-box retailers, supported by car-centric urbanism, have become strong competitors to small commerce in city centers, weakening the latter [
45,
46,
47,
48]. Due to increasing car ownership and to changing patterns of socio-economic exchange through online shopping or preference for shopping-malls, main streets are currently facing decline [
30,
48].
Municipal governments aimed to improve the attractiveness of inner-city shopping areas, particularly through redevelopment of main commercial streets and pedestrianization [
44,
45,
46]. To provide easy accessibility to pedestrians, the concepts of ‘pedestrian zones’ and ‘car-free zones’ were introduced. In many cases, the use of automobiles was reduced and pedestrianization operations led to a successful revival of commercial streets (e.g., Strøget in Copenhagen [
32]); in other cases, due to banning cars, access to retail on commercial streets was reduced, and the number of customers decreased, as car-drivers chose more accessible destinations (such as shopping-malls) [
49].
Interventions to revive main streets thus follow two main streams: (1) providing incentives for small businesses to thrive; and (2) bringing improvements to pedestrian environments. Considering the first stream of interventions, a high variety of street businesses to result in viable and diverse retail uses is considered to be crucial [
30]. But one major issue is that retail mix, and consequently attractiveness, can rarely be influenced to the same degree as in shopping malls [
50]. This is coupled with some downsides of small retail, which does not always reflect market realities, and which is linked to low-paid jobs [
48]. On the other hand, the presence of main street retailers has benefits beyond daily consumption and economic development, as they attract street activity, diversity and social connections [
48]. However, retail alone does not reinvigorate urban centers [
51], but it forms positive synergies with higher building densities and walkable morphologies [
48].
Considering further the second stream of interventions, providing a more convenient access to multiple modes of transport was recommended [
51]. Nonetheless, people are not encouraged to walk on main streets by only insuring physical proximity [
2]. Therefore, enhancing the pedestrian experience, improving the quality of open spaces and the appearance of street fronts were highly emphasized [
2,
28,
32,
51,
52,
53,
54]. For example, pedestrians linger along open, interesting and welcoming ground-floors; in contrast, vacant lands and unused display windows reduce the attractiveness of the street [
2,
7,
28]. As pedestrians aim to maximize the utility of their efforts when walking, time and distance become important factors as well [
55]. In this regard, pedestrians prefer shortest distances between destinations for utilitarian walks, whereas for recreational walks, routes with amenities and enjoyable scenes are preferred [
7,
29].
Once local shoppers and local shops started disappearing from main streets, liveliness was reduced [
56]. Yet, liveliness is a key and highly desirable element on main streets, informed by human activities taking place on the street and by their duration [
37,
54,
57]. As long as main streets are planned with a variety of useful businesses, and as long as they feature interesting places of social meaning, they can attract more pedestrians [
2]. Oldenburg [
58] particularly highlighted ‘third places’ such as small businesses, coffee shops, restaurants, community centers or even general stores, where friends, coworkers or simply strangers regularly meet. ‘Third places’ are recognizable, welcoming, comfortable and contribute to sociability on streets [
59]. The role of mixed-uses in attracting street users and in supporting activities on the street throughout the day has been highlighted for over 50 years [
33,
34], and their connection to liveliness is reinforced nowadays [
48,
60].
We present the walking patterns and the perceptions of street users on main streets in an industrial and shrinking city in the next sections, after introducing the study site and the research methods.
3. Study Site
Ostrava is an old-industrial, medium-sized city in Czechia, Central Europe, with approx. 286,000 inhabitants [
61]. Over the last two centuries, Ostrava developed as a polycentric city with a fragmented urban structure. The city of Ostrava has witnessed persistent population loss since 1990 (a decrease of nearly 14%) and although deindustrialization is considered a main cause of the shrinkage, the city still retained its specialization in traditional industries [
62]. Rather than unemployment, the air pollution resulting from industrial activity is currently one of the strong push-away factors which led to suburbanization and outward migration to the capital city (Prague) [
62,
63].
Ostrava can be described as a triple city [
64], with three cores: Poruba; Ostrava-Jih; and the central district Moravská Ostrava a Přívoz (with 36,675 inhabitants [
61]), where the historical center is situated (
Figure 1). Ostrava was originally built in the 13th century [
65], but its importance grew in the late 18th century. At this time, renowned architects and urbanists (including Camillo Sitte, regarded as an inspirational source for designing walkable streets [
66]) were invited to develop plans to rebuild this industrial town into a more representative European city [
67]. However, such an urban vision has never been fully realized, and was replaced by a modernist plan from the socialist period (1948-1989) which aimed to primarily explore the production function of the city, thus sacrificing the city center development for coal mining development [
67]. As the city center was not perceived as attractive for investment, some historical buildings with poor conditions were demolished, further perforating the built environment which already suffered bombing during the Second World War [
68]. Even after the fall of Socialism in 1989, the city center of Ostrava suffered from underinvestment, resulting in long-term vacant lands, which are typical for shrinking cities. Since the 1990, the local administration acceded to a strategy of investment attraction, but the low quality of the urban and natural environment was largely ignored [
69].
After the year 2000 when parts of the inner city were revived through commercialization, the growth of inner-city large-scale retailers led to a gradual decline in the attractiveness of the historical center of Ostrava [
70]. Along with growing e-commerce and unsuccessful revitalization attempts, these are reasons why buildings of historical and architectural significance, which were programmed for retail, are still vacant. As the remaining retail is primarily supported by those working in the city center, and not by the residents, the main streets of Ostrava appear to be empty, especially on weekends. From 2006 to 2016, mainly due to the opening of the adjacent Nová Karolina Shopping Centre (NKSC), the number of vacant units sharply increased, along with a 20% decrease of active retail units [
62].
Nonetheless, because the morphological patterns of the historical center were mainly established until the 1930s, it features the highest concentration of historical buildings in Ostrava, along with a compact, fine-grained structure, built on narrow streets and short blocks. According to Forsyth [
27], this type of physical environment that clusters people and destinations together is usually attractive for walking. Creating a more pleasant environment for pedestrians and cyclists received more attention only in recent years in Ostrava, as the limited (financial and human) resources were previously allocated to economic regeneration. A positive factor is that, despite persisting environmental concerns, the city center in Ostrava is attractive to millennials (a young and educated group of people—for details see [
71,
72]). They prefer it for having cyclable and walkable distances to work, school, cultural and shopping areas, as well as for an easy access to cafes, pubs and other gastronomic facilities [
73].
4. Methods
This research is exploratory in purpose. Four main streets in the city center of Ostrava (
Figure 2) were purposefully selected as case studies, to investigate the attractiveness for walking in real-life settings [
74]. Based on preliminary observations, these streets have high concentrations of small commerce and attract the highest amounts of human activities in the city center of Ostrava. They are historically-significant and have architectural and urbanistic value.
The main area of attraction in the city center is that formed by the four streets (where they converge); other points of attraction are, for instance, the central city square (Masaryk Square) where Zámecká Street and Poštovní Street meet, or the suburban train station at the east of Stodolní Street (
Figure 2). The buildings flanking these main streets have up to six floors, and over 90% of their ground floors is available for business, though currently facing growing vacancy rates (
Table A1 in
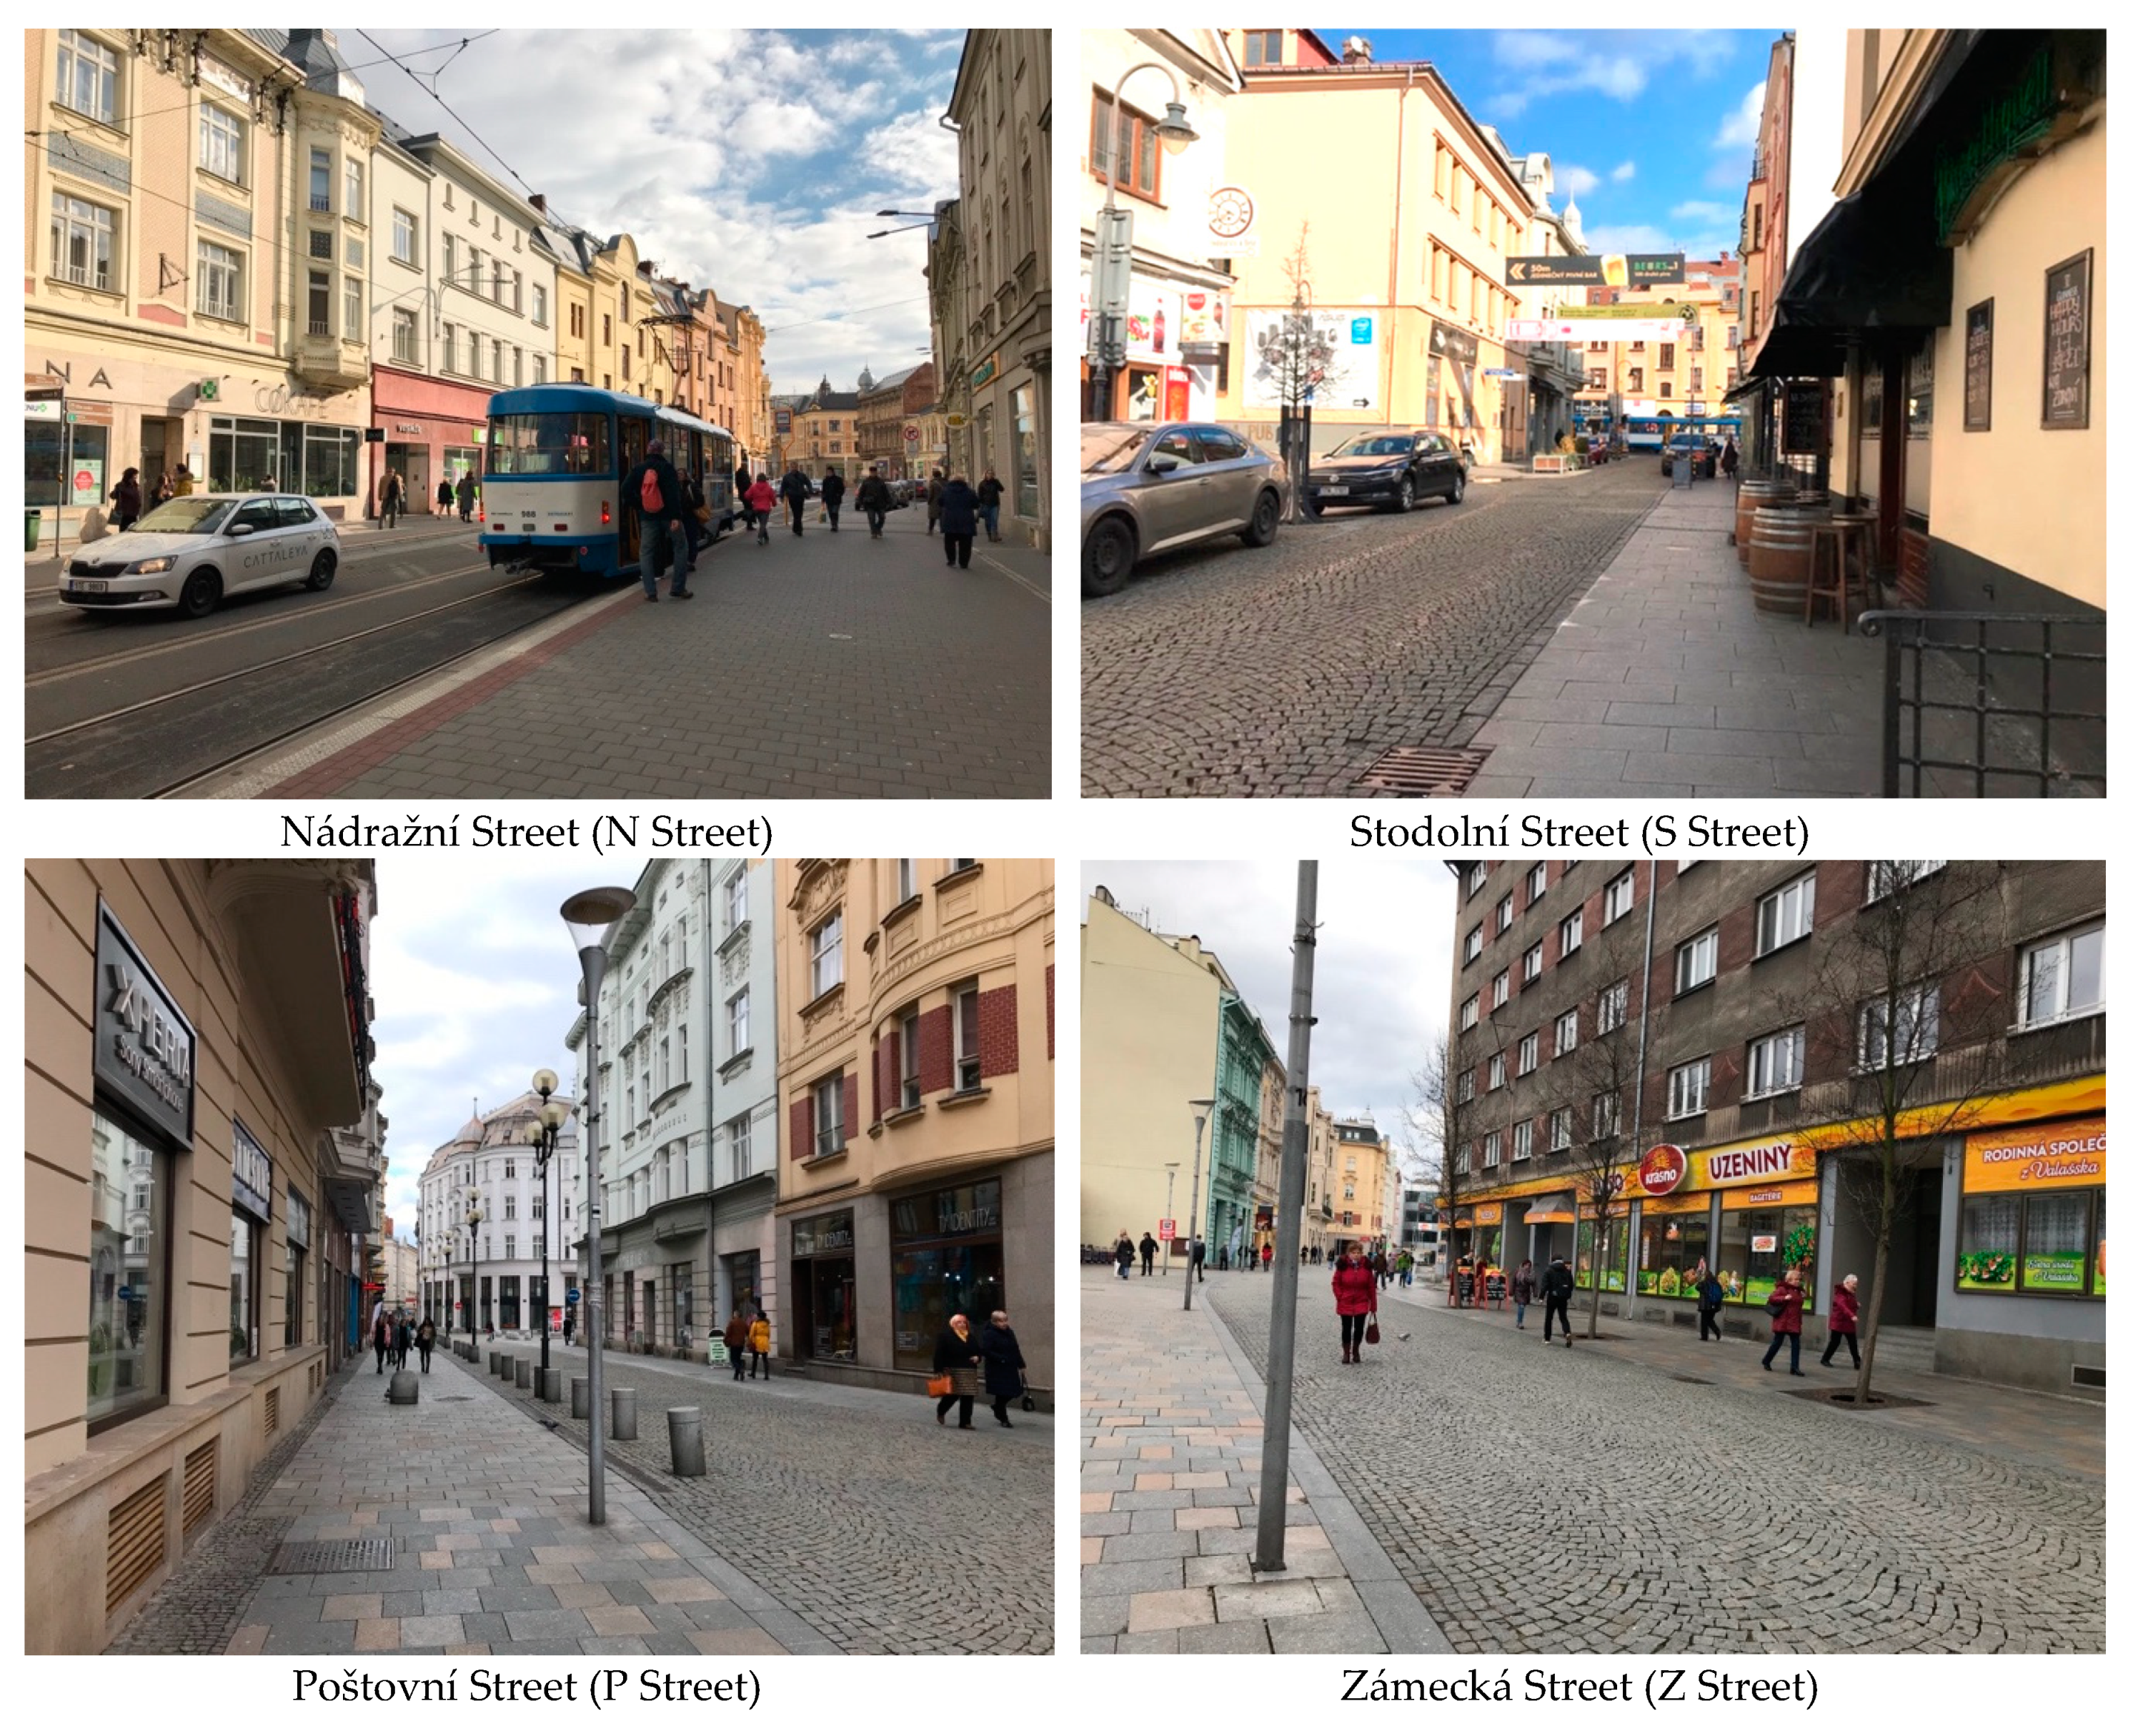
Appendix A). Concerning circulation rules: Nádražní Street (the street part which is crossing the city center) features multiple transport modes, including public transport; Stodolní Street is a declared Zone 30 area (only suppliers and residents are allowed to drive there, with maximum speeds of 30 km/h); Poštovní Street and Zámecká Street are partially pedestrian zones (car-free zones), and partially allow one-way motorized traffic. On these four streets (named hereafter as N street, S street, P street and Z street,
Figure 3), we conducted questionnaires with street users, direct observation of human activities and pedestrian counting—each of these methods had a complementary role in revealing the complex picture of how pedestrians perceive and use the streets.
Data were primarily collected in November 2019. Adults (18 years old and above) passing by the selected streets were approached for questionnaires. As part of the questionnaire, three open-ended questions enquired about the purpose of visit, the mode of travel and the way respondents would improve the street if they could. Prompts were provided for six other questions, enquiring how often the respondents walked on the selected streets, whether they had reduced mobility (seniors/disabled/parents with prams) and for demographic information (place of residence, education, age, and gender). The questionnaires were primarily collected by research assistants on each of the four streets; to supplement the responses on Stodolní Street where less results were collected due to the unavailability of research assistants, an online link with the questionnaire was adapted for this well-known touristic street, and was posted on cultural Facebook groups of relevance. The same schedule of questions was maintained, but further explanations were given for some questions.
In line with existing research, a sample size of 30 qualitative interviews ensures thematic saturation [
75] and around 100 questionnaires allows statistical analyses [
76]. Since our questionnaire comprised both open-ended and close-ended questions, our target was to collect a number of 70 questionnaires on each of the four streets, to allow comparable analyses, as well as project manageability. As we collected data, we reached theoretical sufficiency (data able to create a sufficient theoretical account, [
77]) with: 69 complete questionnaires on N and Z street; 70 complete questionnaires on P street; and on S street, as we obtained more controversial responses, we collected more data to reach theoretical sufficiency with 87 complete questionnaires. In total, we analyzed 297 complete questionnaires.
For site observations, the four selected streets were divided into segments of up to 200 m, in order to view the entire segment from a fixed observation point. The observation hours of 12:00–14:00 and 16:00–18:00, at either weekend or weekdays, were determined based on preliminary site observations as having the peaks of human activity at daytime. Human activities were marked with symbols on extracted street maps and pedestrians were counted within 10-minutes intervals at eight instances of observation. It resulted in 80 min of observation for each street segment. Activities of both adults and children were recorded. Basic characteristics of streets concerning street widths, building height or retail vacancies were estimated and tabulated from open sources [
78,
79].
The recorded stationary activities on streets were analyzed and visualized with ArcGIS online. MS Excel 2019 was used to analyze qualitative data from questionnaires and to average and convert the results of pedestrian counts. The pedestrian volumes are estimative and were used for comparative analyses only, as we disregarded the total combined variance when estimating hourly pedestrians volumes based on 10-minute counting, which would be on the order of ±10% to ±15% at a 68% confidence level [
80]. In IBM SPSS 24, we conducted descriptive and explanatory statistics.
These methods enabled us to explore the pedestrian experience on main streets in a shrinking city. The questionnaire survey gave us insights on the users’ viewpoints concerning how pleasant is to walk on main streets in Ostrava. The open-ended questions resulted in quotes that serve as basic facts [
81], while the close-ended questions enabled the comparability of answers [
40]. Direct observation allowed a direct study of pedestrian behaviors as they occur at the intersection of public life with public space [
81,
82]. Estimating pedestrian volumes was also a key procedure, being one of the best methods to record the attractiveness of streets in city centers [
29,
46,
82]. To limit the bias of these traditional research methods, we triangulated the data obtained from the various sources and ensured the validation of results.
5. Results
This section presents the results obtained on the four main streets of Ostrava. The majority of respondents lived in different parts of the city (44%), attended secondary school or high-school (56%) and were less than 45 years old (77%). The percentages of male and female respondents were well balanced (
Table A2 in
Appendix A).
Regarding visiting reasons on the four streets (where the respondents were free to indicate one or multiple purposes in open-ended responses), walking-through was most frequently mentioned (24%), independent of where the respondents lived or what transport means they used, indicating the dominant transit functions of the streets. Other common mentions included shopping (17%), work (15%), or using facilities and services on the streets (14%). Respondents who lived outside the Moravian-Silesian Region particularly indicated spending free time in equal percentages with walking-through (36%).
When correlating age with the purpose of visit (χ2(65, N = 297) = 137.748, p = 0.000), shopping dominated the responses of those of over 45 years old (39% of respondents). Concurring with our observations, the shopping environment on the main streets has been transformed into one suitable for the elderly, featuring cheap and easily-accessible stores.
The dominant visiting frequency was once or twice per month (χ2(91, N = 297) = 288.287,
p = 0.000), independent of whether respondents wanted to board trains from Stodolní station (78%), meet authorities (67%), walk-through (42%), do shopping (40%) or use services on the four streets (36%), and was independent of the transport mode selected. Workday visits were common for those who came for work (45%) or for education (39%, besides the other 50% who attended educational programs a few days per week only). Those who walked daily on the main streets lived mostly in the immediate surroundings (90%) and traveled on foot (55%, χ2(16, N = 297) = 131.466,
p = 0.000). Nevertheless, public transport was the dominant transport choice of respondents, independent of their age (χ2(20, N = 297) = 53.701,
p = 0.000), or their education level (χ2(12, N = 297) = 28.112,
p = 0.005), and was favored on each of the four streets as well (
Table 1).
Statistically-significant results of visit purposes when correlated with the four streets (χ2(39, N = 297) = 226.835, p = 0.000) indicate a strong relationship between walking patterns, land-uses and business types. N street was used mostly for going to school and for facilities and services (23% each), followed by shopping (19%). Public transport was dominant on N street (71% of respondents), and was strongly correlated with most visit purposes. But while education purposes were, for instance, correlated to visit frequencies of several days a week (50%), shopping was correlated to visit frequencies of once or twice a month (39%), significant to p < 0.05 (χ2(114, N = 68) = 151.186, p = 0.011). Yet, many respondents did not identify anything that can be improved on this street (26%), although most open-ended suggestions concerned providing benches (14% of respondents who expressed an opinion).
A contrasting situation was recorded on S street, where nearly 60% of respondents just walked-through the street, while 20% spent their free time, indicating its high accessibility (connecting the city center to the suburban Stodolní train station) and its entertaining character, but also its limited attractiveness for longer stays. The street often turned messy after late-night parties (at night-clubs, bars, casinos and others, while traces of broken glass, trash, or vomit were visible on the street). Hence, most complaints in open-ended responses concerned cleanliness (39% of respondents). The night activities taking place on this street also led to safety concerns, reflected in respondents’ suggestions to, for instance, “reduce beer sales [reduce alcohol consumption places], [as] too many alcoholics are on this street”. Respondents also suggested improving the street and the building appearance, as well as the pedestrian environment (28% of respondents). However, those with daily visits on S street traveled by car (28%), significant to p < 0.05 (χ2(6, N = 89) = 12.942, p = 0.044).
P street was used mostly for shopping (30%), for going to work or for facilities and services (19% each), while open-ended suggestions for improvements concerned green and public spaces, as well as the pavement conditions (23% and 18% of respondents, respectively). Z street was used mostly for shopping (35%) and for work (33%), while improving pavements, the building appearance as well as cleanliness were the highest concerns (mentioned by 43% of respondents in total). Correlations of visit purposes and visit frequencies on Z streets were highly significant (χ2 (84, N = 69) = 137.504,
p = 0.000), and show similar results to those on N street: shopping was correlated to once or twice a month visits (50% of respondents), and working days visits were done for work (65%). It is also interesting that, on P and Z streets, which are partially pedestrian zones (on 60–70% of their surface, see
Table A1 in
Appendix A), concerns for the pedestrian environment were the highest; in this case, informants referred mostly to the quality and the conditions of pavements: “(…) it is necessary to adjust the street paving so that shoe-heels do not get stuck (…) a number of paving stones are missing or lying around” (a respondent complained on Z street).
Although many respondents did not express an opinion about improvements (28%), the five most frequently mentioned issues concerned overall: cleanliness; the condition of sidewalks and the pedestrian environment; the street appearance and the building conditions in terms of their architecture and decorations; the quantity and quality of green and public spaces; and the issue of parking for either being too much, too little, or inconvenient. Some respondents further mentioned the need to improve the quality of services and facilities by adding new cafes, restaurants and gastronomic businesses, as opposed to bars and casinos. Removing or reducing advertising was also suggested. Other mentions can be seen in
Figure 4.
Concerning stationary activities on the four streets, most adults were simply standing (49%), while some engaged in talking to each other (26%); few, however, conducted activities that are desirable for main streets, such as sitting (7%) or having food and drinks (5%), see
Figure 5.
The presence of children (7% of all persons) was concentrated in tram stops or near public squares (
Figure 6), similar to mobility-impaired adults (4%). These were areas with some public seats provided, explaining the requests for more benches, particularly on N and P streets. Furthermore, an environment with less daytime-oriented functions (i.e., S street) revealed a reduced presence of children and mobility-impaired persons, therefore is less suitable for sensitive groups.
P and Z streets, which were partly pedestrian zones, were more children-friendly (children represented 10–11% of the total pedestrian volumes, see
Table 2 and
Figure 6). The higher percentages of children passing-by at weekends on P and Z streets (15% and 17% at weekends, compared to 7% and 4% at workdays), indicate recreational walks. On N street, however, the relatively high number of children at workdays (over 1 child/minute), and their presence in public transport stops (
Figure 6), along with two times more adults passing-by and waiting in tram stops at workdays compared to weekends (
Table 2), indicate strong utilitarian purposes.
Considering our qualitative observations against the recorded pedestrian volumes and stationary activities, the segments with the highest amount of activity were those turned into pedestrian zones or those with transport stops, accomplishing the following conditions: over 800 passers-by/hour; over 100 people with activities/segment/hour; and therefore over 10% people engaged in stationary activities reported to the total number of pedestrians throughout the length of each segment (
Table 3).
For those parts of the street with the highest amount of activity (in bus stops and in pedestrian zones next to public squares, e.g.,
Figure 7), more detailed calculations of stationary activities indicate that: reported to the area of tram stops on N1 and N3 segments, the activity recorded was of 0.15 ped/sqm/h. Close to public squares on Z1 and P2 segments, around 0.1 ped/sqm/h were recorded when reported to the entire area of pedestrian zones. This can be considered a benchmark condition for some of the most lively parts of the streets.
6. Discussion
Limited research has been previously conducted on pedestrian activity on main streets in Czech cities. For this reason, comparisons with other European or American cities that have either similar numbers of inhabitants, or similarly experience increasing vacancy rates and depopulation, on streets with similar central functions, enable us to discuss benchmark conditions for lively main streets.
The average volumes of pedestrians on Ostrava’s main streets (of 300–1200 ped/h,
Table 3) are low and indicate a low attractivity: they are three times lower than those recorded on main streets in similar-sized East-German cities [
46]; and they are comparable to pedestrian volumes recorded in three-times less populated cities, e.g., in Spain (on a high street in a depopulating context, at workdays [
60]) or the US (on neighborhood commercial streets [
2]).
Not only the volumes of passers-by (which were generally lower at weekends, as many residents engage in recreational travels outside the city [
83]), but also the amount of stationary activities recorded on Ostrava’s main streets (of 6–15% of total pedestrians, or up to 0.15 ped/sqm/h) is lower or barely comparable to that recorded in cities with three times less inhabitants [
60,
84]. Even more, some authors [
84] did not consider the pedestrians waiting in bus stops, although they are relevant in being considered because they significantly add to liveliness by contributing their human presence and informal surveillance (as we observed on Ostrava’s streets).
In Ostrava, segments of its historical spine (N street) performed best, but here much of the foot traffic was generated by transit stops (N1 and N3 segments, with over 900 passers-by per hour and over 150 stationary pedestrians per hour). Performing second-best in terms of the amount of human activity were pedestrian-zones (Z1 and P2 segments, with over 800 passers-by per hour and over 100 stationary pedestrians per hour). Over 10% of pedestrians engaged in stationary activities were also recorded in a former industrial neighborhood of Prague [
39], although the absolute values of people recorded in Prague’s pedestrian zones were higher (of 900–3400 pedestrians/hour). Nevertheless, the recorded values on best-performing segments reveal benchmark conditions for lively streets that Ostrava should aim to maintain or reach on other street segments as well.
The lowest pedestrian activity was recorded on S street (less than 500 passers-by per hour) in Ostrava. Although this street has received significant investment to become a touristic street (712,000 Euro in 2006 [
85]), the promoted late-night function, along with a strong presence of vacant spaces (
Table A1,
Appendix A), resulted in an underused streetspace during daytime, despite its location being close to the suburban train station (Ostrava-Stodolní).
One limitation of our study could be that we recorded pedestrian activities in November (2019), but mostly in sunny days with average temperatures of 10 °C. Summer temperatures of over 20 °C can attract slightly more stationary activity; nevertheless, our results are representative for pedestrian activity in non-rainy days at autumn, or even at spring. Overall, however, both the pedestrian counts and the records of stationary activities are far below the walkway capacity defined in the Highway Capacity Manual [
86] or in the Czech Technical Norm [
87]. This was encountered even in the busier parts of Ostrava’s main streets (which were the tram stops on N street). Hence, in Ostrava it is hardly an issue of a low pedestrian level of service, but it is primarily an issue of depopulating streets.
Not only did the pedestrian counts and records of stationary activities show that most pedestrians are not really engaging with the streetspace, but questionnaires also indicated that many pedestrians (approximately 25% of respondents) transit the four main streets without having a goal within this area; corroborating Monheim’s theory [
46], this indicates the decline of the city center as a commercial area of Ostrava, despite recent efforts for pedestrianization. Further reinforced by the fact that mostly those over 45 years old engaged in shopping on main streets, one explanation could be that small businesses remain behind as they fail to update their response to market demands (corroborating Talen and Jeong [
48]). This decline is potentially aggravated by the rivalry of the newly-built shopping-mall within a 300 m distance [
46,
62], and by the weak position of the historical center in this fragmented city [
64]. Overall, the low pedestrian volumes and the low attractivity form a negative synergy with the sprawling and shrinking tendencies of the city, and the danger is that the city center will depopulate even more (the city center’s population already decreased by 20% from 1991 to 2018 [
61]). Urgent attention is therefore required to be given to both the city context, as well as to the level of the street in relationship with existing street-use patterns.
Parking and car access might be important for retailers [
44], but in Ostrava they took advantage of their delivery access and left their cars parked in zones with pedestrian priority throughout the day (e.g., on S street). Although some residents had mixed opinions about parking, the informants used public transport most frequently (independent of residence, age or education), therefore providing more parking spaces in the city center of Ostrava is not needed. By the results of this research, pedestrianization plans of the local government (Moravská Ostrava a Přívoz Municipal District) can be further carried out, but it is necessary to synchronize them with providing interesting and attractive daytime functions and suitable urban design, to attract more pedestrians. The importance of this point comes into focus especially when we recall Jacobs’ argument that simply removing cars from city centers is not an effective solution if it results in dead spaces [
33].
The dominant visiting frequency of once or twice a month is comparable to that recorded on retail streets in a similar-sized city but with a higher retail vacancy (i.e., Southampton, UK [
44]). This low visiting frequency indicates worrisome conditions for main streets. Furthermore, the utilitarian purposes (such as walking-through, meeting authorities, going to work or to school) were dominant in Ostrava, whereas shopping, spending free time or meeting friends were altogether mentioned by less than 40% of respondents, and were correlated with a lower visit frequency. Compared to findings of Turner et al. [
44] where entertainment and shopping were main visiting reasons, the low attractivity for leisure and the uninteresting small retail in this industrial city of Ostrava becomes more evident. Nonetheless, Ostrava and other medium-sized industrial cities need to maximize the morphological advantage of their historical centers which enable keeping activities in a concentrated space [
1,
27,
33], to respond well at least to utilitarian purposes. Also, given the fact that nearly 30% of respondents did not indicate that any improvements are needed (a percentage similarly recorded in shopping areas in Portugal [
88]), it can be stated that physical and functional problems faced by Ostrava’s main streets are not strongly perceived by respondents. Therefore, with minimal interventions and more attractive destinations, the main streets and the entire city center could become more surprising, more varied and more lively [
33]. In this regard, the types of businesses encouraged on main streets have a high importance for the overall atmosphere of the street. For example, the S street faces a sort of gentrification dominated by bars, casinos and nightclubs that cater to occasional tourists, rather than to residents. This can be compared to what Zukin et al. [
89] called as the “ABCs” of gentrification (i.e., art galleries, boutiques and cafes), just that in our case it is much worse, as it results in bizarre spaces with uncanny activities (see also [
90]). The business activities thus affected the overall atmosphere of the street, and made the S street perform worst among the four streets. Corroborating Mehta [
54], attracting a mixed variety of businesses is highly important, but this research reveals that attracting the ‘right’ type of businesses is equally important.
Safety concerns were also recorded on the S street, which can be similarly explained by the nighttime activity of shady businesses (corroborating Jíchová and Temelová [
20]); this led to incivilities and prompted respondents to suggest safety improvements. Nevertheless, as resulted from informants’ comments, the higher percentage of uncontrolled and unkept open spaces in the form of vacant lands (on 15–20% of the street frontage on S and Z street) also affected the perception of safety (corroborating Bereitschaft [
7]). At the same time, having green and open spaces was important for pedestrians, but maintenance is key. Along with expectations for more cultural and social activities, informants’ responses indicate a search for an enjoyable experience when visiting main streets, not primarily focused on transactions (see also [
44,
51]). Yet, although commercial streets might be preferred for entertainment, this does not have to take the form of concentrated night-time entertainment (as currently happens on S street); instead, there is a need for more scenic streets, scenic architecture, greenery and enjoyable settings where to see and meet other people, to enrich the pedestrian experience. From this research, it could be understood that shrinking cities should not accede to economic growth by allowing a series of shady businesses (gambling, casinos and nightclubs) to settle; but should consider the development of the street in a long-term perspective.
7. Conclusions
The highest strengths of Ostrava city center are its morphological structure with narrow streets, short blocks, short distances and pedestrian-zones (
Figure 1 and
Table A1 in
Appendix A). However, from questionnaires with street users, it emerged that Ostrava’s four main streets are used primarily for transit and less for leisure walks, with a dominant visiting frequency of once or twice a month. This deduction is also supported by the observed patterns of stationary activities—mostly recorded in transport stops and secondarily next to sitting areas in pedestrian zones. From our analysis, several challenges which make Ostrava’s main streets less attractive are found at a microscale level, consisting of uninteresting pedestrian environments with insufficient seating and an increasing number of vacant stores along with uninteresting or unsuitable small retail. Some of these issues can be solved with refurbishment, upkeeping of street spaces and proper urban management. Physical aspects which affect human perception can be primarily addressed, as this might prove an efficient way to improve streetscapes with a limited public budget [
6]. Considering both the questionnaires and observations, we recommend improvements to the following physical aspects: (1) cleanliness, in terms of both visual disorder and hygiene especially in areas where incivilities might occur; (2) walkway conditions, by making sidewalks more comfortable for pedestrians–e.g., with suitable stone pavers; (3) greening the streets, by turning blind walls and vacant lands into green facades and green open spaces, which are opportune solutions in otherwise densely-built city centers. This would also improve the overall street and building appearance, which was highlighted by residents. (4) adding pedestrian-oriented streetlights, as well as benches and waste bins in key locations. Such microscale interventions, concerning comfortable and clean pavements, and adding street furniture would respond to approximately 70% of respondents’ suggestions. Such actions can be performed with environmental awareness, for instance using renewable energies to power street lamps, utilizing recycled materials for street furniture, or using pervious pavers and increasing street greenery for ecological functions.
Furthermore, addressing functional aspects is also of high importance: achieving multiple goals (similarly recommended by Brown et al. [
17]) is possible through providing an increased number of interest-destinations and a good mix of retail services, facilities and amenities; furthermore, encouraging businesses that become community-gathering places [
58] is the most desirable solution in generating liveliness on the main streets of Ostrava. Positive examples from this study include the way some vacant lands received temporary uses to support restaurants and services by providing space for open terraces, which attracted pedestrians (partly encountered on N and Z streets). It is also recommended to turn some casinos and nightclubs (which often triggered incivilities) into spaces with daytime functions (as some respondents suggested). Such measures can also substantiate the reinforced car-traffic regulations (pedestrian zones or 30 km/h zones with delivery access only) to result in walking-friendly environments. Creating attractive streets for pedestrians is not a unidirectional approach, but it requires interventions on multiple levels.
This study facilitated a qualitative evaluation of local conditions. Despite a limited sample of streets and estimative pedestrian counts, the contribution of this article consists of informing policy making and urban design and planning practice for city center and main streets regeneration. Several conclusions can be pinpointed from this research, representing the main contributions to knowledge:
- (1)
There is a turning-point in incentivizing and profiting from businesses on the street, as once marked profits are prioritized regardless of whether the business types become shady, the street degenerates.
- (2)
Uncared for and unproperly managed spaces negatively affect the way walking environments are perceived, and lead to underused street spaces, despite having transport nodes or other utilitarian attractors in proximity. A contextual relation thus emerges between functional aspects taken together (e.g., land uses, transport nodes, business types and vacant spaces), and walking patterns on main streets.
- (3)
Main streets in industrial, medium-sized Eastern-European cities aiming for liveliness (as opposed to shrinkage) should have over 800 passers-by/hour and over 10% pedestrians engaged in stationary activities (or otherwise over 0.1 ped/sqm/h lingering in pedestrian zones).
Similar conditions might have been encountered in other industrial cities threatened by shrinkage, but through this research it can be understood that a fine-grained morphological structure adjacent to main streets with public functions primarily serves pedestrians with utilitarian purposes. Henceforth, if the pedestrian experience would be improved through establishment of suitable small businesses and through comfortable and scenic environments, this would increase the chances for pedestrians to linger longer in public spaces and thus reanimate the streets. Such recommendations, primarily directed to Ostrava’s public administration (City Council and Municipal Districts), might have replicability in other shrinking or industrial cities (through prior contextual understanding), and might prove to be important regeneration strategies. As a side note, under the COVID-19 pandemic, small retail and restaurants are strongly impacted by a decreased demand [
91], while in the longer-term, this market segment could face an increased competition from e-commerce and food delivery services [
92]. To overcome such crisis, broader research agendas call for collaboration of the local administrations with businesses and building owners for an updated response to demands, and for instance, to coordinate marketing and management procedures (such as replacement of unused display-windows with temporary green walls). Research processes based on surveys with street users and observations are recommended, as the qualitative value of responses is high and can provide insights to city authorities. Future academic research can detail and quantify the influence of specific physical, functional and social factors in determining walking patterns and liveliness on main streets. All in all, regeneration starts with small steps and in fine-grained urban fabric (such as city centers), it can be addressed at a microscale by primarily responding to the street users’ needs and expectations.


