Article

Clustering Analysis of Soybean Production to Understand its Spatiotemporal Dynamics in the North China Plain

1
Key Laboratory of Land Surface Pattern and Simulation, Institute of Geographic Sciences and Natural Resources Research, CAS, Beijing 100101, China
2
College of Resources and Environment, University of Chinese Academy of Sciences, Beijing 100049, China
*
Author to whom correspondence should be addressed.
Sustainability 2020, 12(15), 6178; https://doi.org/10.3390/su12156178
Submission received: 21 June 2020 / Revised: 28 July 2020 / Accepted: 29 July 2020 / Published: 31 July 2020

Abstract

:
The production gap of soybean (Glycine max L. Merr.) has been expanding in China recently, due to the increasing demand and decreasing production. Identifying soybean production dynamics is contributable to appropriate adjustment of crop rotation system and efficient use of agricultural resources—and thus to ensure food security. Taking the North China plain (NCP) as a case area, this study first analyzed the spatiotemporal dynamics of soybean production during 1998–2015 based on the spatial autocorrelation method, and then calculated contributions to the total production by yield and sown area using the factor decomposition method. The results indicated that total soybean production in the NCP decreased dramatically from 1998 to 2015 and showed a decreasing trend in 80.4% (263) of the counties, mainly (83.9%) contributed by the shrinkage of sown area, largely caused by decreasing benefit. Two regions were found with significantly spatial clustering degree of soybean production. In the south part of NCP, soybean production was highly clustered in Anhui province, and in north it was mainly clustered in western Hebei plain. It was found that soybean production in the NCP was rather sensitive to the return gaps of soybean from maize (Zea mays L.). These imply that the reduced area of soybean production can be restored if the return is improved by adopting appropriate policies such as appropriate subsidies. These findings could be helpful for the policymakers to make soybean production planning in the NCP, contributing to the national revitalization strategy of soybean production.

1. Introduction

Demand for milk and meat in China has been expanding with much higher rate than the global average, due to dramatically improved dietary structure in recent decades [1,2,3,4], stimulating considerable increase of soybean and maize consumption [5,6]. Since 1980s, their consumptions have increased twelvefold and threefold, respectively, and will continue to grow rapidly in the future [6,7,8,9]. To meet this increasing demand, maize production has maintained a rapid growing trend, increased by 323.3%, while soybean production showed obviously phased change characteristics [10,11,12]. During 1980–2004, soybean production increased from 7.9 Mt to the highest 17.4 Mt, but then decreased to 12.4 Mt in 2015, due mainly to the shrinkage of sown area resulted from maize expansion. From 2004 to 2015, maize sown area in China increased by 76.7% (19.5 Mha), because of the government promotion and its higher yield. Since maize and soybean grew in the same season of June–October [13], this expansion of maize area was partly achieved by the reduction of soybean sown area, resulted in a marked decrease in soybean area from 9.6 Mha in 2004 to 6.8 Mha in 2015 at a rate of −45.8 k ha/yr [7,14].
To meet the self-sufficiency of staple grain supplies has always been the strategic priority of China’s agricultural policy. But for non-staple or feed grains particularly soybean, China has to depend on import, due to limited arable land resources. So, international trade has gradually become the main approach to meet the increasing soybean demand [4,15]. Before 2004, the import volume of soybean was less than 20.2 Mt in China, but in 2015 it increased to 86.7 Mt, accounting for 86.9% of the total consumption. This increasing import has largely reduced the soybean growing area, resulted in quick shrinkage of soybean production, and thus increased the risk of food security in China. In addition, the reduction of soybean growing area has a potential to increase n losses and thus greenhouse gas emission, as the reduced soybean area was used for growing maize and other cereal crops that need much higher chemical fertilizer inputs [16,17,18]. Sun et al. indicated that conversion of soybean land to cereal crops resulted in soil n balance turned from negative to positive, increasing risk of n losses and soil pollution [18]. Recognizing these problems, the Chinese government has made efforts to promote soybean production, and in 2015, enacted the National planting structure adjustment plan (2016–2020), in which the sown area of soybean was planned to restore to 9.33 Mha in 2020. In the No.1 Document of the year 2019 from the central government, revitalization of soybean production by expanding the sowing area was listed as one of the top rural and agricultural development tasks [19,20].
To revitalize soybean production in China, it is necessary to have an analysis on the spatiotemporal changes during past decades, as to identify priority areas that should be promoted to restore the soybean production. Presently, some studies analyzed the spatial distribution of soybean production in provinces of Jiangsu and Henan [21,22] and identified the spatial distribution patterns in the Northeast China [23], but no study gives specific analysis on soybean production in the North China plain (NCP). To well understand the spatiotemporal variation and clustering characteristics is helpful for the appropriate arrangement of soybean production and efficient use of agricultural resources, and thus to ensure the sustainability of resources and food security [24,25,26,27]. Identification of clustering patterns can help recognize the priority areas for specific crop production, and thus support agricultural planning. For this identification, the spatial autocorrelation method is often used, as it can measure the mutual dependence in a certain area and the similarity degree in adjacent space [28,29,30,31].
The NCP has favorable climate, soil properties and agricultural infrastructure, and is one of the key production regions of food crops including soybean in China [14,32]. During recent decades, soybean has been largely replaced by maize, leading to a decline in soybean production and soil degradation to some extent [18]. To realize the national goal of soybean revitalization, soybean production in the NCP should be restored and expanded. For this purpose, this study first, analyzed the spatiotemporal changes of soybean production at county level from 1998 to 2015, and then identified the cluster types and the dynamics, using the methodologies of spatial autocorrelation and factor decomposition. Finally, the causes of changes and implications were discussed.

2. Materials and Methods
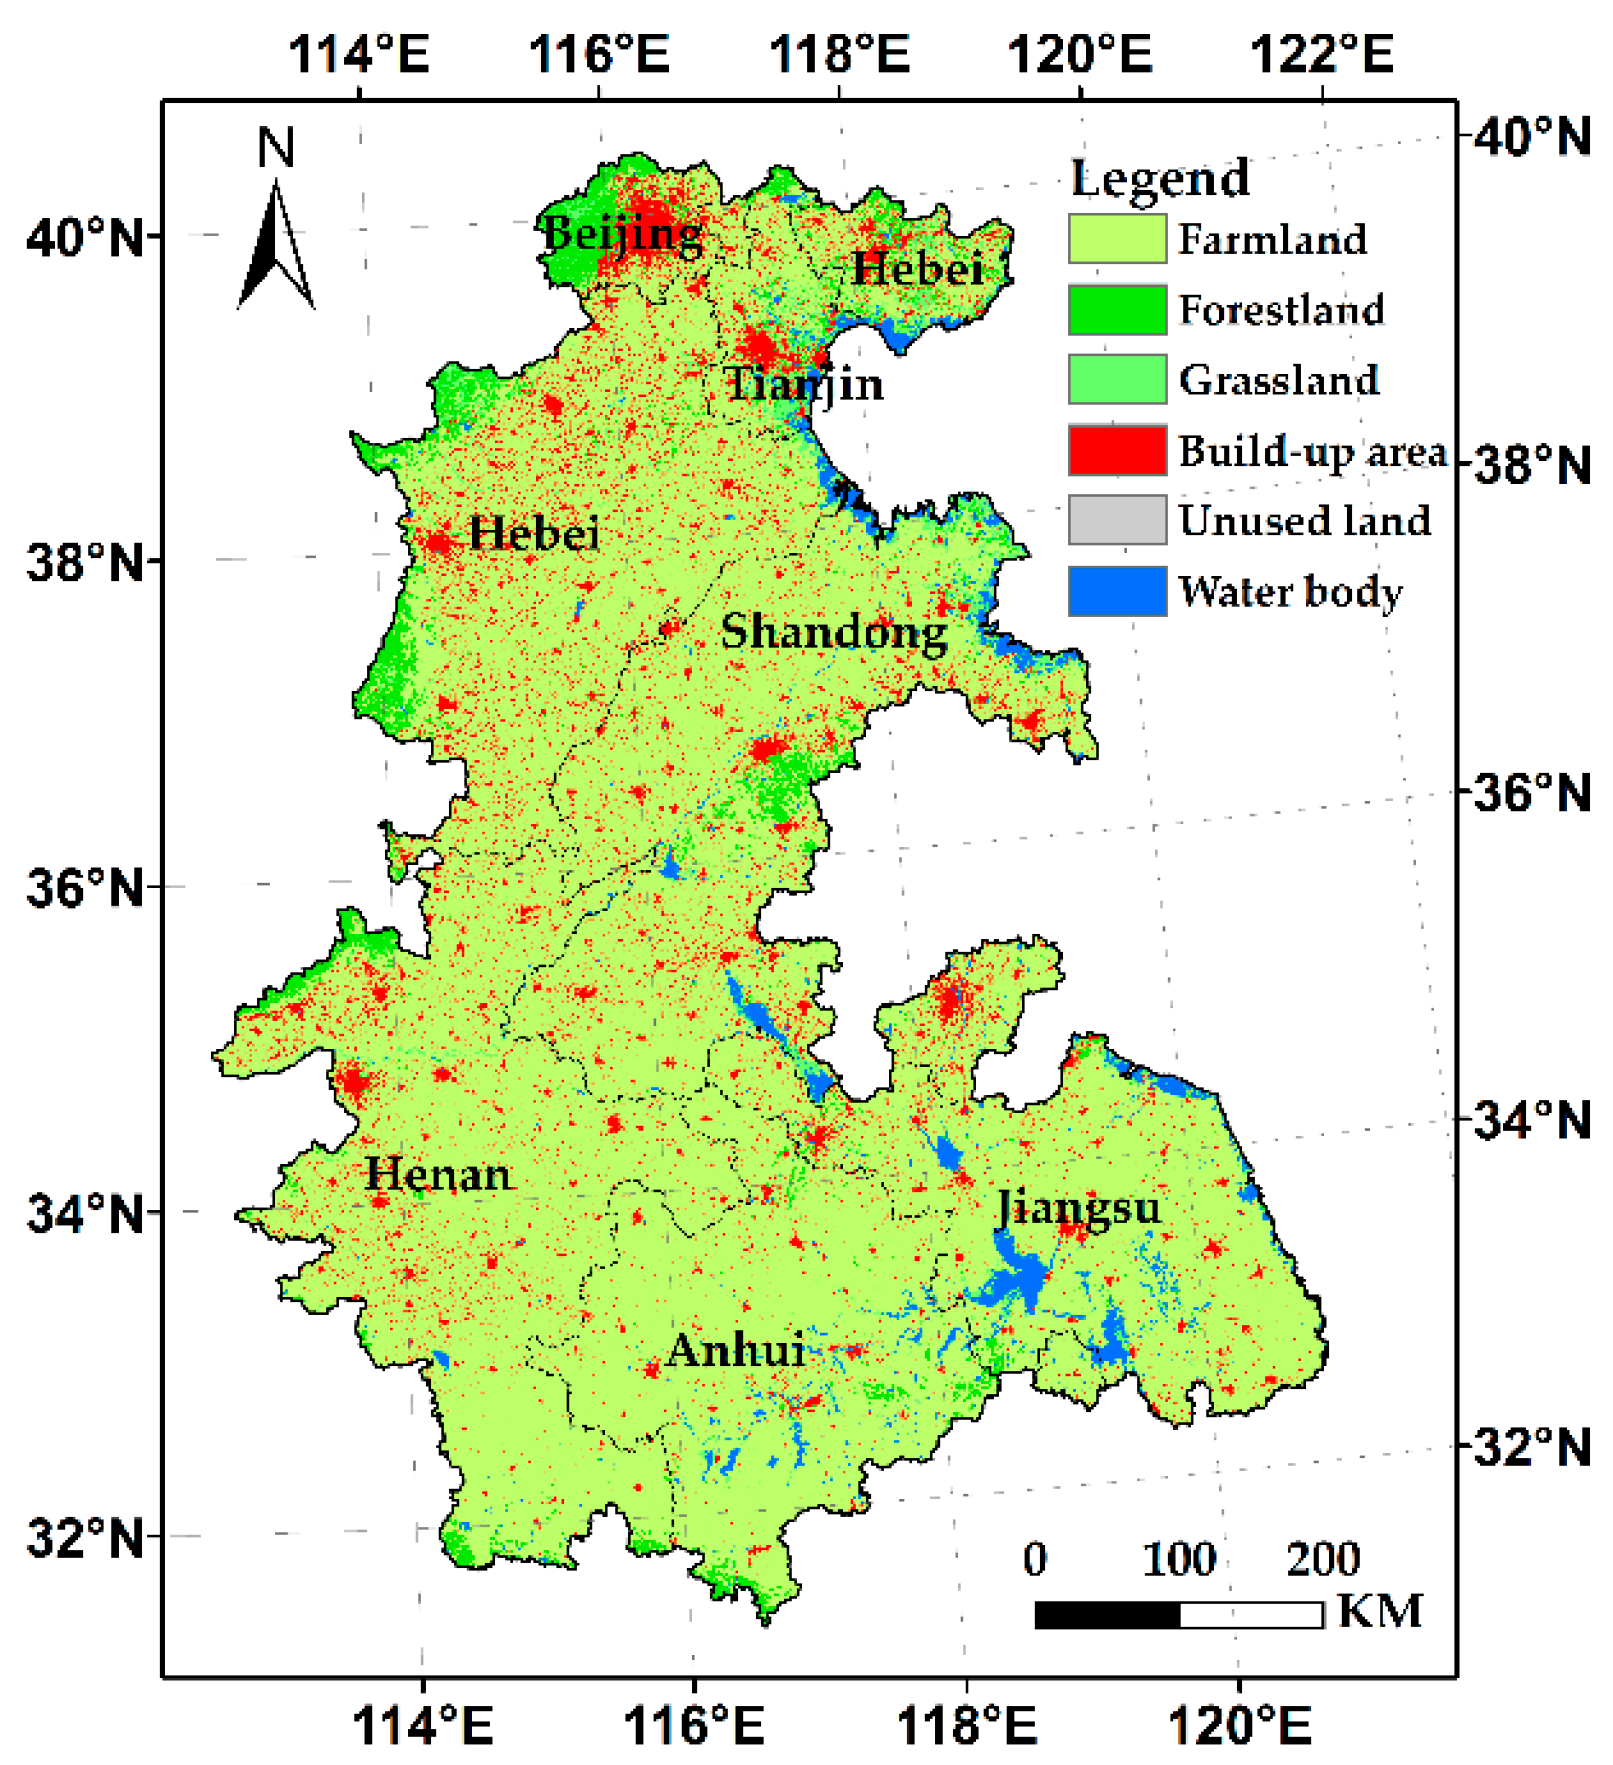
2.1. Study Area

The NCP is located between 31.9–39.8° N, 112.0–122.5° E, and involves 327 counties, extending over parts of the provinces (municipalities) of Beijing, Tianjin, Hebei, Henan, Shandong, Anhui and Jiangsu (Figure 1) [32]. It covers an area of approximately 39 million ha, of which 81.8% was farmland, 8.7% built-up land, 6.9% forestland and grassland and 2.6% water bodies and unused land, based on the 300 m spatial resolution data interpreted from European Space Agency in 2015. The double cropping system is the common planting pattern in the NCP, where winter wheat (T. aestivum L.) grows in October to June, followed by summer crops of maize, soybean, cotton, etc. [33,34]. As one of the most important agricultural area in China, the NCP produced more than 34.5% of China’s total grain production with 32.3% of the total sown area in 2015 [7]. The NCP was once the main soybean producing area in the 1980s, playing an important role in guaranteeing soybean production in China. For instance, the sown area and production of soybean in the NCP were 2.79 Mha and 4.09 Mt in 1980, accounting for 38.6% and 51.5% of the total in China, respectively.

2.2. Data Preparation

Soybean production data in the NCP were obtained from the city or provincial rural yearbooks during 1998–2015, including the total production, sown area, yield, irrigation rate. To analyze the influence of economic factors, we collected input costs and market prices of soybean and maize from the Compilation of national agricultural product cost and income data, published by China price press (Table 1). For few missing data of individual counties, we interpolated the values using the average values of adjacent four years. There are some changes in administrative boundary of counties such as Shouxian, Kaifeng and Bozhou, and we used the data after the administration adjusted.

2.3. Spatial Autocorrelation

Spatial autocorrelation is often used to indicate the mutual dependence of variable attributes in a certain region and to measure the similarity degree of selected indicator in adjacent space [35,36,37]. It includes global and local spatial autocorrelation, involved global and local Moran indices, respectively. The global Moran index (I) is used to evaluate whether the distribution is grouped or random through verifying the degree of spatial autocorrelation between target unit and its neighbors [38]. Direct correlation exists when the Moran index is positive (between 0 and 1), while inverse correlation is identified when it is negative (between −1 and 0) [39]. The higher absolute value of the index implies the higher cluster degree of the selected region. The Equations are presented below.
I = n S 0   i = 1 n j = 1 n w i , j ( x i x ¯ ) ( x j x ¯ )   i = 1 n ( x i x ¯ ) 2
S 0 = i = 1 n j = 1 n w i , j
where n is the number of space units; Yi and Yj are the attribute values of units i and j; x ¯ is the average of the selected attribute; Wi,j signifies the adjacent degree between units i and j and Wi,j = 1, when i and j are adjacent, otherwise Wi,j = 0. Moran’s I is between −1 and 1 and I > 0 means that the attribute values of adjacent units are similar spatially and I < 0 means that there is no spatial similarity. S0 is the aggregate of all spatial weights.
The global Moran index indicates the correlation between an observation and its neighbor units but cannot measure the spatial arrangement. As a supplementary, local Moran index (Ii) can be used to capture possible local patterns of spatial autocorrelation and identify the location of the spatial clusters with similar values or outliers [40]. The indices that are significantly high and positive indicate the presence of unit clusters with similar values, while low values indicate the no similarity among the selected units [41]. Further, Z and p-values are used to evaluate the significance of similarity of the target unit and its adjacent units. The local Moran index is expressed as Equations (3) and (4).
I i = ( x i x ¯ ) S i 2 j = 1 ,   j i n w i , j   ( x j x ¯ )
Z = I i E   ( I i ) S   ( I i )
where xi is the value of the selected attribute of unit i, xj is the value of the selected attribute of unit i, x ¯ is the average value of the selected attribute, wk,l is the weight signifies the adjacent degree between units i and j and n is the number of space units. Z is the standardized statistical value of global Moran’s I. E(Ii) and S(Ii) are the theoretical average and variance of Moran index for all units in the region.
We calculated the global Moran index I, local Moran index (Ii) and their Z and p-values for each county, using the spatial autocorrelation (Moran’s I) and hot spot analysis (Getis–Ord Gi *) tools in the ArcMap software, respectively. Based on the Z and p-values, all county units were classified into 7 clustering patterns (Table 2). HH, HM, HL indicate counties that have higher soybean production and the similarity to its neighboring counties are high, medium and low, respectively; LH, LM, LL indicate counties that have lower soybean production and the similarity to its neighboring counties are high, medium and low, respectively; NS pattern indicates no significant similarity.

2.4. Factor Decomposition

Factor decomposition method was used to calculate the contribution rates to the change of total production by yield and sown area, based on the time series data [32]. The equations for each county are shown as below:
C y , i + 1 = ( Y i + 1 Y i ) S i / ( T i + 1 T i )
C S , i + 1 = ( S i + 1 S i ) Y i + 1 / ( T i + 1 T i )
where Cy, i+1 and CS, i+1 are the contribution rates by yield and sown area; i is the serial number of the yield and i = 1, 2, … 11. Yi+1 and Yi are the soybean yield in the (i + 1)-th and i–th years. Si+1 and Si are sown area in the (i + 1)-th and i–th years. Pi+1 and Pi are the total production in the (i + 1)-th and i–th years.

3. Results

3.1. Spatiotemporal Dynamics of Soybean Production

3.1.1. Spatiotemporal Changes of Soybean Production

Total production of soybean in the NCP significantly declined by 46.1% from 4.35 Mt in 1998 to 2.34 Mt in 2015 (R2 = 0.539, p < 0.01), except for the short period of 2003–2006, during which the production restored from the lowest amount of 2.37 Mt in 2003 to 3.54 Mt in 2006 (Figure 2). Anhui and Henan were the largest two soybean production provinces, in which the soybean outputs were 1.33 and 0.86 Mt in 1998 and then decreased by 32.2% and 19.0% in 2015, respectively. The sum of production in other provinces showed a much higher decrease rate, reduced by 65.6% from 2.16 to 0.74 Mt during 1998–2015.
Soybean production showed obviously spatial changes during 1998–2015 (Figure 3). In 1998, there were 53 counties producing more than 20.0 Kt soybean, 37 counties mainly distributed in the southern and northeastern NCP, producing 20.0–40.0 Kt and 16 counties located in the south, producing more than 40.0 Kt. In the remaining 186 counties spreading over the NCP and 88 counties mainly located in the northwestern and central parts, the production was between 5.0 and 20.0 Kt and was less than 5.0 Kt, respectively. Subsequently, the counties with the production below 5.0 Kt were expanded from north to south rapidly and in 2015 the total number accounted for 65.7% (215) of all counties, involving almost all counties in the northern southwestern and southeastern NCP. However, the counties with production between 5.0 and 20.0 Kt disappeared gradually in northern regions and shrank to 87 counties of the south in 2015, and the counties exceeding 20.0 Kt reduced to 25, mainly concentrated in the south–central regions (Figure 3a–e).
Based on the Sen’s slope approach, the change rate of soybean production in each county during 1998–2015 was obtained [32] and mapped in Figure 3f. The results showed that the total production of soybean decreased in 80.4% (263) counties throughout the NCP. The decrease rate varied from 1.7 to 494.8 t/yr in 178 counties and from 510.9 to 9877.2 t/yr in 98 counties, mainly located in northeastern and central parts. In other 51 counties, the production increased, at a rate of 3.7–3533.0 t per year. Among these counties, 20 counties showed a higher increase rate, averagely increased by more than 500 t/yr, mainly concentrated in the south–central NCP.

3.1.2. Spatial Statistics of Clustering Characteristics

The value of global Moran index was above zero and the p-values were less than 0.01 in all over the years, indicating the existence of spatial cluster patterns significantly in the NCP (Table 3). From 1998 to 2015, the index was significantly increased from 0.270 to 0.380 (R2 = 0.560, p < 0.01) and the Z values increased from 7.312 to 9.721, suggesting that the degree of spatial clustering for soybean production was increasing gradually, particularly in Hebei and Anhui provinces, which were the major soybean production areas.
The results of clustering analysis showed that the high production counties with high clustering degree were mainly concentrated in the south–central part, while low production counties with low clustering characteristic were mainly distributed in the northwest (Figure 4). The HH cluster appeared in the southern NCP since the beginning of the study period and its location and extent were changed with relatively small amplitude over time. In 1998, for instance, the HH cluster comprised of 40 counties in Anhui and Henan provinces, and then it was shrunk to 31 counties in 2003, and the disappeared counties were mainly located in Anhui province. Thereafter, it extended westwards in Henan province, but its number of counties decreased from 68 counties in 2011 to 35 in 2015. Both of the HM and HL clusters covered rather less counties, mainly distributed around the HH cluster. Different from the HH cluster, the LL cluster was mainly located in the northern region and the change amplitudes of its extent and location were far larger than that of HH cluster. In 1998, it covered 14 counties, located in Hebei province, but in 2011, the extent expanded around obviously, and its number of counties increased to 106 counties dramatically. However, these counties disappeared completely in other years as 2003, 2007 and 2015. Additionally, the clusters of LM and LL covered 50–107 counties in Hebei and Shandong provinces and the clustering characteristic was not significant in other regions (Figure 4a–e).

3.2. Contribution of Yield and Sown Area

3.2.1. Spatiotemporal Changes of Yield and Sown Area

During 1998–2015, the sown area of soybean decreased from 2.18 to 1.17 Mha, with an annual change rate of −3.49%. The yield showed an increase trend, but the amplitude was rather small, only 0.01 t/ha/yr. Similar to the total production, the sown area and yield also showed a phased variation. The sown area decreased during the periods of 1998–2003 and 2006–2015 but increased (by 6.32%) from 2003 to 2006. Regarding to the yield, it increased from 1.99 to 2.27 t/ha from 1998 to 2009, but then decreased and returned to 2.00 t/ha again in 2015.
In more than 85% of counties (280) in the NCP, soybean area showed a decreasing trend, and in 89 counties scattered all over the NCP, the decrease rate exceeded 0.2 k ha/yr. The sown area increased in 47 counties, mainly distributed in Anhui, Henan and Jiangsu provinces, and in 17 counties, the increase amplitude was more than 0.2 k ha per year (Figure 5a). The changes of yield and sown area differed spatially, for instance, the yield change rate in northern counties was higher than that in the south. Yield showed an increase trend in 251 counties, mostly distributed in the eastern Hebei and southern Shandong provinces, where soybean yield increase rate was more than 40 kg/ha per year (Figure 5b). In other 74 counties, yield showed a decreasing trend, of which 19 counties showed the yield decreased at a rate of 40–78.9 kg/ha per year.

3.2.2. Contribution Rates to Total Production by Yield and Sown Area

During 1998–2015, only 16.1% of the change in total soybean production was contributed by yield changes, and 83.9% of total production change was caused by the sown area variation for the whole NCP. The contribution rates of both yield and sown area to total production fluctuated largely during the period. Before 2010, the contribution rate of sown area change was higher than yield, but it became lower thereafter. Further linear regression indicated that the difference was widening gradually after 2013 (Figure 6).
At county level, the contribution rates to production change by yield and sown area were rather similar to that at the regional level. The sown area change contributed more than 50% of production change in 181 counties, distributed in northern NCP (Figure 7a). The contribution rate of yield was more than 50% in 146 counties, mainly located in the southern part (Figure 7b). Summarily, the total production change was mainly contributed by the yield change in the southern NCP, while in the north it was mainly caused by the sown area.

4. Discussion

4.1. Variation of Soybean Production

Our results showed that the total production of soybean decreased dramatically in the NCP during 1998–2015, except for the increase during 2003–2006. The short increase was mainly promoted by the policy implementation. In 1998, the government initiated the Grain for Green Project to mitigate the land degradation, by supplying attractive subsidies to the farmers who returned the sloping croplands to forests or grasslands [42,43]. This policy stimulated overconversion of croplands, and thus affected farmer’s enthusiasm for grain production. This caused decline of crop production over the whole China, and thus the soybean production in the NCP was also impacted, resulting in continuously decreasing of the sown area and total production from 1998 to 2003. Recognizing this problem, the government strictly regulated the scope of cropland conversion in 2004 and implemented series of policy measures including the exemption of agricultural taxes and increase of direct subsidies to crop production [44]. These policies mobilized the farmer’s enthusiasm of planting crop including soybean. Under the effects of these policies, the soybean production in the NCP got a short recovery growth during 2003–2006.
After 2006, soybean production in the NCP experienced a decrease again, mainly due to shrinkage of the sown area. This decrease could be mainly caused by the low benefit and expanding return gaps compared to maize production. Although total inputs and production costs of maize were higher than soybean (Figure 8a), the average gross and net return of maize per hectare were around 29.2% and 15.9% higher than that of soybean, respectively (Figure 8b,c). These large return gaps promoted the farmers to grow more maize instead of soybean. In addition, the price of imported soybeans from international trade was 13.5–54.7% lower than the domestic price during 1998–2015 [45], which compressed the room to increase the soybean price, causing the sustained low price in China. Furthermore, the government paid more attention to increase grain production, and less effort and insufficient subsidy was given to soybean production, due to its much lower (66.4–71.6%) yield than maize (Figure 8d). As a result, farmers lost their enthusiasm to plant soybeans, resulted in gradual reduction of the sown area.
With Pearson regression analysis, we calculated the correlation coefficients of soybean production with the gaps of cost, gross and net returns from maize in the NCP during 1998–2015, respectively (Table 4). The results suggest that the gross return gap between maize and soybean had the most significant correlation with total soybean production (R = −0.726, p < 0.05) and sown area (R = −0.841, p < 0.05), but the net return gap was not significant. The gap between domestic and international trade prices of soybean also showed significant influences on the sown area (R = −0.556, p < 0.05) and total production (R = −0.320). Therefore, the changes in soybean production were rather sensitive to the relative benefit compared to maize in the NCP.

4.2. Statistical Techniques and Production Clusters

Understanding the spatiotemporal dynamics and clustering characteristics of grains over time is important for regional agricultural planning. The global and local Moran indices adopted in this study have been applied in some agricultural studies and are able to reveal the spatial clusters of soybean production [26,46,47,48]. They are useful tools to identify the hot plots of agricultural development for a specific region, supporting the regional planning of crop production.
From the values of global Moran indices, it could be concluded that the soybean production in the NCP generally showed a strong clustering characteristic, and the clustering degree was enhanced annually, implying that the soybean production areas tended to concentrate. Regionally, the soybean production significantly concentrated in and shifted to Anhui and Henan provinces, from covering 30.7% and 19.7% of the total in the NCP in 1998, increased to 38.6% (R2 = 0.678, p < 0.01) and 29.7% (R2 = 0.324, p < 0.05) in 2015, respectively. Accordingly, the proportion sum of soybean area in these two provinces was increased significantly from 53.2% to 75.2% of the total sown area (R2 = 0.872, p < 0.01). The reasons could be mainly attributed to the risk tolerance ability of household and farmers’ planting habits. For instance, in these two provinces, the weather and soil conditions were relatively unfavorable, and crop production was frequently affected by extreme weather hazards including high temperature and rainstorms, resulting in production losses of maize and soybean [49,50], and the yields of maize and soybean were lower than other regions [51,52,53]. Compered to soybean, growing maize suffered greater economic risks, because maize required more material and capital inputs than soybean (Figure 8b). Thus, local farmers preferred to plant soybeans, although the net return of soybean was lower than maize in normal years. Furthermore, our household surveys indicated that they had the tradition to grow soybean for many years, as maize planting required more labor for the management.

4.3. Implications

The import dependence of soybean in China approached 90% in 2019, which may be a potential threat to the food security. Given the possible risks of trade friction, it is necessary for China to increase soybean production and improve the self-supply level. To this end, the NCP, a main production region of soybean in China, should be promoted to recover the soybean production in the traditional growing areas with high clustering characteristics, such as the Henan plain and northern Anhui. As the first aim, it is suggested that the sowing area of soybean in the NCP should be gradually restored to the level of 1998, i.e., 2.18 Mha, by compressing the sowing area of summer maize. This can also help resolve the over-production problem of maize recently [54,55,56], to reduce the gap of soybean demand and thus contribute to food security in China.
Expanding of soybean area can reduce chemical fertilizer use and thus benefit the environment. The currently practiced wheat-maize double cropping pattern is highly efficient in grain production, but it needs high fertilizer and water inputs, and thus has high risk of agrochemical contamination to soil [57,58]. For instance, problems such as excessive heavy metal content, soil compaction, acidification, decreased fertility and imbalanced nutrition were reported in some regions of the NCP [59,60,61]. Furthermore, crop production in the NCP heavily relies on irrigation. The expansion of irrigated area to increase grain production has caused severe water problem [62]. Several studies reported that the groundwater was depleted increasingly since 1960s, especially in the northern NCP with scarce water resources [14,63,64]. Changing summer maize to soybean could be an effective way to alleviate these problems, because maize production requires much higher inputs of fertilizers and water than soybean [14,58]. Therefore, the wheat-maize double cropping system should be partly converted to wheat-soybean growing pattern in the NCP. In addition, high-yield varieties should be adopted to improve soybean yield, and thus increase the return of soybean production and reduce the dependence on subsidy.

5. Conclusions

This study presented a procedure to reveal spatiotemporal dynamics and spatial clustering characteristic of soybean production in the NCP, by combined use of the methods of spatial autocorrelation, factor decomposition and GIS-based spatial analysis. With the analyses, the soybean production changes and its regional clustering patterns during 1998–2015 in the NCP were revealed, helping to identify the hot plots for soybean production development and thus supporting the regional agricultural planning. The results indicated that the total production of soybean decreased dramatically from 1998 to 2015, mainly caused by the shrinkage of sown area due to decreasing benefit. This implies that if the benefit is improved, the reduced areas of soybean production in the NCP can be restored to contribute to the national soybean revitalization strategy. Two regions identified were the main soybean production areas of the NCP during 1998–2015, which had significant clustering characteristics, and the clustering degree was enhanced during the period. One is located in south–central NCP with higher clustering characteristic and higher production, and another one is located in northwestern NCP with relatively low clustering characteristic and low production. To stimulate soybean production in the NCP and thus contribute to China’s soybean revitalization, development priorities of soybean production should be given to these two regions, aimed first, to restore the soybean growing area to the level of 1998. To this end, appropriate subsidy policies to soybean production are very necessary and should be adopted, to make the return at an acceptable level.

Author Contributions

C.L. promoted the research issue and revised the manuscript; Z.Z. detailed the research procedure, analyzed the data and wrote the manuscript. All authors have read and agreed to the published version of the manuscript.

Funding

This research was funded by the National Natural Science Foundation of China (41671093) and the National Key Research and Development Program of China (2017YFA0604701).

Acknowledgments

We appreciate the constructive comments from the four anonymous reviewers.

Conflicts of Interest

The authors declare no conflicts of interest.

References

  1. Bai, Z.; Ma, W.; Ma, L.; Velthof, G.L.; Wei, Z.; Havlik, P.; Oenema, O.; Lee, M.R.F.; Zhang, F. China’s livestock transition: Driving forces, impacts, and consequences. Sci. Adv. 2018, 4, e8534. [Google Scholar] [CrossRef] [PubMed] [Green Version]
  2. FAO. Statistical Database, FAO. 2016. Available online: http://www.fao.org/faostat/en/#data/QC (accessed on 25 May 2019).
  3. Scheneider, M.; Sharma, S. China’s Pork Miracle? Agribusiness and Development in China's Pork Industry; Institute for Agriculture and Trade Policy: Minneapolis, MN, USA, 2014. [Google Scholar]
  4. Sheng, Y.; Song, L. Agricultural production and food consumption in China: A long-term projection. China Econ. Rev. 2019, 53, 15–29. [Google Scholar] [CrossRef]
  5. Wilkinson, J.M.; Lee, M.R.F. Review: Use of human-edible animal feeds by ruminant livestock. Animal 2018, 12, 1735–1743. [Google Scholar] [CrossRef] [PubMed]
  6. Ely, A.; Geall, S.; Song, Y. Sustainable maize production and consumption in China: Practices and politics in transition. J. Clean. Prod. 2016, 134, 259–268. [Google Scholar] [CrossRef] [Green Version]
  7. NBSC. China Statistical Yearbook; China Statistics Press: Beijing, China, 2016. [Google Scholar]
  8. Dong, W.; Wang, X.; Yang, J. Future perspective of China’s feed demand and supply during its fast transition period of food consumption. J. Integr. Agric. 2015, 14, 1092–1100. [Google Scholar] [CrossRef]
  9. Chen, Y.; Lu, C. A Comparative Analysis on Food Security in Bangladesh, India and Myanmar. Sustainability 2018, 10, 405. [Google Scholar] [CrossRef] [Green Version]
  10. Wang, J.; Li, Y.; Huang, J.; Yan, T.; Sun, T. Growing water scarcity, food security and government responses in China. Glob. Food Secur. 2017, 14, 9–17. [Google Scholar] [CrossRef]
  11. Huang, J.; Yang, G. Understanding recent challenges and new food policy in China. Glob. Food Secur. 2017, 12, 119–126. [Google Scholar] [CrossRef]
  12. Jin, S.; Ma, H.; Huang, J.; Hu, R.; Rozelle, S. Productivity, efficiency and technical change: Measuring the performance of China’s transforming agriculture. J. Product. Anal. 2010, 33, 191–207. [Google Scholar] [CrossRef]
  13. Zeng, X. The Strategic Planning of Soybean Industry Development in China. Chin. J. Agric. Resour. Reg. Plan. 2017, 38, 89–97. (In Chinese) [Google Scholar]
  14. Shen, Y.; Sui, P.; Huang, J.; Wang, D.; Whalen, J.K.; Chen, Y. Global warming potential from maize and maize-soybean as affected by nitrogen fertilizer and cropping practices in the North China Plain. Field Crop. Res. 2018, 225, 117–127. [Google Scholar] [CrossRef]
  15. Wu, Y.; Wang, E.; Miao, C. Fertilizer Use in China: The Role of Agricultural Support Policies. Sustainability 2019, 11, 4391. [Google Scholar] [CrossRef] [Green Version]
  16. Sun, L.; Qi, M.; Reed, M.R. The effects of soybean trade policies on domestic soybean market in China during the food crisis. China Agric. Econ. Rev. 2018, 10, 372–385. [Google Scholar] [CrossRef]
  17. Yu, Y.; Feng, K.; Hubacek, K.; Sun, L. Global Implications of China’s Future Food Consumption. J. Ind. Ecol. 2016, 20, 593–602. [Google Scholar] [CrossRef] [Green Version]
  18. Sun, J.; Mooney, H.; Wu, W.; Tang, H.; Tong, Y.; Xu, Z.; Huang, B.; Cheng, Y.; Yang, X.; Wei, D.; et al. Importing food damages domestic environment: Evidence from global soybean trade. Proc. Natl. Acad. Sci. USA 2018, 115, 5415–5419. [Google Scholar] [CrossRef] [Green Version]
  19. Guo, Z.; Zhao, X. Evolution and structure optimization of grain and cash crops in Shandong province. Chin. J. Agric. Resour. Reg. Plan. 2017, 38, 164–171. (In Chinese) [Google Scholar]
  20. Ministry of Agriculture and Rural Affairs of the People’s Republic of China. Implementation Plan of Soybean Revitalization Plan. Available online: http://www.moa.gov.cn/nybgb/2019/0201903/201905/t20190525_6315395.htm (accessed on 14 July 2020). (In Chinese)
  21. Chen, X.; Gu, H.; Zhang, H.; Chen, H.; Yuan, X. The history, present and prospect of soybean production development in Jiangsu Province. Jiangsu Agric. Sci. 2011, 1, 6–9. (In Chinese) [Google Scholar]
  22. Li, S.; Li, J.; Zhao, Y.; Zhou, Y.; Huang, X. Present situation and development countermeasure of soybean production in Shandong province. Shandong Agric. Sci. 2010, 9, 123–124. (In Chinese) [Google Scholar]
  23. Liu, D.; Liu, S.; Wen, X. Spatial-Temporal Evolution of Grain Production Structure in Northeast China. Econ. Geogr. 2018, 39, 163–170. (In Chinese) [Google Scholar]
  24. Maranhão, R.L.A.; De Carvalho Júnior, O.A.; Hermuche, P.M.; Gomes, R.A.T.; McManus Pimentel, C.M.; Guimarães, R.F. The Spatiotemporal Dynamics of Soybean and Cattle Production in Brazil. Sustainability 2019, 11, 2150. [Google Scholar] [CrossRef] [Green Version]
  25. Araújo, M.L.S.D.; Sano, E.E.; Bolfe, É.L.; Santos, J.R.N.; Dos Santos, J.S.; Silva, F.B. Spatiotemporal dynamics of soybean crop in the Matopiba region, Brazil (1990–2015). Land Use Policy 2019, 80, 57–67. [Google Scholar] [CrossRef]
  26. Zhang, L.; Zhu, L.; Yu, M.; Zhong, M. Warming decreases photosynthates and yield of soybean [Glycine max (L.) Merrill] in the North China Plain. Crop J. 2016, 4, 139–146. [Google Scholar] [CrossRef] [Green Version]
  27. Wang, J.; Zhang, Z.; Liu, Y. Spatial shifts in grain production increases in China and implications for food security. Land Use Policy 2018, 74, 204–213. [Google Scholar] [CrossRef]
  28. Xu, S.; Wu, J.; Song, W.; Li, Z.; Li, Z.; Kong, F. Spatial-temporal changes in grain production, consumption and driving mechanism in China. J. Integr. Agric. 2013, 12, 374–385. [Google Scholar] [CrossRef]
  29. Cima, E.G.; Uribe-Opazo, M.A.; Johann, J.A.; Da Rocha, W.F., Jr.; Dalposso, G.H. Analysis of spatial autocorrelation of grain production and agricultural storage in Parana. Eng. Agric. Jaboticabal. 2018, 38, 395–402. [Google Scholar] [CrossRef]
  30. Wang, J.; Liu, Y. The changes of grain output center of gravity and its driving forces in China since 1990. Resour. Sci. 2009, 31, 1188–1194. (In Chinese) [Google Scholar]
  31. Gao, J.; Qiao, W.; Liu, Y.; Li, Y.; Tu, W.; Zhang, Y. The higher grain production, the more social deprivation? A case study of Henan province in traditional agricultural areas of China. J. Mt. Sci. Engl. 2018, 15, 167–180. (In Chinese) [Google Scholar] [CrossRef]
  32. Zhang, Z.; Lu, C. Spatio-temporal pattern change of winter wheat production and its implications in the North China Plain. Sustainability 2019, 11, 3028. [Google Scholar] [CrossRef] [Green Version]
  33. Lu, C.; Fan, L. Winter wheat yield potentials and yield gaps in the North China Plain. Field Crop. Res. 2013, 143, 98–105. [Google Scholar] [CrossRef] [Green Version]
  34. Wu, D.; Fang, S.; Li, X.; He, D.; Zhu, Y.; Yang, Z.; Xu, J.; Wu, Y. Spatial-temporal variation in irrigation water requirement for the winter wheat-summer maize rotation system since the 1980s on the North China Plain. Agric. Water Manag. 2019, 214, 78–86. [Google Scholar] [CrossRef]
  35. Li, Y.; Pan, S.; Miao, C. The spatial-temporal patterns of per capita share of grain at the county level in China: A comparation between registered population and resident population. Acta Geogr. Sin. 2014, 69, 1753–1766. (In Chinese) [Google Scholar]
  36. Deng, Z.; Feng, Y.; Zhang, J.; Wang, J. Analysis on the characteristics and tendency of grain production’s spatial distribution in China. Econ. Geogr. 2013, 33, 117–123. (In Chinese) [Google Scholar]
  37. Moran, P.A.P. The interpretation of statistical maps. J. R. Stat. Soc. 1948, 10, 243–251. [Google Scholar] [CrossRef]
  38. Anselin, L. Exploring Spatial Data with GeoDaTM: A Workbook; Urbana Champaign: Champaign, IL, USA, 2005; p. 244. [Google Scholar]
  39. Câmara, G.; Carvalho, M.S.; Cruz, O.G.; Correa, V. Análise espacial de áreas. In Análise Espacial De Dados Geográficos; Fuks, S.D.C.M., Ed.; INPE: São José dos Campos, Brazil, 2002; p. 44. [Google Scholar]
  40. Anselin, L. Local indicators of spatial association-LISA. Geogr. Anal. 1995, 27, 93–115. [Google Scholar] [CrossRef]
  41. Zhang, T.; Lin, G. On Moran’s I coefficient under heterogeneity. Comput. Stat. Data Anal. 2016, 95, 83–94. [Google Scholar] [CrossRef]
  42. Chen, J.; Jinbao, L.; Shaoyong, F.; Qiang, L. Chinese agricultural policies in thirty years and analysis on the effects. Chin. Popul. Resour. Environ 2008, 18, 1–6. (In Chinese) [Google Scholar]
  43. Liu, Y.; Wang, C.; Tang, Z.; Nan, Z. Farmland rental and productivity of wheat and maize: An empirical study in Gansu, China. Sustainability 2017, 9, 1618. [Google Scholar] [CrossRef] [Green Version]
  44. Sun, D.F.; Li, H.; Dawson, R.; Tang, C.J.; Li, X.W. Characteristics of steep cultivated land and the impact of the Grain-for-Green Policy in China. Pedosphere 2006, 16, 215–223. [Google Scholar] [CrossRef]
  45. FAO. FAOSTAT, FAO. 2016. Available online: http://www.fao.org/faostat/en/#data/QC (accessed on 15 February 2019).
  46. Bai, L.; Zhang, L.; Liu, R.; Lin, C.; Men, M. Regional difference research of grain per unit area yield in Hebei province base on ESDA. J. Agric. Mech. Res. 2012, 1, 18–24. (In Chinese) [Google Scholar]
  47. Cho, S.; Newman, D.H. Spatial analysis of rural land development. For. Policy Econ. 2005, 7, 732–744. [Google Scholar] [CrossRef]
  48. Donfouet, H.P.P.; Barczak, A.; Détang-Dessendre, C.; Maigné, E. Crop production and crop diversity in France: A spatial analysis. Ecol. Econ. 2017, 134, 29–39. [Google Scholar] [CrossRef]
  49. Tan, F.; Wang, J.; Song, Y. Impacts of climate warming on trend of meteorological disasters in the North China Plain. J. Nat. Disasters 2010, 19, 125–131. (In Chinese) [Google Scholar]
  50. Yang, Y.; Wang, J.; Hou, L.; Huang, J. Extreme drought events and rural poverty: Differences on farmers’ adaptive behavior and production impacts among different income groups in North China Plain. China Popul. Resour. Environ. 2018, 28, 124–133. (In Chinese) [Google Scholar]
  51. Tao, F.; Zhang, S.; Zhang, Z.; Rotter, R.P. Temporal and spatial changes of maize yield potentials and yield gaps in the past three decades in China. Agric. Ecosyst. Environ. 2015, 208, 12–20. [Google Scholar] [CrossRef]
  52. Li, E.; Wei, S.; Xu, Y. An analysis of the evolution and mechanism of China’s soybean planting agglomeration and geographic pattern. Econ. Surv. 2016, 33, 37–42. (In Chinese) [Google Scholar]
  53. Li, X.; Liu, H.; Yang, Y. Production factors’ investment of households under drought on the Northern China Plain. Resour. Sci. 2015, 37, 2261–2270. (In Chinese) [Google Scholar]
  54. Wang, J.; Wei, J. Study on the reform of agricultural supply side based on food security. Asian Agric. Res. 2017, 9, 8–10. [Google Scholar]
  55. Guo, K. Issues and recommendations on supply-side structural reform of maize in China. Am. J. Agric. For. 2018, 6, 176–181. [Google Scholar]
  56. Zhou, Z.; Luo, Q.; Liu, Y.; Gao, M.; Zhang, Q. Discussion on agricultural supply side reform in China. Chin. J. Agric. Resour. Reg. Plan. 2017, 38, 22–25. (In Chinese) [Google Scholar]
  57. Lu, X.; Han, X.; Zou, W.; Zhang, J.; Wang, L.; Yang, Y.; Wang, Y.; Ni, F. Effects of reduced fertilization on yield and economic benefit in soybean and maize. Soil Crop. 2016, 5, 240–247. (In Chinese) [Google Scholar]
  58. Yin, Z.; Qin, X.; Li, C. Study on water consumption and deficiency of main crops in Northeastern China. Sci. Technol. Rev. 2009, 27, 42–49. (In Chinese) [Google Scholar]
  59. Lu, J.; Zhang, Y.; Wang, X.; Zhao, G.; Zhang, C. Effect of long-term single application of chemical fertilizer on soil properties and crop yield. Chin. J. Appl. Ecol. 2001, 12, 569–572. (In Chinese) [Google Scholar]
  60. Liu, Q.; Lin, Z.; Zhou, L. Spatio-temporal differentiation and environmental risk assessment of fertilization in Shandong Province, China. Trans. Chin. Soc. Agric. Eng. 2015, 31, 208–214. (In Chinese) [Google Scholar]
  61. Zhao, B.; Chen, J.; Zhang, J.; Xin, X.; Hao, X. How different long-term fertilization strategies influence crop yield and soil properties in a maize field in the North China Plain. J. Plant Nutr. Soil Sci. 2013, 176, 99–109. [Google Scholar] [CrossRef]
  62. Zhang, L.; Xia, J.; Hu, Z. Situation and problem analysis of water resource security in China. Resour. Environ. Yangtze Basin 2009, 18, 116–120. (In Chinese) [Google Scholar]
  63. Yang, X.; Chen, Y.; Pacenka, S.; Steenhuis, T.S.; Sui, P. Managing food and bioenergy crops with declining groundwater levels in the North China Plain. Field Crop. Res. 2019, 234, 1–14. [Google Scholar] [CrossRef]
  64. Liu, X.; Pan, Y.; Zhu, X.; Yang, T.; Bai, J.; Sun, Z. Drought evolution and its impact on the crop yield in the North China Plain. J. Hydrol. 2018, 564, 984–996. [Google Scholar] [CrossRef]
Figure 1. Land use classification of the North China plain (European Space Agency, 2015).
Sustainability 12 06178 g001
Figure 2. Variation of total soybean production during 1998–2015 in different provinces and the North China plain.
Sustainability 12 06178 g002
Figure 3. Spatiotemporal distribution of soybean production in (a) 1998, (b) 2003, (c) 2006, (d) 2011 and (e) 2015 and (f) their average annual change rates during 1998–2015 at county level in the North China plain.
Sustainability 12 06178 g003
Figure 4. Spatial distribution of clustering patterns of soybean production in (a) 1998, (b) 2003, (c) 2006, (d) 2011 and (e) 2015 at county level in the North China plain. HH, HM, HL indicate high production patterns with high, moderate and low clustering characteristics; LL, LM, LH indicate low production patterns with high, moderate and low clustering characteristics, respectively. NS indicates no clustering significance.
Sustainability 12 06178 g004
Figure 5. Change rates of the (a) sown area and (b) yield of soybean at county level in the North China plain during 1998–2015.
Sustainability 12 06178 g005
Figure 6. Contribution rates to the change of total soybean production by yield and sown area in the North China plain from 1998 to 2015 (the sum of contribution rate by yield and sown area is 1).
Sustainability 12 06178 g006
Figure 7. Average contribution rates by (a) sown area and (b) yield to soybean total production at county level in the North China plain during 1998–2015 (the sum of contribution rates by yield and area is 1).
Sustainability 12 06178 g007
Figure 8. Comparison of (a) yield, (b) total cost, (c) gross return and (d) net return of soybean and maize per hectare in the North China plain during 1998–2015.
Sustainability 12 06178 g008
Table 1. Data sources of agricultural product cost and benefits.
Province/MunicipalitySelected CountiesSurveyed HouseholdsSample Area (Ha)
Beijing739392.75
Tianjin43310.29
Hebei3530589.61
Jiangsu3534582.17
Anhui1415544.77
Shandong50494143.34
Henan3519773.13
Total1801568836.07
Table 2. Clustering patterns and the criteria of indicators based on local spatial autocorrelation.
PatternZ valuep-ValueSimilarity DegreeYield Level
HH2.58 ≤ Zp ≤ 0.01HighHigher than average
HM1.96 ≤ Z < 2.580.01 < p ≤ 0.05Medium
HL1.65 ≤ Z < 1.960.05 < p ≤ 0.1Low
NS|Z| < 1.650.1 < pNo significance/
LL−1.96 < Z ≤ −1.650.05 < p ≤ 0.1LowLower than average
LM−2.58 < Z ≤ −1.960.01 < p ≤ 0.05Medium
LHZ ≤ −2.58p ≤ 0.01High
Note: HH, HM, HL indicate high production patterns with high, moderate and low clustering characteristics; LL, LM, LH indicate low production patterns with high, moderate and low clustering characteristics, respectively. NS indicates no clustering significance.
Table 3. Global Moran index for the soybean production in the North China plain during 1998–2015.
YearMoran IndexZ Valuep-ValueResult
19980.2707.3120.000grouped
19990.3288.2460.000grouped
20000.3037.6680.000grouped
20010.3208.0570.000grouped
20020.3358.5560.000grouped
20030.2326.0090.000grouped
20040.3468.8750.000grouped
20050.3529.0500.000grouped
20060.3569.3020.000grouped
20070.3509.2540.000grouped
20080.3629.4760.000grouped
20090.3789.7570.000grouped
20100.3789.7450.000grouped
20110.3809.6880.000grouped
20120.3679.5250.000grouped
20130.3639.4700.000grouped
20140.3799.7710.000grouped
20150.3809.7210.000grouped
Note: p = 0.000 indicates significant (p < 0.01).
Table 4. Pearson coefficients among the soybean production and the gap of economic variables between maize and soybean in the NCP during 1998–2015.
ItemTotal Cost GapGross Return GapNet Return GapMarket Price Gap
Total production−0.666 **−0.726 **−0.255−0.320
Sown area−0.675 **−0.841 **−0.069−0.556 **
Note: total cost gap, gross return gap and net return gap indicates the gap between maize and soybean. The market price gap is the gap between domestic and international trade prices of soybean. ** indicates significant (p < 0.05).

