Abstract
Peer-to-peer markets are especially suitable for the analysis of online ratings as they represent two-sided markets that match buyers to sellers and thus lead to reduced scope for opportunistic behavior. We decompose the online ratings by focusing on the customer’s decision-making process in a leading peer-to-peer ridesharing platform. Using data from the leading peer-to-peer ridesharing platform BlaBlaCar, we analyze 17,584 users registered between 2004 and 2014 and their online ratings focusing on the decomposition of the explicit determinants reflecting the variance of online ratings. We find clear evidence to suggest that a driver’s attitude towards music, pets, smoking, and conversation has a significantly positive influence on his received online ratings. However, we also show that the interaction of female drivers and their attitude towards pets has a significantly negative effect on average ratings.
1. Introduction
Due to the high volume of user-generated ratings per product in peer-to-peer markets, customers must make a selection to reviews when they search for reliable products or services. Peer-to-peer markets are especially suitable for analyzing online ratings as they represent two-sided markets that match buyers to sellers and thus lead to a reduced scope for opportunistic behavior [1,2]. Normally, studies on peer-to-peer markets focus on classic markets such as eBay or Amazon. As a result, a well-developed body of literature exists on the effect of consumer ratings on market performance in these classic peer-to-peers markets [3,4]. However, few studies have attempted to decompose online ratings either on traditional two-sided markets or on emerging peer-to-peer markets, i.e., ridesharing, accommodation, or home services. Therefore, the aim of this study is twofold. First, we aim to decompose the online ratings by focusing on the customer’s decision-making process in a leading peer-to-peer platform. Second, our study is the first empirical attempt in the context of the ridesharing market—a fast-growing market that has generated a turnover of $20.4 million in 2016. Specifically, we are interested in the following: How can we decompose the variance of online consumer ratings? In which context are the specific determinants of online ratings? How do these determinants interact with each other to indicate an observable product quality?
Ridesharing has become global, with China emerging as the global player for future growth through a current market value of $10,184 million in 2017. Ridesharing is also spreading deep roots in the United States ($11,790 million in 2017), the United Kingdom ($1576 million in 2017), Japan ($617 million in 2017), and Germany ($532 million in 2017), despite given regulatory pushbacks. The ridesharing market can be divided into three segments: the online carpooling platforms that help users organize carpools (e.g., BlaBlaCar), the online platforms that let users book rides offered by drivers using their private passenger cars (e.g., Uber and Lyft), and taxi companies that offer their services through an app (e.g., myTaxi). All segments together share a worldwide revenue of $31,893 million in 2017, with an expected annual growth rate of 21.8% resulting in a market volume of $70,126 million in 2021. The number of users in the ridesharing market amounts to 338 million in 2017. The average revenue per user currently amounts to $94.36.
Using data from the leading peer-to-peer ridesharing platform BlaBlaCar, we analyze 17,584 users registered between 2004 and 2014 and their online ratings, focusing on analyzing the explicit determinants reflecting the variance of online ratings. BlaBlaCar, which was founded in 2006, emerged to the world’s leading long-distance ridesharing community, connecting people looking to travel long distances with drivers going the same way and thus sharing the costs of the journey. Nowadays, BlaBlaCar operates in 22 countries, including most parts of Europe, Turkey, India, and Russia. In 2016, the company had raised $200 million, primarily from American investors, to conquer the North American market, which valued BlaBlaCar at $1.6 billion. Approximately 20 million people use the ridesharing platform spread across three continents—over 2 million users on a monthly basis. Equivalent to similar peer-to-peer markets, members are asked to create a personal online profile, which includes ratings and reviews by other members. Additionally, the members’ online profiles show how much experience they have in the service (on a four-point scale) and how chatty they are (on a three-point scale).
We find clear evidence to suggest that drivers’ attitudes towards music, pets, smoking, and conversations have a significantly positive influence on their received online ratings. Drivers significantly increase their average online rating if they drive a silver or black car and verify their email address. Although we find a significant negative effect of female drivers on the submitted online ratings, the interaction of gender and the driver’s attitude has no significant effect on average ratings. Thus, reviewers do not explicitly distinguish between male and female drivers during the evaluation process. However, women who like pets are rated significantly worse than their male counterparts.
After we determine the consumer’s decision elements for the rating assessment, we apply the Shapley value decomposition to identify the expected marginal contribution of the important positive significant independent variables to the given average rating score. The Shapley value decomposition especially calculates the contributors to the online rating by decomposing the R-squared (share of explained variance) of an OLS model into contributions or groups of regressor variables. The contributors represent continuous membership scores in the range from 0 to 1. Accordingly, the total Shapley value can always be aggregated to 1. Our study is the first to apply such techniques in the context of peer-to-peer markets and builds on a mounting recognition of the need to control for different decomposition approaches and results.
The following section presents a literature review on online ratings and the sharing economy. This is followed by a section in which we provide a description of our data and subsequently move on to outline our decomposition methodologies. Finally, we present our empirical results, followed by a discussion of the findings and managerial implications.
2. Literature Review
A vast number of studies have analyzed the effect of customer reviews on market performance, particularly for the movie, book, and video game market. The studies typically find a positive correlation between customer reviews and commercial success because of reduced information asymmetry [5,6,7]. Various studies have examined the impact of user reviews on retail sites, car sales, and portals such as Amazon or eBay and have shown a correlation of online customer reviews and product sales [3,4,8]. Studying eBay’s reputation mechanism, Cabral and Hortacsu [9] show that a seller’s weekly sales drop from a positive 5% to a negative 8% when a seller first receives negative feedback. Jolivet et al. [10] analyze France’s largest e-commerce platform, PriceMinister.com, to study a seller’s rating and size on transaction prices. Controlling for a range of product categories (books, CDs, video games, and DVDs), product conditions (used or new), and seller types (individual or professional sellers), they find a significant positive effect of ratings on prices. Dospinescu et al. [11] have studied the influence of the reputation of food-delivery companies in Romania and show that quality, price, variety, and taste of the food delivered as well as the quality of the electronic application have a significant impact on the perception of reputation. Asak et al. [12] show that consumers’ purchasing decisions are not the only price-sensitive but also based on the social and environmental reputation of companies. Thus, companies should treat their consumers as members of a community, which is especially important in peer-to-peer markets. Teubner et al. [13] have conducted a survey to test the potential and applicability of reputation transfer between digital platforms. Among the 494 respondents, 65% of all participants use more than one platform. About 56% of all consumers are also providers, showing that users who are active on both market sides are the rule rather than the exception. Other studies on peer-to-peer markets focus their analysis on online services such as AirBnB, Yelp, and Groupon [14].
However, few authors so far have attempted to analyze the influence of interactions between customer reviews and advertising measures, or any possible interactions especially outside the traditional market for experience goods [15,16,17]. A major limitation of many of these studies is that they tend to control for only one of these product review types, even though Chintagunta et al. [6] have highlighted the potentially significant differences between reviews from professional critics and users.
Most studies regarding the relationship between online reviews and leisure, accommodation, and hotel services are based on the online peer-to-peer market TripAdvisor. Using the Negative Binomial Count Data Model, Park and Nicolau [18] analyze data from TripAdvisor and find a convex connection between online customer ratings and anticipated usefulness in hotels. Additionally, the authors found that users recognize extreme reviews as more helpful, especially if these are negative recommendations. Torres et al. [19] show that a high rating is positively related to a higher transaction mean value, which is related to the results of Xie et al. [20] who find a positive relationship between a high number of ratings and the hotel’s occupancy. Additionally, Neirotti et al. [21] find that user-generated online reviews on TripAdvisor have a positive effect on hotel revenue growth, which is outweighed by a negative effect on gross profit margins.
Bulchand-Gidumal et al. [22] present one of the first studies analyzing the decomposition of online ratings in peer-to-peer markets. Using data from TripAdvisor Europe for 7173 hotels that have at least 30 reviews and less than 40% business stays and a destination with at least 10 hotels, they found that 14% of the hotel ratings on social media can be related to the hotel destination. Furthermore, they found that 11.38% of the non-explained variance can be assigned to the destination, but they were not able to identify all variables that could be liable for this spread.
Summarizing the available evidence, it appears that no study exists that tries to isolate the different factors that lead to a high rating: While most studies concentrate on the impact of the valence of online ratings or the volume and variance of given reviews, others just compare different forms of reputation-building mechanisms, leaving aside the importance of a rating decomposition to understand consumer perceptions. It is the possible decomposition of online consumer ratings in peer-to-peer markets that this paper addresses, using data from a setting that is especially suited for an econometric study of the disaggregation of reputation mechanisms.
3. Data and Model
One way to decompose the online consumer ratings would be to specify a single-equation reputation model of positive ratings (i.e., average valence given by consumers) in terms of the drivers (e.g., age, conversational behavior, or experience level). However, such a model specification would not be able to capture the dynamic interrelationships of different reputation mechanisms among passengers and the driver. Consequently, a single-equation approach would lead to biased estimates of the influence effects of variant drivers of positive online ratings. Thus, following Tutz [23], we propose a sequential model that accounts for the different decision stages a consumer takes when reviewing a service. Specifically, we model two subsequent stages that cover first the consumer’s decision elements of rating assessment [24] and, second, the expected marginal contribution of the important positive significant independent variables to the given average rating score. The outcome of this approach will result in the decomposition of online consumer ratings in peer-to-peer markets.
In order to empirically decompose online consumer ratings, we construct a sample consisting of 17,584 enlisted drivers on BlaBlaCar that have been registered between 2004 and 2014. We have programmed a web crawling and web scraping tool that has collected all the information from the German website of BlaBlaCar in January 2015. To gather the necessary information, we have selected drivers that offered travels from the twenty German cities with the highest population (i.e., Berlin, Hamburg, Munich, Cologne, Frankfurt, Stuttgart, Dusseldorf, Dortmund, Essen, Leipzig, Bremen, Dresden, Hanover, Nuremberg, Duisburg, Bochum, Wuppertal, Bielefeld, Bonn, and Muenster). A summary of key descriptive statistics for variables used in the empirical analysis can be found in Table 1. According to Figure 1, we test the effect of five different reputational factors [25] to model their influence on consumer ratings, represented by the average valence of ratings: demographics [26], attitude [27], experience [28], guarantee [29], and vehicle [30,31,32].

Table 1.
Descriptive statistics.
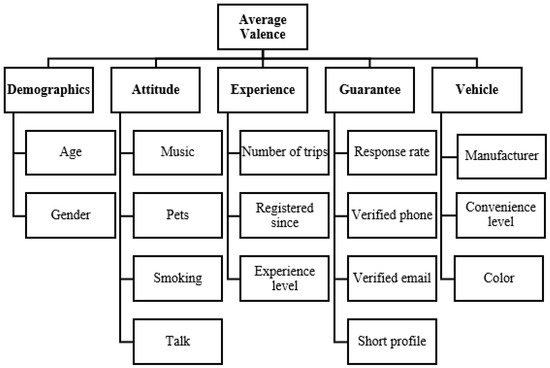
Figure 1.
Five different reputational factors.
Valence represents a comparable measure of average rating scores from consumers measured on a scale ranging from 0 to 5. Demographics represents a vector of variables reflecting a driver’s age and gender. Attitude represents a vector of variables reflecting a driver’s preferences for music, acceptance of pets and smoking behavior, and willingness to talk with passengers (measured on a rising three-point scale from 1 = Bla to 3 = BlaBlaBla). Experience is a vector of variables reflecting the driver’s experience level by controlling for the number of trips, the amount of time (measured in days) since being registered on the sharing website, and the experience level given by BlaBlaCar that evolves with time and travel activity (measured by the four dummy variables intermediate, experienced, expert and ambassador). Guarantee represents a vector of variables reflecting the driver’s communicational behavior by controlling for the driver’s response rate to messages from passengers, verification of phone number(s) and email address(es), and the completeness of the short profile description. Vehicle is a vector of variables controlling for the car brand the driver owns, the corresponding car convenience level (measured on a four-point scale from 1 = Simple to 4 = Luxury), and the car color.
Owing to the use of similar variables capturing online ratings from peer-to-peer consumers, we present correlation coefficients between these variables in Table 2. The highest level of correlation can be observed between the attitude variable smoking and pets, with a coefficient of +0.43. This relatively low correlation presents no cause for concern and thus leads us to integrate these predictor variables in our model specification without the issue that multicollinearity would significantly affect our results [33].
Table 2.
Correlation coefficients.
The full list of model variables included in the regression and thus our first analysis stages identifying the significant drivers of online ratings for driver i is therefore
where the definitions of each of these vectors of variables are consistent with the categories of variables reported in Table 1.
In addition to the decomposition of online consumer ratings of drivers, we identify the expected marginal contribution of the positive significant independent variables to the average valence with the help of the Shapley value decomposition. The Shapley value represents the expected marginal power contribution of a player i to a coalition j. By default, it evaluates the a priori power distribution among members of a legislature or committee system: for instance, a council or a parliament [34]. We adopt the same formal language of coalitional games, but instead of studying the marginal power contribution of players or parties to a coalition, we examine regressor variables and their marginal contribution to the goodness of fit, measured by the R-squared. Thus, we use the results from the first regression stage and decompose the share of explained variance into contributions by individual regressor variables.
In 1954, Shapley and Shubik [34] introduced the concept of power indices for the first time. They were able to establish a method for the a priori evaluation of the distribution of power among parties and members of a committee system. The calculation of the Shapley value is based on the structure of simple games. A game is called a simple game if for every coalition it allocates a value of either 0 or 1, consequentially . Simple games have been widely applied to the analysis of the distribution power allocation in coalitions, for example in councils or parliaments. A coalition that is correlated with 1 is called a winning coalition. Otherwise, it is defined as a losing coalition. The set of winning coalitions in the simple game is identified as . To describe a simple game, it is consequently sufficient to list the total set of the winning coalitions. The minimal winning coalitions are those winning coalitions that cannot be reduced further without losing their status of "winning", i.e., .
The Shapley value assigns each simple game a vector . The Shapley value of player in game is a weighted sum of terms of the form [ and is defined as
Thus, the Shapley value for player depends on the fulfilling “role” of a player , i.e., how much that person contributes to a certain coalition. In determining the marginal power contribution of player i, the player’s ranking order of a coalition is of non-importance. The result of the Shapley value is a solution concept that allocates a unique allocation for each game. If two players are symmetric, i.e., if they fulfill the same "role", they should be assigned the same Shapley value . Additionally, the sum of individual Shapley values of and . equals the Shapley value of the sum game. Furthermore, if a player does not contribute anything to a coalition this person should receive a zero share.
We advocate the Shapley value method to distribute the model’s goodness of fit among the regressor variables, henceforth the Shapley value decomposition [35]. Starting with the full regression model, we remove regressor variables one by one and according to a particular ordering of the variables. The difference in R-squared associated with the elimination of a variable can be regarded as the variable’s marginal contribution in this particular ordering of the regressors. Treating all orderings as equally probable, the Shapley value of a variable equals the variable’s average marginal contribution over all possible orderings.
More formally, let be a permutation of the variables with the interpretation that variable has the position in . The set of variables that appear before in is denoted by . Thus, in the permutation , variable changes the goodness of fit by
which we call variables ’s marginal contribution in .
Denoting by the set of all permutations on K, we calculate the Shapley value of variable as
The Shapley value decomposition meets the following main properties: efficiency, monotonicity, and equal treatment property. In efficiency, the full model’s goodness of fit (measured by R-squared) is decomposed among the regressor variables. In monotonicity, a change in the goodness of fit values from to such that variable exhibits higher marginal contributions in must not decrease the explanatory value attributed to variable . For the equal treatment property, if variables and are substitutes according to , then . The Shapley value is the only decomposition rule that satisfies efficiency, monotonicity, and the equal treatment property or. put another way, other decomposition rules violate at least one of the three conditions. In addition, if a variable contributes nothing to the goodness of fit in all sub-models, this variable will be given a Shapley value of zero.
4. Empirical Analysis
We decompose online ratings with a sequential model reflecting the different stages a consumer takes when rating a driver. The first stage covers the consumer’s decision elements of the rating assessment with the help of a regression analysis, followed by the second stage that identifies the expected marginal contribution of the important positive significant independent variables to the online rating score. Table 3 summarizes the estimations of the first stage.
Table 3.
First estimation stage: Regression results.
Table 4 shows the results of the Shapley value decomposition.
Table 4.
Second estimation stage: Shapley value decomposition.
The regression output is remarkably consistent between model specifications, indicating that our findings are broadly robust. However, some important distinctions can be made, most notably between the five different reputational factors.
Focusing on the demographics, it is apparent that both age and gender play no significant role in the evaluation process of drivers. On the contrary, attitude associates positively and significantly with average valence. More precisely, our results show a significant, positive relationship between the acceptance of pets (+0.012), the preference for smoking (+0.01), and the sufferance of music (+0.009). Additionally, a one-unit increase in the attitude towards conversational behavior is found to associate with an increase in ratings of around 0.01. The experience vector generally shows a negative significant effect on valence. The experience level of drivers indicates a linear decreasing effect on ratings with a raise in the driver’s experience level. The two variables number of trips and time of registration also show negative significant but marginal effects on valence and thus can be neglected. According to guarantee services, the results show a negative significant impact of the driver’s response rate and the verification of the driver’s phone on a driver’s evaluation and a positive significant effect of the email verification on a driver’s valence. The completion of the online short profile form shows no significance. This may be indicative of online communication expectations on the part of the consumer, indicating that former email communication raises expectations for future types of communication. Perhaps contrary to expectations, a statistically significant relationship between the car manufacturer, car convenience level, and most of the car colors could not be observed. Only green (+0.005), black (+0.006), and silver (+0.01) cars seem to have a positive significant effect on average valence given by consumers. Models VI and VII include interaction terms that capture the interrelationship between female drivers and their attitude characteristics. We find evidence to suggest that some degree of interaction is important in explaining variations in ratings, especially between females and their preferences for pets, given by a negative significant effect. Overall, we find some support for the rating dimensions attitude, guarantee, and vehicle to the extent that all attitude variables have a positive significant effect on ratings and that specific car colors and verified email addresses explain significant variations in a driver’s ratings. These findings suggest that a market that involves both online and offline characteristics is not mainly driven by pecuniary motivations but also shows prosocial consumer behavior aspects.
Table 4 presents Shapley values and their group sums as a percentage of the overall R-squared of the model. According to these values, about 89% of the explained variance can be attributed to the group of car colors, around 10% can be allocated to the group of attitudes and less than 1% to the guarantee. This finding indicates that consumers prefer solid car colors (i.e., silver shows a Shapley share of 68%) but again focus on the social aspects of the transaction and service process. Summarizing, the results from the Shapley value decomposition suggest that peer-to-peer markets that offer a hybrid market structure (i.e., online and offline characteristics) are mainly driven by prosocial behavior that clearly distinguishes these markets from classical offline and online markets, which mainly observe pecuniary consumer behavior.
5. Concluding Remarks
This study decomposes online ratings from the leading peer-to-peer carsharing service BlaBlaCar and identifies a number of rating determinants (i.e., attitude towards music, pets, smoking, conversations, guarantee traits, and car colors). A unique element and contribution of this research is the use of a large-scale dataset to investigate consumer preferences and determinants of online ratings. This work offers the first evidence on how to decompose given ratings and thus consumer experiences based on the modeling of the observed behaviors and preferences. In addition, our study significantly extends and develops the literature on rating decomposition by applying Shapley value decomposing, which identifies the expected marginal contribution of the important positive significant independent variables to the given average rating score.
In terms of managerial implications, our findings suggest a number of important insights into consumer behavior in the context of peer-to-peer markets. Evidence from both offline and online markets suggests that consumers behave pecuniarily in their purchase decision and behavior, while our study shows that markets that offer both online and offline characteristics are driven by nonpecuniary attributes and thus prosocial behavior. Prosocial consumer behavior refers to purchase behavior involving self-sacrifice for the good of others that is motivated by extrinsic rewards, reputational benefits, the pursuit of pleasure, and the avoidance of distress [36]. Therefore, peer-to-peer market providers and suppliers should pursue a prosocial positioning that fits consumers’ perceptions and the nature of prosocial behavior in peer-to-peer markets. Managers and companies should focus on the prosocial strategy when designing future peer-to-peer market platforms. Thus, the understanding of consumer preferences and the determinants of online ratings represents a potential source for competitive advantage in hybrid market forms.
In terms of limitations, our work shows two features that could be addressed in further research. First, we have to recognize that our findings are representative of the German market: namely, the carsharing platform BlaBlaCar. Thus, directly generalizing the results and implications to other markets may not be appropriate given the varying dynamics of supply and demand for sharing commodities across different platforms and regions. A second limitation of this study is that we analyze offerings listed only on BlaBlaCar, but not car-share proposals available on other platforms such as Lyft or Uber. Nevertheless, BlaBlaCar has a monopoly position on the German market, which implies that these competitors only marginally affect our results. A final limitation of our study pertains to the precise characterization of the profile matchings of the reviewer and review receiver. Future research should address this question and study how match quality possibly influences rating behavior.
Funding
This work was partially supported by the German Research Foundation (DFG) within the Collaborative Research Centre On-The-Fly Computing (GZ: SFB 901/3) under the project number 160364472.
Conflicts of Interest
The author declares no conflict of interest.
References
- Einav, L.; Farronato, C.; Levin, J. Peer-to-Peer Markets. Annu. Rev. Econ. 2016, 8, 615–635. [Google Scholar] [CrossRef]
- Rochet, J.C.; Tirole, J. Two-Sided Markets: A Progress Report. RAND J. Econ. 2006, 37, 645–667. [Google Scholar] [CrossRef]
- Dellarocas, C. The Digitization of Word of Mouth: Promise and Challenges of Online Feedback Mechanisms. Manag. Sci. 2003, 49, 1407–1424. [Google Scholar] [CrossRef]
- Chevalier, J.A.; Mayzlin, D. The Effect of Word of Mouth on Sales: Online Book Reviews. J. Mark. Res. 2006, 43, 345–354. [Google Scholar] [CrossRef]
- Archak, N.; Ghose, A.; Ipeirotis, P.G. Deriving the pricing power of product features by mining consumer reviews. Manag. Sci. 2011, 57, 1485–1509. [Google Scholar] [CrossRef]
- Chintagunta, P.; Gopinath, S.; Venkataraman, S. The effects of online user reviews on movie box office performance: Accounting for sequential rollout and aggregation across local markets. Mark. Sci. 2010, 29, 944–957. [Google Scholar] [CrossRef]
- Sun, M. How does the variance of product ratings matter? Manag. Sci. 2012, 58, 696–707. [Google Scholar] [CrossRef]
- Dewenter, R.; Heimeshoff, U. Do Expert Reviews Really Drive Demand? Evidence from a German Car Magazine. Appl. Econ. Lett. 2015, 22, 1150–1153. [Google Scholar] [CrossRef][Green Version]
- Cabral, L.; Hortaçsu, A. The Dynamics of Seller Reputation: Evidence from eBay. J. Ind. Econ. 2010, 58, 54–78. [Google Scholar] [CrossRef]
- Jolivet, G.; Jullien, B.; Postel-Vinay, F. Reputation and Prices on the e-market: Evidence from a Major French Platform. Int. J. Ind. Organ. 2016, 45, 59–75. [Google Scholar] [CrossRef]
- Dospinescu, N.; Dospinescu, O.; Tatarusanu, M. Analysis of the Influence Factors on the Reputation of Food-Delivery Companies: Evidence from Romania. Sustainability 2020, 12, 4142. [Google Scholar] [CrossRef]
- Asak, E.O.; Ferguson, M.A.; Duman, S.A. Corporate social responsibility and CSR fit as predictors of corporate reputation: A global perspective. Public Relat. Rev. 2016, 42, 79–81. [Google Scholar]
- Teubner, T.; Hawlitschek, F.; Adam, M.T.P. Reputation Transfer. Bus. Inf. Syst. Eng. 2019, 61, 229–235. [Google Scholar] [CrossRef]
- Zervas, G.; Proserpio, D.; Byers, J.W. The rise of the sharing economy: Estimating the impact of AirBnB on the hotel industry. J. Mark. Res. 2017, 54, 687–705. [Google Scholar] [CrossRef]
- Basuroy, S.; Desai, K.K.; Talukdar, D. An empirical investigation of signaling in the motion picture industry. J. Mark. Res. 2006, 43, 287–295. [Google Scholar] [CrossRef]
- Basuroy, S.; Chatterjee, S. Fast and frequent: Investigating box office revenues of motion picture sequels. J. Bus. Res. 2008, 61, 798–803. [Google Scholar] [CrossRef]
- Chandrasekaran, D.; Arts, J.W.C.; Tellis, G.J.; Frambach, R.T. Pricing in the international takeoff of new products. Int. J. Res. Mark. 2013, 30, 249–264. [Google Scholar] [CrossRef]
- Park, S.; Nicolau, J.L. Effects of general and particular online hotel ratings. Ann. Tour. Res. 2017, 62, 114–116. [Google Scholar] [CrossRef]
- Torres, E.N.; Singh, D.; Robertson-Ring, A. Consumer reviews and the creation of booking transaction value: Lessons from the hotel industry. Int. J. Hosp. Manag. 2015, 50, 77–83. [Google Scholar] [CrossRef]
- Xie, K.L.; Chen, C.; Wu, S. Online Consumer Review Factors Affecting Offline Hotel Popularity: Evidence from Tripadvisor. J. Travel Tour. Mark. 2016, 33, 211–223. [Google Scholar] [CrossRef]
- Neirotti, P.; Raguseo, E.; Paolucci, E. Are customers’ reviews creating value in the hospitality industry? Exploring the moderating effects of market positioning. Int. J. Inf. Manag. 2016, 36, 1133–1143. [Google Scholar] [CrossRef]
- Bulchand-Gidumal, J.; Melián-González, S.; Lopez-Valcarcel, B.G. A social media analysis of the contribution of destinations to client satisfaction with hotels. Int. J. Hosp. Manag. 2013, 35, 44–47. [Google Scholar] [CrossRef]
- Tutz, G. Sequential models in categorical regression. Comput. Stat. Data Anal. 1991, 11, 275–295. [Google Scholar] [CrossRef]
- Dospinescu, N.; Dospinescu, O. A Profitability Regression Model in Financial Communication of Romanian Stock Exchange’s Companies. Ecoforum J. 2019, 8, 18. [Google Scholar]
- Dhalla, R.; Carayannopoulos, S. Reputational Discounting: Factors Reducing the Influence of Organizational Reputation. Corp. Reput. Rev. 2013, 16, 150–167. [Google Scholar] [CrossRef]
- Tran, L.T.T.; Ly, P.T.M.; Le, L.T. Hotel choice: A closer look at demographics and online ratings. Int. J. Hosp. Manag. 2019, 82, 13–21. [Google Scholar] [CrossRef]
- Wyer, R.S. Category ratings as “subjective expected values”: Implications for attitude formation and change. Psychol. Rev. 1973, 80, 446–467. [Google Scholar] [CrossRef]
- Boyer, M.; Dionne, G. An Empirical Analysis of Moral Hazard and Experience Rating. Rev. Econ. Stat. 1989, 71, 128–134. [Google Scholar] [CrossRef]
- Posselt, T.; Gerstner, E.; Radic, D. Rating e-tailers’ money-back guarantees. J. Serv. Res. 2008, 10, 207–219. [Google Scholar] [CrossRef]
- Kyung, G.; Nussbaum, M.A.; Babski-Reeves, K. Driver sitting comfort and discomfort (part I): Use of subjective ratings in discriminating car seats and correspondence among ratings. Int. J. Ind. Ergon. 2008, 38, 516–525. [Google Scholar] [CrossRef]
- Dunn, M.J.; Searle, R. Effect of manipulated prestige-car ownership on both sex attractiveness ratings. Br. J. Psychol. 2010, 101, 69–80. [Google Scholar] [CrossRef] [PubMed]
- Kulkarni, G.; Ratchford, B.T.; Kannan, P.K. The impact of online and offline information sources on automobile choice behavior. J. Interact. Mark. 2012, 26, 167–175. [Google Scholar] [CrossRef]
- Dospinescu, O.; Bogdan, A.; Dospinescu, N. Key Factors Determining the Expected Benefit of Customers When Using Bank Cards: An Analysis on Millennials and Generation Z in Romania. Symmetry 2019, 11, 1449. [Google Scholar] [CrossRef]
- Shapley, L.S.; Shubik, M. A method for evaluating the distribution of power in a committee system. Am. Political Sci. Rev. 1954, 48, 787–792. [Google Scholar] [CrossRef]
- Huettner, F.; Sunder, M. Axiomatic arguments for decomposing goodness of fit according to Shapley and Owen values. Electron. J. Stat. 2012, 6, 1239–1250. [Google Scholar] [CrossRef]
- Small, D.A.; Cryder, C. Prosocial consumer behavior. Curr. Opin. Psychol. 2016, 10, 107–111. [Google Scholar] [CrossRef]

© 2020 by the author. Licensee MDPI, Basel, Switzerland. This article is an open access article distributed under the terms and conditions of the Creative Commons Attribution (CC BY) license (http://creativecommons.org/licenses/by/4.0/).