Abstract
This study aims at presenting an experimental evaluation of the different effects of environmental and health information on encouraging car owners to travel on foot and by bicycle. Health information consists of a high and a low target setting. One hundred and forty-six participants in Hefei city reported their travel behaviors in terms of mode, time, and trip before and after the experiment. Their cognitive and emotional processes with regard to the protection motivation theory (PMT) that determine their potential travel behavior changes in response to information intervention are also identified. Three experimental groups and one control group based on a between-group design are adopted and the methodology of paired sample chi-squared tests and stepwise linear regressions are used. The results show that environmental information alone fails to encourage car owners’ non-motorized travel. When health information is added, information intervention can effectively encourage a time increase in walking and cycling as well as a time and trip decrease in car use in the short term. But the long-term effect is not significant after a year and a half. Moreover, there are no significant differences between the high and the low target settings in health information for encouraging non-motorized travel. In terms of PMT constructs, severity has a significant relationship with the change of time or trip on foot and by bicycle. Vulnerability emerges as a non-effective predictor. Reward, self-efficacy, response efficacy, and response cost are more remarkable in predicting the change of time or trip by car. This study recommends that (1) health information with a target setting is superior to environmental information, (2) reduction strategy is potentially superior to transfer strategy to control car usage, (3) policymakers should design intervention strategies relevant to the coping appraisal rather than to the threat appraisal.
1. Introduction
Nowadays, many developed and developing countries have adopted the concept of travel demand management (TDM) to mitigate the impact of car congestion, pollution, and disease. Instead of providing more roads and services to cars, many countries have started to promote people’s sustainable travel behavior. The goal is to reduce car use time and distance or to encourage a shift form car to sustainable ways of travel, such as foot, bicycle, and public transport. Non-motorized means including walking and cycling are important ways recommended for short-distance travels from the social, environmental, and health perspectives. Besides strategies of taxes, tolls, charges, subsidies, regulations, investments, and technological upgrades, information is one of the important persuasion strategies to promote people’s sustainable travel behavior from the perspective of TDM. Many researchers from developed and developing countries have shown that people’s travel mode and behavior are highly influenced by information, knowledge, awareness, and attitudes [1,2,3,4,5,6,7].
Among them, some studies proved that the information provided could reduce car use and encourage a substitute of foot, bicycle, and public transport [3,5,6,7]. Their conclusions lacked full interpretations of what kind of cognitive and emotional processes and specific factors resulted in the travel behavioral change. Graham-Rowe et al. (2011) [8] conducted a systematic review analysis and found that most experimental studies applied an indicator mode to evaluate travel behavior, and others used a different indicator, such as a trip, distance, or hour. Few studies have tried to combine two indicators, such as mode and time, mode and distance, and distance and trip. To the best of our knowledge, only Rose and Ampt’s (2001) [9] experiment used three indicators: distance, trip, and hour. However, their study only focused on reducing car use behavior and neglected the latent behavior change from cars to car alternatives. In addition, there is a lack of experimental studies to distinguish the impact of different information on encouraging sustainable travels. For example, Geng et al. (2016) [6] pushed six messages by WeChat software to residents, which covered aspects of the economic, safety, social, environmental, and health losses caused by car use. They have not described which type of information played a dominant role in promoting green travel (walking, cycling, and using public transport). Meanwhile, Geng et al. (2016) found in an experiment that the message reminding people to take a 30 minutes’ walk or ride for health benefits might be an important predictor in encouraging active commuting, because the participants kept walking and cycling for 30 min every day after the experiment. But this time increase is “just on target” and could not climb to a higher level, such as 45 min. Therefore, Geng et al. (2016) discussed this phenomenon as a “goal-oriented prompt” and supposed that a higher target, e.g., 45 min, set by the interventional information might result in a higher level of behavior change. However, the authors did not verify this in their study.
Based on the above-mentioned facts, this study aims to explain the following questions that may be vital in bridging the gaps in three directions:
- Which type of information (pro-environment or health) plays a dominant role in promoting non-motorized travel?
- What cognitive or emotional process determines whether or not car owners change their car use behavior toward non-motorized travel in response to information intervention?
- Does a higher target set by health information bring about stronger encouragement of non-motorized travel?
Therefore, this study introduces the protection motivation theory (PMT) framework and provides a field and follow-up experiment to evaluate car owners’ cognitive and emotional approaches to non-motorized travel when varying information about health and the environment is provided. Moreover, considering the potential role of smartphone technology in transport behavior [10], the WeChat software was used as the platform to conduct the information intervention experiments in this study. This software was chosen because it is the most popular communication platform in China with more than 1 billion active users in an average month [11]. The participants can also easily receive a piece of information/message in a real-world environment and their data are easier to track. In the experiment, a between-subjects design was introduced, and indicators of the mode, time, and trip were used to describe the details of travel behavioral change before and after information interventions. This study will provide insights into the theoretical and practical implications towards sustainable transportation under the guidelines of TDM strategies.
2. Literature Review
2.1. Cognitive and Emotional Approaches to Travel Behavior Change
Hounsham (2006) [12] assumed that well-informed individuals make reasonable decisions, which will influence the change of environmental behavior to some extent. Rational choice theory assumes that an individual will make a decision about an alternative behavior that gives them maximum satisfaction where information becomes crucial for them to make the appropriate decision [13]. Normative theories, such as Value-Belief-Norm (VBN) and the Norm Activation Model (NAM), hold a view that only when individuals realize the consequences of their actions in polluting the environment and then activate their values, norms, and sense of responsibilities, can they implement pro-environmental behavior [14,15,16]. Other researchers have insisted that attitude theories, such as Theory of Planned Behavior (TPB), have a strong power in explaining one’s reasoned decision [17,18]. Overall, information plays a vital role in forming the reasoned decision making of residents’ attitudes towards pro-environmental behavior. Upon the acceptance of the new information, knowledge and cognition will be established, then attitudes and willingness will be changed, which will ultimately lead to a desired pro-environmental behavior [3,19,20,21].
Many researchers introduced an experimental study and showed that it is conducive to promoting an individual’s sustainable travel behavior when information is introduced [4,5]. These studies aimed at encouraging the respondents to buy cleaner cars, reduce car use, and travel on public transport by providing information about the vehicle emissions, trip time variability, and economic benefits. However, most of them applied the attitude theory and its extended or integrated model to evaluate people’s cognition process toward sustainable transport, which neglected the emotion process underlying the behavioral change.
Clark and Waddell (1983) [22] insisted that attitude includes cognition and emotion, and emotion has a stronger power in influencing one’s decisions. Information might bring about the improvement of individual cognition in solving a health and environmental problem, and at the same time bring a sense of fear and guilt about an unhealthy behavior that is damaging the environment. The researchers believed that people are more susceptible to this emotional appeal, especially fear, and therefore emotional persuasion will be an effective strategy to use in advertising and providing information [23,24,25,26]. Das et al. (2003) [27] indicated that an individual’s emotional appeal is the one that encourages them to take a certain action, accept a certain policy, or buy a certain product. In short, cognition and emotion greatly influence people’s attitude and behavior.
Non-motorized travel is not only an environmentally friendly behavior, but also a healthy behavior. Health information, which can be relevant to the promotion of both cognitive and emotional processes potentially, can motivate individuals to reconsider the benefits and costs of a behavior and then be conducive to the implementation of a healthy and pro-environmental behavior. Some researchers have tried to use health information to improve individuals’ sustainable transport [5,6]. For example, Geng et al. (2016) [6] found that multiple pieces of information can significantly improve urban residents’ cognitive and emotional attitudes towards green travel. As a result, people’s time of walking, cycling, and taking a bus improved substantially. However, the focus of this study was on the different responses of the goal-framing groups to information interventions, and there was no quantitative explanation for the underlying causes of the behavioral changes and for the distinctiveness of different pieces of information. In addition, most of the theories (VBN, NAM, TPB) applied in experiments were good at explaining some features (e.g., importance, value, necessity) of a certain behavior. Moreover, researchers tended to use the differences of these features to explain the changes to a certain behavior. However, people’s perceptions and senses of the gains and losses in the process of behavioral changes were not been directly and fully evaluated. Therefore, PMT could potentially be useful for solving this problem.
2.2. Protection Motivation Theory
The assumption underlying the PMT is a cognitive evaluation process that is initiated by a sense of fear that causes the protection motivation to ignite. With the PMT it is believed that the protection motivation could motivate, maintain, and guide a recommended behavior to avoid the risk factors. Thus, the comprehensive appraisal of the threat and coping process leads to cognitive and emotional decision making [28].
Threat appraisal involves people’s understanding of risk factors that increase or decrease the likelihood of maladaptive behavior. It involves an understanding of three factors: severity, vulnerability, and reward. Severity refers to the degree of harm from an unhealthy behavior. Vulnerability is an individual’s subjective judgment of the possibility of harm. Reward refers to the positive aspects of continuing an unhealthy behavior. The severity and vulnerability are the factors that reduce adverse behavior, and the reward promotes it. Coping appraisal is the ability of an individual to cope with and avoid threats, which comprises three factors: response efficacy, self-efficacy, and response cost. Response efficacy refers to an individual’s perception of whether the recommended behavior is effective or not in preventing possible harm. Self-efficacy is the belief that one can successfully enact the recommended behavior. Response cost refer to the social and economic costs incurred by individuals when they engage in the recommended behavior. Response efficacy and self-efficacy promote healthy behavior, while response cost reduces the possibility of occurrence. The PMT can provide motivations for individuals to reduce health threats in consideration of the benefit and cost of a recommended behavior [29]. Therefore, the PMT can reveal the internal mechanism of the recommended behavior change more deeply.
2.3. Applying Protection Motivation Theory to Travel Behavior Change
PMT has been vital where it has been traditionally applied in the personal health framework covering physical exercise, diet, and healthy lifestyle [30]. This has been evidenced during the past two decades in which PMT has been applied in a climate change adaptation context. It is a framework to reduce the vulnerability of the ecological system to relative changes in global warming and to offset its effects [31,32]. The significance and ease of application of the PMT has continued to influence researchers to use this theory in different study areas, such as applications of the PMT to study adaptation to water stress, flooding associated with rising sea levels, and tourism and recreation [33,34,35,36].
Green travel including walking and cycling is an important measure to solve traffic jams, pollution, climate change, and health issues. Previous studies have shown that individuals’ cognitive and emotional perceptions of the health and pollution issues caused by car use will motivate them to reduce the use of automobiles and to increase the use of green ways [6,21,37]. However, people’s cognitive and emotional perceptions are potentially from different psychological paths and factors, and sometimes are inconsistent [35]. For example, people may rationally observe the harm and benefit of a shift from car to green travels. However, they could also suffer emotionally from the inconvenience and bad experience of abandoning their cars. Therefore, the threat and coping processes of PMT relevant to the cognitive and emotional approaches can provide an insight into the psychological factors behind people’s potential travel behavioral changes. At the same time, Steg and Sievers (2000) [38] and Tapsuwan and Rongrongmuang (2015) [39] insisted that respondents usually think their share of global warming is negligible and their current behavior is correct. As a result, their motivations for behavioral change might be inadequate due to their perceptions that climate change is a long-term global problem beyond their control. This kind of thinking resulted in the formation of incorrect control beliefs and abnormal expectations. Only when people realize they have the ability to reduce their use of cars and bring about positive consequences of their own actions will they be more likely to choose sustainable transport instead of driving cars [40]. Therefore, rebuilding the self-efficacy and response efficacy may be an effective way to encourage non-motorized travel.
In conclusion, it is expected that the protection motivation theory and its processes (threat and coping appraisals) and constructs (vulnerability, severity, reward, response efficacy, self-efficacy, and response cost) will explain a significant proportion of the variance in the travel behavioral change under an information intervention experiment, specifically:
H1a.
As perceived vulnerability increases, the behavioral change toward walking or cycling increases.
H1b.
As perceived vulnerability increases, the behavioral change toward using a car decreases.
H2a.
As perceived severity increases, the behavioral change toward walking or cycling increases.
H2b.
As perceived severity increases, the behavioral change toward using a car decreases.
H3a.
As perceived reward increases, the behavioral change toward walking or cycling decreases.
H3b.
As perceived reward increases, the behavioral change toward using a car increases.
H4a.
As response efficacy increases, the behavioral change toward walking or cycling increases.
H4b.
As response efficacy increases, the behavioral change toward using a car decreases.
H5a.
As self-efficacy increases, the behavioral change toward walking or cycling increases.
H5a.
As self-efficacy increases, the behavioral change toward using a car decreases.
H6a.
As perceived response cost increases, the behavioral change toward walking or cycling decreases.
H6b.
As perceived response cost increases, the behavioral change toward using a car increases.
3. Experiment Design
We conducted an experiment in Hefei city in China. Hefei is the provincial capital of Anhui province located in the middle of China. At the end of 2018, there were 2 million residents in the urban area and more than 700,000 shared bikes available for the urban residents. So, the participants in the experiment were able to easily find the bikes in the urban area when they decided to ride on daily trips. This is important because some participants who have no private bikes can use public bikes as a substitute. In order to reduce the pressure on participants that might be brought about by the norms and expectations of the researchers, we introduced a field experiment in which the information was delivered through the WeChat software.
One community in the urban area of Hefei city was randomly chosen. In order to find car owners, we cooperated with the residential property management company and asked the property manager to provide the house and telephone numbers of the residents who had already registered at least one car. Then we connected the car owners through WeChat using their telephone numbers which are an essential way to register WeChat identifications. Once approved, a self-introduction was sent to explain the purpose of our efforts. The respondents were asked to fill in a questionnaire and would receive ¥5 immediately after finishing the questionnaire truthfully. At the top of the questionnaire, respondents had to fill in their house number. It was designed to test people’s honesty and the validity of their answers. If there was an information mismatch between the respondents and the residential property management company, the respondent’s questionnaire would be considered as invalid and be removed. The honest respondents were invited to accept a simple task, in which they would be added into a WeChat group and periodically review the messages received in the group. We promised that each participant could take part in the game of “grabbing red packets” every other day in the next two weeks through the WeChat group and receive a nice gift in the last day after two weeks. “Grabbing red packets” is a very popular game in China whereby everyone in the group can click on the red packet and get a random amount of money from it by luck. It has proven to be effective in stimulating respondents’ willingness to follow through with experiments [6,11]. Finally, 146 car owners finished the first-stage questionnaire (T1) by self-reporting truthfully and agreed to participate in the experiment. Figure 1 illustrates the process of sample recruitment in this experiment. The questionnaire was conducted using a professional free online survey platform namely Sojump (www.wjx.cn), which has a good correlation with the WeChat software. Once a questionnaire was filled out, the participants’ answers appeared and were counted in the Sojump platform.
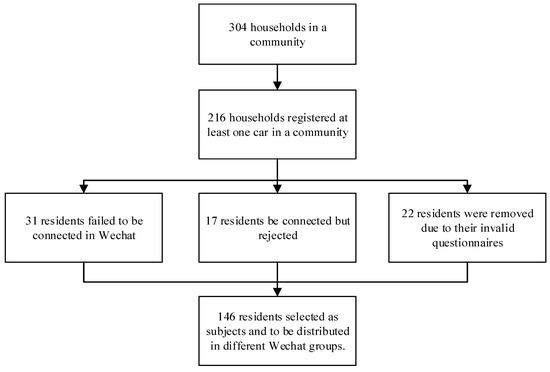
Figure 1.
Sample recruitment for the experiment.
In the questionnaire T1, the first part measured the travel behavior before the experiment by using the indicators of mode, time, and trip. Specifically, considering the studies from Fujii and Taniguchi (2005) [41], Bamberg (2006) [42], and Geng et al. (2016) [6], the time item reads, “How much time on average per day did you spend for your daily trips by foot/bicycle/car in the last week?”, and six options were given: 1 (0 min), 2 (1–14 min), 3 (15–29 min), 4 (30–44 min), 5 (45–59 min), and 6 (60 min and above). The trip item reads, “How many times did you travel by foot/bicycle/car on two-way trips in the last week?”, and six answers were given: 1 (0 times), 2 (1 times), 3 (2 times), 4 (3 times), 5 (4 times), and 6 (5 times and above). The second part of T1 measured six PMT constructs on a five-point Likert scale: severity, vulnerability, reward, self-efficacy, response efficacy, and response cost. Table 1 provides a complete description of the PMT scales, which were adapted from Rompalo et al. (2017) [43], Nabizadeh et al. (2018) [44], and Menard et al. (2018) [45] to fit the travel context. The last part of T1 dealt with the demographic variables of age, gender, marital status, family population, children status, education background, and household monthly income. It should be noticed that the WeChat identification and the house numbers were used to identify a respondent in the control or experimental group.

Table 1.
Subscales for assessing PMT constructs.
In order to eliminate undesired interference from the demographic characteristics, the stratified sampling method was adopted to make the demographic distributions of the participants in the different groups more balanced. Finally, 146 participants were distributed in four groups: one control group and three experimental groups. Specifically, participants in the first experimental group (tagged IG1) only received information from the environmental aspect. In the second experimental group (tagged IG2), information combined with environment and health aspects was pushed, and a low health target was set. The information in the third experimental group (tagged IG3) covered the environmental and health aspects and a high health target. No information was sent in the control group (tagged CG).
Four WeChat groups were created, and the participants were pulled into different groups in accordance with their WeChat identifications and demographics. Table 2 summarizes the demographic statistics for the four groups in terms of age, gender, marital status, family population, children status, education, and household monthly income. The one-way ANOVA test demonstrates a non-significant difference (p > 0.05) between different groups. This provides evidence that the demographic variables will not result in emerging differences between different groups after the experiment.
Table 2.
Demographic characteristics of respondents in the control and intervention groups.
It can be clearly seen that all participants in this experiment are relatively young; those aged below 40 account for more than 85% of the total. These individuals might be open to experiences and have a high degree of involvement with WeChat and the “grabbing red packets” game. In terms of gender, the proportion of males is higher than that of females. About 70% of the participants are married, and more than 60% of them have at least one child under the age of 16 at home. The participants, i.e., the car owners, in this research have a slightly higher income and educational background than the average level of residents in Hefei city.
The experiment began on 20 August 2018. We sent the message by WeChat to the three experimental groups four times; that is, once every other day for the first week. No information was sent in the remaining one week to avoid the practice effect. The messages referenced Geng et al. (2016) [6] and were designed from two aspects regarding the environment and health.
The message (M1) reads, “The carbon emissions from a fossil-fuel car with a speed of 50 km/h are 198.7 g/km, and will rise to 306.7 g/km in heavy traffic when its speed is 20 km/h, which is about 25 times as much as a bus and 8 times as much as rail transit. Moreover, car exhausts contribute 20–35% of PM2.5 emissions in Chinese big cities. Especially in the period of strong haze, car exhaust contributes to as much as 47% of the air pollution.”
The message (M2) reads, “According to reports from the World Health Organization, your health risk (such as breast cancer, lung cancer, cardiovascular disease, dementia, depression, anorexia, obesity, and cervical spondylosis) will be reduced by 22% and 28% when you insist on walking or riding a bike for about 30 min every day, respectively.”
The only difference between M3 and M2 was the two different time targets; that is, 45 min vs. 30 min, and M3 reads, “According to…, when you insist on walking and riding a bike for about 45 min every day, respectively.”
During the experiment, M1 was sent to IG1 in WeChat. Participants in IG2 received M1 and M2 in combination. M1 and M3 were sent together in IG3. No message was pushed in CG. The experiment lasted two weeks and finished on 2 September 2018. Then the second-stage questionnaire (T2) was delivered to the participants online in WeChat using the Sojump platform. Finally, all participants finished the questionnaire T2, and each one received a gift by post. In T2, the same items as the questionnaire (T1) were used to measure the travel behavior (mode, time, and trip) after the experiment. Figure 2 illustrates the framework of this experiment, including the process, timeline, interventions, and some survey indicators.
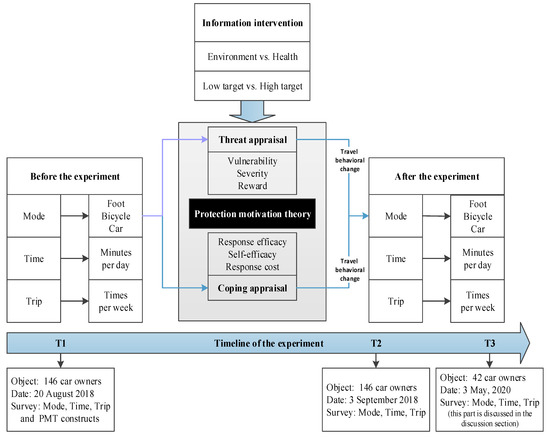
Figure 2.
Framework of this experiment.
4. Results
4.1. Travel Behavior Change Before and After the Experiment
Table 3 shows the travel behavioral changes, i.e., the time and trip differences, before and after the experiment, and the related Chi-squared tests.
Table 3.
Time and trip differences of three travel modes in four groups before and after the experiment. The significances were tested by the paired samples Chi-squared test and independent samples Chi-squared test.
In the CG (columns 1–3), there were no significant differences in the time (Timemode) and trip (Tripmode) of walking, cycling, and driving, although there was a slight increase in Timecar and Tripcar and a decrease in Timebicycle and Tripfoot. In the IG1 (columns 4–6), Timefoot and Timebicycle started to increase while Timecar and Tripcar began to decrease, but the changes were not significant. The message containing environmental information (M1) seems to be working but it failed to improve walking and cycling effectively. In IG2 with a low target (columns 7–9), the message combined with environmental and health information (M1 and M2) started to take effect in encouraging non-motorized travel and reducing car uses, as Timefoot and Timebicycle increased significantly along with Timecar and Tripcar decreasing remarkably. But there was a considerable and significant decline in Tripfoot and a larger decrease in Tripbicycle. In IG3 with a high target (columns 10–12), M1 and M3 had a significantly positive effect on the time and trip of walking, cycling, and driving, and a significant decline in Tripbicycle appeared.
The abovementioned vertical analysis using the paired samples Chi-squared test was able to show the differences in a certain group before and after the experiment. The independent samples Chi-squared test was helpful to demonstrate the differences between groups. It can be seen in Table 3 (columns 13–15) that the role of environmental information alone was not significant compared with the control group. The information regarding both the environment and health, regardless of the low target or high target, was shown to significantly improve the time of walking and cycling as well as reducing car use. It could be further demonstrated by the Chi-squared test results in columns 16 and 17 in Table 3 that the health information was effective in encouraging car owners to spend more time on walking than on cycling. However, there was a simultaneous and significant decline in walking and cycling trips in IG2 and IG3, especially in IG3, which underlined a potential side effect brought about by the health information. An increase in the total time of walking (TTfoot) in IG2 and IG3 and that of cycling (TTbicycle) in IG2 would provide more evidence in support of the positive influence from the intervention information. Finally, according to the test result in column 18 in Table 3, the significant differences in expectations between the low and the high targets never materialized.
We may be able to detect that the walking times in IG2 and IG3 meet the low target (30 min valued as 4 in the survey) but failed to meet the high target (45 min valued as 5 in the survey) after the experiment. In both IG2 and IG3, the cycling times were below the two targets. In addition, the total time of car use (TTcar) decreased slightly in IG1 and substantially in IG2 and IG3, and the sum of the total time (TTsum) in all groups decreased.
4.2. Stepwise Linear Regression of Protection Motivation Theory Constructs
In order to avoid the interference of multicollinearity, a stepwise linear regression model was adopted. The PMT constructs and demographic variables were all involved in the regression model. Table 4 lists the regression results by the indicators of the Durbin–Watson test, tolerance, VIF (variance inflation factor), and coefficient, which showed the effectiveness of the regressions. The differences of time (DTimemode) and trip (DTripmode) in the experimental groups before and after the experiment can be explained significantly by the PMT constructs at the 95% confidence level. In terms of the demographic variables, men were more inclined to increase the time and trips of car use as well as decrease the trips by walking and cycling than women. Car owners who have children at home tended to increase driving trips and reduce cycling trips. The elder or well-educated people were more likely to increase the cycling time and walking trips, while the richer ones were more prone to decreasing the walking time. Overall, female, elder, well-educated, childrenless, and lower-income people were more inclined to conduct green and non-motorized travel after information interventions. In order to clearly observe the positive and negative correlations of the PMT constructs, we summarized those data in Table 5.
Table 4.
Stepwise linear regression results for PMT constructs and demographics.
Table 5.
Correlations between PMT constructs and time/trip differences of three travel modes.
As for Threat Appraisal relevant to car use, severity had a significantly positive influence at the 99% confidence level on time increases of walking and cycling and on trip increases of cycling. This indicates that participants who believed that the pollution brought about by heavy car use would cause tremendous harm to the health and ecological system were more inclined to increase their walking and use of bicycle after an information intervention. Furthermore, the respondents who believed that driving a car enabled them to get something valuable or meaningful, referred to as reward, were more likely to keep on increasing the time and frequency of their car usage (p < 0.01) as well as decreasing their walking time (p < 0.05) after an information intervention. Finally, vulnerability emerged as a non-effective predictor in this study.
As for Coping Appraisal relevant to the car alternatives, self-efficacy was the most important predictor. It had a significant influence on the time increases of walking and cycling as well as a significant influence on reducing the time and trip of car use. This demonstrated that self-efficacy had a core role in the PMT. When individuals had stronger self-efficacy, they were more likely to reduce car use and choose non-motorized travel. This is a critical factor that may block the pathways of positive cognition towards a recommended healthy and pro-environmental behavior.
Response efficacy only had a significant effect on reducing the time of car use, which shows that car owners who had trust in the effect of using car alternatives on coping with car-related health and pollution problems were more inclined to reduce car use. Maybe these people believed walking and cycling were not the panacea to settle the matters. Therefore, they were more willing to reduce driving activities or choose public transport rather than a substitute of walking and cycling.
Due to the influence of the response cost, the trip measure of car use increased significantly and that of walking decreased significantly. The response cost further proved car owners had more concerns about the benefit of using a car as well as the cost of abandoning a car. This benefit (reward) and cost (response cost) seemed to show that walking instead of driving would sacrifice more interests for car owners. On the contrary, driving a car means getting more.
5. Discussion
Here some discussions are proposed to address the questions raised earlier.
Firstly, the experimental results showed that health information played a dominant role in promoting non-motorized travel. Horng et al. (2014) [35] suggested that an individual’s pro-environment behavior was more motivated by a sense of norm and responsibility, whereas health protection behavior was activated by a feeling of fear. Therefore, the empathic information provided about the pollution problems might not act as a strong predictor of a human’s carbon reduction behaviors due to the responsibility diffusion of public goods. We insisted that responsibility must not be neglected, because it was an essential cognitive process relevant to coping appraisal as we discussed later in favor of pro-environmental behavior. Fear and responsibility must not be set apart when considering the behaviors relevant to the properties of health and environmental protection at the same time [24]. Moreover, car owners might distrust and disapprove of the information itself and consider that this kind of information exaggerates the pollution harm caused by car use [46]. Accordingly, they may consider that this information gives them “a sense of depriving their rights to pleasant driving” [6,47]. On the contrary, health information in this experiment reported on the things that matter to oneself and gave an objective, specific, measurable, and attainable goal that would teach people what/how they will do to cope with emotions of unrest, such as fear. Locke (1968) [48] claimed that concrete information could be more likely to guide human behavior than vague information.
Secondly, PMT constructs indicated strong explanations in encouraging car owners’ non-motorized travel in response to information intervention. The results of this study revealed that severity could increase urban residents’ non-motorized travel to a certain extent, but failed to effectively affect their car use behavior. People’s perceptions of vulnerability and severity would inspire feelings of fear or anxiety and result in health protection behavior, while the cognitive procedure, such as the sense of responsibility, was more conducive to environment protection behavior. This cognitive procedure was likely to be initiated by the coping appraisal constructs rather than the threat appraisal constructs. Once the self-efficacy and response efficacy is increased, car owners would be more inclined to reduce car use and conduct non-motorized travel. In contrast, car owners tended to pay more attention to the benefits of using a car (relevant to the reward) and the loss caused by abandoning a car (relevant to the response cost), rather than the sense of responsibility. These kinds of gains or losses may not stem only from the economic aspect, but also from the aspects of time, effort, experience, identity, status, and connection [16,20,49]. The regression results in Table 5 showed that reward and response cost had no significant effect on the time and frequency of cycling after the experiment. Hence, car owners might consider cycling instead of driving if it presented fewer sacrifices than walking. Morris and Guerra (2014) [50] conducted a questionnaire study and found that cycling could provide more positive affect, emotion, and experience than driving cars. Hence, cycling might be a potential substitute for driving for short distance travel in future policy strategies.
Thirdly, high-target health information could encourage more increases in time of walking and cycling than low-target health information, but the differences were very small and not significant. Furthermore, these increased times remained below the high target set in the intervention message. We have not found more references to prove these outcomes yet. Maybe the participants in this study considered 30 min of walking and cycling every day as their high limit of non-motorized travel. This time data was based on authoritative figures for keeping health, which was proved by Rabl and De Nazelle (2012) [51] and the World Health Organization, so the expected target of 45 min might lack the power to further motivate walking and cycling. The authentic and appropriate time target was effective, but this target might have given people a misunderstanding such that once the objective was accomplished, they were more likely to decrease their trips of walking and cycling. This probably indicates that these decreased trips are mainly for leisure and not for commuting. Therefore, the participants’ time improvements of active mobility were potentially relevant to their leisure or sport travels rather than commuting. In this respect, the great effect of information intervention in encouraging active commuting after the experiment might be reduced. Moreover, TTcar and TTsum decreased substantially after the information intervention, which implied that car owners might prefer to travel less rather than making the shift from car to walking or riding a bicycle to a certain extent. It may be enlightening from a policy perspective that the “reduction” strategy (i.e., reducing travel times and distances [52]) will be superior to the “transfer” strategy (i.e., transferring to on-foot, bicycle, or public transport [52]) to control car usage and emissions.
In addition, a third-stage questionnaire (T3) was delivered to the participants online in WeChat on 3 May 2020 to further examine the long-term effect of information intervention. Finally, only 42 participants were connected and submitted the questionnaire. Table 6 shows the differences between T3 and T1 by means of Fisher’s exact tests that are valid when sample sizes are smaller than 40. It can be seen in Table 6 that the time and trip of walking and cycling decreased substantially in the CG and IG1 groups. As a contrast, walking time in IG2 and IG3 increased slightly, but did not reach the 30 min target. Hence, the long-term effect of health information on encouraging non-motorized travel was small and not significant. There was a large increase in the time of using a car in all groups, and the car-use trips saw a small decrease simultaneously. Furthermore, the sum of the total time (TTsum) in all groups dropped dramatically. All these outcomes may demonstrate a great influence of the COVID-19 epidemic [53]. Although production and operations activities resumed in Hefei city on 18 March 2020, car owners prefer to reduce the trips of all city travels and increase the hours of driving every day. Regardless, a slight increase in the walking time in the IG2 and IG3 groups will still provide some evidence for the positive incentive provided by the health information.
Table 6.
Long-term effects of the information intervention. The significances between T1 and T3 were tested by Fisher’s exact tests.
There are some limitations that are likely to have influenced the results in this study. Firstly, car owners in this experiment were slightly biased towards ones of a younger age and with more education. Golob and Hensher (1998) [54], Plaut (2005) [55], Clark et al. (2016) [56], and Geng et al. (2017) [57] indicated that a younger and well-educated individual was more inclined to travel in cleaner ways. However, these differences were not significant between the control and experimental groups, which presents no interferences with the outcomes in this study. For older populations of over 50 years old, bus and transit might be a wiser strategy for encouraging green travel. Secondly, no specific and measurable targets were set in the environmental information, e.g., individual mitigation target. Future studies can explore the different effects of the targets between environmental and health information. Finally, current grouping could not reach the conclusion that the combination of health and environmental information was the best strategy. This was partly because of the limited sample size. Hence, the experimental group with health information alone would be better when a larger sample size is available.
6. Conclusions and Suggestions
This study first introduced the protection motivation theory to sustainable travel issues and presented an experimental evaluation of the effects of different information on encouraging car owners to travel on foot and by bicycle. The results showed that environmental information alone had no significant influence on encouraging car owners’ non-motorized travels. When health information was added, the information intervention could effectively encourage a time increase in walking and cycling as well as a time and trip decrease in car uses. Furthermore, this is mainly a short-term effect rather than a long-term effect. The participants were inclined to decrease the trips on foot and by bicycle once they had achieved the time target, causing the amount of their total travel trips to decrease substantially. Furthermore, the results demonstrated that there were no significant differences between the high and the low target settings in health information for encouraging non-motorized travel. Finally, severity showed significant relationships with the change of time or trip on foot and by bicycle. Vulnerability emerged as a non-effective predictor. Reward, self-efficacy, response efficacy, and response cost emerged as the more significant variables in predicting the change of time or trips by car.
These conclusions will give some contributions to the existing literature and provide practical implications to government management, which may be vital in bridging the gaps in three directions. Firstly, health information with set targets is superior to environmental information in reducing car uses and in encouraging non-motorized travel. Furthermore, objective, authentic, specific, measurable, and attainable target setting contained in the information would be highly recommended. Hefei city now conducts plenty of travel awareness activities and advertising to promote urban residents’ sustainable travel behavior. However, these efforts mainly focus on environmental protection, which neglects the potentially stronger encouragement from health information. Moreover, the information and persuasion have not given people a specific target on how to examine their efforts in changing travel behavior and achieving the goal. As a result, it will bring about a loss of belief and efficacy and fail to build cumulative knowledge about how to conduct sustainable travel. Secondly, the “reduction” strategy is superior to the “transfer” strategy in controlling car usage to a certain extent. Persuading car-dependent individuals to reduce trips might be a smarter and more effective method than shifting to a non-motorized mode. Hence, some mandatory driving restrictions and an individual carbon trading scheme might be useful for guiding this group. Finally, the policymakers of local government should design intervention strategies relevant to the coping appraisal rather than the threat appraisal. The policies and measures should focus on what interventions might improve the benefits and perceived efficacy of non-motorized travel, relevant to positive experiences and perceptions of comfort, clean travel, convenience, and safety. Based on this, we need to construct a good physical, psychological, and cultural environment toward non-motorized modes of transport [58].
Author Contributions
J.G. developed the idea, conceptualization, experimentation, and writing (original draft and revisions). R.L. contributed to the experimentation part; L.Y. contributed to the software, resources, and supervision; J.Z. and G.E.B. contributed to the investigation and language editing. All authors have read and agreed to the published version of the manuscript.
Funding
This research was funded by the MOE (Ministry of Education in China) Project of Humanities and Social Sciences (No.19YJCZH037), Key Research Fund for Young Teachers of Anhui University of Science and Technology (No. QNSK201801), Start-up fund for motivating young researchers of Anhui University of Science and Technology, the Major Project of National Social Sciences Foundation of China (No. 19ZDA107), the National Natural Science Foundation of China (No. 71874188), the Excellent Young Talents Program Project of Anhui Province, China (No. gxyq2017010).
Conflicts of Interest
The authors declare no conflict of interest.
References
- Garvill, J.; Marell, A.; Nordlund, A. Effects of Increased Awareness on Choice of Travel Mode. Transportation 2003, 30, 63–79. [Google Scholar] [CrossRef]
- Rijnsoever, F.V.; Farla, J.; Dijst, M.J. Consumer Car Preferences and Information Search Channels. Transp. Res. Part D Transp. Environ. 2009, 14, 334–342. [Google Scholar] [CrossRef]
- Farag, S.; Lyons, G. Explaining Public Transport Information Use When a Car is Available: Attitude Theory Empirically Investigated. Transportation 2010, 37, 897–913. [Google Scholar] [CrossRef]
- Laakso, S.S. Giving up cars—The Impact of a Mobility Experiment on Carbon Emissions and Everyday Routines. J. Clean. Prod. 2017, 169, 135–142. [Google Scholar] [CrossRef]
- Jones, C.H.D.; Ogilvie, D. Motivations for Active Commuting: A Qualitative Investigation of the Period of Home or Work Relocation. Int. J. Behav. Nutr. Phys. Act. 2012, 9, 109. [Google Scholar] [CrossRef]
- Geng, J.; Long, R.; Chen, H. Impact of Information Intervention on Travel Mode Choice of Urban Residents with Different Goal Frames: A Controlled Trial in Xuzhou, China. Transp. Res. Part A Policy Pr. 2016, 91, 134–147. [Google Scholar] [CrossRef]
- Lu, T.; Mondschein, A.; Buehler, R.; Hankey, S. Adding Temporal Information to Direct-Demand Models: Hourly Estimation of Bicycle and Pedestrian Traffic in Blacksburg, VA. Transp. Res. Part D Transp. Environ. 2018, 63, 244–260. [Google Scholar] [CrossRef]
- Graham-Rowe, E.; Skippon, S.; Gardner, B.; Abraham, C. Can We Reduce Car Use and, If So, How? A Review of Available Evidence. Transp. Res. Part A Policy Pr. 2011, 45, 401–418. [Google Scholar] [CrossRef]
- Rose, G.; Ampt, E. Travel Blending: An Australian Travel Awareness Initiative. Transp. Res. Part D Transp. Environ. 2001, 6, 95–110. [Google Scholar] [CrossRef]
- Brazil, W.; Caulfield, B. Does Green Make a Difference: The Potential Role of Smartphone Technology in Transport Behaviour. Transp. Res. Part C Emerg. Technol. 2013, 37, 93–101. [Google Scholar] [CrossRef]
- Chen, F.; Chen, H.; Yang, J.; Long, R.; Long, R. Impact of Information Intervention on the Recycling Behavior of Individuals with Different Value Orientations—An Experimental Study on Express Delivery Packaging Waste. Sustainability 2018, 10, 3617. [Google Scholar] [CrossRef]
- Hounsham, S. Painting the Town Green: How to Persuade People to Be Environmentally Friendly; Green Engage Communications/Transport: London, UK, 2006. Available online: https://www.greenfunders.org/resource/painting-the-town-green-how-to-persuade-people-to-be-environmentally-friendly/ (accessed on 29 July 2020).
- Klöckner, C.A.; Friedrichsmeier, T.A. Multi-Level Approach to Travel Mode Choice—How Person Characteristics and Situation Specific Aspects Determine Car Use in a Student Sample. Transp. Res. Part F: Traffic Psychol. Behav. 2011, 14, 261–277. [Google Scholar] [CrossRef]
- Klöckner, C.A.; Matthies, E. How Habits Interfere with Norm-Directed Behaviour: A Normative Decision-Making Model for Travel Mode Choice. J. Environ. Psychol. 2004, 24, 319–327. [Google Scholar] [CrossRef]
- Eriksson, L.; Garvill, J.; Nordlund, A.M. Interrupting Habitual Car Use: The Importance of Car Habit Strength and Moral Motivation for Personal Car Use Reduction. Transp. Res. Part F Traffic Psychol. Behav. 2008, 11, 10–23. [Google Scholar] [CrossRef]
- Geng, J.; Long, R.; Chen, H.; Li, W. Exploring the Motivation-Behavior Gap in Urban Residents’ Green Travel Behavior: A Theoretical and Empirical Study. Resour. Conserv. Recycl. 2017, 125, 282–292. [Google Scholar] [CrossRef]
- Osbourne, J.A.; Clarke, M. Factors Motivating the Acceptance of New Information and Communication Technologies in UK Healthcare. Int. J. Heal. Inf. Syst. Inform. 2006, 1, 29–39. [Google Scholar] [CrossRef]
- Wolff, K.; Nordin, K.; Brun, W.; Berglund, G.; Kvale, G. Affective and Cognitive Attitudes, Uncertainty Avoidance and Intention to Obtain Genetic Testing: An Extension of the Theory of Planned Behaviour. Psychol. Heal. 2011, 26, 1143–1155. [Google Scholar] [CrossRef]
- Bamberg, S.; Ajzen, I.; Schmidt, P. Choice of Travel Mode in the Theory of Planned Behavior: The Roles of Past Behavior, Habit, and Reasoned Action. Basic Appl. Soc. Psychol. 2003, 25, 175–187. [Google Scholar] [CrossRef]
- Anable, J.; Lane, B.; Kelay, T. An Evidence Base Review of Public Attitudes to Climate Change and Transport Behaviour; Department for Transport: London, UK, 2006. Available online: https://www.fcrn.org.uk/sites/default/files/Evidence_of_public_attitudes_and_behaviour.pdf (accessed on 29 July 2020).
- Antimova, R.; Nawijn, J.; Peeters, P. The Awareness/Attitude-Gap in Sustainable Tourism: A Theoretical Perspective. Tour. Rev. 2012, 67, 7–16. [Google Scholar] [CrossRef]
- Clark, M.S.; Waddell, B.A. Effects of Moods on Thoughts about Helping, Attraction and Information Acquisition. Soc. Psychol. Q. 1983, 46, 31–35. [Google Scholar] [CrossRef]
- Witte, K.; Allen, M. A Meta-Analysis of Fear Appeals: Implications for Effective Public Health Campaigns. Heal. Educ. Behav. 2000, 27, 591–615. [Google Scholar] [CrossRef] [PubMed]
- Bamberg, S.; Hunecke, M.; Blöbaum, A. Social Context, Personal Norms and the Use of Public Transportation: Two Field Studies. J. Environ. Psychol. 2007, 27, 190–203. [Google Scholar] [CrossRef]
- Chorus, C.G.; Arentze, T.A.; Timmermans, H.J. A Random Regret-Minimization Model of Travel Choice. Transp. Res. Part B Methodol. 2008, 42, 1–18. [Google Scholar] [CrossRef]
- Scott, R.B.; Dennis, F.G.; Paul, B.L.; Gregory, D.M.; Peter, P. What do Users have to Fear? Using Fear Appeals to Engender Threats and Fear that Motivate Protective Behaviors in Users. MIS Q. 2015, 39, 837–864. [Google Scholar]
- Das, E.H.; de Wit, J.B.; Stroebe, W. Fear Appeals Motivate Acceptance of Action Recommendations: Evidence for a Positive Bias in the Processing of Persuasive Messages. Pers. Soc. Psychol. Bull. 2003, 29, 650–664. [Google Scholar] [CrossRef] [PubMed]
- Rogers, R.W. A Protection Motivation Theory of Fear Appeals and Attitude Change1. J. Psychol. 1975, 91, 93–114. [Google Scholar] [CrossRef]
- Maddux, J.E.; Rogers, R.W. Protection Motivation and Self-Efficacy: A Revised Theory of Fear Appeals and Attitude Change. J. Exp. Soc. Psychol. 1983, 19, 469–479. [Google Scholar] [CrossRef]
- Floyd, D.L.; Rogers, R.W.; Prentice-Dunn, S. A Meta-Analysis of Research on Protection Motivation Theory. J. Appl. Soc. Psychol. 2000, 30, 407–429. [Google Scholar] [CrossRef]
- The United Nations Framework Convention on Climate Change, 2010. UNFCCC Glossary of Climate Change Acronyms, Archived 29 April 2010 at the Wayback Machine. Available online: https://unfccc.int/ (accessed on 24 October 2010).
- Verkoeyen, S.; Nepal, S.K. Understanding Scuba Divers’ Response to Coral Bleaching: An Application of Protection Motivation Theory. J. Environ. Manag. 2019, 231, 869–877. [Google Scholar] [CrossRef] [PubMed]
- Kuruppu, N.; Liverman, D. Mental Preparation for Climate Adaptation: The role of Cognition and Culture in Enhancing Adaptive Capacity of Water Management in Kiribati. Glob. Environ. Chang. 2011, 21, 657–669. [Google Scholar] [CrossRef]
- Koerth, J.; Vafeidis, A.T.; Hinkel, J.; Sterr, H. What Motivates Coastal Households to Adapt Pro-Actively to Sea-Level Rise and Increasing Flood Risk? Reg. Environ. Chang. 2013, 13, 897–909. [Google Scholar] [CrossRef]
- Horng, J.S.; Hu, M.L.M.; Teng, C.C.C.; Lin, L. Energy Saving and Carbon Reduction Behaviors in Tourism—a Perception Study of Asian Visitors from a Protection Motivation Theory Perspective. Asia Pac. J. Tourism Res. 2014, 19, 721–735. [Google Scholar] [CrossRef]
- Wang, W.; Lin, C.; Lu, W.; Lee, S.; Lin, C.; Lu, W.; When, S.L. Current Issues in Tourism When Destination Attractiveness Shifts in Response to Climate Change: Tourists’ Adaptation Intention in Taiwan’s Kenting National Park. Curr. Issues Tour. 2019, 22, 522–543. [Google Scholar] [CrossRef]
- Joireman, J.A.; Van Lange, P.A.M.; Van Vugt, M. Who Cares about the Environmental Impact of Cars? Those with an Eye toward the Future. Environ. Behav. 2004, 36, 187–206. [Google Scholar] [CrossRef]
- Steg, L.; Sievers, I. Cultural Theory and Individual Perceptions of Environmental Risks. Environ.Behav. 2000, 32, 250–269. [Google Scholar] [CrossRef]
- Tapsuwan, S.; Rongrongmuang, W. Climate Change Perception of the Dive Tourism Industry in Koh Tao Island, Thailand. J. Outdoor Recreat. Tour. 2015, 11, 58–63. [Google Scholar] [CrossRef]
- Thøgersen, J.; Møller, B. Breaking Car Use Habits: The Effectiveness of a Free One-Month Travelcard. Transportation 2008, 35, 329–345. [Google Scholar] [CrossRef]
- Fujii, S.; Taniguchi, A. Reducing Family Car-Use by Providing Travel Advice or Requesting Behavioral Plans: An Experimental Analysis of Travel Feedback Programs. Transp. Res. Part D Transp. Environ. 2005, 10, 385–393. [Google Scholar] [CrossRef]
- Bamberg, S. Is a Residential Relocation a Good Opportunity to Change People’s Travel Behavior? Results From a Theory-Driven Intervention Study. Environ. Behav. 2006, 38, 820–840. [Google Scholar] [CrossRef]
- Rompalo, A.; Chambers, R.; Rosenstock, S.; Goklish, N.; Lee, A.; Tingey, L. Exploring the Role of Sex and Sexual Experience in Predicting American Indian Adolescent Condom Use Intention Using Protection Motivation Theory. Sex Transm. Infect. 2017, 93, A17. [Google Scholar]
- Nabizadeh, S.M.; Taymoori, P.; Hazhir, M.S.; Shirazi, M.; Roshani, D.; Shahmoradi, B. Predicting Vitamin E and C Consumption Intentions and Behaviors among Factory Workers Based on Protection Motivation Theory. Environ. Heal. Prev. Med. 2018, 23, 51. [Google Scholar] [CrossRef] [PubMed]
- Menard, P.; Warkentin, M.; Lowry, P.B. The Impact of Collectivism and Psychological Ownership on Protection Motivation: A Cross-Cultural Examination. Comput. Secur. 2018, 75, 147–166. [Google Scholar] [CrossRef]
- Gössling, S.; Peeters, P. ‘It Does not Harm the Environment!’ An Analysis of Industry Discourses on Tourism, Air Travel and the Environment. J. Sustain. Tour. 2007, 15, 402–417. [Google Scholar] [CrossRef]
- Lindenberg, S.; Steg, L. Normative, Gain and Hedonic Goal Frames Guiding Environmental Behavior. J. Soc. Issues 2007, 63, 117–137. [Google Scholar] [CrossRef]
- Locke, E.A. Toward a Theory of task Motivation and Incentives. Organ. Behav. Hum. Perform. 1968, 3, 157–189. [Google Scholar] [CrossRef]
- Paulssen, M.; Temme, D.; Vij, A.; Walker, J.L. Values, Attitudes and Travel Behavior: A Hierarchical Latent Variable Mixed Logit Model of Travel Mode Choice. Transportation 2014, 41, 873–888. [Google Scholar] [CrossRef]
- Morris, E.A.; Guerra, E. Mood and Mode: Does How We Travel Affect How We Feel? Transportation 2014, 42, 25–43. [Google Scholar] [CrossRef]
- Rabl, A.; De Nazelle, A. Benefits of Shift from Car to Active Transport. Transp. Policy 2012, 19, 121–131. [Google Scholar] [CrossRef]
- International Energy Agency. Energy Technology Perspectives: Towards Sustainable Urban Energy Systems; IEA: Paris, Frence, 2016. [Google Scholar]
- Le Quéré, C.; Jackson, R.B.; Jones, M.W.; Smith, A.J.P.; Abernethy, S.; Andrew, R.; De-Gol, A.J.; Willis, D.R.; Shan, Y.; Canadell, J.G.; et al. Temporary Reduction in Daily Global CO2 Emissions during the COVID-19 Forced Confinement. Nat. Clim. Chang. 2020, 10, 647–653. [Google Scholar] [CrossRef]
- Golob, T.F.; Hensher, D.A. Greenhouse Gas Emissions and Australian Commuters’ Attitudes and Behavior Concerning Abatement Policies and Personal Involvement. Transp. Res. Part D Transp. Environ. 1998, 3, 1–18. [Google Scholar] [CrossRef]
- Plaut, P.O. Non-Motorized Commuting in the US. Transp. Res. Part D Transp. Environ. 2005, 10, 347–356. [Google Scholar] [CrossRef]
- Clark, B.; Chatterjee, K.; Melia, S. Changes to Commute Mode: The Role of Life Events, Spatial Context and Environmental Attitude. Transp. Res. Part A Policy Pr. 2016, 89, 89–105. [Google Scholar] [CrossRef]
- Geng, J.; Long, R.; Chen, H.; Yue, T.; Li, W.; Long, R. Exploring Multiple Motivations on Urban Residents’ Travel Mode Choices: An Empirical Study from Jiangsu Province in China. Sustainability 2017, 9, 136. [Google Scholar] [CrossRef]
- Geng, J.; Long, R.; Chen, H.; Long, R. Urban Residents’ Response to and Evaluation of Low-Carbon Travel Policies: Evidence from a Survey of Five Eastern Cities in China. J. Environ. Manag. 2018, 217, 47–55. [Google Scholar] [CrossRef]


© 2020 by the authors. Licensee MDPI, Basel, Switzerland. This article is an open access article distributed under the terms and conditions of the Creative Commons Attribution (CC BY) license (http://creativecommons.org/licenses/by/4.0/).