Article

Exploring Arbitrage Strategies in Corporate Social Responsibility Companies

by
Estefanía Montoya-Cruz
1,
José Pedro Ramos-Requena
1,
Juan Evangelista Trinidad-Segovia
1,* and
Miguel Ángel Sánchez-Granero
2
1
Departamento de Economía y Empresa, Universidad de Almería, Carretera Sacramento, s/n, La Cañada de San Urbano, 04120 Almería, Spain
2
Departamento de Matemáticas, Universidad de Almería, Carretera Sacramento, s/n, La Cañada de San Urbano, 04120 Almería, Spain
*
Author to whom correspondence should be addressed.
Sustainability 2020, 12(16), 6293; https://doi.org/10.3390/su12166293
Submission received: 6 July 2020 / Revised: 26 July 2020 / Accepted: 30 July 2020 / Published: 5 August 2020
(This article belongs to the Section Economic and Business Aspects of Sustainability)

Abstract

:
Today, Socially Responsible financial investment has taken on particular importance. Investors normally select their most profitable investments, but over the years they have appreciated that companies develop Socially Responsible policies. Financial indices have also created Socially Responsible versions. In this paper, we run a statistical arbitrage technique known as Pairs Trading using stocks of the FTSE4GOOD Socially Responsible Index. Different strategies will be tested to demonstrate that there are no significant differences between the performance of the portfolio composed by Corporate Social Responsibility (CSR) stocks and those composed by ordinary stocks.

1. Introduction

Socially responsible investment (SRI) can be defined as decision making based on environmental and social criteria and not exclusively on financial results [1,2]. This type of investment can also be called ethical, green or sustainable investment [3].
Berlarsi et al. [4] has focused on whether the company’s financial situation can be improved by opting for a socially responsible policy. The studies focus on the relationship between three factors: performance, financial results and the quality of business sustainability [5].
It is not clear the association between Corporate Social Responsibility (henceforth CSR) and financial performance. Part of the financial literature find a negative association because CSR supposes a cost. Jaggi and Freedman [6], Molloy et al. [7] and Clarkson and Li [8] report a mixed or negative relationship between environmental performance measures and accounting profitability.
Zhang and Guo [9] find that there is no significant relationship between social responsibility and corporate market performance and that indicators have stronger explanatory power than market indicators.
On the other hand, there are other studies that confirm that companies that apply socially responsible policies obtain higher financial returns [10,11,12]. Herremans [13], McGuire et al., [14] and Barnett [15] determine that benefits of CSR, such as increase in employee morale, goodwill, etc, exceed its costs. Pava [16] and Cochran and Wood [17] also find weak evidence to suggest that a positive association exists.
Alexander and Buchholz [18], Waddock and Graves [19] and Clarkson et al., [20] introduce a financial resources approach arguing that only firms with enough resources are able to invest in CSR, that is why CSR is associated with a better performance than others. Wang and Sarkis [21] use a sample of 1980 firms from the top 500 Green companies in the United States for a period of 5 years (2009–2013) to conclude that implementation of CSR governance contributes influences positively in the financial performance.
Ameer and Othman [22] find that companies focused on sustainability practices have better financial performance compared to those without such commitments in some activity sectors. Katsikides et al. [23] used the “event-study” methodology to analyse the relationship between Corporate Social Responsibility (CSR) and stock market performance finding that some CSR events have a significant effect on stock market performance. Artiach et al. [24] find that Dow Jones Sustainability Index (DJSI) firms are significantly different from other firms on the dimensions of size, profitability and level of growth options. Brammer et al. [25] investigated the relationship between CSR and financial performance, measured using stock returns, for a sample of UK quoted companies. Authors found that firms with higher social performance scores tend to achieve lower returns, while firms with the lowest possible CSR scores of zero outperformed the market. Lins et al. [26] found that firms with high CSR ratings outperform firms with low CSR ratings during the financial crisis by at least four percentage points. However, authors also found that this excess return disappeared during the recovery period after the crisis.
A third group reports no direct association between CSR and financial performance. Ullmann [27] argues that the relationship between CSR and financial performance is complex and difficult to determine. The studies by Lee [28], Becchetti et al. [29] and McWilliams and Siegel [30] did not find evidence of a relevant association between CSR and financial performance.
In a similar line are the results obtained in the financial literature regarding to the performance of SRI funds. Pioneers works of Diltz [31], Guerard [32] and DiBartolomeo and Kurtz [33] reported a better performance than unscreened ones.
Statman [34] found that the SRI slightly outperformed the S&P 500 over a period of 8 years. Cox et al. [35] extended the analysis to the US market finding that poor corporate social performance leads to a reduction in the number of long-term institutional investors holding the firm’s stock. Using a factor model, Derwall et al. [36] concluded that a stock portfolio consisting of companies labeled “most ecoefficient” sizably outperformed its “less ecoefficient” counterpart over the period 1995–2003. Konar and Cohen [37] reported that market value of firms in the S&P 500 that make reduction in emissions of toxic chemicals results in a increase in market value. Belghitar and others [38], analyze the mean variance between the FTSE4GOOD and conventional investments in which they show that there are no significant differences between those indices. Sariannidis et al. [39] studied the impact of several macroeconomic variables on the Dow Jones Sustainability and Dow Jones Wilshire 5000 indices; using the GARCH method with monthly data, they found that the sustainability index reacts with a one-month delay to changes in oil and 10-year bond prices; they therefore concluded that we are facing inefficient markets and investors will wait to see trends in macroeconomic data before investing in socially sustainable securities.
El Ghoul et al. [40] found that companies with a better reputation for CSR enjoy significantly lower equity costs; therefore, these companies have higher value and lower risks. Chen et al. [41] found that those companies with better CSR performance can reduce their idiosyncratic risk. In other words, companies that develop a CSR can improve operational performance and ensure continuous cash flow in the long term and save on capital costs in the short term, thus creating overall value for the company [42].
However, Geczy et al. [43] and Teper [44] and White [45] found a negative one. Also, Bauer et al (2005) [46] found that US and German ethical funds underperform their benchmark in terms of their risk-adjusted returns. Ziegler et al. [47] tested an investment strategy consisting in buying eco stocks and selling stocks of firms with little or null climate change mitigation polices. Authors obtained a negative abnormal return. Barnet and Soloman [48] extended the analysis to a panel of 61 SRI funds. Authors showed that the relationship between financial and social performance is neither strictly negative nor strictly positive. This paper also found that some types of social responsibility are linked to higher financial performance than others.
This work tries to obtain new evidences of the profitability of investment strategies based on CSR criteria using statistical arbitrage techniques. We will prove that CSR does not affect significantly to the arbitrage strategies and an investor which runs his investment based on CSR criteria is able to obtain a similar performance than other investors. For that, we will take the components of the FTSE4GOOD index (FTSE4Good refers to a series of stock market indices on the London Stock Exchange, which groups together companies with sound environmental, social and governance practices. [49]) and the FTSE100 index (FTSE-100 is the benchmark stock index of the London Stock Exchange. It comprises the 100 largest market capitalisation companies in the UK.) to run a Pairs Trading strategy in different scenarios.
Pairs Trading is an investment strategy based on the notion of two stock quotes co-movement with each other. If the two prices differ, a long-short position can be used to benefit from the expected future price reconversion. Although pairs can be formed from fundamental similarities between firms, the modern embodiment of the strategy is typically based on statistical principles, choosing stock pairs whose share prices have previously moved very closely according to some statistical measure (Farago et al. [50]).

2. Methodology

Pairs trading is an arbitrage trading strategy consisting in exploiting price movements of assets which are related to each other. This strategy is based on the existence of an equilibrium relationship between pairs of assets.
There is not consensus about the origin of Pairs Trading. A part of the financial literature accept that this methodology was introduced in mid-1980s, when a quantitative analyst of Morgan Stanley, Nunzio Tartaglia, joined a group of experts of different fields to develop a quantitative arbitrage strategy based on securities that had the tendency to move together. Other researchers such us Wilmott [51] attribute to a computer scientist and trader, Gerald Bamberger, the foundation of Pairs Trading earlier than Nunzio.
Financial literature has introduced different methodologies for pair selection. Important contributions are the distance method [52], those based on correlation [53] and cointegration [54], the copula method [55] or Hurst exponent based method [56,57].

2.1. Distance

This approach was developed by Gatev et al. [52] and subsequently applied by Andrade et al. [58], Engelberg et al. [59], Perlin [60], Do et al. [61], Bowen et al. [62] and Do et al. [63]. It will measure the co-movement of two stocks as the squared distance of the standardized price series. In addition, it assumes that the co-movement of the pair will be greater when the distance between their prices is smaller.
The distance squared of the standard stocks prices (EDD) is calculated as follows:
E D D = t ( S A ( t ) S B ( t ) ) 2
where S A and S B are the standardized prices of A and B shares in period t.
Once the distance between the stocks has been calculated, the pairs with the shortest distance will be chosen.

2.2. Correlation

This method will focus on the selection of values based on the degree of correlation that exists between their returns [53]. To analyze the potential pairs and study their degree of correlation, Pearson correlation coefficient will be used. This coefficient for two stocks (A and B) is given by the expression:
ρ = i = 1 n ( A i A i ¯ ) ( B i B i ¯ ) i = 1 n ( A i A i ¯ ) 2 i = 1 n ( B i B i ¯ ) 2
where A i and B i are the log-return of stocks A and B respectively and A i ¯ , B i ¯ are the mean of A i and B i respectively.
The higher the value of this coefficient, the more similar they move, both when faced with increases and decreases in value. Therefore, those pairs of values with a higher Pearson correlation coefficient will be chosen.

2.3. Cointegration

The concept of Cointegration was developed by Engle and Granger [64] and introduced into the field of statistical arbitration by Vidyamurthy [54].
If P t A and P t B , are the prices of A and B stocks, and it is assumed that the price of both stocks individually are not stationary, but there is a parameter γ , which converts through the following equation into a stationary process:
P t A γ P t B = μ + ϵ t
where:
  • μ is the mean
  • ϵ t is the residue
  • γ is the cointegration coefficient
The regression parameters will be estimated by the Ordinary Least Squares (OLS) method. And finally, to check if the two actions are co-integrated, it will be done through the Augmented Dicey Fuller test, in order to check if the ϵ t residue is stationary or not.

2.4. Hurst Exponent

Ramos-Requena et al. [56] introduced Hurst exponent as a management tool for statistical arbitrage strategies based on the concept of reversion to the mean. The work that has been done on Pairs Trading, selects pairs looking for stocks that are correlated or co-integrated so that the pair meets the property of mean reversion.
To meet the property of mean reversion the most logical thing to do is to look for pairs with a low H value.
Of the different approaches that have been developed to calculate the Hurst exponent, this paper uses the Generalized Hurst Exponent (GHE) because it is a methodology of relative simplicity and also shows precision with relatively short time series, as is the case with financial series ([65]).
To calculate the Generalized Hurst Exponent (GHE), it will be done as follows:
We consider the following statistic:
K q ( τ ) = < | X ( t + τ ) X ( t ) | q > < | X ( t ) | q >
where X is the time series, τ varies between values 1 and τ m a x and < · > represents the average of the sample during the time window. Choose τ m a x as a quarter of the length of the series.
Therefore, the GHE model can be defined through the behavior of the statistic K q ( τ ) given by the power-law:
K q ( τ ) τ q H ( q ) ·
It can be said that GHE is calculated by linear regression by taking logarithms in the expressions contained in equation (5) [66,67].

2.5. Pairs Trading strategy

In this section, it is shown how the Pairs Trading strategy is calculated:
  • Price Normalization. If two assets A and B, their price is given by P A and P B respectively, the series of the pair A B will be:
    l o g ( P A ) b * l o g ( P B )
    where b is a constant factor, used to normalize the logarithm of the prices of A and B.
    To calculate the value of b, we will use a method introduced in [56,68] that is based on the volatility of stock returns. This factor is calculated as:
    b = σ ( R A ) σ ( R A )
    where R A is the (logarithmic) return of stock A, R B is the (logarithmic) return of stock B and σ is the standard deviation.
    Once you have the value of factor b, you can say that the volatility of A and B stocks are the same, therefore both stocks are normalized.
  • Pair selection. To select the pairs, it will be done through the methods defined in Section 2 (distancie, correlation, cointegration and Hurst exponent). The study period is one year (250 trading days).
  • Trading strategy. Once the values of the pair have been selected, the trading strategy will be carried out. If s is the pair series, m is the moving average of s and σ is the standard deviation of m s , then:
    • If s > m + σ the pair will be sold. The position will be closed when s < m or s > m + 2 σ .
    • If s < m σ the pair will be bought. The position will be closed when s > m or s < m 2 σ .
    The duration of the trading strategy will be 6 months (120 trading days).

3. Experimental Results

In this section, we will apply the statistical arbitrage strategy by taking the daily values of the components of the FTSE100 (see Table A1 and Table A2) and FTSE4GOOD indices (see Table A3), for the period from 1 January 2000 to 3 December 2018. The values of these indices are taken from the Yahoo Finance website. To this end, 3 scenarios will be studied. First, the Pairs Trading strategy will be applied by taking values from the FTSE4GOOD index. In the second scenario we will use the stocks of the FTSE100 index and to conclude we will use a similar strategy than Ziegler et al. [47], buying securities from the FTSE4GOOD index and selling those that make up the FTSE100 index.

3.1. Ftse4good Index

The FTSE4Good Index was launched in 2001 by the FTSE Group. The inclusion of a company in the index is based on a range of corporate social responsibility criteria. The index is designed to measure the performance of companies demonstrating strong Environmental, Social and Governance (ESG) practices.
This indicator is revised twice a year, in March and September, to accept new companies and exclude those that are part of the index and no longer meet the sustainability requirements demanded. This indicator was created with the collaboration of UNICEF, the UN children’s fund, and uses information provided by EIRIS, the Ethical Investment Research Service.
Table A4 presents the results obtained comparing the 4 most popular methods to select pairs (Distance, Correlation, Cointegration, Hurst) limiting the selection to the stocks of the FTSE4GOOD index, for different portfolios during the period 1 January 2000 until 31 December 2018.
This Table A4 shows that the best option is to select the pairs through the Hurst exponent method, introduced by Ramos-Requena et al. [56]. In this case, according to the sharpe ratio (1.66) and the maximum drawdon (3.20% and 2.80%) the best option is to create a portfolio composed of 40 and 50 pairs. However, the 2 pairs portfolio has the highest average annualized return (6.50%).
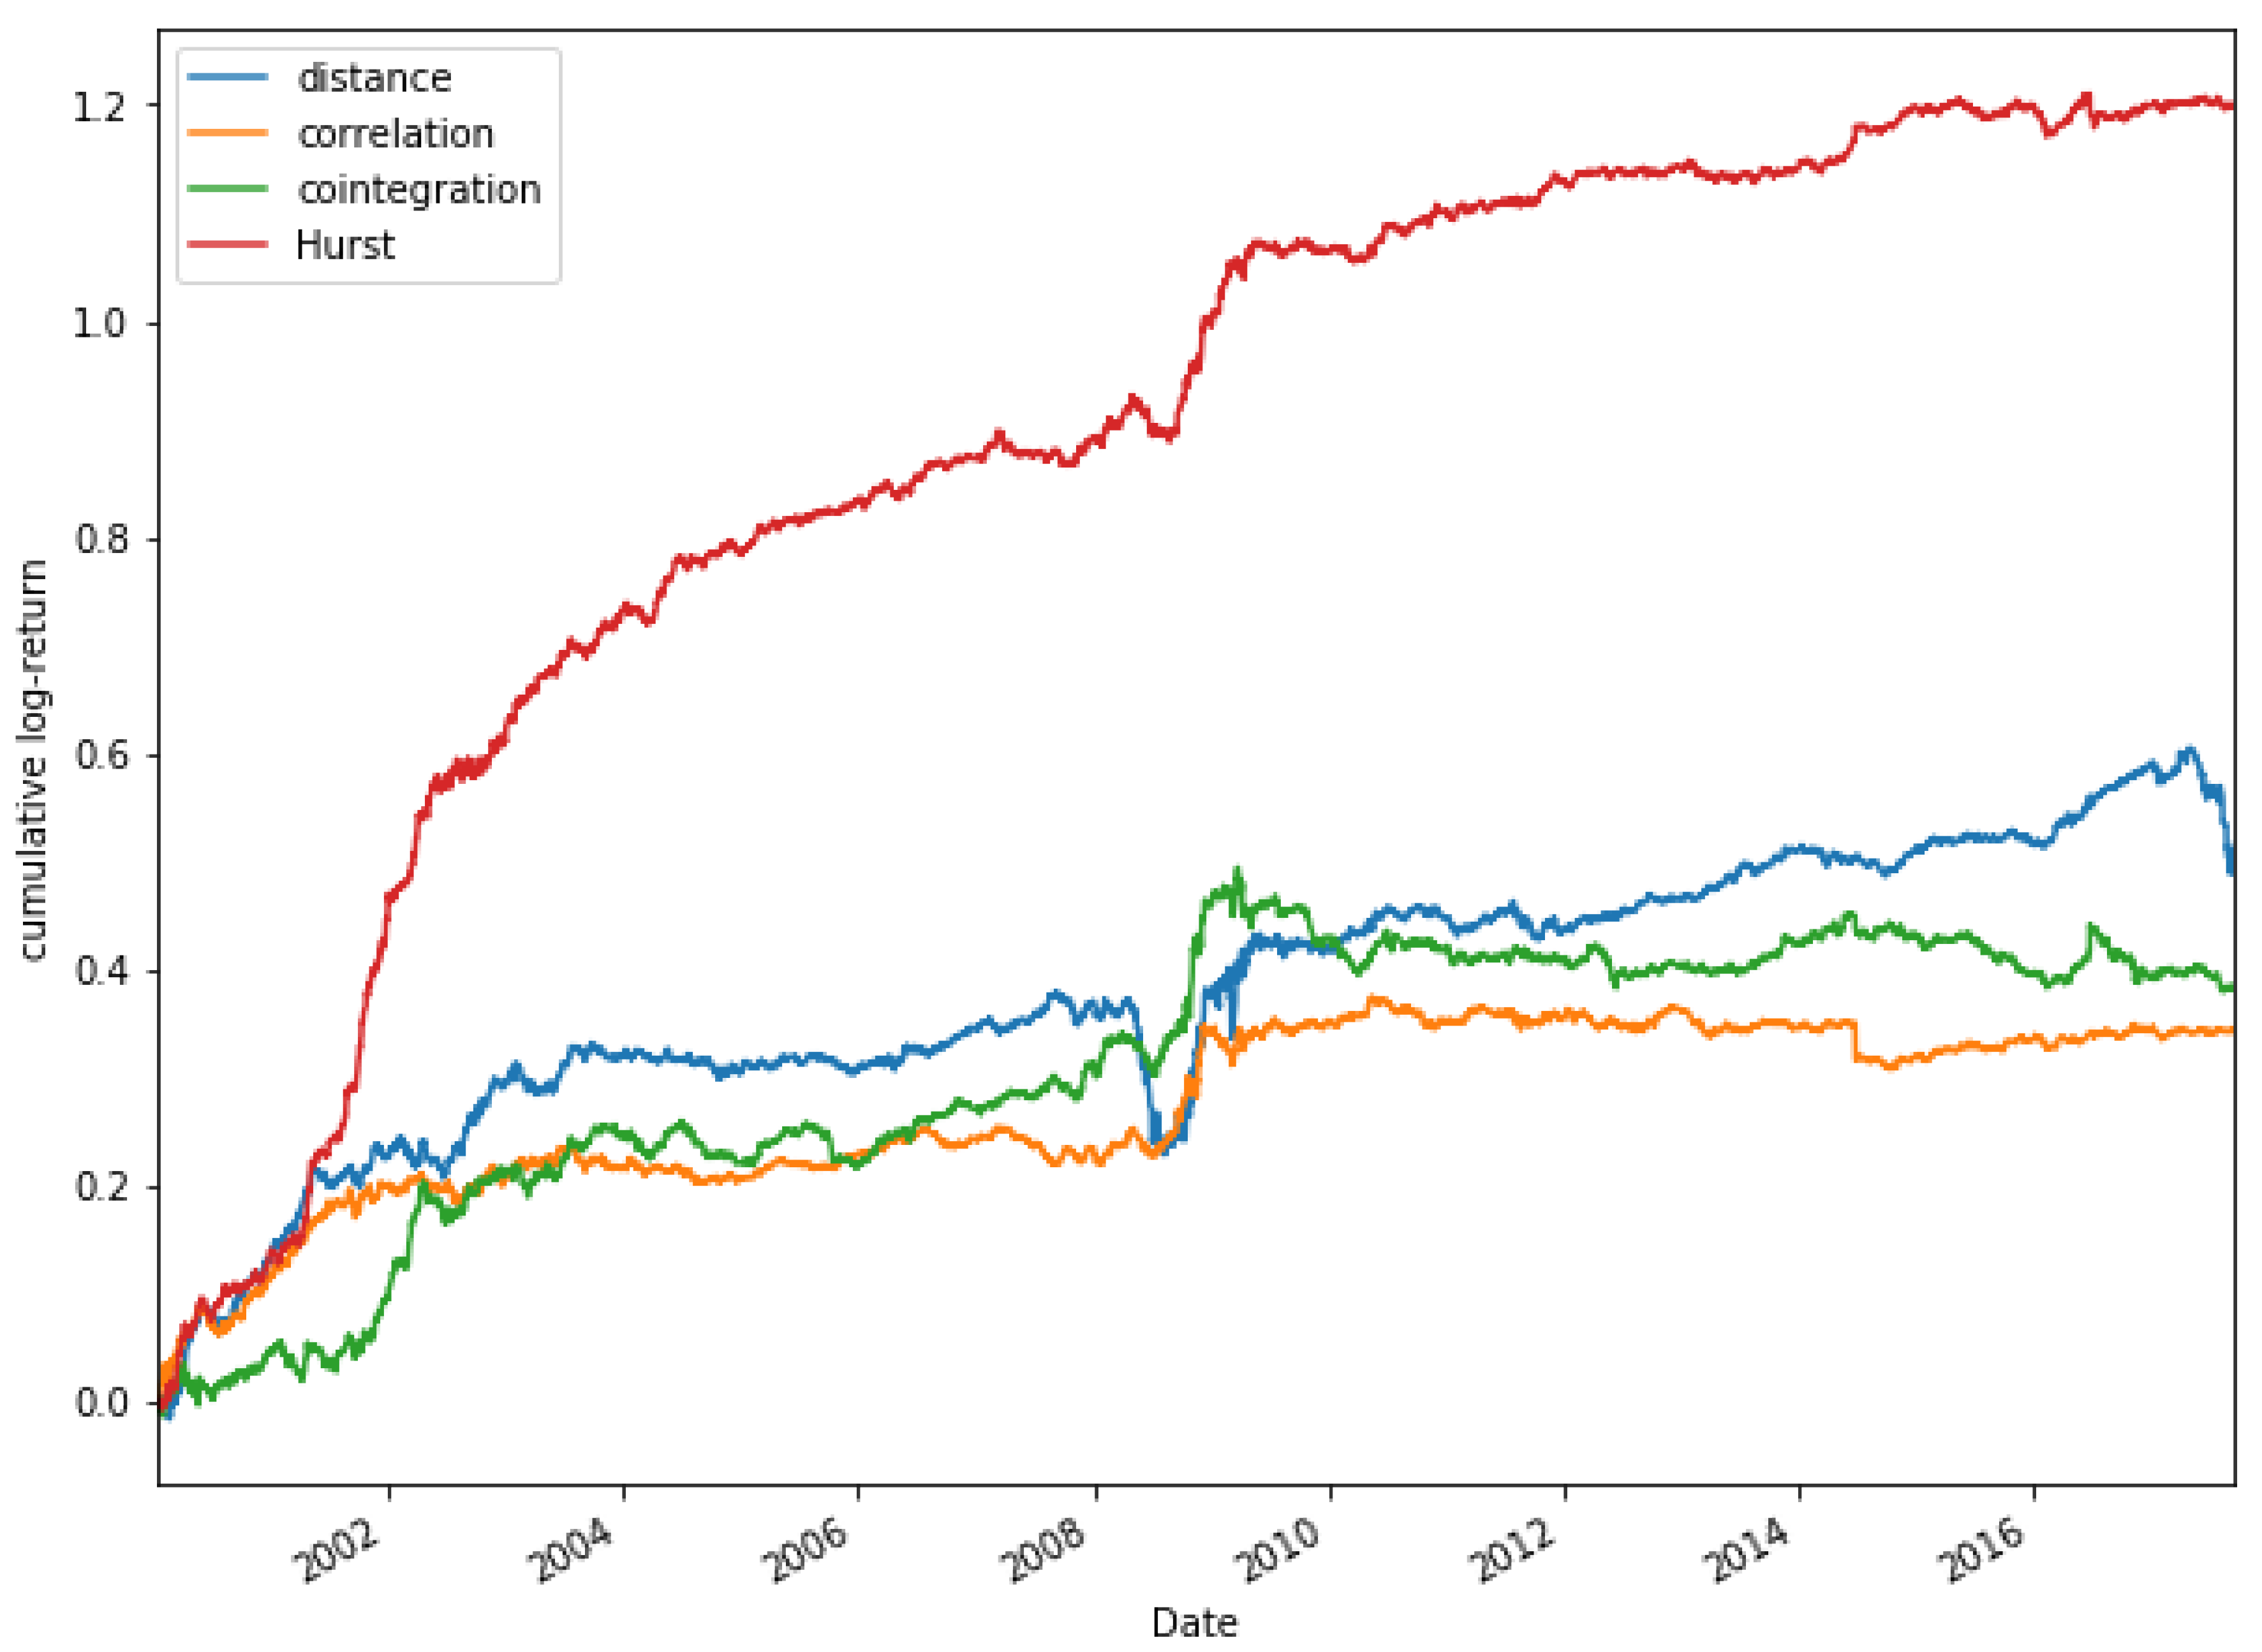
Figure 1 shows a comparison of the cumulative returns according to the selection method used, for a portfolio composed of 30 pairs using FTSE4GOOD index values. It can be seen that the best option is to select the pairs through the Hurst exponent method, which is through which greater accumulated logarithmic returns are obtained. The other approaches move in a very similar way, especially the distance and cointegration methods, the worst option being the correlation method.

3.2. Ftse100 Index

Table A5 shows the results obtained for different portfolios, taking the values that make up the FTSE100 index during the period 2000–2018, using different methodologies to select the pairs and for portfolios composed of different pairs.
Table A5 shows the main results obtained. It can be seen that among the different methods used, the best option is to select them through the Hurst exponent method. If it is decided to create a portfolio, the best option would be to have a portfolio composed of 20 pairs, which would obtain an accumulated yield after transaction constants of 124.36%. Looking at the values of the sharpe ratios tells us that the highest return is achieved by investing in the portfolio of 30 pairs (2.01), using Hursts exponent method to select the pairs.
Figure 2 shows a comparison between the cumulative logarithmic returns obtained for the different selection methods using the stocks of the FTSE100 index. As in Figure 1, the results obtained by the method based on the Hurst exponent are significant, where a large difference can be observed with respect to the other models.

3.3. Buy Ftse4good Index and Sell Ftse100 Index

In this case, we consider all pairs of stocks that belongs to both FTSE4GOOD and FTSE100 index, but only take a position in a pair when a stock of the FTSE4GOOD index is bought and a stock which belongs to FTSE100 but not to FTSE4GOOD is sold. The rationale of this strategy is that if we consider that stocks in the FTSE4GOOD index will perform better than the stocks that are not in the index, then we will only buy stocks from the FTSE4GOOD index, and we will only sell stocks that does not belong to the FTSE4GOOD index, since the hypothesis is that they will do worse in the long run.
Table A6 below shows the results obtained in the case of purchasing shares that are part of the socially responsible index and selling shares that does not belong to it. For this purpose, different portfolios have been formed, made up of different pairs and for the period from January 2000 to December 2018.
As shown in Table A6, it can be seen that the best option for most of the data is to select the pairs through the Hurst exponent method as in the previous data. If we focus on some of the indicators shown in Table A6, the best value of the Sharpe ratio is obtained for the portfolio composed of 30 pairs (1.01) and selecting this method. In relation to the maximum Drawdown, we can see that the best option is the portfolio composed of 50 pairs if they are selected through the distance approach (2.60%), it is significant that as the number of pairs that compose the portfolios increases, the best results are obtained for this indicator. Finally, if the results of R 2 are analysed, it indicates that the greatest robustness is obtained for the portfolios composed of 30 and 50 pairs and selecting them through the distance focus (0.92)
Figure 3 shows the cumulative logarithmic return for a portfolio of 30 pairs, in the event that a decision is made to buy FTSE4GOOD index shares and sell FTSE100 index shares that are not in FTSE4GOOD. When we also consider Figure 1 and Figure 2, it can be seen that the best option is to select the pairs through the Hurst exponent, since it obtains much better results than the rest of the models compared.
Therefore, Table A4, Table A5 and Table A6 prove that our arbitrage strategy does not performance better in the case of the generic index (FTSE100) versus the socially responsible index (FTSE4GOOD). Best results obtained for FTSE4GOOD index is when a portfolio of 10 pairs is used while for the the FTSE100 index is 20. In all cases the best methodology is the based on Hurst Exponent.
If the investor decides to buy shares of the FTSE4GOOD index and sell shares of the FTSE100 index (Not included in FTSE4GOOD), it behaves very similar to the traditional Pairs Trading strategy, although the accumulated returns are lower than in the first case. However, this is due to the fact that less transactions occur, so we should focus better in the Sharpe ratio in this case.
On the contrary, no significant differences can be observed in the case of deciding to buy only shares of the sustainable index and sell shares of the generic index, since for all of them the highest profitability is achieved through the Hurst exponent method and with significant differences to the other methods.
Focusing on the values obtained through the Sharpe ratio, it is shown that the best results are obtained for the sustainability index for the portfolio composed of 10 pairs and selecting them through the Hurst exponent (1.44) and for the rest of the portfolios analyzed the best results are for the results obtained through the FTSE100 index (1.89 (20 pairs), 2.01 (30 pairs), 2 (40 pairs) and 1.96 (50 pairs)) selecting the pairs through the same method.

4. Conclusions

This paper tries to provide new evidences of the profitability of investment strategies based on CSR criteria through a statistical arbitrage technique known as pairs trading. We compare the results of a strategy developed exclusively with the companies of the FTSE4GOOD index and a similar one using companies of the FTSE100 index. In addition, we perform a strategy similar to the one proposed by Ziegler et al. [47] consisting in purchasing socially responsible shares and selling not socially responsible ones.
Results show that the arbitrage strategy is profitable in all cases, but surprisingly the best results are obtained in the case of social CSR companies. This finding are similar to the results obtained by Ameer and Othman [22], Katsikides et al. [23], Derwall et al. [36], Statman [34] or Lins et al. [26]. However, the strategy consisting in buying socially sustainable shares and selling those that are not performs worse which is also in accordance with the results obtained by Ziegler et al. [47].
Our results allow us to conclude that investment strategies such as statistical arbitrage are suitable with CSR companies. This also provide evidence that social responsibility does not affect negatively to the market performance. However, it is also risky to conclude that this relationship is positive. We are more in the line of Zhang and Guo [9], Lee [28], Becchetti et al. [29] and McWilliams and Siegel [30] considering that the relationship between market performance and social performance is neither strictly negative nor strictly positive, but difficult to determine. Therefore, it can be seen from the results obtained that a great advantage cannot be obtained by applying the strategy of pairs trading with values from socially responsible companies as opposed to those that are not.

Author Contributions

Conceptualization, E.M.-C., J.P.R.-R., J.E.T.-S. and M.Á.S.-G.; Methodology, E.M.-C., J.P.R.-R., J.E.T.-S. and M.Á.S.-G.; Software, E.M.-C., J.P.R.-R., J.E.T.-S. and M.Á.S.-G.; Validation, E.M.-C., J.P.R.-R., J.E.T.-S. and M.Á.S.-G.; Formal Analysis, E.M.-C., J.P.R.-R., J.E.T.-S. and M.Á.S.-G.; Investigation, E.M.-C., J.P.R.-R., J.E.T.-S. and M.Á.S.-G.; Resources, E.M.-C., J.P.R.-R., J.E.T.-S. and M.Á.S.-G.; Data Curation, E.M.-C., J.P.R.-R., J.E.T.-S. and M.Á.S.-G.; Writing—Original Draft Preparation, E.M.-C., J.P.R.-R., J.E.T.-S. and M.Á.S.-G.; Writing—Review & Editing, E.M.-C., J.P.R.-R., J.E.T.-S. and M.Á.S.-G.; Visualization, E.M.-C., J.P.R.-R., J.E.T.-S. and M.Á.S.-G.; Supervision, E.M.-C., J.P.R.-R., J.E.T.-S. and M.Á.S.-G.; Project Administration, E.M.-C., J.P.R.-R., J.E.T.-S. and M.Á.S.-G.; Funding Acquisition, J.E.T.-S. and M.Á.S.G. All authors have read and agreed to the published version of the manuscript.

Funding

J.E. Trinidad-Segovia is supported by grant PGC2018-101555-B-I00 (Ministerio Español de Ciencia, Innovación y Universidades and FEDER) and UAL18-FQM-B038-A (UAL/CECEU/FEDER). M.A. Sánchez- Granero is supported by grants PGC2018-101555-B-I00 (Ministerio Español de Ciencia, Innovación y Universidades and FEDER) and UAL18-FQM-B038-A (UAL/CECEU/FEDER) and CDTIME.

Conflicts of Interest

The authors declare no conflict of interest. The funders had no role in the design of the study; in the collection, analyses, or interpretation of data; in the writing of the manuscript, or in the decision to publish the results.

Abbreviations

The following abbreviations are used in this manuscript:
SRISocially Responsible Investment
CSRCorporate Social Responsibility
DJSIDow Jones Sustainability Index
UKUnited Kingdom
S&P 500Standard and Poor’s 500 index
USUnited States
EDDDistance squared of the standard stocks prices
GHEGeneralized Hurst Exponent

Appendix A. Stocks Portfolio Componets

Table A1. FTSE100 index.
TickerCompany
AAL.LAnglo American
ABF.LAssociated British Foods
ADM.LAdmiral Group
AHT.LAshtead Group
ANTO.LAntofagasta
AV.LAviva
AZN.LAstraZeneca
BA.LBAE Systems
BAB.LBabcock International Group PLC
BARC.LBarclays
BATS.LBritish American Tabaco
BDEV.LBarratt Developments
BKG.LBerkeley Group Holdings
BLND.LBritish Land
BLT.LBunzl
BNZL.LBunzl plc
BP.LBP
BRBY.LBurberry
BT-A.LBT Group
CCH.LCoca-Cola HBC
CCL.LCarnival Corporation & plc
CNA.LCentrica
CPG.LCompass Group
CPI.LCapita plc
CRH.LCRH plc
DC.LDixons Carphone plc
DCC.LDCC plc
DGE.LDiageo
DLG.LDirect Line Insurance Group plc
EXPN.LExperian
EZJ.LEasyJet
FRES.LFresnillo Plc
GLEN.LGlencore
GSK.LGlaxoSmithKline
HIK.LHikma Pharmaceuticals
HL.LHargreaves Lansdown
HMSO.LHammerson plc
HSBA.LHSBC
IAG.LInternational Airlines Group
III.L3i
IMB.LImperial Brands
INF.LInforma
INTU.Lintu properties plc
ITRK.LIntertek
ITV.LITV plc
JMAT.LJohnson Matthey
Table A2. FTSE100 index.
TickerCompany
KGF.LKingfisher plc
LAND.LLand Securities
LGEN.LLegal & General
LLOY.LLloyds Banking Group
LSE.LLondon Stock Exchange Group
MDC.LMediclinic International plc
MKS.LMarks and Spencer Group plc
MNDI.LMondi
MRW.LMorrisons
NG.LNational Grid plc
NXT.LNext plc
PFG.LProvident Financial plc
PRU.LPrudential plc
PSN.LPersimmon plc
PSON.LPearson plc
RB.LReckitt Benckiser
RBS.LRoyal Bank of Scotland Group
RDSA.LRoyal Dutch Shell
RDSB.LRoyal Dutch Shell plc
REL.LRELX
RIO.LRio Tinto Group
RMG.LRoyal Mail plc
RR.LRolls-Royce Holdings
RSA.LRSA Insurance Group
SBRY.LSainsbury’s
SDR.LSchroders
SGE.LSage Group
SKY.LSmurfit Kappa
SN.LSmith & Nephew
SSE.LSSE plc
STAN.LStandard Chartered
STJ.LSt. James’s Place plc
SVT.LSevern Trent
TPK.LTravis Perkins plc
TSCO.LTesco
TUI.LTUI Group
TW.LTaylor Wimpey
ULVR.LUnilever
UU.LUnited Utilities
VOD.LVodafone Group
WPP.LWPP plc
WTB.LWhitbread
Table A3. FTSE4GOOD index.
TickerCompany
AAL.LAnglo American
ABF.LAssociated British Foods
AHT.LAshtead Group
ANTO.LAntofagasta
AV.LAviva
AZN.LAstraZeneca
BARC.LBarclays
BLT.LBunzl
BNZL.LBunzl plc
BT-A.LBT Group
CCL.LCarnival Corporation & plc
CNA.LCentrica
CPG.LCompass Group
CRH.LCRH plc
DGE.LDiageo
EXPN.LExperian
FRES.LFresnillo Plc
GSK.LGlaxoSmithKline
HSBA.LHSBC
IAG.LInternational Airlines Group
IHG.LInterContinental Hotels Group PLC
KGF.LKingfisher plc
LAND.LLand Securities
LGEN.LLegal & General
LLOY.LLloyds Banking Group
LSE.LLondon Stock Exchange Group
NFC.LNext Fifteen Communications Group plc
MCRO.LMicro Focus International plc
NG.LNational Grid plc
PRU.LPrudential plc
RB.LReckitt Benckiser
RBS.LRoyal Bank of Scotland Group
RDSA.LRoyal Dutch Shell
RDSB.LRoyal Dutch Shell plc
REL.LRELX
RIO.LRio Tinto Group
SLA.LStandard Life Aberdeen plc
SDR.LSchroders
SGE.LSage Group
SKY.LSmurfit Kappa
SN.LSmith & Nephew
SSE.LSSE plc
STAN.LStandard Chartered
TSCO.LTesco
ULVR.LUnilever
VOD.LVodafone Group
WTB.LWPP plc
WPP.LWhitbread

Appendix B. Empirical Results

Appendix B.1. Ftse4good Index

Table A4. Results obtained for the period 2000–2018 for FTSE4GOOD securities; where N is the number of pairs, O P . number of transactions, A A V annualized average profit, P r o f i t , profits considering transaction costs of 0.01%.
MethodNOp.AAVSharpe Ratio a %Max Drawdown b R 2 %Profit
Distance1049622.60%0.5811.50%0.9241.14%
Correlation1049691.90%0.5210.90%0.7128.83%
Cointegration1050052.70%0.578.70%0.9143.19%
Hurst1049936.50%1.446.20%0.96111.61%
Distance2098432.80%0.747.10%0.9645.98%
Correlation2099112.10%0.657.50%0.7732.34%
Cointegration2098613.60%1.015.80%0.9560.67%
Hurst20100095.70%1.593.50%0.9497.50%
Distance30148503.70%1.054.00%0.9561.45%
Correlation30149212.50%0.844.10%0.8839.33%
Cointegration30148963.10%0.915.70%0.9350.43%
Hurst30150705.00%1.564.00%0.9385.68%
Distance40198843.50%1.063.60%0.9658.63%
Correlation40199572.50%0.926.40%0.8440.11%
Cointegration40198873.20%0.994.30%0.9351.83%
Hurst40199625.00%1.663.20%0.9384.91%
Distance50249683.20%1.023.50%0.9652.81%
Correlation5024.9322.60%0.997.20%0.8442.11%
Cointegration50246812.90%0.954.40%0.9447.36%
Hurst50250494.80%1.662.80%0.9381.29%
a The Sharpe ratio is a measure of the excess return per unit of risk of an investment. b The maximum drawdown measures the difference between the maximum and minimum recorded by the stock between one maximum and the next.

Appendix B.2. Ftse100 Index

Table A5. Results obtained for the period 2000–2018 for FTSE100 stocks; where N is the number of pairs, O P . number of transactions, A A V annualized average profit, P r o f i t , profits considering transaction costs of 0.01%.
MethodNOp.AAVSharpe Ratio%Max Drawdown R 2 %Profit
Distance1050582.30%0.5016.90%0.8335.74%
Correlation1050931.70%0.5410.90%0.7525.51%
Cointegration1049352.20%0.4517.90%0.6234.06%
Hurst1048636.30%1.239.90%0.65108.94%
Distance20100512.30%0.5812.00%0.8436.87%
Correlation20100681.20%0.469.00%0.6316.87%
Cointegration2097942.20%0.5612.60%0.8235.10%
Hurst2096737.20%1.895.20%0.79124.36%
Distance30149882.80%0.7613.60%0.9245.00%
Correlation30151461.90%0.794.80%0.7329.75%
Cointegration30147432.70%0.799.90%0.8443.39%
Hurst30146226.50%2.014.40%0.81112.33%
Distance40199452.90%0.8811.90%0.9347.91%
Correlation40200992.20%0.955.50%0.8235.18%
Cointegration40197202.50%0.809.30%0.8639.27%
Hurst40196155.90%2.003.80%0.84101.90%
Distance50248783.10%0.9710.90%0.9550.52%
Correlation50250202.20%0.994.80%0.8335.20%
Cointegration50245662.40%0.849.40%0.8739.19%
Hurst50245815.50%1.964.00%0.8493.78%

Appendix B.3. Buy Ftse4good Index and Sell Ftse100 Index

Table A6. Results obtained for the period 2000–2018, if we buy FTSE4GOOD securities and sell FTSE100 securities that are not in FTSE4GOOD; where N is the number of pairs, O P . number of transactions, A A V annualized average profit, P r o f i t , profits considering transaction costs of 0.01%.
MethodNOp.AAVSharpe Ratio%Max Drawdown R 2 %Profit
Distance1010380.60%0.238.80%0.348.46%
Correlation10697−0.30%−0.197.90%0.41−5.90%
Cointegration1013101.00%0.367.10%0.5716.49%
Hurst1012431.60%0.617.30%0.7126.66%
Distance2022250.60%0.323.40%0.899.99%
Correlation2014080.10%0.053.50%0.010.30%
Cointegration2024900.30%0.158.10%0.164.65%
Hurst2025141.60%0.854.30%0.7428.34%
Distance3033360.80%0.472.90%0.9212.49%
Correlation3021480.20%0.223.00%0.082.78%
Cointegration3038670.40%0.197.80%0.175.81%
Hurst3038261.60%1.014.10%0.7927.92%
Distance4045720.90%0.512.70%0.9113.56%
Correlation4030390.30%0.312.70%0.303.84%
Cointegration4050670.40%0.218.00%0.235.83%
Hurst4049561.30%0.933.90%0.8222.86%
Distance5057980.60%0.402.60%0.929.94%
Correlation5040330.30%0.342.90%0.304.59%
Cointegration5063150.30%0.187.20%0.184.44%
Hurst5063201.00%0.783.80%0.8017.54%

References

  1. Miralles-Quirós, M.D.M.; Miralles-Quirós, J.L. Improving diversification opportunities for socially responsible investors. J. Bus. Ethics 2017, 140, 339–351. [Google Scholar] [CrossRef]
  2. Silvestre, W.J.; Antunes, P.; Leal Filho, W. The corporate sustainability typology: Analysing sustainability drivers and fostering sustainability at enterprises. Technol. Econ. Dev. Econ. 2018, 24, 513–533. [Google Scholar] [CrossRef] [Green Version]
  3. García, F.; González-Bueno, J.; Oliver, J.; Riley, N. A Fuzzy Multicriteria Approach. Sustainability 2019, 11, 2496. [Google Scholar] [CrossRef] [Green Version]
  4. Belasri, S.; Gomes, M.; Pijourlet, G. Corporate social responsibility and bank efficiency. J. Multinatl. Financ. Manag. 2020, 54, 100612. [Google Scholar] [CrossRef]
  5. Al-Tuwaijri, S.A.; Christensen, T.E.; Hughes Ii, K.E. The relations among environmental disclosure, environmental performance, and economic performance: A simultaneous equations approach. Account. Organ. Soc. 2004, 29, 447–471. [Google Scholar] [CrossRef]
  6. Jaggi, B.; Freedman, M. An examination of the impact of pollution performance on economic and market performance: Pulp and paper firms. J. Bus. Financ. Account. 1992, 19, 697–713. [Google Scholar] [CrossRef]
  7. Molloy, L.; Erekson, H.; Gorman, R. Exploring the Relationship between Environmental and Financial Performance; paper presented at Workshop on Capital Markets and Environmental Performance; Miami University: Oxford, OH, USA, 2002. [Google Scholar]
  8. Clarkson, P.; Li, Y. The market valuation of environmental capital expenditures by pulp and paper companies. Account. Rev. 2004, 79, 329–353. [Google Scholar] [CrossRef]
  9. Zhang, X.; Guo, R. The Inverted U-shaped Impact of Corporate Social Responsibility on Corporate Performance. J. Financ. Econ. 2018, 6, 67–74. [Google Scholar]
  10. Gregory, A.; Tharyan, R.; Whittaker, J. Corporate social responsibility and firm value: Disaggregating the effects on cash flow, risk and growth. J. Bus. Ethics 2014, 124, 633–657. [Google Scholar] [CrossRef] [Green Version]
  11. Jung, S.; Nam, C.; Yang, D.H.; Kim, S. Does corporate sustainability performance increase corporate financial performance? Focusing on the information and communication technology industry in Korea. Sustain. Dev. 2018, 26, 243–254. [Google Scholar] [CrossRef]
  12. Marti, C.P.; Rovira-Val, M.R.; Drescher, L.G. Are firms that contribute to sustainable development better financially? Corp. Soc. Responsib. Environ. Manag. 2015, 22, 305–319. [Google Scholar] [CrossRef] [Green Version]
  13. Herremans, I.; Akathaporn, P.; McInnes, M. An investigation of corporate social responsibility reputation and economic performance. Account. Organ. Soc. 1993, 18, 587–604. [Google Scholar] [CrossRef]
  14. McGuire, J.B.; Sundgren, A.; Schneeweis, T. Corporate social responsibility and firm financial performance. Acad. Manag. J. 1998, 31, 854–872. [Google Scholar]
  15. Barnett, M.L. Stakeholder influence capacity and the variability of financial returns to corporate social responsibility. Acad. Manag. Rev. 2007, 32, 3. [Google Scholar] [CrossRef]
  16. Pava, M.L.; Krausz, J. The association between corporate social-responsibility and financial performance: The paradox of social cost. J. Bus. Ethics 1996, 15, 321–357. [Google Scholar] [CrossRef]
  17. Cochran, P.L.; Wood, R.A. Corporate social responsibility and financial performance. Acad. Manag. J. 1984, 27, 42–56. [Google Scholar]
  18. Alexander, G.J.; Buchholz, R.A. Corporate social responsibility and stock market performance. Acad. Manag. J. 1978, 21, 479–485. [Google Scholar] [CrossRef]
  19. Waddock, S.A.; Graves, S.B. The corporate social performance - financial performance link. Strateg. Manag. J. 1997, 18, 303–319. [Google Scholar] [CrossRef]
  20. Clarkson, P.; Li, Y.; Richardson, G.D.; Vasvari, F.P. Does it really pay to be green? Determinants and consequences of proactive environmental strategies. J. Account. Public Policy 2011, 30, 122–144. [Google Scholar] [CrossRef]
  21. Wang, Z.; Sarkis, J. Corporate social responsibility governance, outcomes, and financial performance. J. Clean. Prod. 2017, 162, 1607–1616. [Google Scholar] [CrossRef]
  22. Ameer, R.; Othman, R. Sustainability Practices and Corporate Financial Performance: A Study Based on the Top Global Corporations. J. Bus. Ethics 2012, 108, 61–79. [Google Scholar]
  23. Katsikides, S.; Markoulis, S.; Papaminas, M. Corporate Social Responsibility and Stock Market Performance: An Event Study Approach. Int. J. Eng. Adv. Technol. 2016, 6, 1–8. [Google Scholar]
  24. Artiach, T.; Lee, D.; Nelson, D.; Walker, J. The determinants of corporate sustainability. Perform. Account. Financ. 2010, 50, 31–51. [Google Scholar] [CrossRef]
  25. Brammer, S.; Brooks, C.; Pavelin, S. Corporate Social Performance and Stock Returns: UK Evidence from Disaggregate Measures. Financ. Manag. Autumn 2006, 35, 97–116. [Google Scholar] [CrossRef] [Green Version]
  26. Lins, K.; Servaes, H.; Tamayo, A. Social Capital, Trust, and Firm Performance: The Value of Corporate Social Responsibility during the Financial Crisis. J. Financ. 2017, 72, 1785–1824. [Google Scholar] [CrossRef] [Green Version]
  27. Ullmann, A.A. Data in search of a theory: A critical examination of the relationships among social performance, social disclosure, and economic performance of U.S. firms. Acad. Manag. Rev. 1985, 10, 540–557. [Google Scholar]
  28. Lee, D. An Analysis of the Sustainability Investment Strategy Employing the Dow Jones World Sustainability Index; Monash University: Melbourne, Australia, 2006. [Google Scholar]
  29. Becchetti, L.; Giacomo, S.D.; Pinnacchio, D. Corporate social responsibility and corporate performance: Evidence from a panel of U.S. listed companies. Appl. Econ. 2008, 40, 541–567. [Google Scholar] [CrossRef] [Green Version]
  30. McWilliams, A.; Siegel, D. Corporate social responsibility and financial performance: Correlation or misspecification? Strateg. Manag. J. 2000, 21, 603–609. [Google Scholar] [CrossRef]
  31. Diltz, J.D. The private cost of socially responsable investing. Appl. Financ. Econ. 1995, 5, 69–77. [Google Scholar] [CrossRef]
  32. Guerard, J.B. Is there a cost to being socially responsible in investing? J. Investig. 1997, 6, 11–18. [Google Scholar] [CrossRef]
  33. DiBartolomeo, D.; Kurtz, L. Managing Risk Exposures of Socially Screened Portfolio; Northfield Information Services working paper; Northfield Information Services: Boston, MA, USA, 1999. [Google Scholar]
  34. Statman, M. Socially responsible mutual funds. Financ. Anal. J. 2000, 56, 30–39. [Google Scholar] [CrossRef]
  35. Cox, P.; Brammer, S.; Millington, A. An Empirical Examination of Institutional Investor Preferences for Corporate Social Performance. J. Bus. Ethics 2004, 52, 27–43. [Google Scholar] [CrossRef]
  36. Derwall, J.; Guenster, N.; Bauer, R.; Koedijk, K. The eco-efficiency premium puzzle. Financ. Anal. J. 2005, 61, 51–63. [Google Scholar] [CrossRef] [Green Version]
  37. Konar, S.; Cohen, M.A. Does the Market Value Environmental Performance? Rev. Econ. Stat. 2001, 83, 281–289. [Google Scholar] [CrossRef]
  38. Belghitar, Y.; Clark, E.; Deshmukh, N. Does it pay to be ethical? Evidence from the FTSE4Good. J. Bank. Financ. 2014, 47, 54–62. [Google Scholar] [CrossRef] [Green Version]
  39. Sariannidis, N.; Giannarakis, G.; Litinas, N.; Konteos, G. A GARCH examination of macroeconomic effects on us stock market: A distinction between the total market index and the sustainability index. Eur. Res. Stud. 2010, 13, 129. [Google Scholar] [CrossRef] [Green Version]
  40. El Ghoul, S.; Guedhami, O.; Kwok, C.C.; Mishra, D.R. Does corporate social responsibility affect the cost of capital? J. Bank. Financ. 2011, 35, 2388–2406. [Google Scholar] [CrossRef]
  41. Chen, R.C.; Hung, S.W.; Lee, C.H. Corporate social responsibility and firm idiosyncratic risk in different market states. Corp. Soc. Responsib. Environ. Manag. 2018, 25, 642–658. [Google Scholar] [CrossRef]
  42. Liao, L.K.; Fan, Y.W.; Shih, M.H. What drives social responsibility indices returns? Macroeconomics matters. Corp. Soc. Responsib. Environ. Manag. 2020, 27, 514–524. [Google Scholar] [CrossRef]
  43. Geczy, C.; Stambaugh, R.; Levin, D. Investing in Socially Responsible Mutual Funds. 2005. Available online: https://ssrn.com/abstract=416380 (accessed on 30 June 2020).
  44. Teper, J. Evaluating the cost of socially responsable investing. In The Social Investment Almanac, 1st ed.; Kinder, P., Ed.; Henry Holt: New York, NY, USA, 1992; pp. 340–349. [Google Scholar]
  45. White, M. Corporate Environmental Performance and Shareholder Value; Online Archive of University of Virginia Scholarship; University of Virginia: Charlottesville, Virginia, 1996. [Google Scholar]
  46. Bauer, R.; Koedijk, K.; Otten, R. International Evidence on Ethical Mutual Fund Performance and Investment Style. J. Bank. Financ. 2005, 29, 1751–1767. [Google Scholar] [CrossRef] [Green Version]
  47. Ziegler, A.; Busch, T.; Hoffman, V. Corporate Responses to Climate Change and Financial Performance: The Impact of Climate Policy. CER-ETH - Center of Economic Research at ETH Zurich, Working paper No. 09/105. 2009. Available online: http://dx.doi.org/10.2139/ssrn.1348476 (accessed on 1 July 2020).
  48. Barnett, M.; Salomon, S. Beyond dichotomy: The curvilinear relationship between social responsibility and financial performance. Strateg. Manag. J. 2006, 27, 1101–1122. [Google Scholar] [CrossRef]
  49. Collison, D.J.; Cobb, G.; Power, D.M.; Stevenson, L.A. The financial performance of the FTSE4Good indices. Corp. Soc. Responsib. Environ. Manag. 2008, 15, 14–28. [Google Scholar] [CrossRef]
  50. Farago, A.; Hjalmarsson, E. Stock Price Co-Movement and the Foundations of Pairs Trading. J. Financ. Quant. Anal. 2019, 54, 629–665. [Google Scholar] [CrossRef]
  51. Wilmott, P. The Best of Wilmott: Incorporating the Quantitative Finance Review; John Wiley and Sons: Hoboken, NJ, USA, 2004; Volume 1. [Google Scholar]
  52. Gatev, E.; Goetzmann, W.N.; Rouwenhorst, K.G. Pairs trading: Performance of a relative-value arbitrage rule. Rev. Financ. Stud. 2006, 19, 797–827. [Google Scholar] [CrossRef] [Green Version]
  53. Wong, B. Trading strategies: Pairs trading. Singap. Stock. Exch. 2010. not available. [Google Scholar]
  54. Vidyamurthy, G. Pairs Trading: Quantitative Methods and Analysis; John Wiley and Sons: Hoboken, NJ, USA, 2004. [Google Scholar]
  55. Liew, R.Q.; Wu, Y. Pairs trading: A copula approach. J. Deriv. Hedge Funds 2013, 19, 12–30. [Google Scholar] [CrossRef] [Green Version]
  56. Ramos-Requena, J.P.; Trinidad-Segovia, J.E.; Sánchez-Granero, M.A. Introducing Hurst exponent in pair trading. Phys. Stat. Mech. Its Appl. 2017, 488, 39–45. [Google Scholar] [CrossRef]
  57. Ramos Requena, J.R.; Trinidad Segovia, J.E.; Sánchez Granero, M.A. An alternative approach to measure co-movement between two time series. Mathematics 2020, 8, 261. [Google Scholar] [CrossRef] [Green Version]
  58. Andrade, S.; Di Pietro, V.; Seasholes, M. Understanding the Profitability of Pairs Trading; Unpublished working paper; UC Berkeley: Berkeley, CA, USA; Northwestern University: Evanston, IL, USA, 2005. [Google Scholar]
  59. Engelberg, J.; Gao, P.; Jagannathan, R. An anatomy of pairs trading: The role of idiosyncratic news, common information and liquidity. In Proceedings of the En Third Singapore International Conference on Finance, Singapore, 2009; Available online: https://dx.doi.org/10.2139/ssrn.1330689 (accessed on 1 July 2020).
  60. Perlin, M.S. Evaluation of pairs-trading strategy at the Brazilian financial market. J. Deriv. Hedge Funds 2009, 15, 122–136. [Google Scholar] [CrossRef] [Green Version]
  61. Do, B.; Faff, R. Does simple pairs trading still work? Financ. Anal. J. 2010, 66, 83–95. [Google Scholar] [CrossRef]
  62. Bowen, D.; Hutchinson, M.C.; O’Sullivan, N. High-frequency equity pairs trading: Transaction costs, speed of execution, and patterns in returns. J. Trading 2010, 5, 31–38. [Google Scholar] [CrossRef] [Green Version]
  63. Do, B.; Faff, R. Are pairs trading profits robust to trading costs? J. Financ. Res. 2012, 35, 261–287. [Google Scholar] [CrossRef]
  64. Engle, R.F.; Granger, C.W. Co-integration and error correction: Representation, estimation, and testing. Econom. J. Econom. Soc. 1987, 55, 251–276. [Google Scholar] [CrossRef]
  65. López-García, M.N.; Ramos-Requena, J.P. Different methodologies and uses of the Hurst exponent in econophysics. Estud. Econ. Apl. 2019, 37, 96–108. [Google Scholar] [CrossRef]
  66. Di Matteo, T.; Aste, T.; Dacorogna, M.M. Long-term memories of developed and emerging markets: Using the scaling analysis to characterize their stage of development. J. Bank. Financ. 2005, 29, 827–851. [Google Scholar] [CrossRef] [Green Version]
  67. Barunik, J.; Kristoufek, L. On Hurst exponent estimation under heavy-tailed distributions. Phys. Stat. Mech. Appl. 2010, 389, 3844–3855. [Google Scholar] [CrossRef] [Green Version]
  68. Ramos-Requena, J.P.; Trinidad-Segovia, J.E.; Sánchez-Granero, M.A. Some Notes on the Formation of a Pair in Pairs Trading. Mathematics 2020, 8, 348. [Google Scholar] [CrossRef] [Green Version]
Figure 1. Comparative of accumulated logarithmic returns, for a portfolio of 30 pairs, with FTSE4GOOD stocks, over the period 2000–2018.
Sustainability 12 06293 g001
Figure 2. Comparative of accumulated logarithmic returns, for a portfolio of 30 pairs, with FTSE100 stocks, over the period 2000–2008.
Sustainability 12 06293 g002
Figure 3. Comparative of accumulated logarithmic returns, for a portfolio composed of 30 pairs, if FTSE4GOOD index securities are bought and FTSE100 securities not in FTSE4GOOD are sold, over the period 2000–2018.
Sustainability 12 06293 g003

