Abstract
This work is a new step towards the understanding of students’ opinions about the use of technology in learning and improvements to provide sustainable E-learning solutions. Every higher educational university tries to provide well-suited, updated, and trending technology-based education facilities to its students. The task of analyzing the student’s sentiment about technology delivers benefits not only to ICT administrators, but also to management to become aware of the technological concerns. The opinions of Hungarian university students were analyzed using the regression method. We investigated 165 primary samples supported by the four hypotheses. The reliability of the data sample was calculated as 0.91 with Cronbach alpha testing. The Pearson Momentum Correlation (PMC) proved that the suggested technology benefits had a linear positive association with the student’s opinion. Furthermore, technology usability was positively correlated with the benefits. The supporting results of the regression model evidenced the significant impact of technology usability and benefits on the opinions. Using Exploratory Factor Analysis (EFA), we proposed significant features for the model that predicted students’ opinions using the educational benefit and usability parameters. These parameters statistically significantly predicted student’s opinions: F (2, 162) = 104.9, p < 0.05, = 0.559. This study may be supportive of implementing the opinion mining model online and useful to university authorities to understand better the students’ sentiments about the current technological facilities provided. The authors proposed an opinion mining model to deploy on the university’s real-time “E-lection” sustainable technology.
1. Introduction and Related Work
Today, the entire educational world is based on ICT, and without the integration of technology in higher educational institutions, it is very challenging to compete in the academic world. The role of technology in the learning and teaching process is becoming a more and more critical tool [1]. According to [2], the rapid growth of ICT impacts educational institutions and the entire world. Nevertheless, this hasty development in educational technology prompts schools, colleges, and policymakers to incorporate new skills that have become essential in today’s knowledge-based society [3]. The integration of technology makes a vast contribution to refining student learning [4]. Several researchers have investigated the sentiments towards technology use. The highest positive attitude was found in students for technology embedded learning [5]. In East African Community countries, students use technology in their daily lives [6]. An attitudinal dissimilarity was depicted for the significance of specific and general attitudes towards technology [7]. Antonio et al. [8] explored a technology tool that enhanced students’ attitudes towards professional development in palliative care education. Non-academic parameters like age, project participation, gender, and face-to-face teaching play a vital role in the prediction of attitude [9]. Various predictive models were compared and found to have the highest positive attitude among pupils [10], and behavior of students was identified based on their online activities with a learning platform [11]. A study proved that ICT significantly improved the learning of students [12]. Timothy Teo et al. [13] found two important features such as usefulness and easiness that significantly affected students’ attitudes towards the use of Moodle. The acceptance of the technology via the Moodle system by business administration students in Spain was studied, and it was suggested that Moodle could improve the teaching-learning process [14]. In a Malaysian study, the intentions to use the technology were affected by its usefulness and easiness factor [15]. Based on the technology acceptance model, the easiness significantly impacts usefulness; both ease of use and usefulness significantly affected the intention of use, and both usefulness and the attitude towards use significantly impacted the intention of use [16]. Further, the related literature was studied to predict ICT skills and usability [17], ICT enhancement and availability [18], ICT experience [19], teachers’ attitude [20], technology integration [21], and ICT in a social constructivist environment [22]. A preliminary work also observed that educators’ residency [23,24] and demography [25] was predicted based on ICT.
1.1. Real-Time Opinion Prediction Using E-Lection
We propose a student opinion identification model to be implemented as a separate web-based module to identify the student’s opinion in real-time. Up to now, the literature has not had any real-time models to predict the student’s opinions. Further, no one discussed the technology benefits in previous studies. In this paper, we proposed nine educational benefits and six usability features that significantly predicted the Hungarian student’s opinion. Theses features are significantly suggested with the EFA technique, and we also found that these features significantly affected the opinions.
The present research conducted to support university real-time web portal entitled “E-lection” [26,27,28,29]. It started as a real-time web-based student response system though nowadays it is more complicated. The last stable version was implemented in ASP.NET WebForms in C# language extended with SignalR library for real-time, Ms-SQL database for storing information, and Bootstrap for the response [30].
Figure 1 is quite flexible according to the used web technology. While it is a Bring Your Own Device (BYOD) system, anybody can join the communication with any device offering a browser (smartphone, laptop, tablet, etc.) from anywhere (from school or home). For authentication and authorization, it is connected with the faculty Lightweight Directory Access Protocol (LDAP) server. The User Interface (UI) is capable of presenting lecture streaming and handling real-time communication between the lecturer and the students. Naturally, several lectures may be organized parallel. A very new functionality in which implementation is in progress in the time of writing the paper is the export possibility of needed data towards the university Canvas Learning Content Management System (LCMS) Canvas Server. One of our further plans is implementing the opinion prediction module in our E-lection Server, including real-time native place identification of students [31].
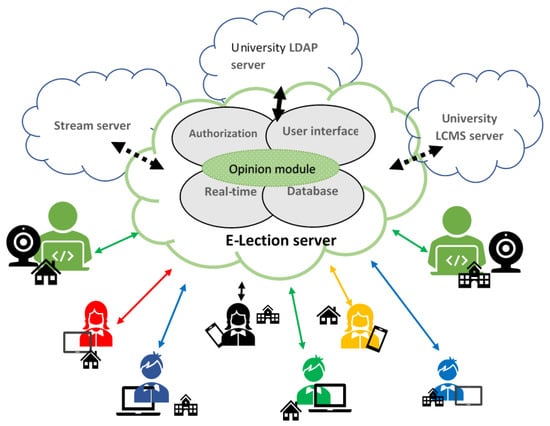
Figure 1.
E-Lection architecture.
Figure 2 visualizes the simplified communication process flow. The teacher may send questions with possible answers waiting for students’ responses, which are shown in real-time on a graph (it is switchable on/off). The questions may derive from a question bank or create on the fly. Students may also send questions during the lecture, which appears immediately on the lecturer UI; what is extraordinary that besides the question ending possibility, students may send simple signs that something is not clear for them. Usually, the lecturer notices the actions may stop and answer publicly, but private answer sending functionality is built in the system in the case of an exam organization. Naturally, communication and attendance are logged and can be downloaded for further data mining.
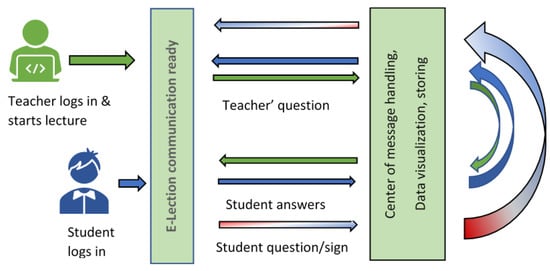
Figure 2.
Simplified communication flow.
1.2. Conceptual Design
This section discusses the conceptual idea of the present work. We found that technology usability and educational benefits played a vital role in explaining the opinion of students. In Figure 3, followed by the primary data collection, we preprocessed data with handle missing value, encoding, scaling, outlier removal, etc. Later, the PMC is used to see the impact of each parameter. Afterward, multiple linear regression is applied to predict student’s opinion, and we checked the predictive strength of explanatory variables. All the results of the regression are carefully seen by constructing three tables: model summary, ANOVA, and coefficients. Based on the significant results, we proposed this model to implement online to observe the opinions on the technology over a specified time to meet the real-time criteria. For the student, the interface could be designed with all features and filled responses supported by the reaction entry module. The administrator might use the retrieval module to check the predicted value based on the response of the stakeholders.
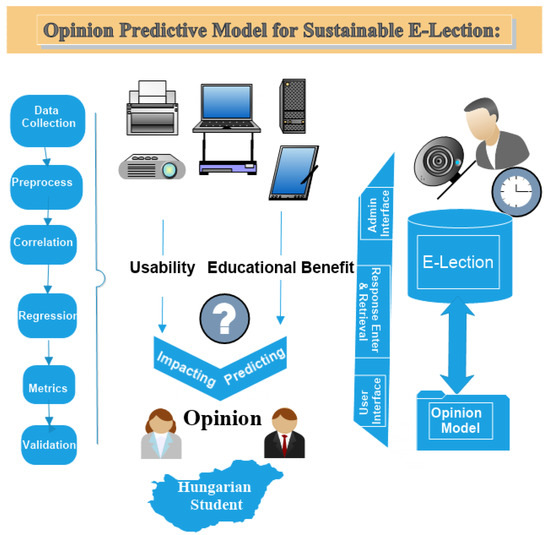
Figure 3.
Statistical model of opinion prediction for the E-Lection real-time system.
1.3. Organization
2. Materials and Method
Regression analysis estimates the relationship between two or more variables. It is a form of predictive modeling technique that investigates the relationship between dependent and independent variables. This technique is used for predicting data patterns and finding the cause–effect relationships between variables. Regression analysis is an important tool for modeling and analyzing data. When we want to fit a curve to the data points in such a manner that the differences between the distances of data points from the curve are minimized, the least squares method is often used to calculate the optimal parameters of the surrogate curve. This method allows for one value of an independent variable to be measured, and uses multiple values of the dependent variable—the same is true in our case.
2.1. Objectives and Hypotheses
To explore the influence of the technological benefits of the student’s opinion and usability in the university, we designed the below two null hypotheses and their corresponding alternative hypotheses .
- : No significant influence of Educational benefit of technology on student’s opinion.
- : A significant influence of Educational benefit of technology on student’s opinion.
- : No significant influence of Technology Usability of the student’s opinion.
- : A significant influence of Technology Usability on the student’s opinion.
2.2. Research Instrument, Tools and Techniques
In July 2018, the total population of Hungary was 9.8 million [32,33], and during the academic year 2018–2019, around 1.8 million students were enrolled in full-time public education and higher education as reported by Központi Statisztikai Hivatal KSH [34]. To pursue this research, first, a structured questionnaire was designed with the help of department experts and later converted into a Google form. We collected a total of 170 samples from a public university (Eötvös Loránd University) residing in Hungary. A stratified random sampling was followed. Some personal visits were also conducted to explain the motto of research with students. We found 100% responses of students during the data collection, and all were studying in computer science at the faculty of informatics. We framed four major parameters for technology to analyze. This paper used three main parameters: opinion, educational benefit, and usability. The opinion has six, educational benefit has nine, and usability has six sub-scale variables. All variables were measured on five point-Likert scale. We used IBM SPSS Statistics version 25 for the data analysis. The participating students belong to the faculty of informatics, and they are doing their under graduate (UG), post graduate (PG), and Ph.D. studies.
Figure 4 shows that the highest participation of students belonged to the age group 21–25, which was the youngest generation involved in the study. Next, we found that the male students filled the Google form more often than of females. Regarding locality, urban students showed a keen interest in participation. Regarding level of study [35], both UG and PG students participated well compared to Ph.D. candidates. The lowest count for females was 40, for rural was 32, and for Ph.D. was 25. The constant line had a value of 21. The average line had a value of 66 that depicts both the average number of participation and the minimum from a specific category of the overall participants.
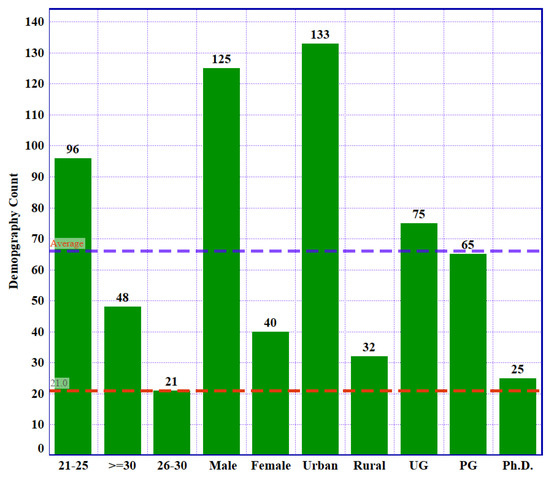
Figure 4.
Demography count of students.
2.3. Correlated Variables
Supporting the PMC, on the one hand, the attitude of Hungarian students is highly correlated with the educational technology benefit provided by the university, and on the other hand, the usability of the technology is also associated with this. The applied Equation (1) of the PMC is shown below:
where R is the correlation; SP is the sum of the product of deviation score of X and Y; and and are the covariance of variables.
Figure 5 depicts the highest correlation values of 0.744** of Educational benefit and 0.463** associated with the student’s opinion. Further, we also explored that the Educational benefit of technology has also significantly correlated with its usability having 0.50**. The reference line set up at 0.4 means the calculated R values are above it.

Figure 5.
Correlation between opinion, educational benefit, and usability.
2.4. Exploratory Factor Analysis
To make independent factors, we used Exploratory Factor Analysis (EFA) to find the nature of constructs affecting a set of responses. The EFA transforms a group of variables into n number of new independent groups. Obeying the vital assumptions (metric, multicollinearity, and adequate sample size ), the EFA performed appropriately. The study sample size is more than five times the total number of variables used. To make independent groups, the Principal Component Analysis (PCA) was used with the Varimax Method. The PCA extracts uncorrelated linear combinations of the variables and provides the prime factor with the highest amount of explained variance.
Further, we applied the Bartlett test of sphericity to check the sampling adequacy. It estimates the proportion of variance in the variables and intersects the small partial correlations among variables. In Table 1, the Kaiser–Meyer–Olkin (KMO) is 0.653, which yielded acceptance of the sampling adequacy and proved Bartlett’s sphericity with a measured significance value (df = 3, P1 < 0.05). All three variables explain total variances are calculated at 71.5%, which is pretty good. Therefore, we can step ahead to predict the opinions of students.

Table 1.
Bartlett test and KMO.
Figure 6 plots the extracted commonalities values provided with the EFA. We observed that the extraction commonalities values for the opinion (0.781) and educational benefit (0.808) are highest compared to the usability. Each variable has more than 0.50 of commonalities spotted by the blue reference line. Therefore, significant values of commonality explained that the extracted components represent the variables appropriately.
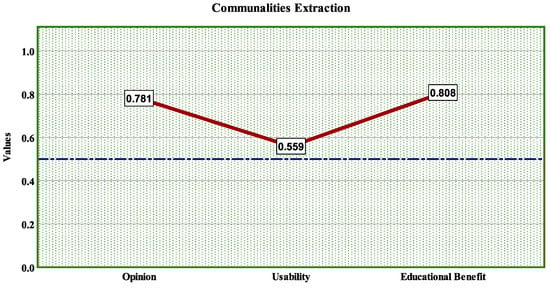
Figure 6.
Factor commonality curve.
Figure 7 displays the total number of three PCA components with their eigenvalue. We found that the first component (PCA-1) was optimal with a highest eigenvalue of 2.1478. This value is an acceptable eigenvalue more significant than 1. The rest of the two components are dropped out. The variance explaining the strength of this component is 71.5% (Table 1).
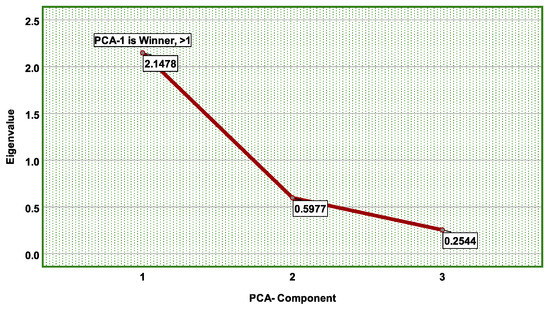
Figure 7.
PCA-components.
Figure 8 shows the intra-correlation values of transformed variables by the EFA. We observed the highest linear positive correlation among records in these variables accounted for in PCA-1. The samples in the opinion and educational benefits have the correlation values 0.884 and 0.899, respectively. Therefore, based on significant commonalities (>0.50), KMO (>0.60), correlation (>0.70), and eigenvalue (>1), we selected the dependent opinion variables (Table 2). Further, using the same selection criteria, nine benefits and six usability variables are described in Table 3.
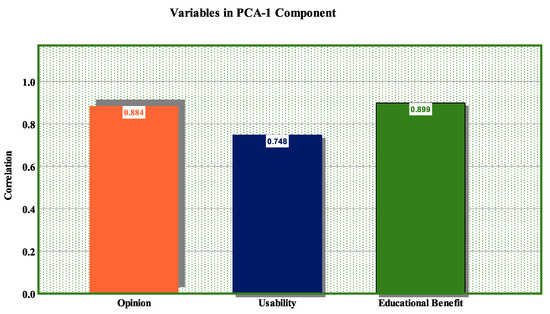
Figure 8.
PCA-1 variables correlation with EFA.
Table 2.
Dependent variables in PCA-1.
Table 3.
Independent variables in PCA-1.
2.5. Variables Statistics
A study of statistical properties is also necessary to know the basis of insight samples. The overall reliability of three parameters is calculated as 0.91 with the Cronbach test. Further, a specific coefficient of each parameter of instrument yielded accurate reliability: educational benefit, = 0.84; usability, = 0.71; and opinion, = 0.86.
Figure 9 visualizes the main two statistical possessions, such as mean and standard deviation. Furthermore, we can see individual 21 variables mean score and standard deviation. The opinion has six usability, and educational benefit has nine variables. Above 3.5 mean scores, we observed that students showed agreement with all variables except online teacher communication. Six variables are found to deviate from the mean score with the highest (>1) value of standard deviation and most of the usability variables. The rest of the variables deviate less (<1).
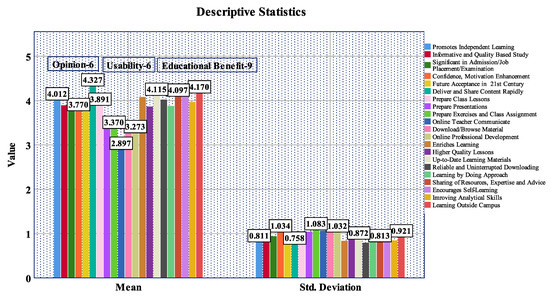
Figure 9.
Statistical properties of variables.
2.6. Preprocessing
Before starting preprocessing, we created four significant variables from the questions asked by students using the mean function, e.g., mean (x). The attitude is designed with an average of six variables, usability is framed by six variables, and educational benefit is constructed from nine variables. During the cleaning process, outlier removal is very mandatory process that enforces insignificant regression models. These are irrelevant points that are different from other observations in the dataset. Using box-plot analysis, we removed three outliers (147, 51, 130) from the opinion, and two outliers (51,130) the educational benefit, and the usability has no outlier. After we removed five outliers, we now have a total of 165 samples for further experiments. The box plots for the opinion, educational benefit, and usability are depicted below in Figure 10.
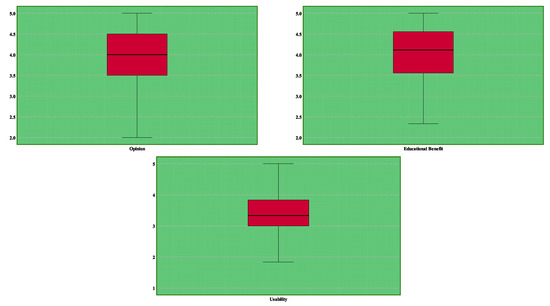
Figure 10.
Cleaned variables after outlier removal.
3. Results
This section discusses the experiment performed with the multilinear regression method. For this, Equation (4) is used, where Y is an opinion that is the dependent variable. The and are independent variables denotes the educational benefit and usability, respectively. The regression coefficients are , , and and is the error.
Figure 11 shows all samples in the dataset touch the normality curve that does not violate the normality assumption that lies in between −2 to +2 [36,37]. Two records from the leftmost side on the x-axis (<−2) and three records on the right hand crossed the value 2. Therefore, the overall graph shows the residuals are independents and distributed normally.
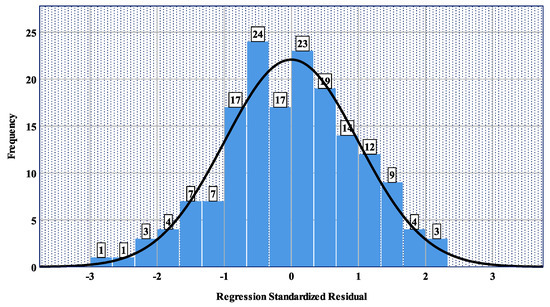
Figure 11.
Normality.
Figure 12 envisions the standardized predicted values of student’s opinions based on the Usability and Educational benefits. The red regression line spotted positive linear prediction with a reference equation of 3.99 + 0.5*x with the lowest determinations ( = 0.564). The standardized regression line holds a reference equation (Y = 3.99 + 0.5*X) supporting with = 0.564. Therefore, fifteen variables play a significant role in identifying the opinions of students. Furthermore, it is a visible positive linear relationship between belief and fifteen variables, and most of the predicted values lie between 3.5 to 5.
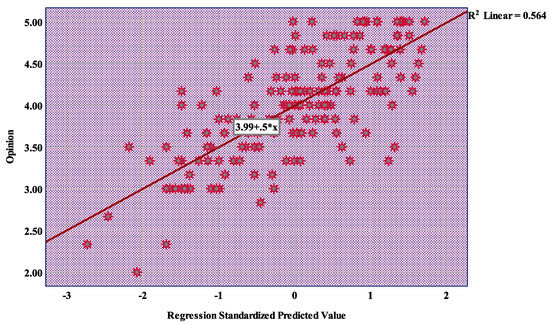
Figure 12.
Standardized predictive values of opinion.
In Table 4, the highest positive correlation R = 0.751 proved a strong association of opinions with usability and educational benefits. It indicates the stability and reliability of the prediction. Supporting significant = 0.564 shows the dependency of these both variables on the opinion. More than 55% of the explanation is reported. The adjusted = 0.559 also proves the adding up usability variable to enhance the model explanation. No autocorrelation observed with the Durbin Watson value of 1.7 [38]. It also achieved the independence of the residuals.
Table 4.
Opinion predictive model using educational benefit and usability.
ANOVA Table 5 shows the significance of the overall opinion predictive regression model. Both educational benefits and usability statistically significantly predict the opinion, F (2, 162) = 104.9, P2 < 0.05 (i.e., the regression model is a good fit of the data).
Table 5.
ANOVA.
The coefficients table (Table 6) shows the significance of the overall opinion predictive regression model. An increment of 1 opinion unit enforces the increase in educational benefits with the value of 0.686 and usability changes by 0.120. Hence, the model proves that the opinion of students increases upon providing technology benefits. Educational benefits have the highest statistical significance (P3 = 0.000**) compared to usability (P3 = 0.45). The technology’s usability has the least impact on opinions (0.05 < 0.45).
Table 6.
Coefficients.
Figure 13 visualizes the standardized residual against standardized predicted values by the regression model. It also fits the loss curve between the −2 to +2, which proves the normal distribution of the residuals. The association of standardized predicted to residuals is approximately linear about zero. Therefore, the residual randomly scattered around zero, and non-linearity achieved.
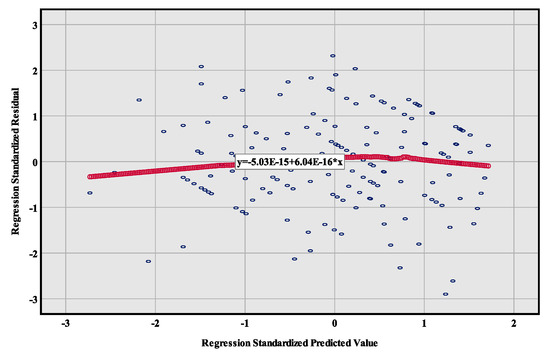
Figure 13.
Standardized residual over standardized predictive values.
Figure 14 visualizes the Q-Q plot to compare the observed Cumulative Distribution Function (CDF) of the standardized residual to the estimated CDF of the normal distribution. It used to check the normality of the model residuals. Hence, most predicted CDF lies between −2 and 2 and cluster points near the horizontal line.
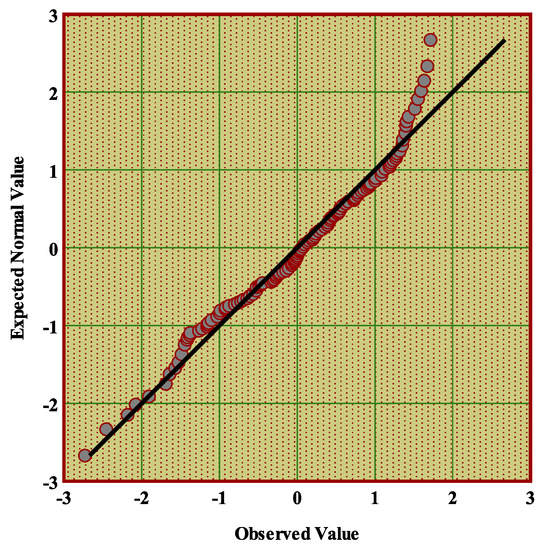
Figure 14.
Normality of regression standardized residual.
4. Discussion
This section discusses the findings of the study about the stratification of assumed hypotheses. Based on the premier positive correlation R = 0.744, a robust relationship of betweeb Hungarian student’s opinions and the educational benefits of technology can be evidenced. The calculated t-value for the educational benefits: t (2, 162) = 104.9, P2 < 0.05 has rejected the null hypothesis “: No significant influence of Educational benefit of technology on student’s opinion”. Alternatively, it the hypothesis “: A significant influence of Educational benefit of technology on student’s opinions” is accepted. Therefore, we discovered that the opinions are impacted by the educational benefits provided at their educational place. Based on the value of technology usability: t (2, 162) = 11.4, P2 > 0.05, we accepted the null hypothesis “: No significant influence of Technology Usability of the student’s opinion” and rejected its alternative hypothesis “: A significant influence of Technology Usability on the student’s opinion”. Thus, we proved that technology usability does not impact the student’s opinion, but it has a positive correlation with student’s opinions 0.463**. After the technology usability and educational benefit variables are added to predict the opinion, the PMC is improved (R = 0.751). It makes the explanation more significant. We must say that both variables are significant in identifying the Hungarian student’s views about technology.
Further, we also found the linear positive correlation 0.50** of the educational benefit with usability, which infers that on providing the suggested technology benefits, more users may be attracted. We also found that almost all students agreed (mean value > 3.5) with all variables. Agreements of their responses proved the significance of the suggested technology benefits, excluding online teacher communication.
The characteristics of the present model with future integration may help university officials and ICT administrators to become aware of the technology.
Presently, our E-lection is working with 250–300 students parallel in one lecture. Several lectures may run in parallel. We did not experience any boundaries during usage. According to the faculty rules (attendance register), we filter students’ IP addresses, so the WiFi system must be working well in the building.
Similar to any standard CRS, it makes the lessons more interactive. The lecturer may map the knowledge and ideas about a topic so that the explanation may be better. In some systems, students may also send questions to the teachers, but in E-lection, there is an extraordinary possibility to send not only questions but also signs. The teacher may see if a lot of them lost the thread even if they could not put a real question. Furthermore, there is a built-in automatic feature to stop and not let the student communicate for a while if they play with the system.
Most of the CRS use some code to join which means you do not know who is logged in (anonymous usage or not is a vocational question), while some build a database for the users; however, this requires a lot of resources to create and maintain. We use the standard faculty system—it is easy and convenient for the students too (they do not have to remember an extra one login and password).
Most of the students like the system and grade it 4 or 5 on our survey [27]. It would be better to use it with two professors—one for giving the lecture and one for answering the student’s questions, but now we do not have enough resources for it.
We do not use it for grading (but it is planned for the future) only for formative assessment because there are 1–2% of students who do not have smartphones.
Deploying the opinion prediction module on E-lection may be useful to our research students, administrative staff, and IT operators. The automatic opinion detecting approach provides on the spot decision making capability to the officials. Future, using this tool, we shall identify the opinion with valuable features (model suggested) by asking an online questionnaire to filled out by students and teachers.
5. Conclusions
This paper presented an opinion regression model, which suggested that the technology educational benefits and usability factor significantly impacted the outlook of students. The use of the latest technology benefited them in learning. The result of the paper explored a significant link between technology benefits with its use. Furthermore, we found the student’s professional opinions are high. Based on the hypotheses testing, we proved that the highest affected factor is an educational benefit, and the least affected factor is usability. The mutual variable bonding of both variables significantly affected the student’s technical opinion towards technology.
A strong association is observed between the student opinions and technology benefits. Using the technology, the student made himself or herself independent (self-learning) that enriched the learning process. The updated learning material and making a quality lesson provides more informative study to students, and obviously it helped to prepare quality lessons. The sharing of resources, expertise, and advice rapidly affected content delivery. The results also proved the future agreement of students towards the "learning by doing" approach. Furthermore, we found students are much more confident and motivated towards the suggested technology benefits. Therefore, the suggested educational benefits are the most significant factors in identifying the Hungarian students’ opinions towards technology. E-learning is made easier by the university providing such technology.
A specific explanation of technology usability has no significant impact on the student’s opinion. Besides, the positive correlation is observed with the student’s opinion. We found that they are using technology in preparation for class assignments, lessons, and in the presentations. Furthermore, they believed in online professional development by using technology.
Future experiments could be continued by comparing Hungarian students’ opinions with Indian students’ opinions towards the ICT. For this, statistical T-test, Z-test, and F-test may be used to see the demographically differences such as gender [2], study level [35], residence [23] and others.
We are also considering the opinion mining of teachers at faculty with a few belonged variables. The use of machine learning algorithms might also be supportive of building the student opinion predictive models. For this, the multilayer perceptron, XGBoost, Support Vector, and Random Forest, etc., proved to be better classification algorithms to predict the attitude [5,18] and technology awareness level [10].
Additionally, the association rule learning (a priori) technique might be useful to explore a significant relationship among the individual variables of target parameters. Furthermore, the implementation of opinion predictive models on the website might help identify the student opinion in the real-time environment of “E-lection”.
The significant shortcomings of the present paper are: confined samples, limited to students with only one university, limited hypotheses, specified statistical techniques, lack of real-time implementations on E-lection.
In the future, such studies may help the university authorities to understand the student’s opinion electronically, and such studies may be a road-map to future sustainable E-learning technologies and their socio-economic impacts.
Author Contributions
Conceptualization, C.V., Data curation, C.V., Methodology, C.V., Formal analysis, C.V., Investigation, C.V, Resources, visualization, C.V., V.B., C.V., Z.I., Validation, C.V., V.S., Writing–original draft preparation, C.V, writing–review and editing, C.V., V.B., V.S., Supervision, V.S., Z.I., Project Administration, Z.I., Funding acquisition, Z.I. All authors have read and agreed to the published version of the manuscript.
Funding
This research was funded by Hungarian Government and European Social Funds under the project “Talent Management in Autonomous Vehicle Control Technologies (EFOP-3.6.3-VEKOP-16-2017-00001)”.
Acknowledgments
The first author confirmed that this paper belongs to his Ph.D. study sponsored by Tempus Public Foundation of Hungary.
Conflicts of Interest
The authors declare no conflict of interest.
Abbreviations
The following abbreviations are used in this manuscript:
| ICT | Information and Communication Technology |
| KSH | Központi Statisztikai Hivatal |
| UG | Under Graduate |
| PG | Post Graduate |
| PMC | Pearson Momentum Correlation |
| CDF | Cumulative Distribution Function |
| KMO | Kaiser-Meyer-Olkin |
| EFA | Exploratory Factor Analysis |
| LCMS | Learning Content Management System |
| UI | User Interface |
| LDAP | Lightweight Directory Access Protocol |
References
- Xhaferi, G.; Bahiti, R.; Farizi, A. Analysis of Students’ Factors Influencing the Integration of E-Learning in Higher Education: Case Study: University of Tetovo. Eur. J. Eng. Form. Sci. 2018, 2, 90–95. [Google Scholar]
- Verma, C.; Dahiya, S. Gender difference towards information and communication technology awareness in Indian universities. SpringerPlus 2016, 5, 1–7. [Google Scholar] [CrossRef] [PubMed]
- Jan, S. Investigating the relationship between students’ digital literacy and their attitude towards using ICT. Int. J. Educ. Technol. 2018, 5, 26–34. [Google Scholar]
- Mikropoulos, T.A. Research on e-Learning and ICT in Education: Technological, Pedagogical and Instructional Perspectives. In Research on E-Learning and ICT in Education; Education, & Language; Panagiotes, A., Nicholas, Z., Eds.; Springer: Cham, Switzerland, 2017. [Google Scholar]
- Verma, C.; Illés, Z. Attitude Prediction Towards ICT and Mobile Technology for The Real-Time: An Experimental Study Using Machine Learning. In Proceedings of eLSe-2019; Carol I” National Defence University Publishing House: Bucharest, Romania, 2019; pp. 247–254. [Google Scholar]
- Niyigena, J.; Jihang, Q.; Hasan, A.S.M.; Ziou, D.; Chen, H.; Wang, P. ICT Usage and Attitudes Among EAC Undergraduate Students: A Case Study. IEEE Access 2018, 6, 42661–42674. [Google Scholar] [CrossRef]
- Player-Koro, C. Factors Infuencing Teachers’ Use of ICT in Education. Educ. Inq. 2012, 3, 93–108. [Google Scholar] [CrossRef]
- Antonio, N.; María, A.; Jesús, F.; Alfredo, G.; Alberto, A.; Leire, A.; Carlos, C. Student’s Inventory of Professionalism (SIP): A Tool to Assess Attitudes towards Professional Development Based on Palliative Care Undergraduate Education. Int. J. Environ. Res. Public Health 2019, 16, 1–12. [Google Scholar]
- Francisco, D.; María, J. Identification of Variables that Predict Teachers’ Attitudes toward ICT in Higher Education for Teaching and Research: A Study with Regression. Educ. Inq. 2020, 12, 1–14. [Google Scholar]
- Verma, C.; Stoffová, V.; Illés, Z. Prediction of students’ awareness level towards ICT and mobile technology in Indian and Hungarian University for the real-time: Preliminary results. Heliyon 2019, 5, 1–7. [Google Scholar] [CrossRef]
- Daniel, B. Background Similarities as a Way to Predict Students’Behaviour. Sustainability 2019, 11, 6883. [Google Scholar]
- Nielsen, B.L.; Brandt, H. Learning before technology: What is needed, pedagogically, for students to benefit from new technology? Augmented reality as an example. In Proceedings of the Xviii Ioste Symposium: Future Educational Challenges from Science & Technology Perspectives, Malom, Sweden, 13–17 August 2018; pp. 1–12. [Google Scholar]
- Timothy, T.; Mingming, Z.; Andy, C.W.F.; Fang, H. Factors that influence university students’ intention to use Moodle: A study in Macau. Educ. Technol. Res. Dev. 2019, 67, 749–766. [Google Scholar]
- Tomas, E.R.; Pedro, M.L. The acceptance of Moodle technology by business administration students. Comput. Educ. 2012, 58, 1085–1093. [Google Scholar]
- Wong, S.L.; Timothy, T. Student Teachers’ Acceptance of Computer Technology. In Technology Acceptance in Education; Teo, T., Ed.; Sense Publishers: Rotterdam, The Netherlands, 2011; pp. 43–61. [Google Scholar]
- David, K.; Silin, Y. Evaluating the intention to use ICT collaborative tools in a social constructivist environment. Int. J. Educ. Technol. High. Educ. 2017, 14, 1–14. [Google Scholar]
- Verhoeven, J.C.; Heerwegh, D.; De Wit, K. Predicting ICT Skills and ICT Use of University Students. In Encyclopedia of Education and Information Technologies; Technology Acceptance in Education; Tatnall, A., Ed.; Springer: Cham, Switzerland, 2020. [Google Scholar]
- Verma, C.; Stoffová, V.; Illés, Z. Real-Time Prediction of Development and Availability of ICT and Mobile Technology in Indian and Hungarian University. In Proceedings of ICRIC 2019; Lecture Notes in Electrical Engineering; Singh, P., Kar, A., Singh, Y., Kolekar, M., Tanwar, S., Eds.; Springer: Cham, Switzerland, 2020; pp. 605–615. [Google Scholar]
- Akaslan, D.; Law, E.L.C. Analysing the Relationship between ICT Experience and Attitude toward E-Learning. In EC-TEL 2012; Lecture Notes in Computer Science; Ravenscroft, A., Lindstaedt, S., Kloos, C.D., Hernández-Leo, D., Eds.; Springer: Berlin/Heidelberg, Germany, 2020; pp. 365–370. [Google Scholar]
- Joseph, N.; Jean, F.M.; Védaste, M. Understanding teachers’ attitude towards computer technology integration in education: A review of literature. Educ. Inf. Technol. 2019, 24, 3041–3052. [Google Scholar]
- Rhonda, C. Effects of Technology Integration Education on the Attitudes of Teachers and Students. J. Res. Technol. Educ. 2014, 34, 411–433. [Google Scholar]
- Rhonda, C. A study of students’ attitudes towards using ICT in a social constructivist environment. Australas. J. Educ. Technol. 2017, 33, 50–62. [Google Scholar]
- Verma, C.; Illés, Z.; Stoffová, V. Predictive Modeling to Predict the Residency of Teachers Using Machine Learning for the Real-Time. In Futuristic Trends in Networks and Computing Technologies, FTNCT 2019; Singh, P., Sood, S., Kumar, Y., Paprzycki, M., Pljonkin, A., Hong, W.C., Eds.; Communications in Computer and Information Science; Springer: Singapore, 2020; pp. 592–601. [Google Scholar]
- Verma, C.; Stoffová, V.; Illés, Z. Prediction of residence country of student towards information, communication and mobile technology for real-time: Preliminary results. Procedia Comput. Sci. 2020, 167, 224–234. [Google Scholar] [CrossRef]
- Aramide, K.; Ladipo, S.; Adebayo, I. Demographic Variables and ICT access as predictors of Information Communication Technologies’ Usage among science teachers in Federal Unity Schools In Nigeria. Libr. Philos. Pract. (e-J.) 2015, 1217, 1–28. [Google Scholar]
- E-Lection. Available online: https://https://election.inf.elte.hu/ (accessed on 19 July 2020).
- Viktória, B.; Zoltán, I.; Verma, C. Towards the Real-Time analysis of Talks. In Proceedings of the 2020 International Conference on Computation, Automation and Knowledge Management (ICCAKM), Dubai, UAE, 9–10 January 2020; pp. 322–327. [Google Scholar]
- Bakonyi, V.; Zoltán, I. Experiences of Using Real-Time Classroom Response Systems. In Proceedings of the 2018 16th International Conference on Emerging eLearning Technologies and Applications (ICETA), Stary Smokovec, Slovakia, 15–16 November 2018; pp. 51–56. [Google Scholar]
- Bakonyi, V.; Zoltán, I. Using Real-time Applications in Education. Int. J. Adv. Electron. Comput. Sci. 2019, 9, 33–39. [Google Scholar]
- Bakonyi, V.; Zoltán, I. Real-time Tools in Classroom. Cent. Eur. J. New Technol. Res. 2019, 1, 13–20. [Google Scholar] [CrossRef]
- Verma, C.; Stoffová, V.; Zoltán, I.; Tanwar, S.; Kumar, N. Machine Learning-based Student’s Native Place Identification for Real-Time. IEEE Access 2020, 8, 130840–130854. [Google Scholar] [CrossRef]
- Eurydice. Available online: https://eacea.ec.europa.eu (accessed on 19 June 2020).
- Trading Economics. Available online: https://tradingeconomics.com/hungary/population (accessed on 19 June 2020).
- Hungarian Central Statistical Office. Available online: https://www.ksh.hu/education (accessed on 19 June 2020).
- Verma, C.; Stoffová, V.; Illés, Z. Study Level Prediction of Indian and Hungarian Students towards ICT and Mobile Technology for the Real-Time. In Proceedings of the 2020 International Conference on Computation, Automation and Knowledge Management (ICCAKM), Dubai, UAE, 9–10 January 2020; pp. 215–219. [Google Scholar]
- Field, A. Discovering Statistics Using SPSS, 3rd ed.; SAGE Publications Ltd.: New Delhi, India, 2009. [Google Scholar]
- Garson, G.D. Testing Statistical Assumptions; Statistical Associates Publishing: Asheboro, NC, USA, 2012; pp. 1–14. [Google Scholar]
- Chen, Y.H. Spatial autocorrelation approaches to testing residuals from least squares regression. PLoS ONE 2016, 11, e0146865. [Google Scholar] [CrossRef] [PubMed]


© 2020 by the authors. Licensee MDPI, Basel, Switzerland. This article is an open access article distributed under the terms and conditions of the Creative Commons Attribution (CC BY) license (http://creativecommons.org/licenses/by/4.0/).