Article

Exploring the Spatial-Temporal Characteristics of Traditional Public Bicycle Use in Yancheng, China: A Perspective of Time Series Cluster of Stations

1
Jiangsu Institute of Urban Planning and Design, Nanjing 210036, China
2
Key Laboratory of Watershed Geographic Sciences, Nanjing Institute of Geography and Limnology, Chinese Academy of Sciences, Nanjing 210008, China
*
Authors to whom correspondence should be addressed.
Sustainability 2020, 12(16), 6370; https://doi.org/10.3390/su12166370
Submission received: 26 June 2020 / Revised: 2 August 2020 / Accepted: 3 August 2020 / Published: 7 August 2020
(This article belongs to the Section Sustainable Transportation)

Abstract

:
Traditional dock-based public bicycle systems continue to dominate cycling in most cities, even though bicycle-sharing services are an increasingly popular means of transportation in many of China’s large cities. A few studies investigated the traditional public bicycle systems in small and mid-sized cities in China. The time series clustering method’s advantages for analyzing sequential data used in many transportation-related studies are restricted to time series data, thereby limiting applications to transportation planning. This study explores the characteristics of a typical third-tier city’s public bicycle system (where there is no bicycle-sharing service) using station classification via the time series cluster algorithm and bicycle use data. A dynamic time warping distance-based k-medoids method classifies public bicycle stations by using one-month bicycle use data. The method is further extended to non-time series data after format conversion. The paper identified three clusters of stations and analyzed the relationships between clusters’ features and the stations’ urban environments. Based on points-of-interest data, the classification results were validated using the enrichment factor and the proportional factor. The method developed in this paper can apply to other transportation analysis and the results also yielded relevant strategies for transportation development and planning.

1. Introduction

As a type of sustainable urban transportation system [1,2,3,4], public bicycle systems worldwide totaled nearly 1200 in 2016 [5]. Since 2008, China has implemented traditional dock-based public bicycle systems by implementing a pattern of government buying services in Hangzhou, Shanghai, Beijing, Guangzhou, and Shenzhen. Although bicycle-sharing services have become an important part of urban transportation in China’s megacities, the traditional public bicycle system is the main service in most small and mid-sized cities [6]. Several small, mid-sized, and large cities in China only have the government-provided public bicycle system; the popular dockless bicycle-sharing services such as Ofo and Mobike, are focused on megacity markets. The rapid expansion of bicycle-sharing services in China has created indiscriminate bicycle parking and abandonment, resulting in discarded bicycles piling up and blocking streets, which is making travel difficult.
In response, the Chinese government has launched a bicycle-sharing electronic fence project that allows users to lock these shared bicycles in designated areas. The process is similar to public bicycles that must be docked at fixed stations. In order to use the bicycle-sharing services and the public bicycle systems more efficiently and effectively, we must first mine data related to bicycles to identify where the various types of bicycles are parked in the cities [7].
A clear understanding of the number of bicycles at the given docking places or stations during different times is significant and useful information for decision-makers regarding urban concerns, such as predicting traffic flows, developing station layouts, and determining bicycle redistributions [8,9]. Attracted to this research topic, many scholars have conducted in-depth and complex correlation analysis and proposed usage indicators, such as rental-time-length sphere quotient, pickup-return tidal ratio, and dock turnover rate, for analyzing passenger flows between public bicycle stations [10]. Some scholars have studied the influence of factors on public bicycle usage in regression analytical models and found that business districts, restaurants, and universities adjacent to stations influence rental volumes significantly [11,12]. Network analytical methods, including community detection in the complex network theory, have been used to study bicycle-sharing services by clustering the networks into communities to interpret the characteristics of public bicycle rental flows [13,14].
These previous studies clearly show some of the characteristics of the public bicycle system, but only a few of them have accounted for the temporal changes in public bicycle rentals, which is probably the most meaningful variable for understanding the operations of public bicycle systems. From a temporal perspective, London’s public bicycle stations were classified using occupational data and a hierarchical cluster algorithm; furthermore, different types of stations may have different bicycle rental characteristics [15]. With the development of machine learning and big data technologies, some urban researchers and scholars have used a time series cluster algorithm to classify data according to time series characteristics, which helps us to better understand the characteristics of human spatial activities. For example, based on subway pass usage data, a time series cluster algorithm was used to classify subway stations, and the results have contributed to our understanding of urban functional partitions and the evaluation of rail transit infrastructure development [16]. Assuming that social media activities in buildings with similar functions have comparable spatiotemporal patterns, a dynamic time warping (DTW) distance using a k-medoids method was applied to convert group buildings with similar social media activities into functional areas [17]. Some studies employed a time series analysis based on the DTW distances to explore the travel characteristics of the bike-sharing system [18,19,20].
Thus, reviewing previous research (which has been described above), we determined that further exploration of the traditional public bicycle systems would be useful for supplementing literature that mostly focused on large cities. First, we demonstrated how to apply a dynamic time warping (DTW) distance-based k-medoids method to classify the public bicycle stations of Yancheng, a middle-sized city in China. Second, although the DTW distance-based k-medoids method is currently used to classify public bicycle stations using time series data, we have extended this method to analyze data with non-time series features by creating a series of data format conversion rules. Anticipating that this approach may help us to determine some rules that are difficult to create for the public bicycle system, we have demonstrated this point through a case study. Third, based on the enrichment factor and the proportional factor, we have validated the classification of public bicycle stations by analyzing points-of-interest (POI) data. This analysis has helped to reveal the relationships between cyclists’ spatial and temporal characteristics and land-use types.
The remainder of this study is structured as follows. Section 2 introduces the methodology and data sources, and Section 3 presents the results and discussion of the analysis of the characteristics of the Yancheng public bicycle system from the station classification perspective. Before concluding, the penultimate section presents discussions of relevant policy implications.

2. Materials and Methods

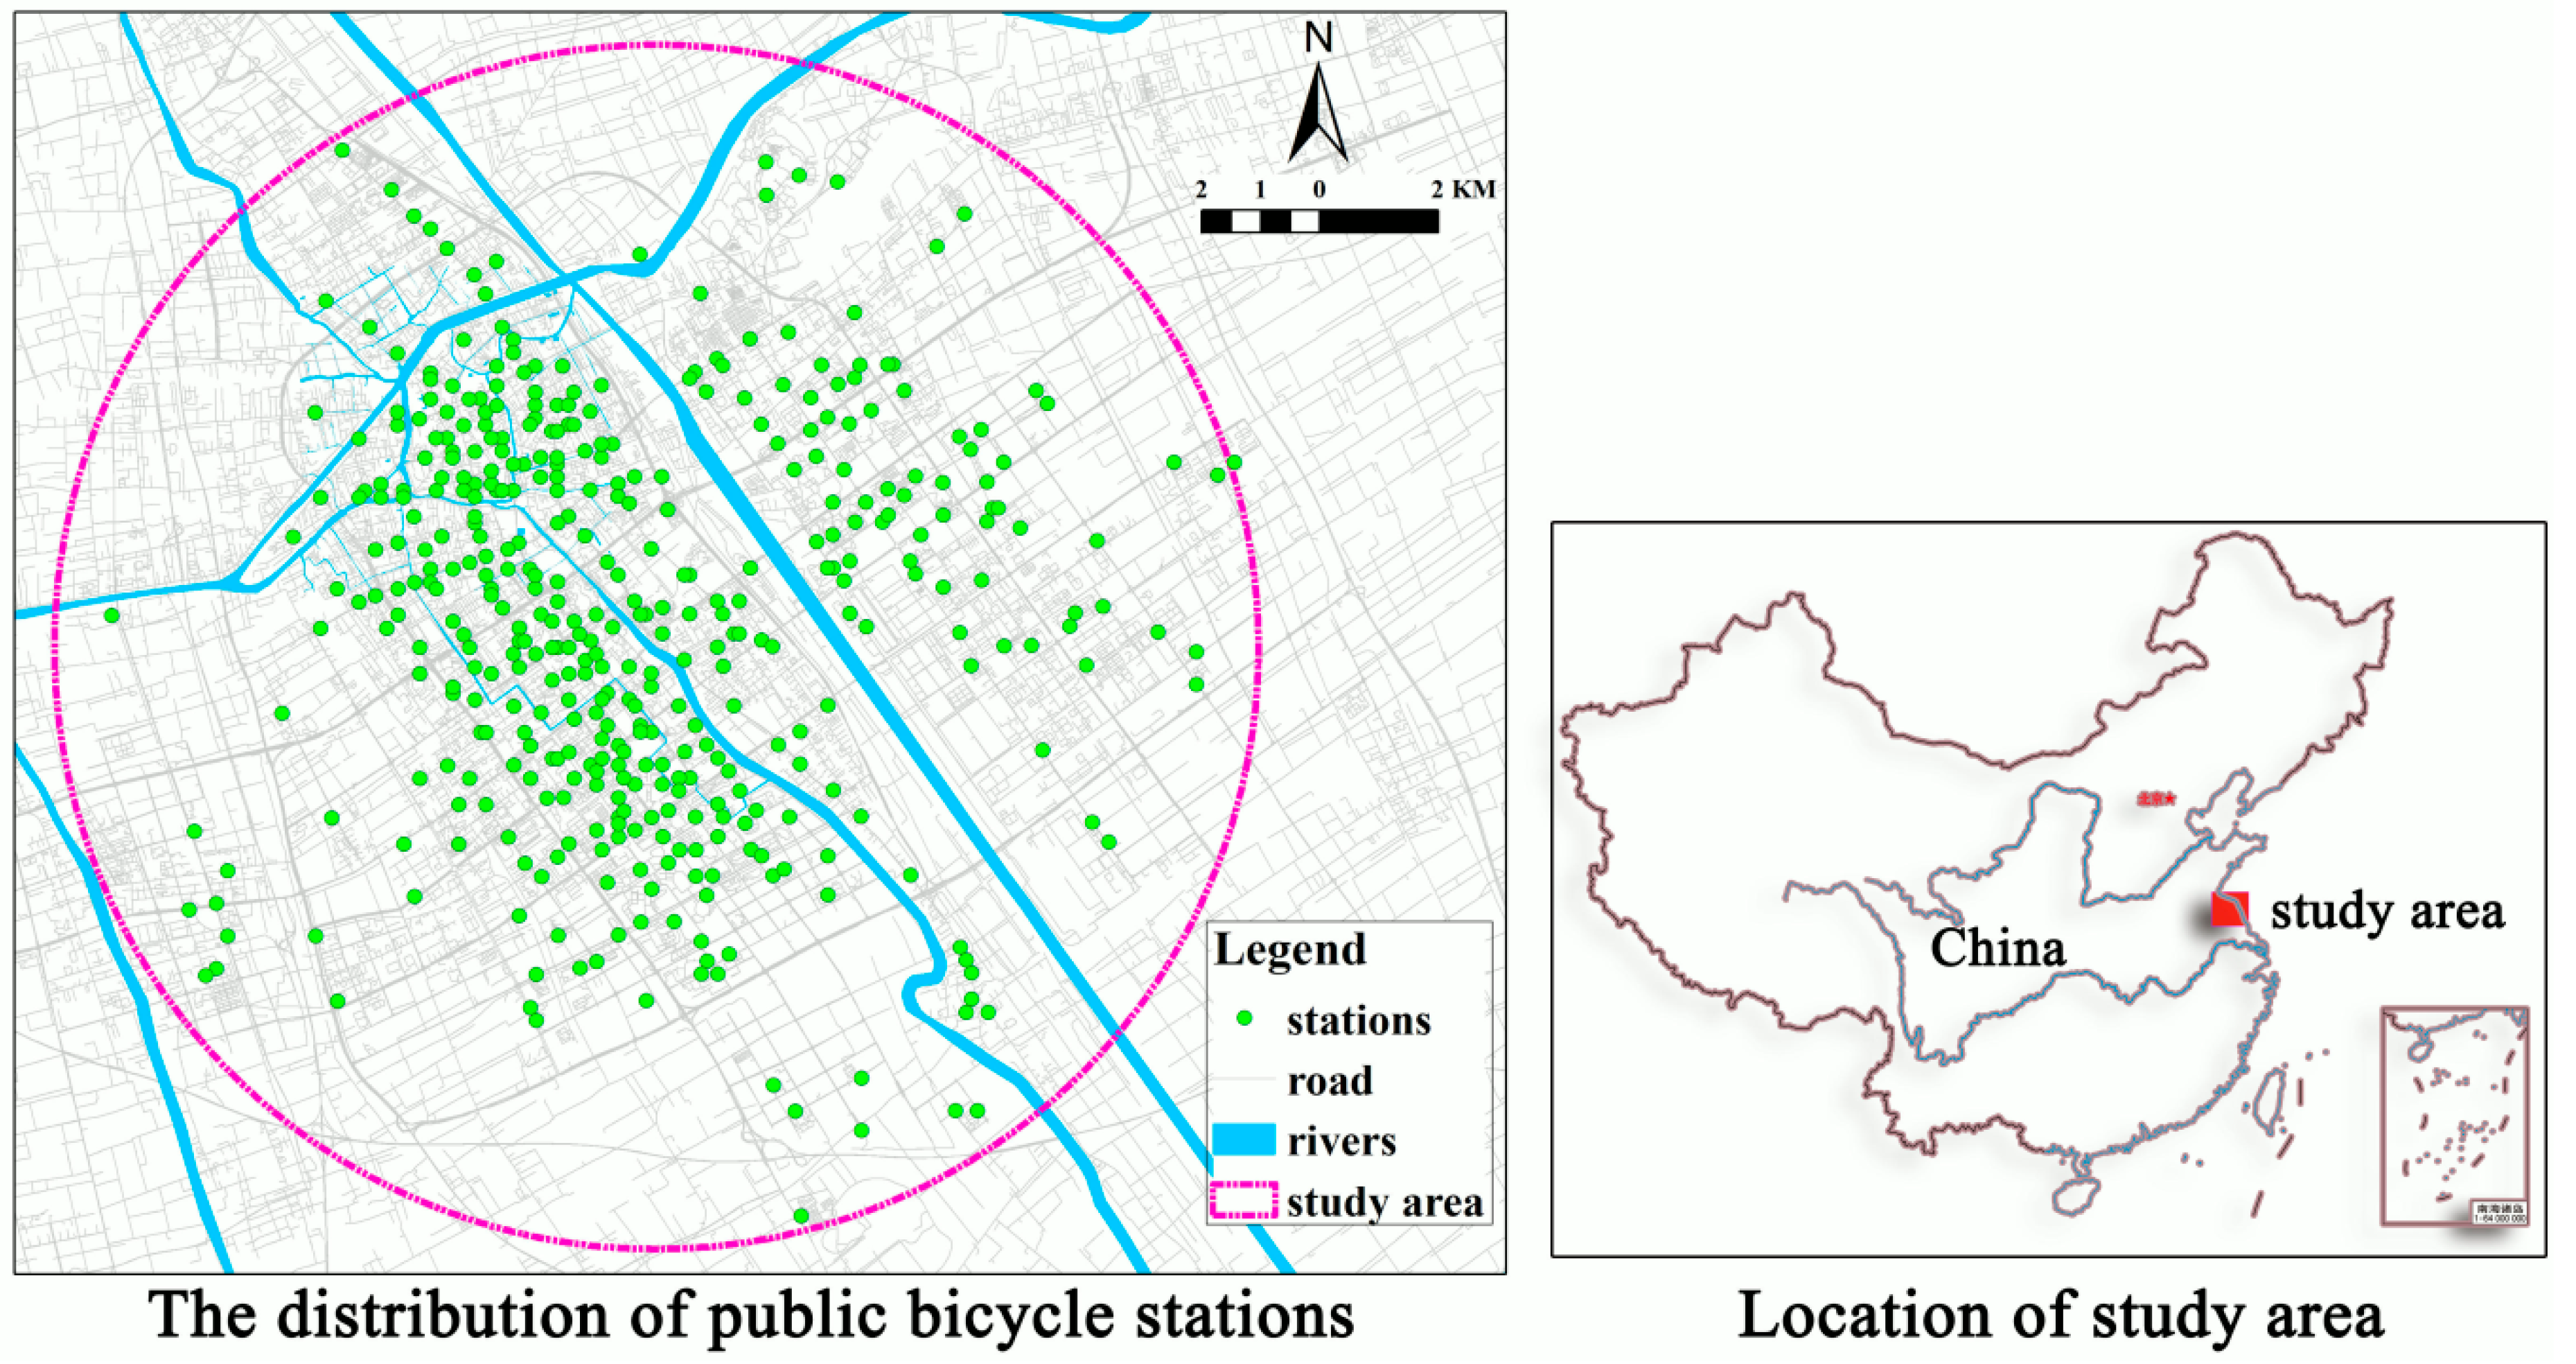
2.1. Study Area and Data Collection

This study examines the spatial dynamics of public bicycle systems through a case study in Yancheng. This city on the east coast of Jiangsu, China, is famous for its tourist attractions. Recently, the city proposed to reduce its carbon emissions by implementing focused projects, including its public bicycle system established in December 2014. By the end of December 2016, its total number of public bicycle cards was about 80,000 and the number of per day public bicycle rentals was as high as 40,000. The data without personal information are provided by the transport department of Yancheng municipal government. By sorting and cleaning Yancheng’s public bicycle card data during September 2016, we obtained about 424,581 valid trip records from 420 public bicycle stations (Figure 1). The average daily number of trips was 14,513. Every trip record provides the rental station number, departure time, return station number, return time, longitudes and latitudes of the departure and return stations, and the dates and durations of use. Since the temporal and spatial cycling activities of the public bicycle system differ depending on the day of the week (work week versus weekend) [21], we divided the dataset into weekday data and weekend data. At the time of this study, Yancheng did not have a bicycle-sharing service.
POI data, which are derived from location-based services, are a basic data type in China. Their most common current use is in the identification of functional areas. Since POI data contain information on various types of urban facilities, they easily reflect land-use patterns [22,23]. Due to the wide variety of POI data, further reclassification work is essential for meeting various analytical purposes. The POI data used in this study were web-crawled using a Gaode map, which is one of the most popular map providers in China. The POI data were reclassified to create 10 categories by category code (Table 1). Here, some categories may be similar, such as educational POIs or terminal POIs. However, people’s travel purpose in college is more diverse than those in middle school. Most middle school students will travel together and regularly at school and after school. Similarly, bus stations in the city center attract large numbers of travelers who can access by cycling, but there are few cyclists as long-distance transit stations are usually far away from the city center. These details bear account for the rationale of the station classification.

2.2. Analytical Methods

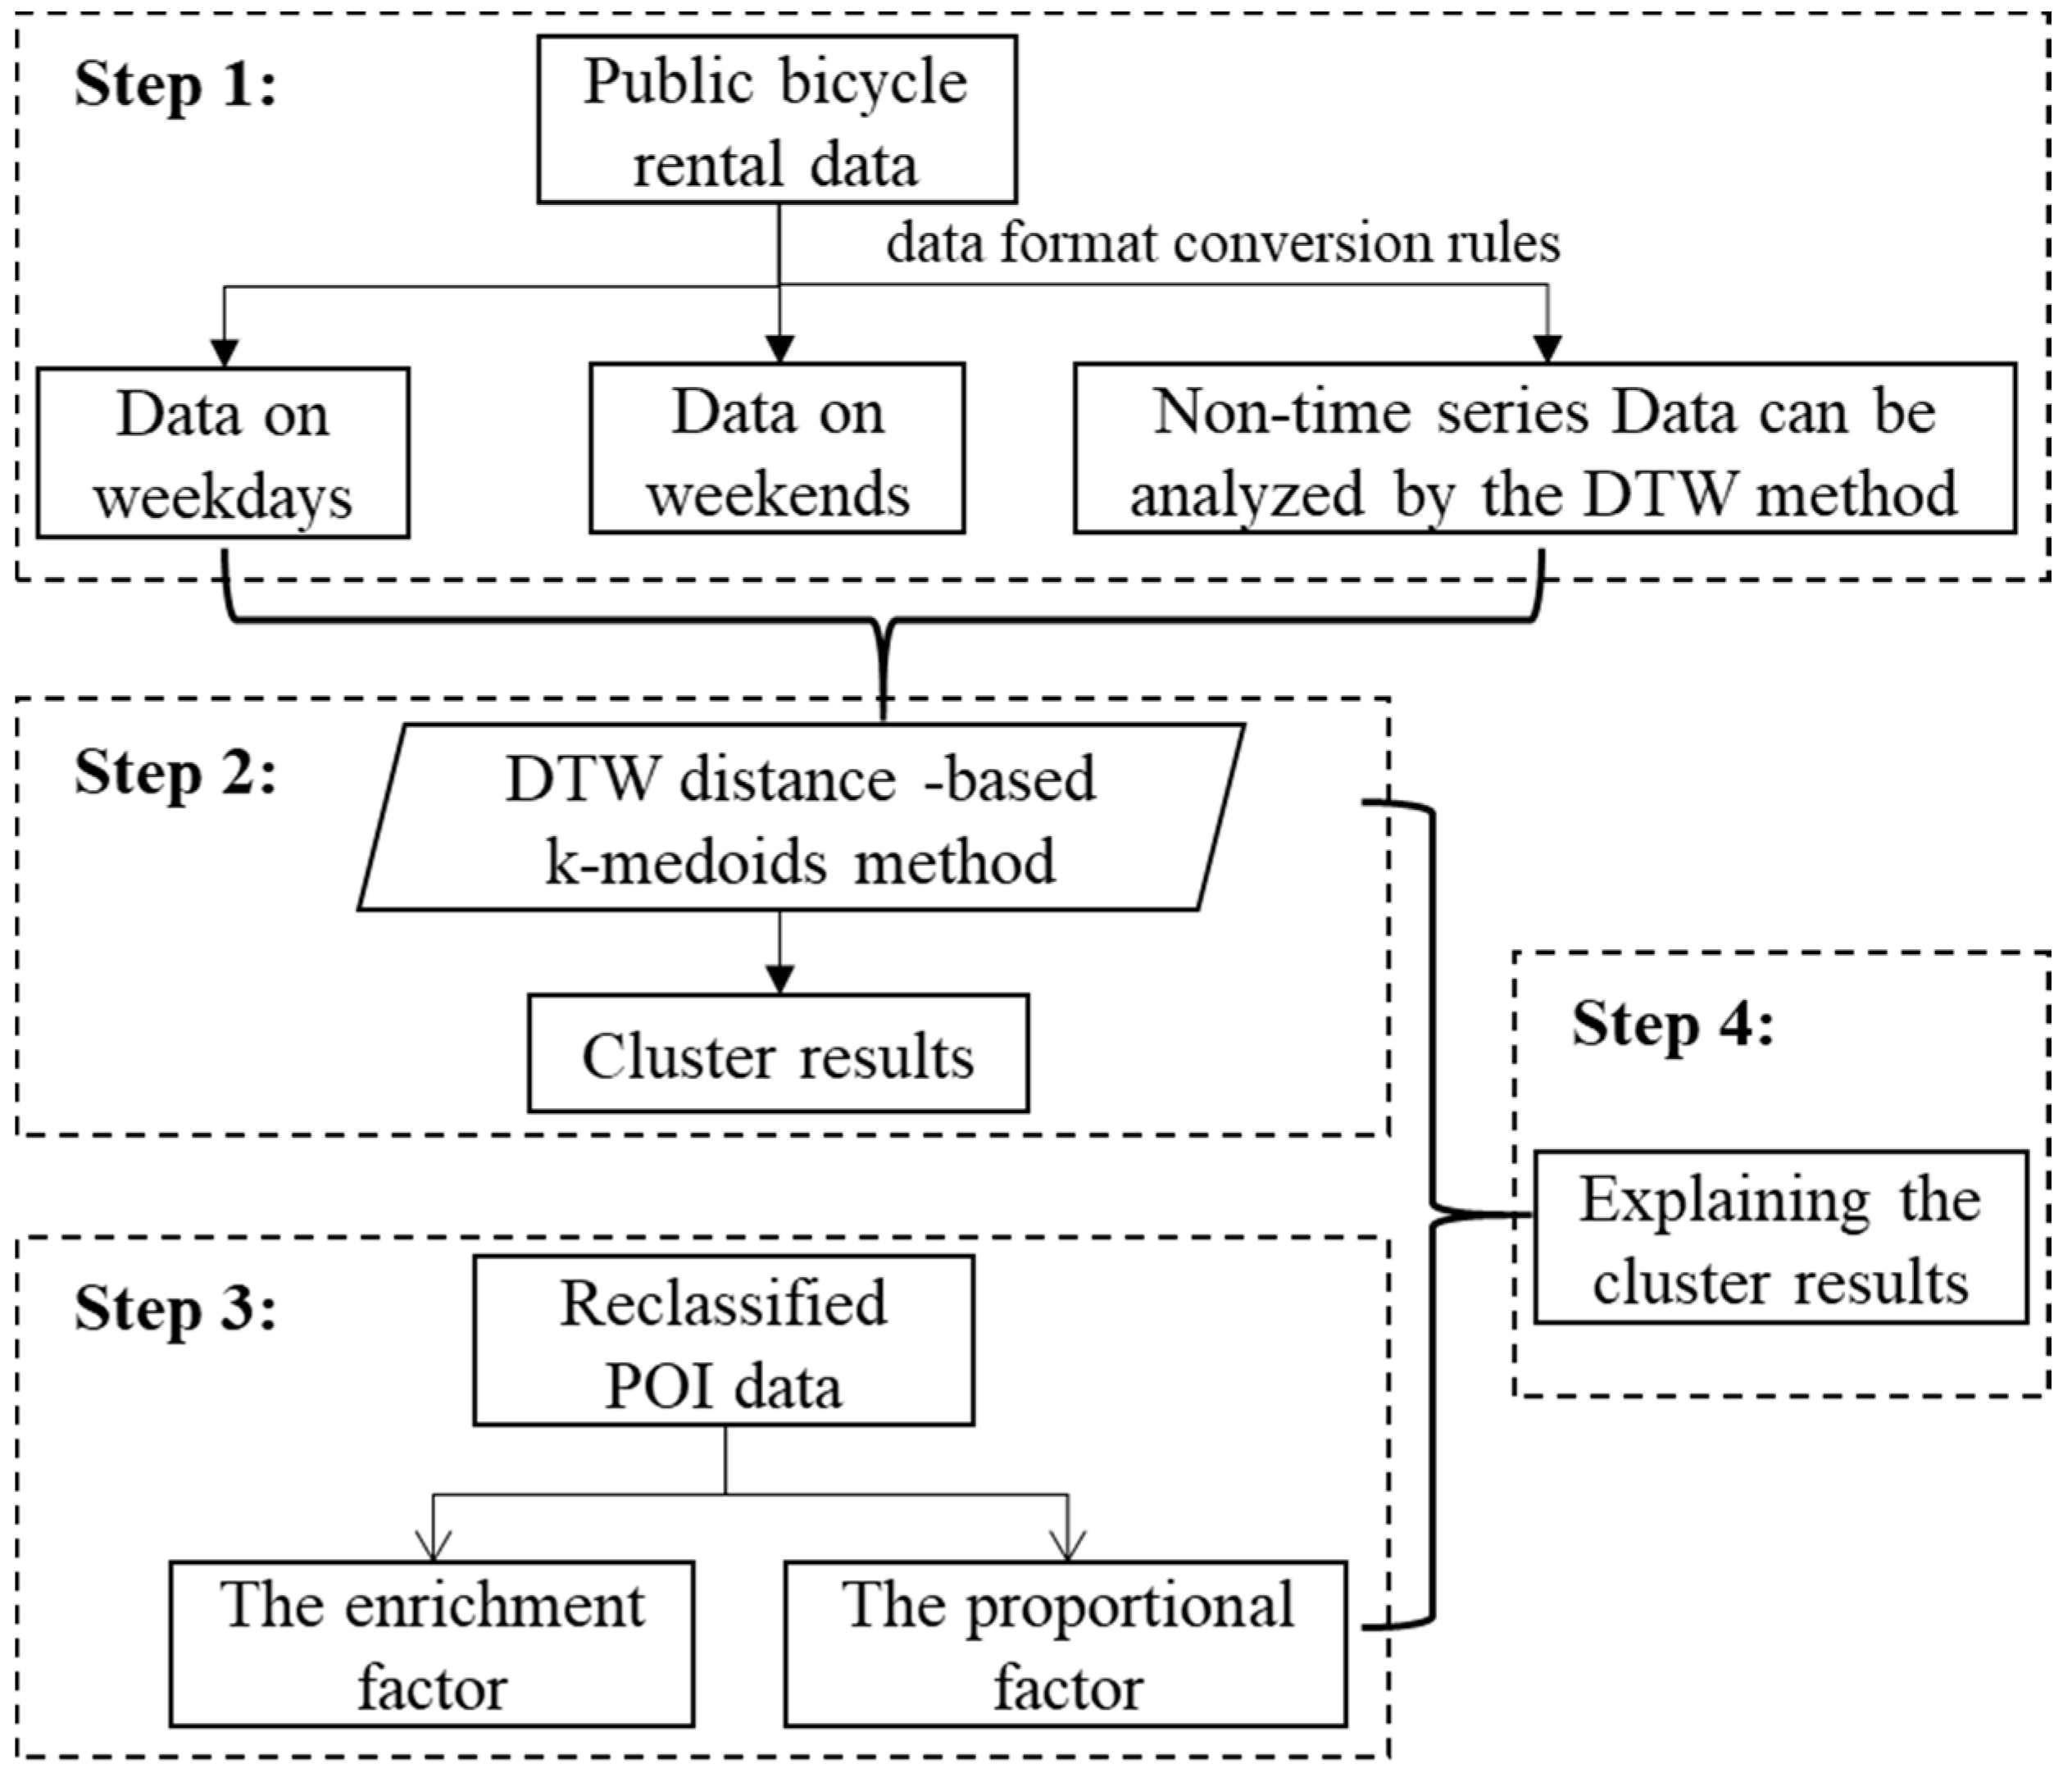
2.2.1. Overall Methodological Framework

As shown in Figure 2, our analysis contained four steps.
Step 1:
The original data are preprocessed. On the one hand, the public bicycle rental dataset is divided into weekday data and weekend data. On the other hand, we then convert the non-time series data into data that can be analyzed with the DTW method through some data format conversion rules.
Step 2:
In this step, the station classification results are obtained by using a dynamic time warping distance-based k-medoids method.
Step 3:
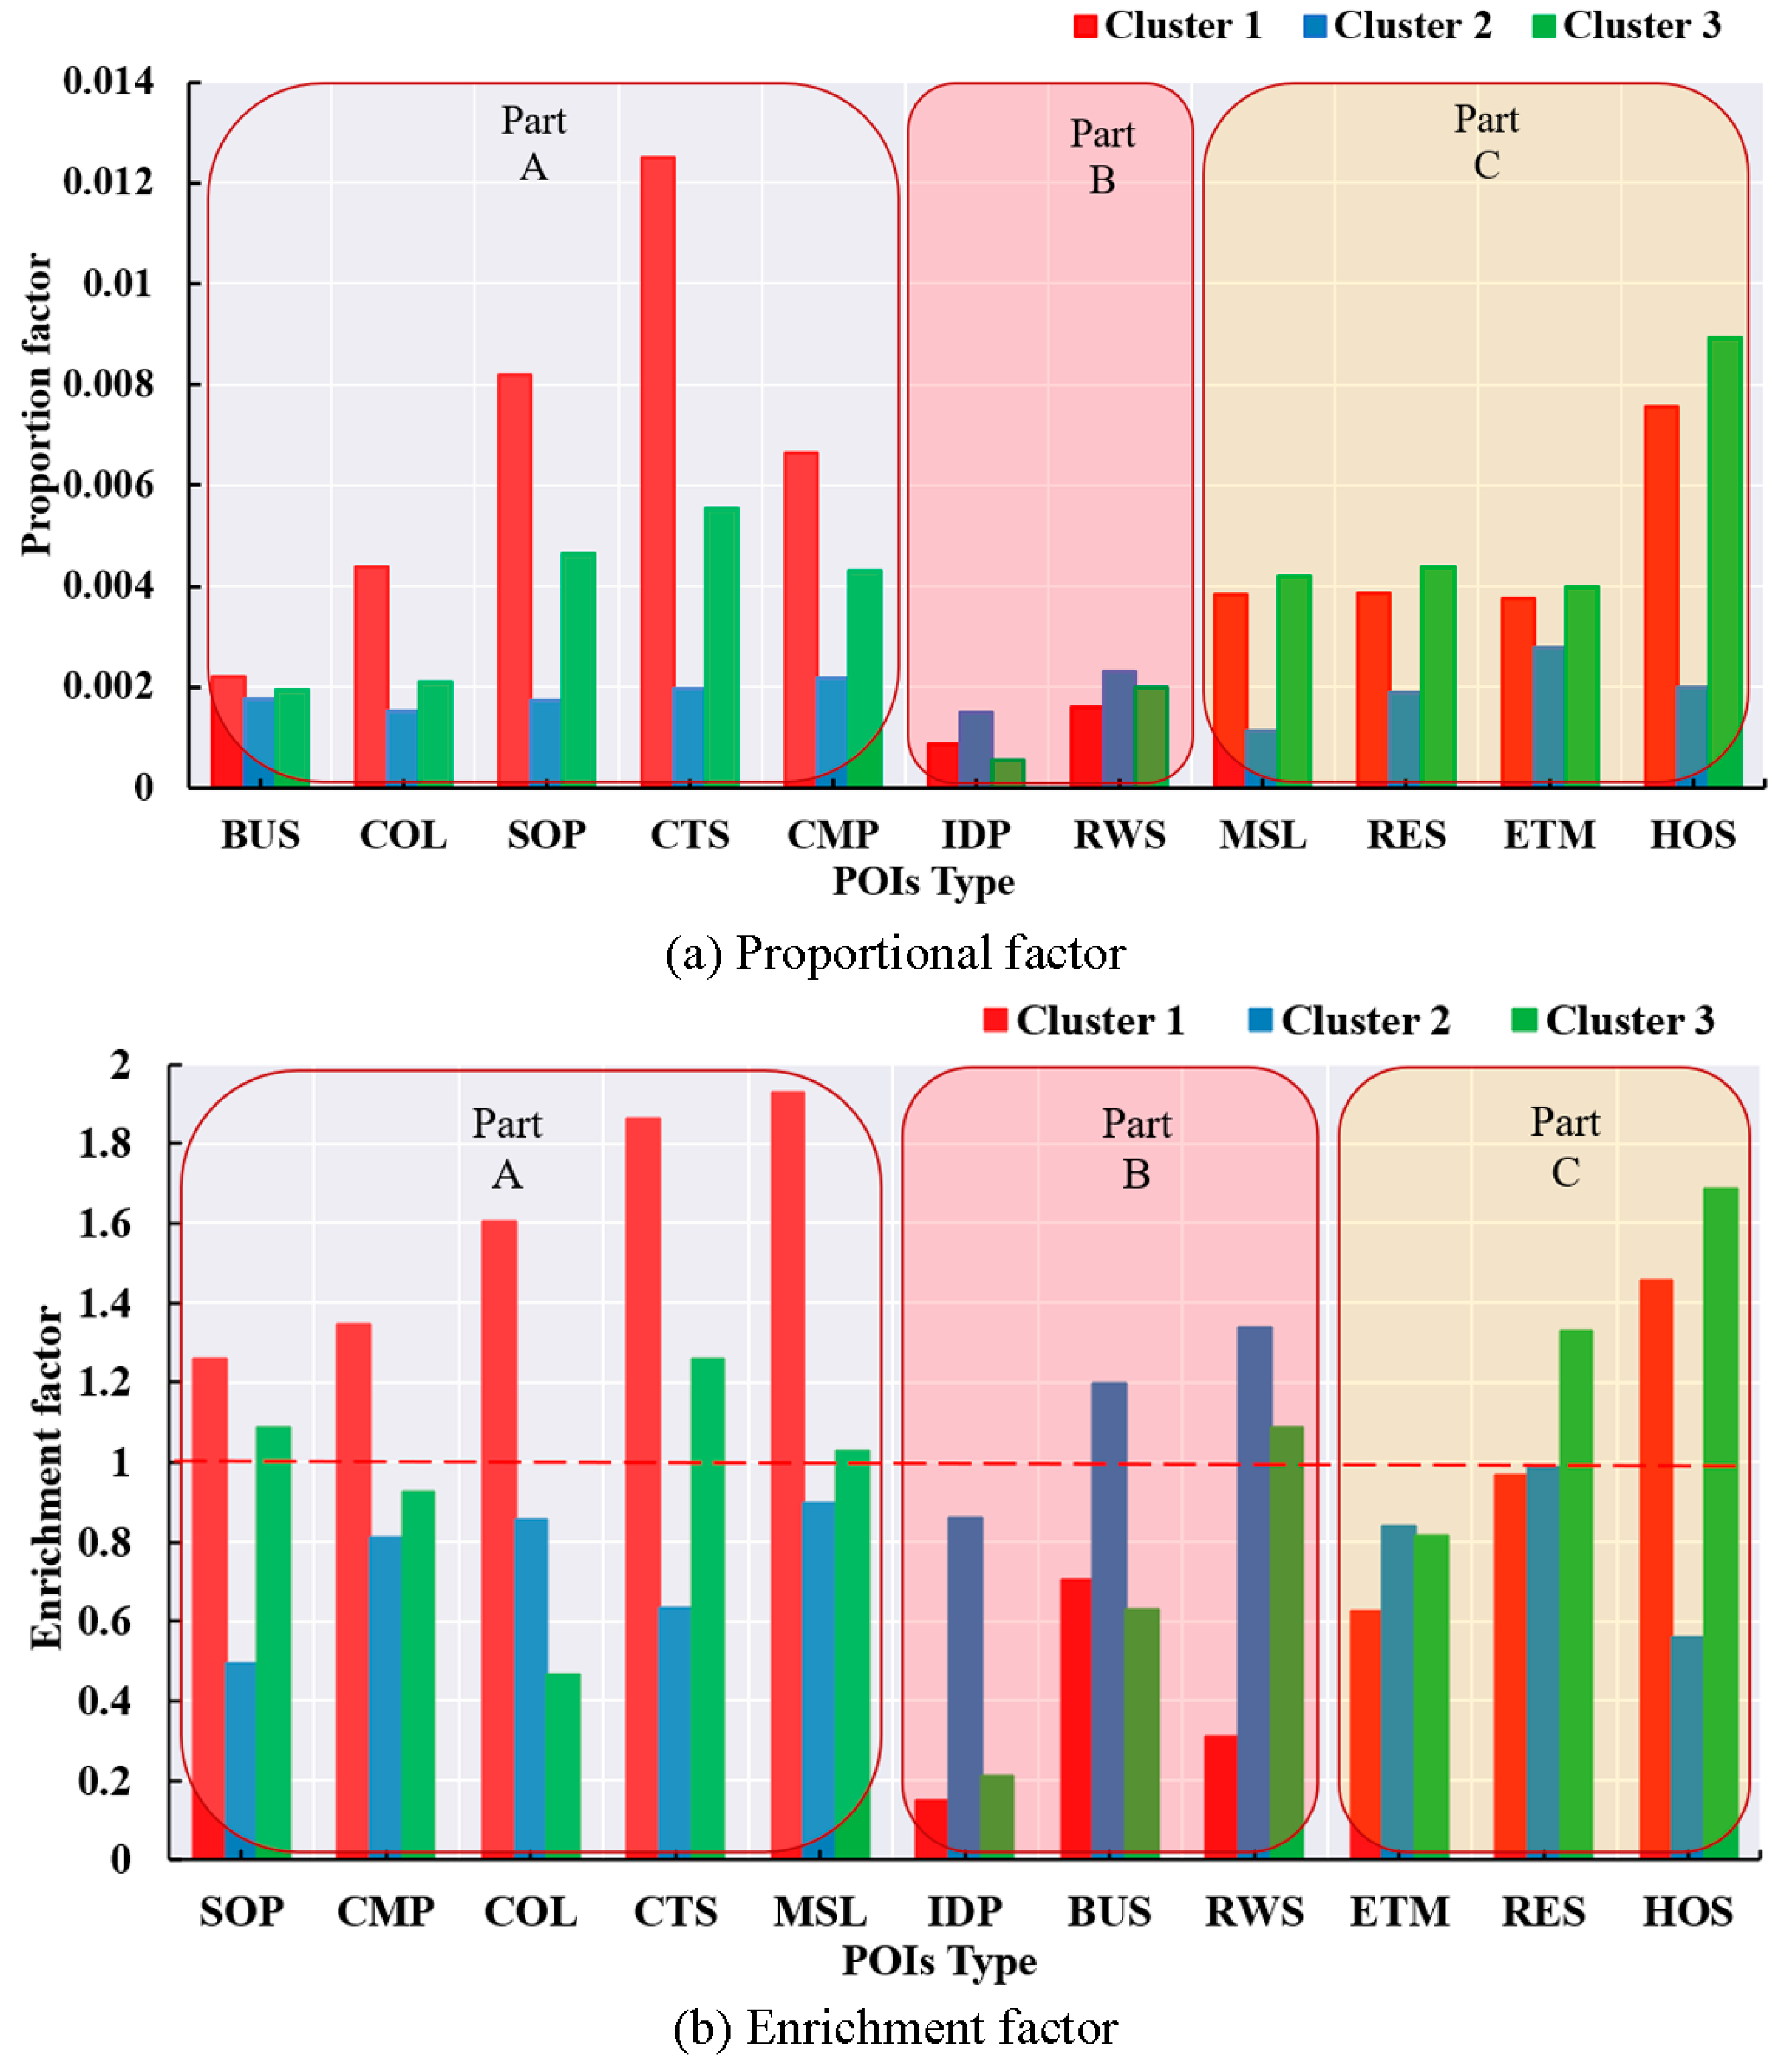
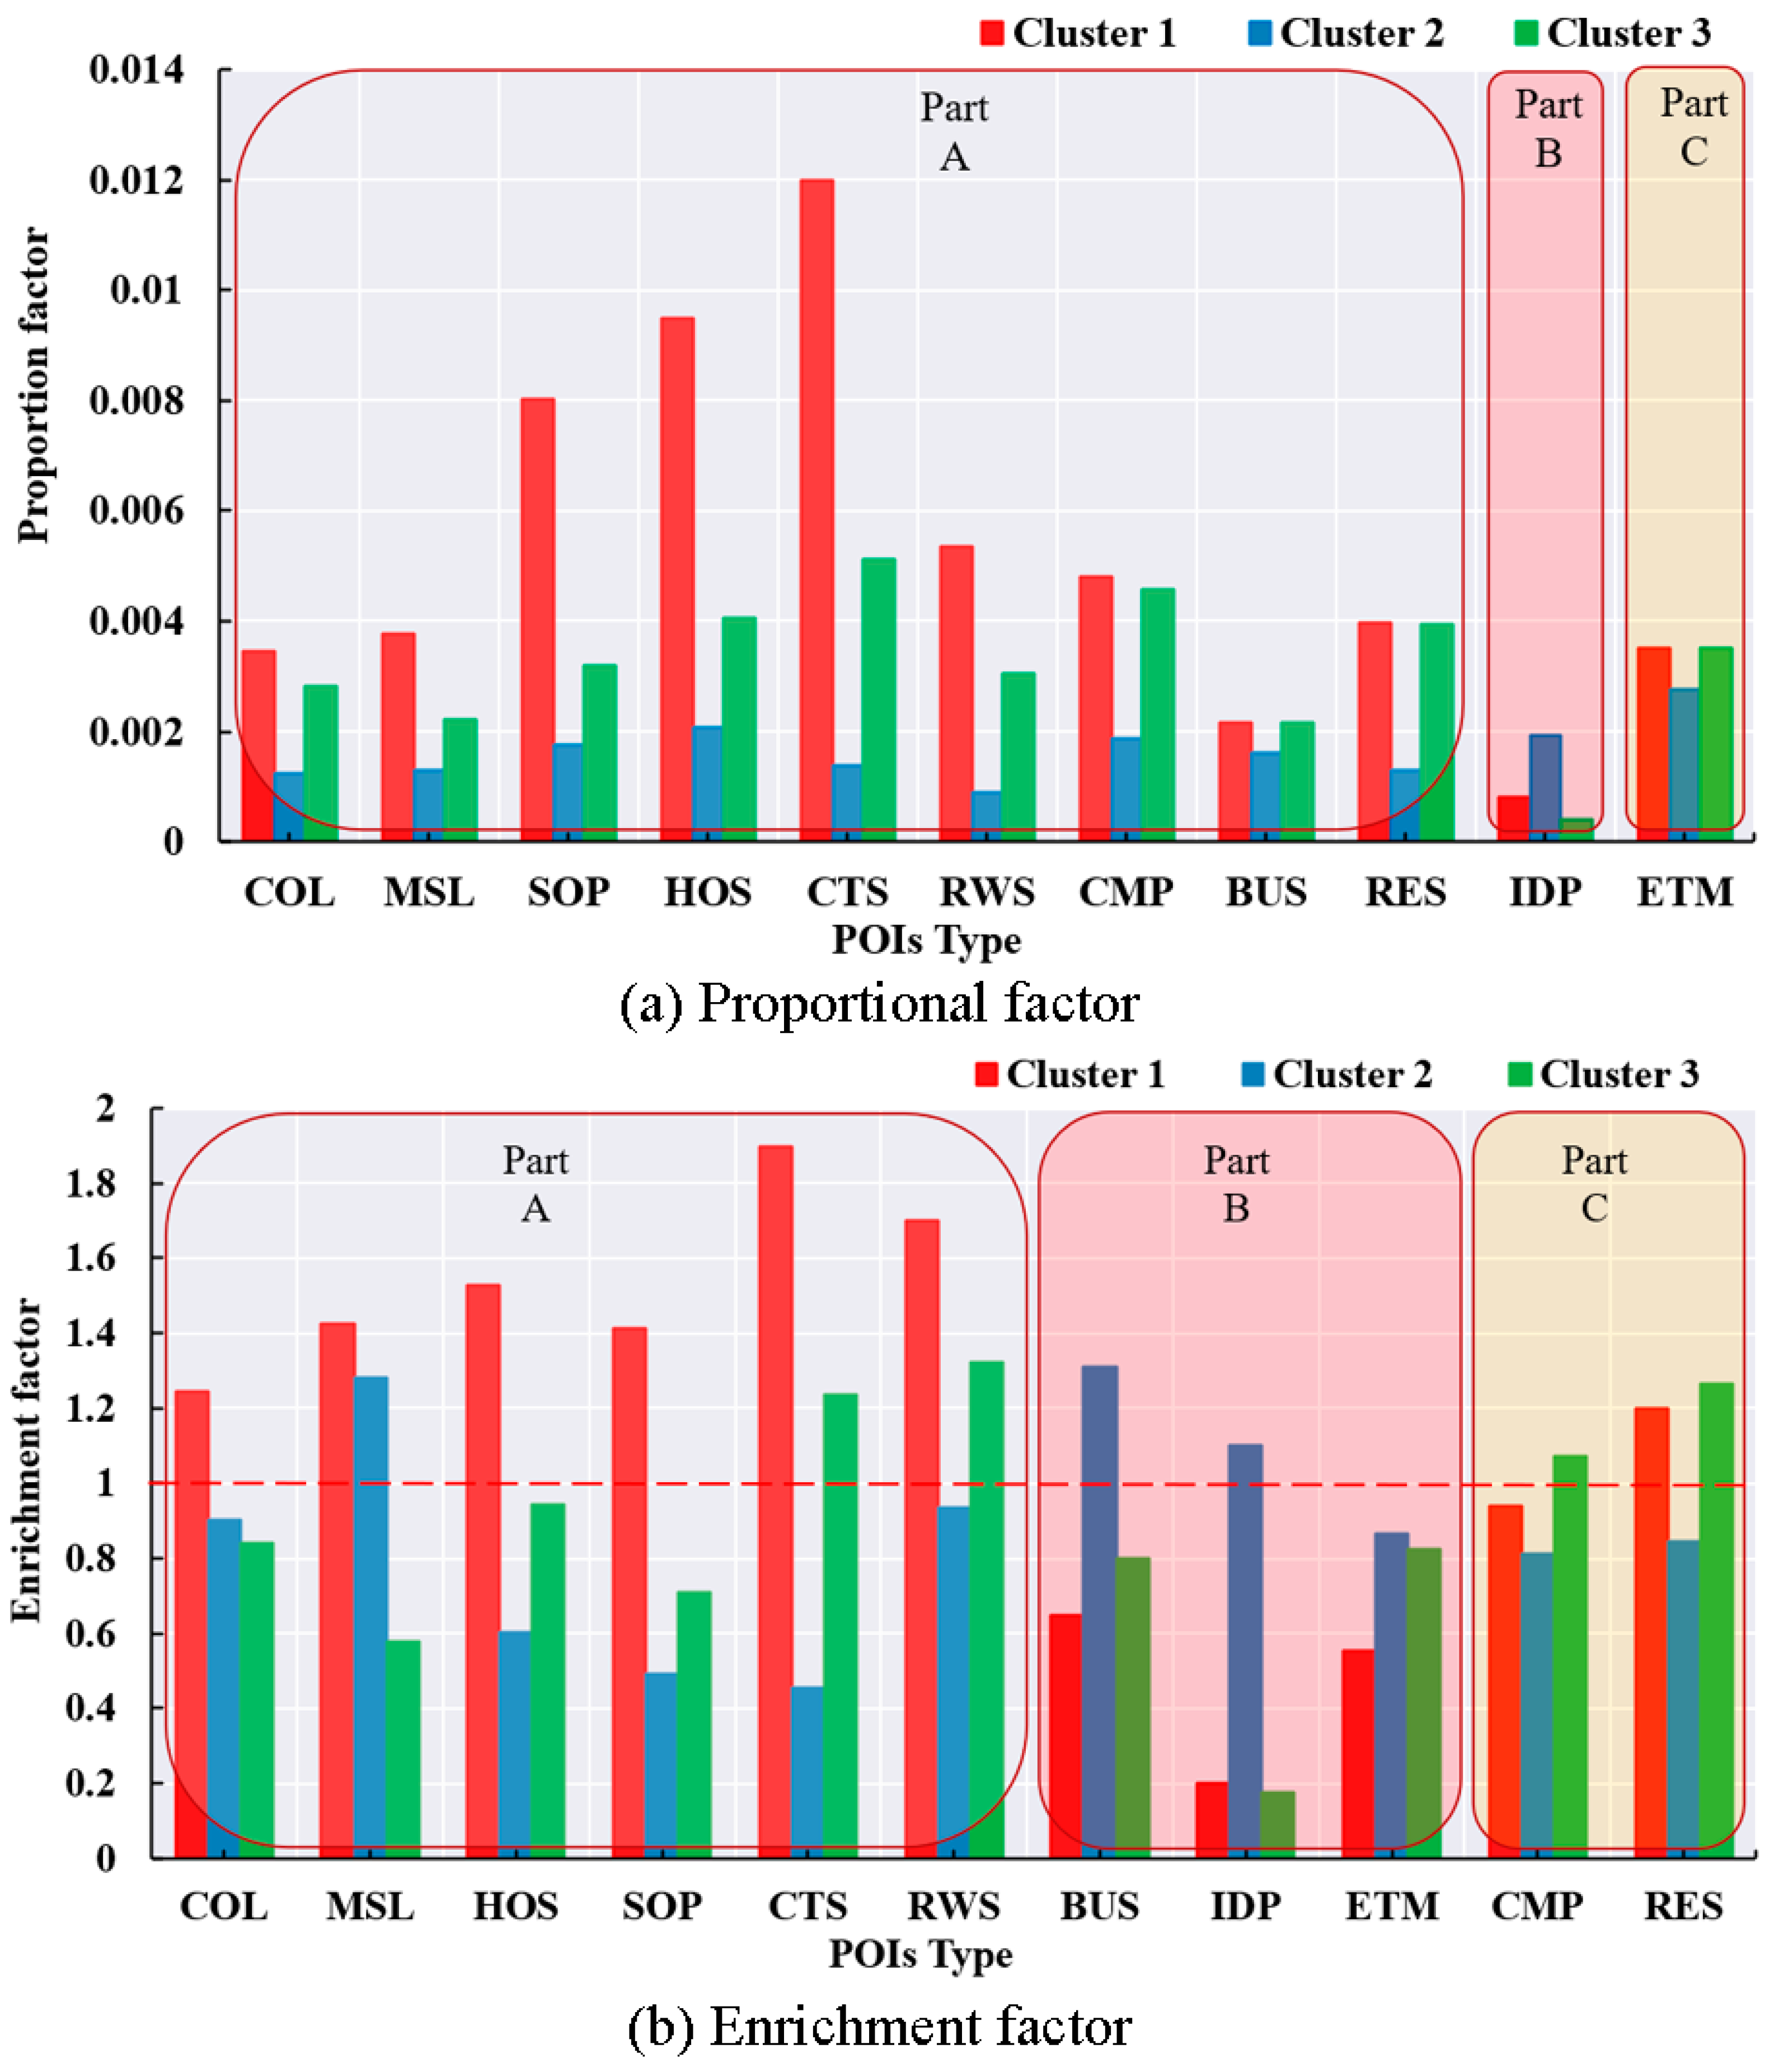
Based on POI data, the stations’ surrounding environments are explored by using the enrichment factor and the proportional factor.
Step 4:
The classification results are validated using the calculation results of Steps 2 and 3.

2.2.2. Dynamic Time Warping (DTW) Distance

DTW distance refers to the length of the optimal alignment (i.e., the warping path) between two given time series data points [17]. The bigger the differences between two time series points, the larger the DTW distance between them. This measure is well known for its ability to reveal the similarity between two time series data points of different lengths by extending or shortening the time series data period. Generally, we interpreted the classification results based on the sampling units (stations). For example, data that were segmented in one-hour intervals might indicate that the peak rental periods of a given group of public bicycle stations occurred at 8:00 a.m. and 5:00 p.m., whereas the peak rental period of a different group of public bicycle stations occurred only at 8:00 a.m. Therefore, the time series data used in this study needed a constant sampling interval for all the public bicycle stations. Otherwise, it would have been difficult to interpret the temporal dimension of the classification results. Additionally, a high sampling frequency was necessary for avoiding the omission of key temporal nodes, and therefore, we segmented the sample data at 20-min intervals. More information on DTW distance can be found in those previous studies [24,25,26].

2.2.3. DTW Distance Using the k-Medoids Method

The k-medoids method is relatively insensitive to the influences of outliers and data noise, which makes it a more robust method than the k-means method [27]. To obtain an appropriate number of clusters, a few trials were performed by computing DTW distance with the k-medoids method using different values of k. We used two indexes (Silhouette Coefficient and Calinski-Harabasz Index) to validate the clustering results. The Silhouette Coefficient was calculated using mean intra-cluster distance and mean nearest-cluster distance of each sample. It ranged from −1 to 1, and a high value indicated that the object was well matched to its cluster and poorly matched to nearby clusters. The Calinski-Harabasz Index assesses validity using the average of the between- and within-cluster sum of squares. It indicates separation based on the maximum distance between clusters and compactness based on the sum of distances between objects and their cluster center [28]. The final number of clusters was determined by cross-validation of the two results.
The DTW distance algorithm using the k-medoids method can be summarized as follows.
Step 1:
Determine the number of clusters, i.e., the value of k.
Step 2:
Choose the initial centers of the k clusters.
Step 3:
Assign each station sample to the nearest cluster center based on the DTW distance.
Step 4:
Update the centers of all clusters to their optimal locations. First, calculate the DTW distance of each object. Then, identify a core object in each cluster with the minimum average DTW distance from the other objects in the cluster. Assign the location of the core object as the new cluster center.
Step 5:
If none of the stations changed membership or the number of iterations reached the preset value, iterations were stopped; otherwise, Steps 3 and 4 were repeated.

2.2.4. Evaluation of the Cluster Results

By analyzing POI data, we fully explored the effects of the stations’ surrounding environments on the classification results. POI data are usually used to reveal land-use structures at certain spatial scales. The enrichment factor [29] was used to describe the relative abundance of different types of POI. The enrichment factor was expressed using Equation (1) below:
F i , j = n i , j / n i N j / N
where Fi,j represents the POI enrichment factor in the jth category for public bicycle station i; ni,j represents the POI total in the jth category in the vicinity of public bicycle station i; ni represents the POI total in the vicinity of the public bicycle station i; Nj represents the POI total in the jth category; and N is the total POI of the study area. A higher value of Fi,j means a larger number of POI in the jth category at public bicycle station i. Furthermore, the enrichment factor was normalized to eliminate the effects of the imbalanced POI sizes across categories. In particular, a Fi,j value of one suggests that the enrichment factor of the POI in the jth category equals the regional average, whereas Fi,j > 1 or Fi,j < 1 means that the POI enrichment factor in the jth category was larger (or smaller) than the regional average [17].
However, when the number of POI types at the public bicycle station was very small, even when the number of individual POI was small, the enrichment coefficient value of some POI types was large. For example, when there was one POI category in the vicinity of a given public bicycle station, even when the number of POI at that location was also one, the enrichment factor of that POI type would be relatively large for the given public bicycle station. This phenomenon might have caused some public bicycle stations to have very high enrichment factor values for some important POI types even when the usage rates of those stations were very low. Therefore, the proportional factor was used to describe the direct quantities of POI, by type, as a supplementary interpretation for enhancing comprehensive understanding of public bicycle stations’ characteristics, as shown in Equation (2).
r i , j = n i , j N j
where ri,j denotes the POI proportional factor in the jth category of public bicycle station i; ni,j denotes the POI total in the jth category in the vicinity of station i, and Nj denotes the POI total in the jth category in the entire study area. It should be noted that the search radius of each public bicycle station was set at 250 m [11].

2.2.5. DTW Method for Non-Time Series Data Analysis

Although the DTW method has exhibited a huge advantage for time series analysis, the applications of the method to non-time series data are rare. We propose an extension of the application of the DTW method to non-time series data. The main steps aim to convert non-time series data into data that can be analyzed by the DTW method through particular transformation rules, and to analyze the classification results based on those transformation rules. Figure 3 illustrates the transformation process.
The main steps of the proposed methodology can be summarized as follows.
Step 1:
We recorded the current traffic volume of a public bicycle station (designated station “i”) flowing to all other public bicycle stations as row vector xi (see Figure 2, dataset A). Then, the row vector was sorted according to the spatial distance between station i and all other public bicycle stations. The reordered row vector xi was recorded as a new row vector yi (see Figure 3, dataset B).
Step 2:
We repeated Step 1 for all other public bicycle stations. Then, the row vectors yi (i = 1, 2, …, 420) corresponding to the 420 public bicycle stations were obtained. These vectors yi (i = 1, 2, …, 420) constituted the row vectors of the matrix Y (see Figure 3, dataset C) that can be seen as a time series dataset.
Step 3:
The DTW distance using the k-medoids method was applied to a clustering analysis of the matrix Y.
The classification results indicated the effects of spatial distance (i.e., the shortest path distance) on the passenger flow volume of the public bicycle stations. We emphasize that the passenger flow volume was successively computed within certain spatial distance ranges. The first interval was zero to one km, the second interval was one to two km, and the interval value continued to increase by one km each computation until the maximum value of 27 km was reached. When there was no passenger flow between two stations, the passenger flow volume was set at zero. To improve accuracy, this study performed the shortest path analysis between two public bicycle stations using Applications Programming Interfaces (APIs) of the Gaode map, which provides accurate road data and an algorithm for computing the shortest path based on the recommended cycling paths [6].

3. Results

3.1. Cluster Analysis for Weekdays and Weekends

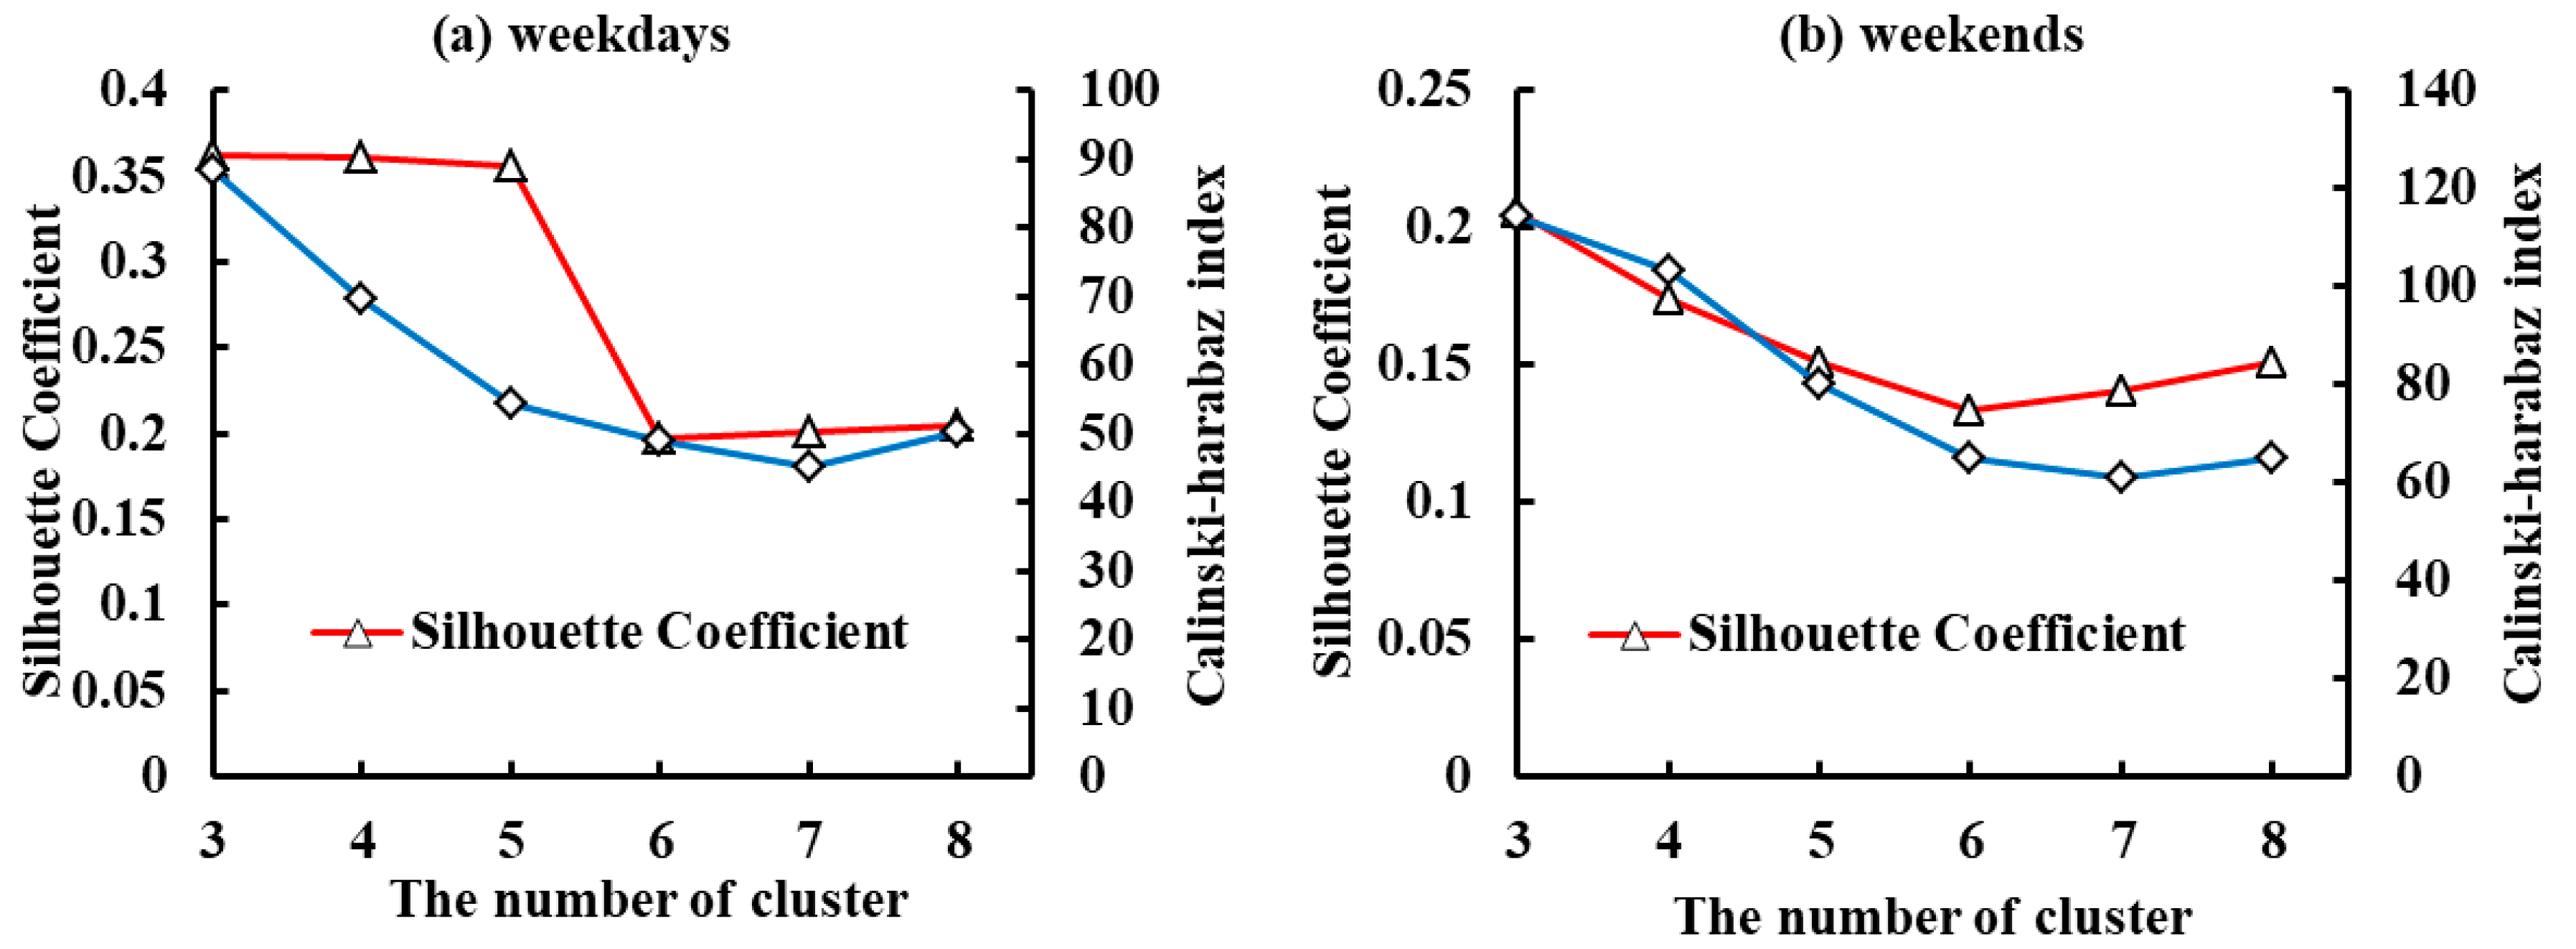
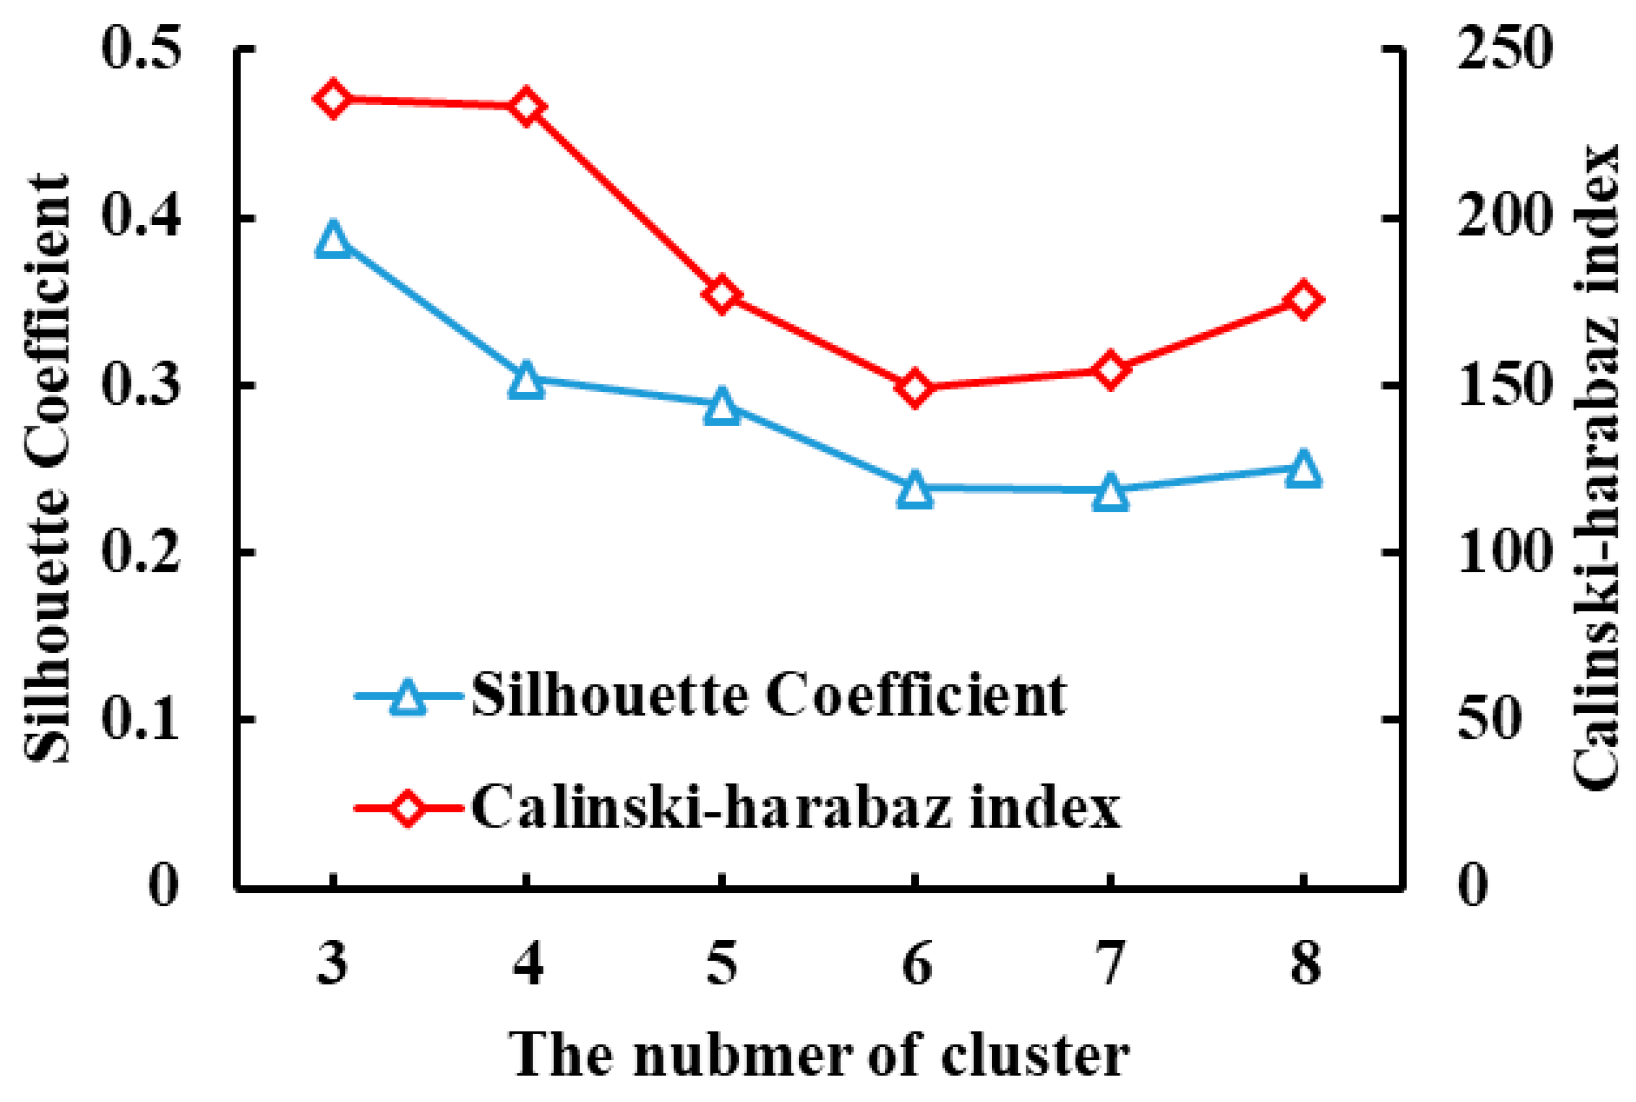
3.1.1. The Optimal Number of Clusters

The optimal number of clusters was investigated using the Silhouette Coefficient and the Calinski-Harabasz Index for weekdays and weekends, respectively. Figure 4a shows that the weekday Silhouette Coefficient was relatively high when the number of clusters varied from three to five and that the Calinski-Harabasz Index also had a high value when the number of clusters was three. Therefore, we identified the optimal number of clusters on weekdays as three. Similarly, we concluded, from the data shown in Figure 4b, that the optimal number of clusters for weekends was three.

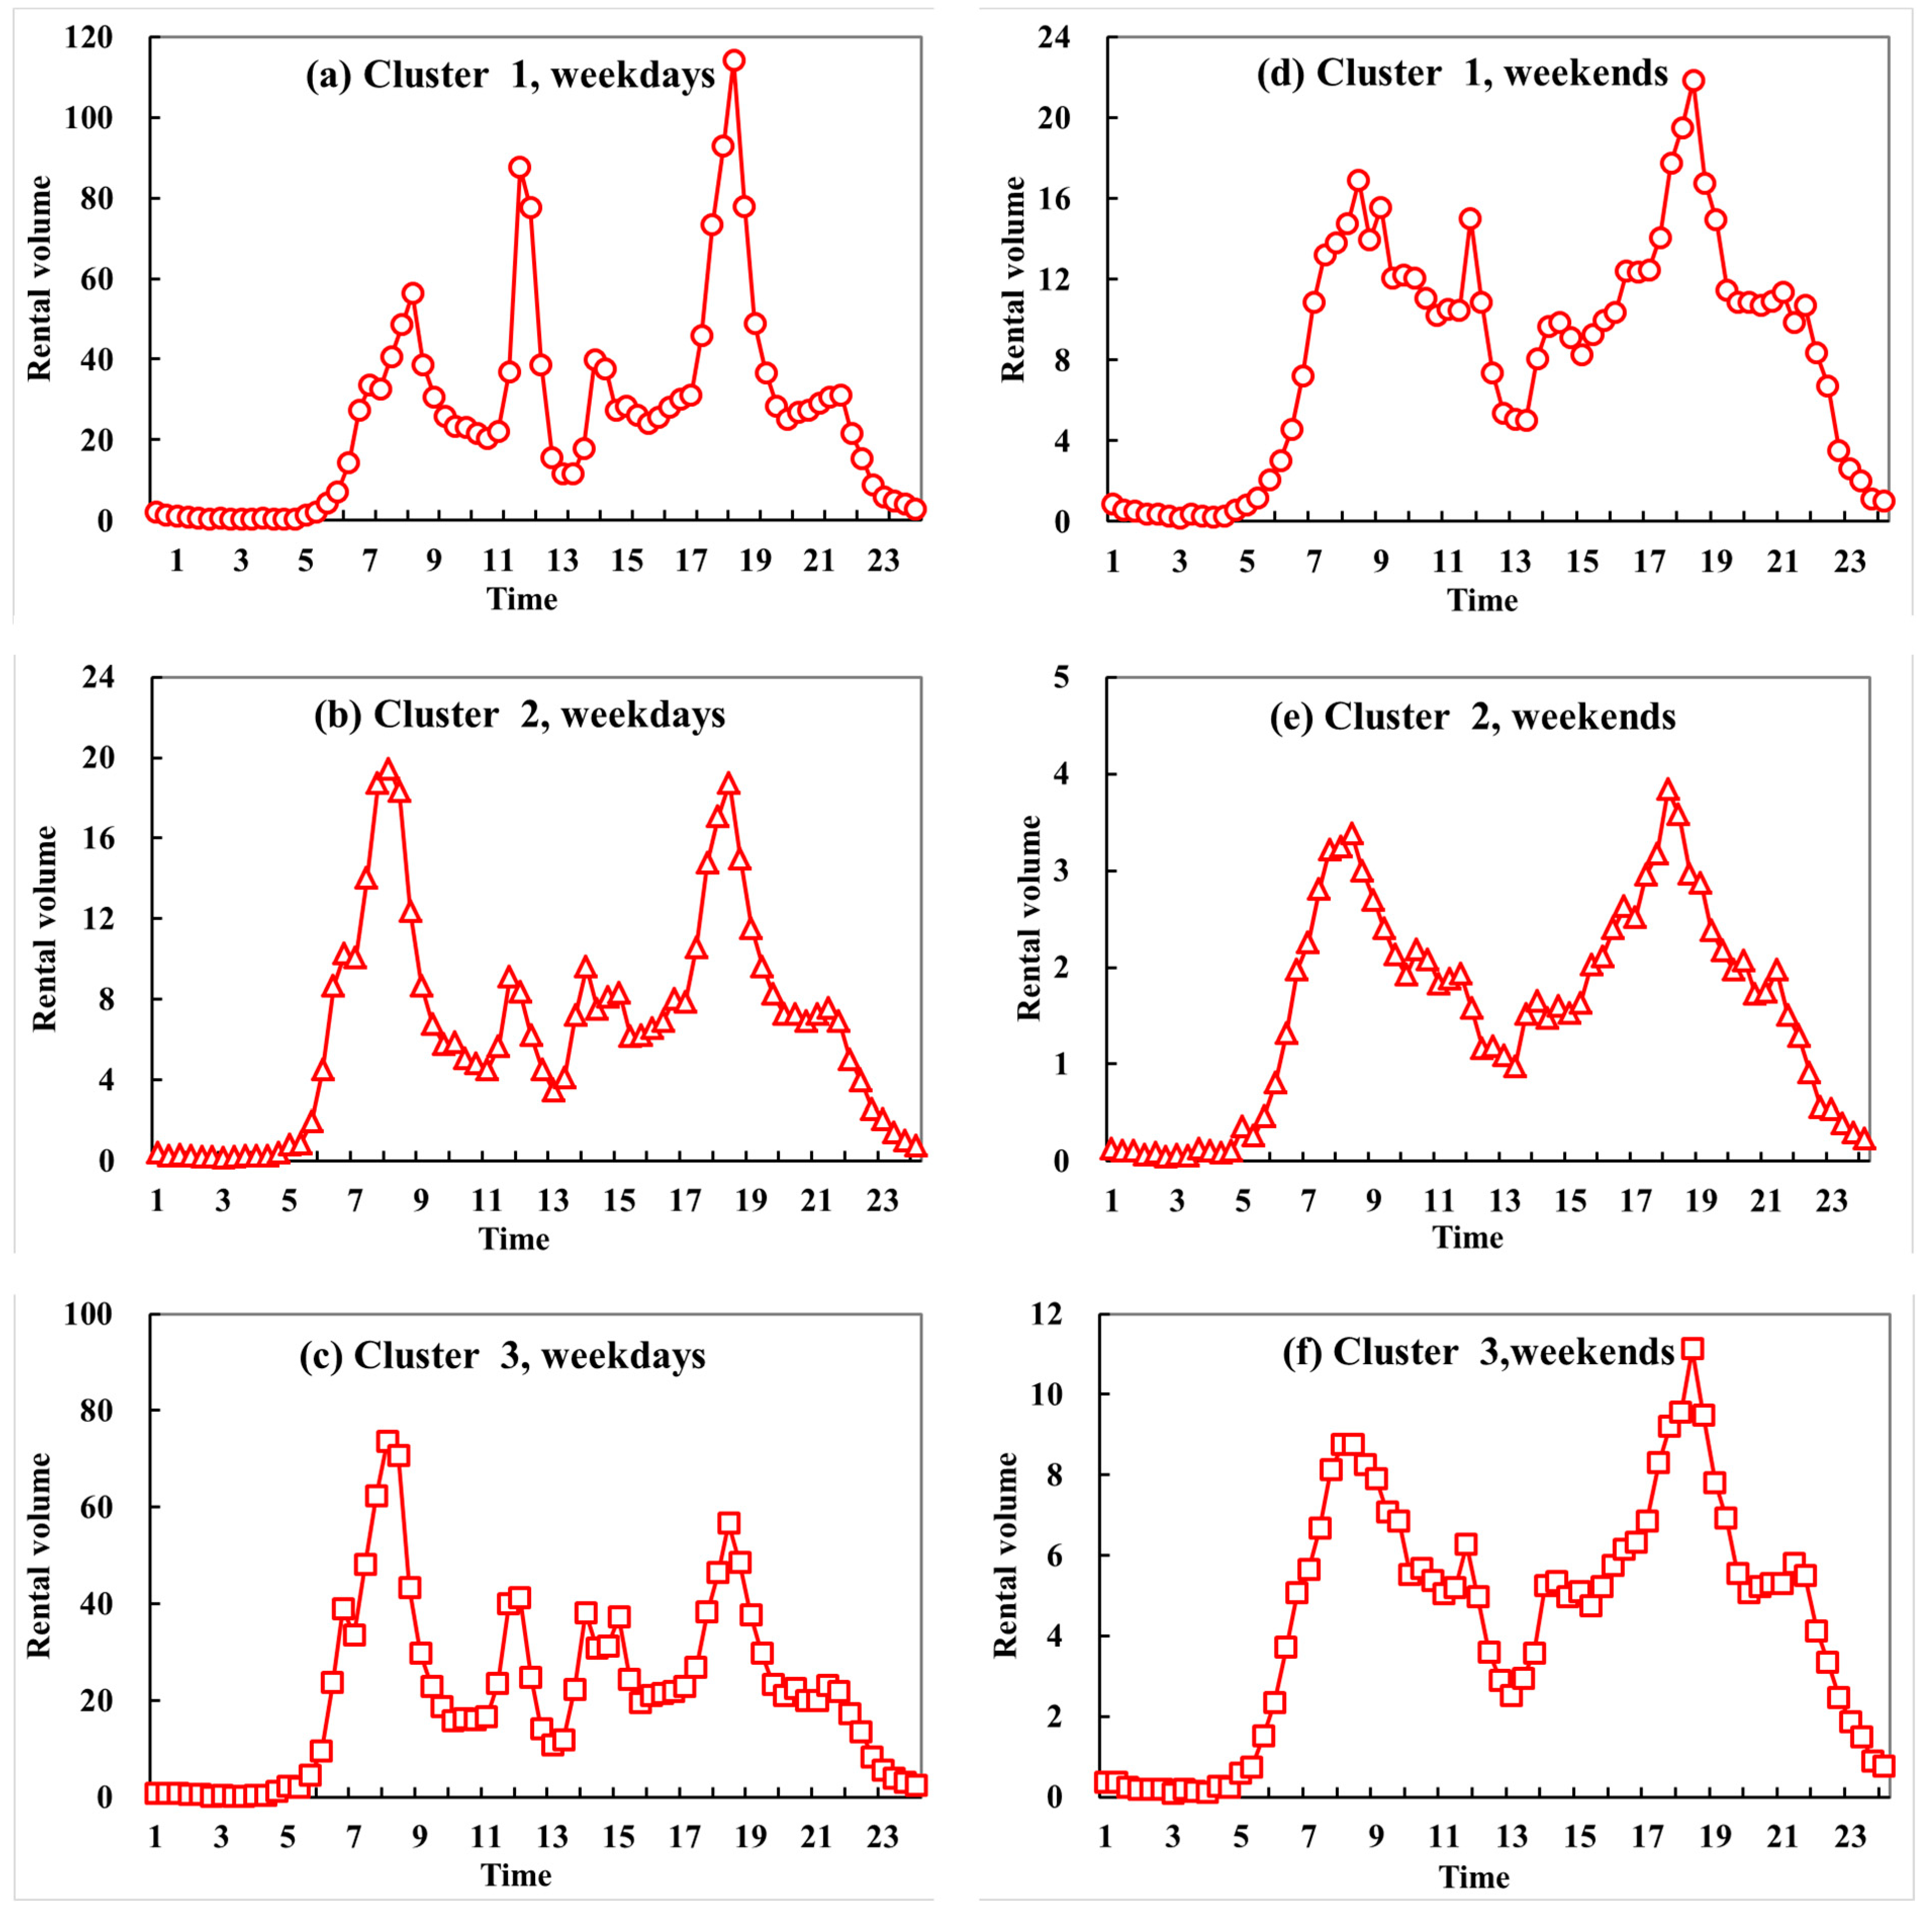
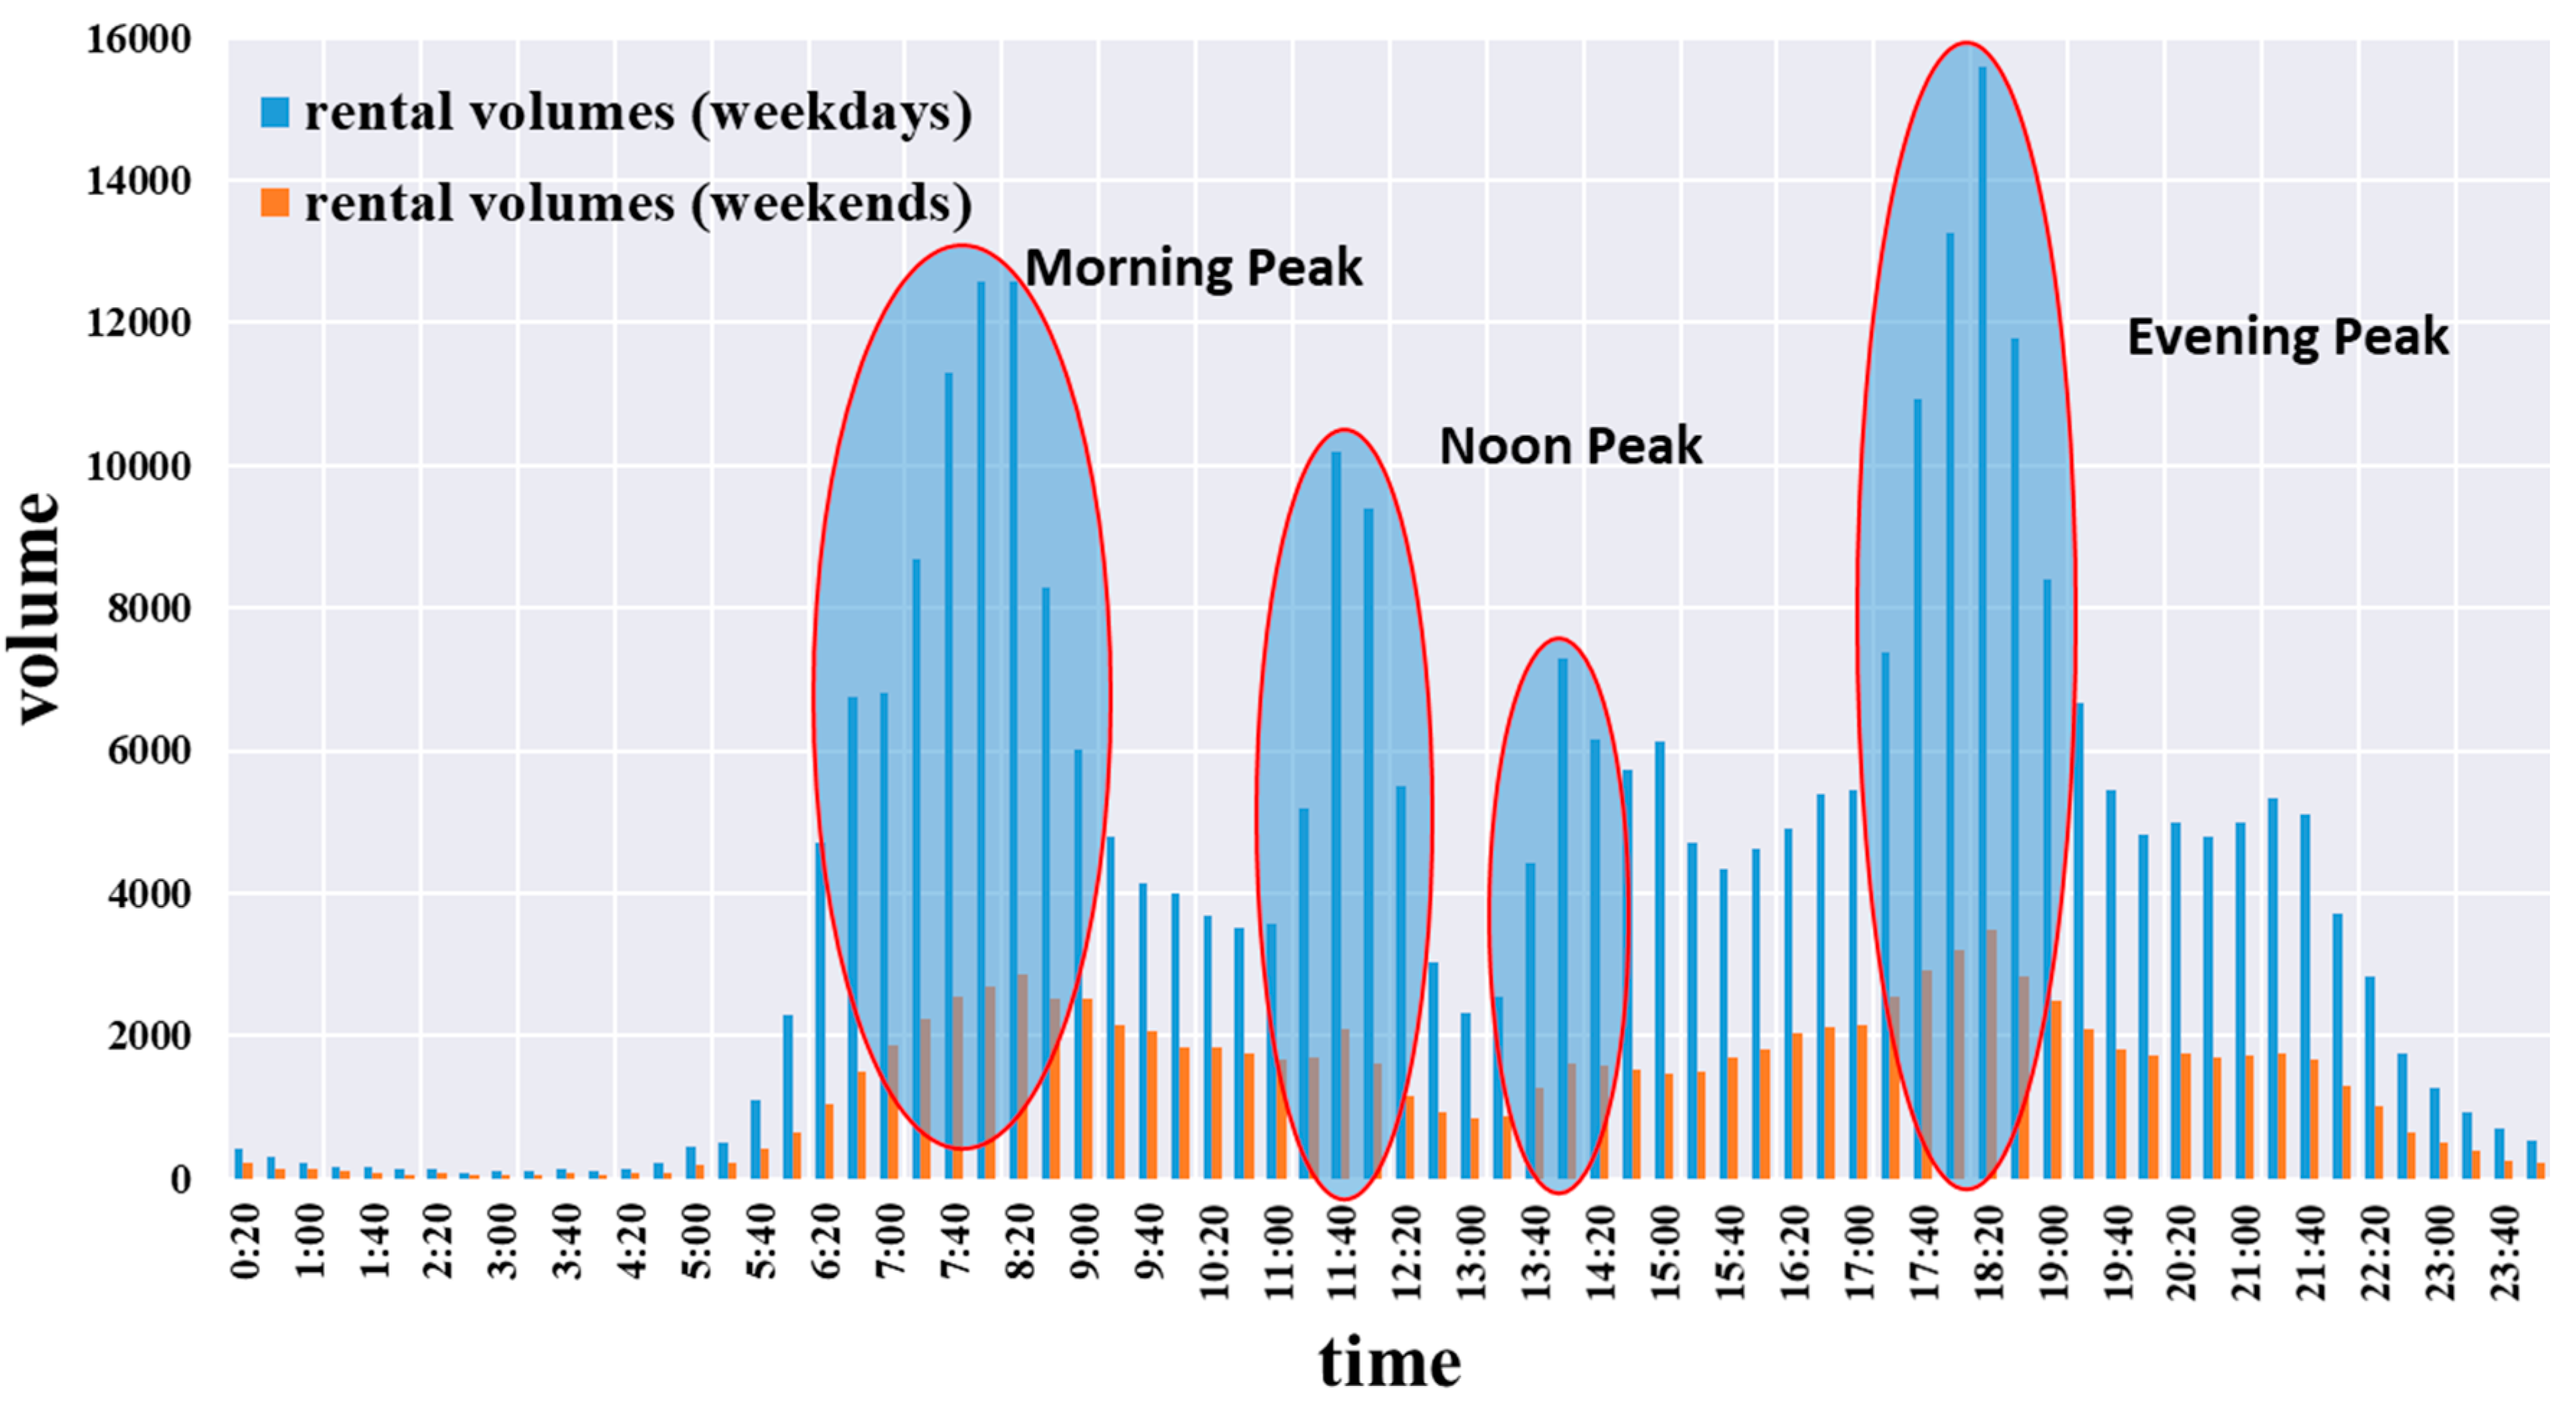
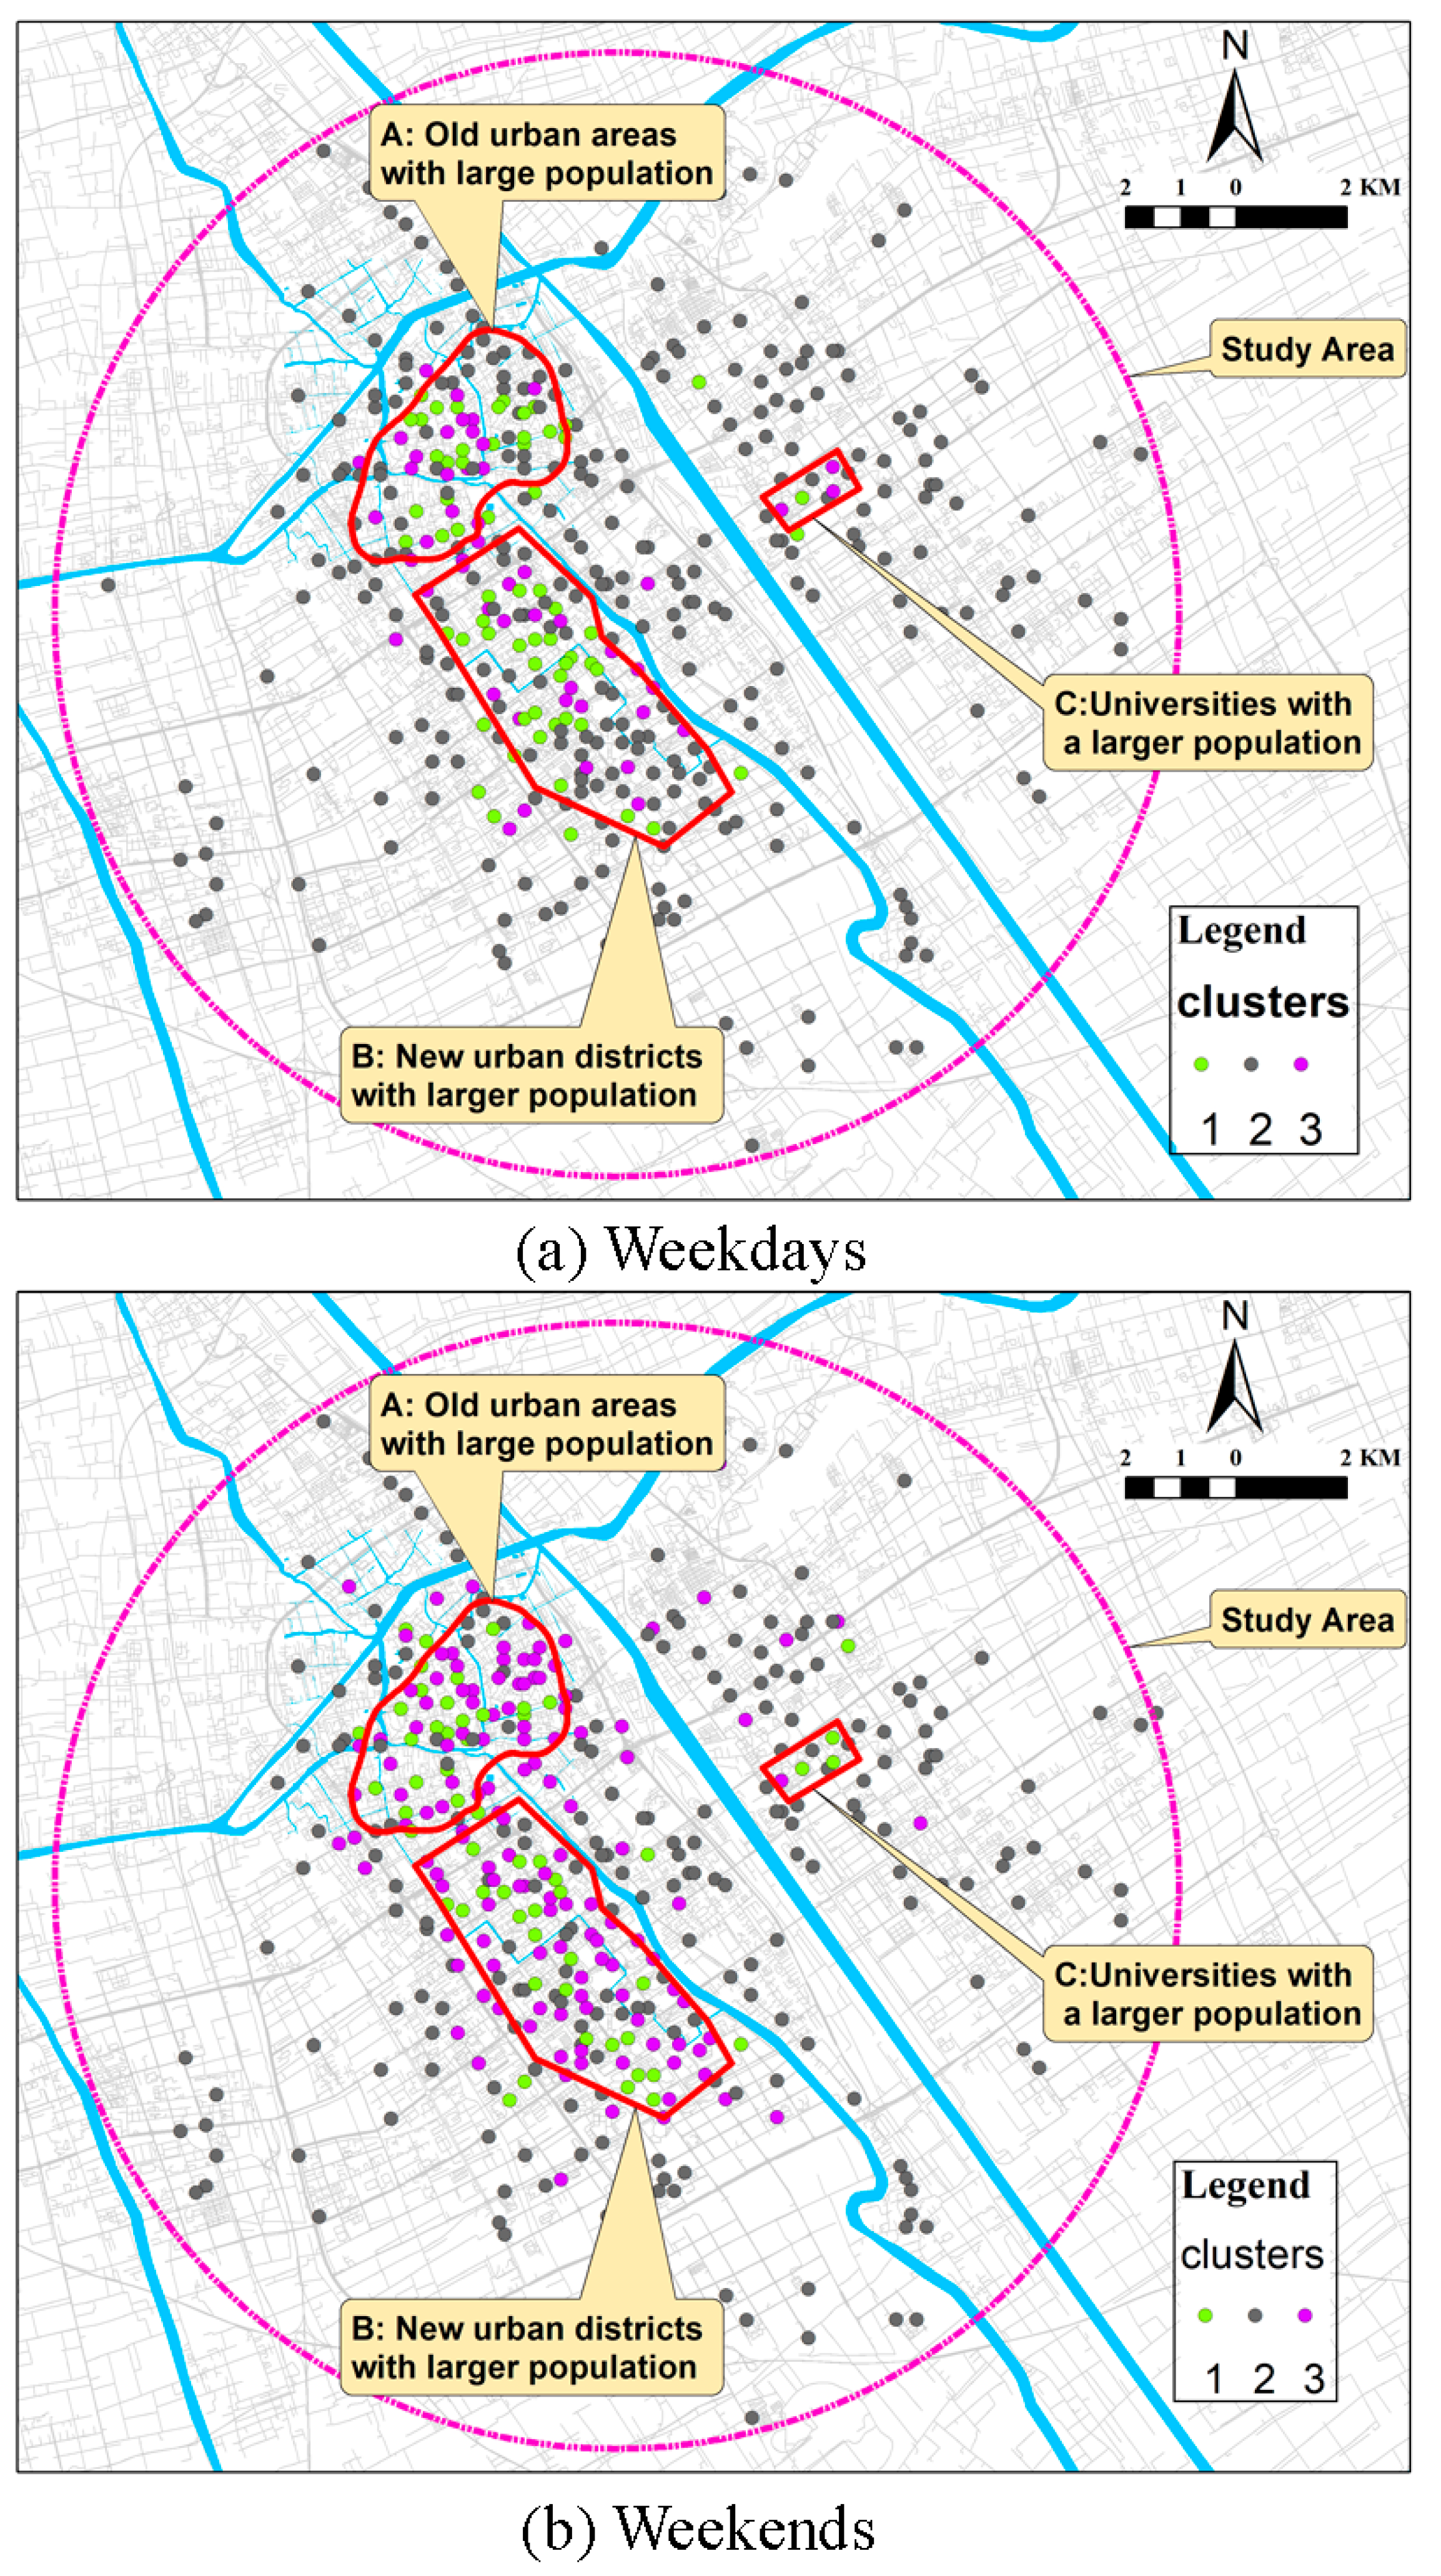
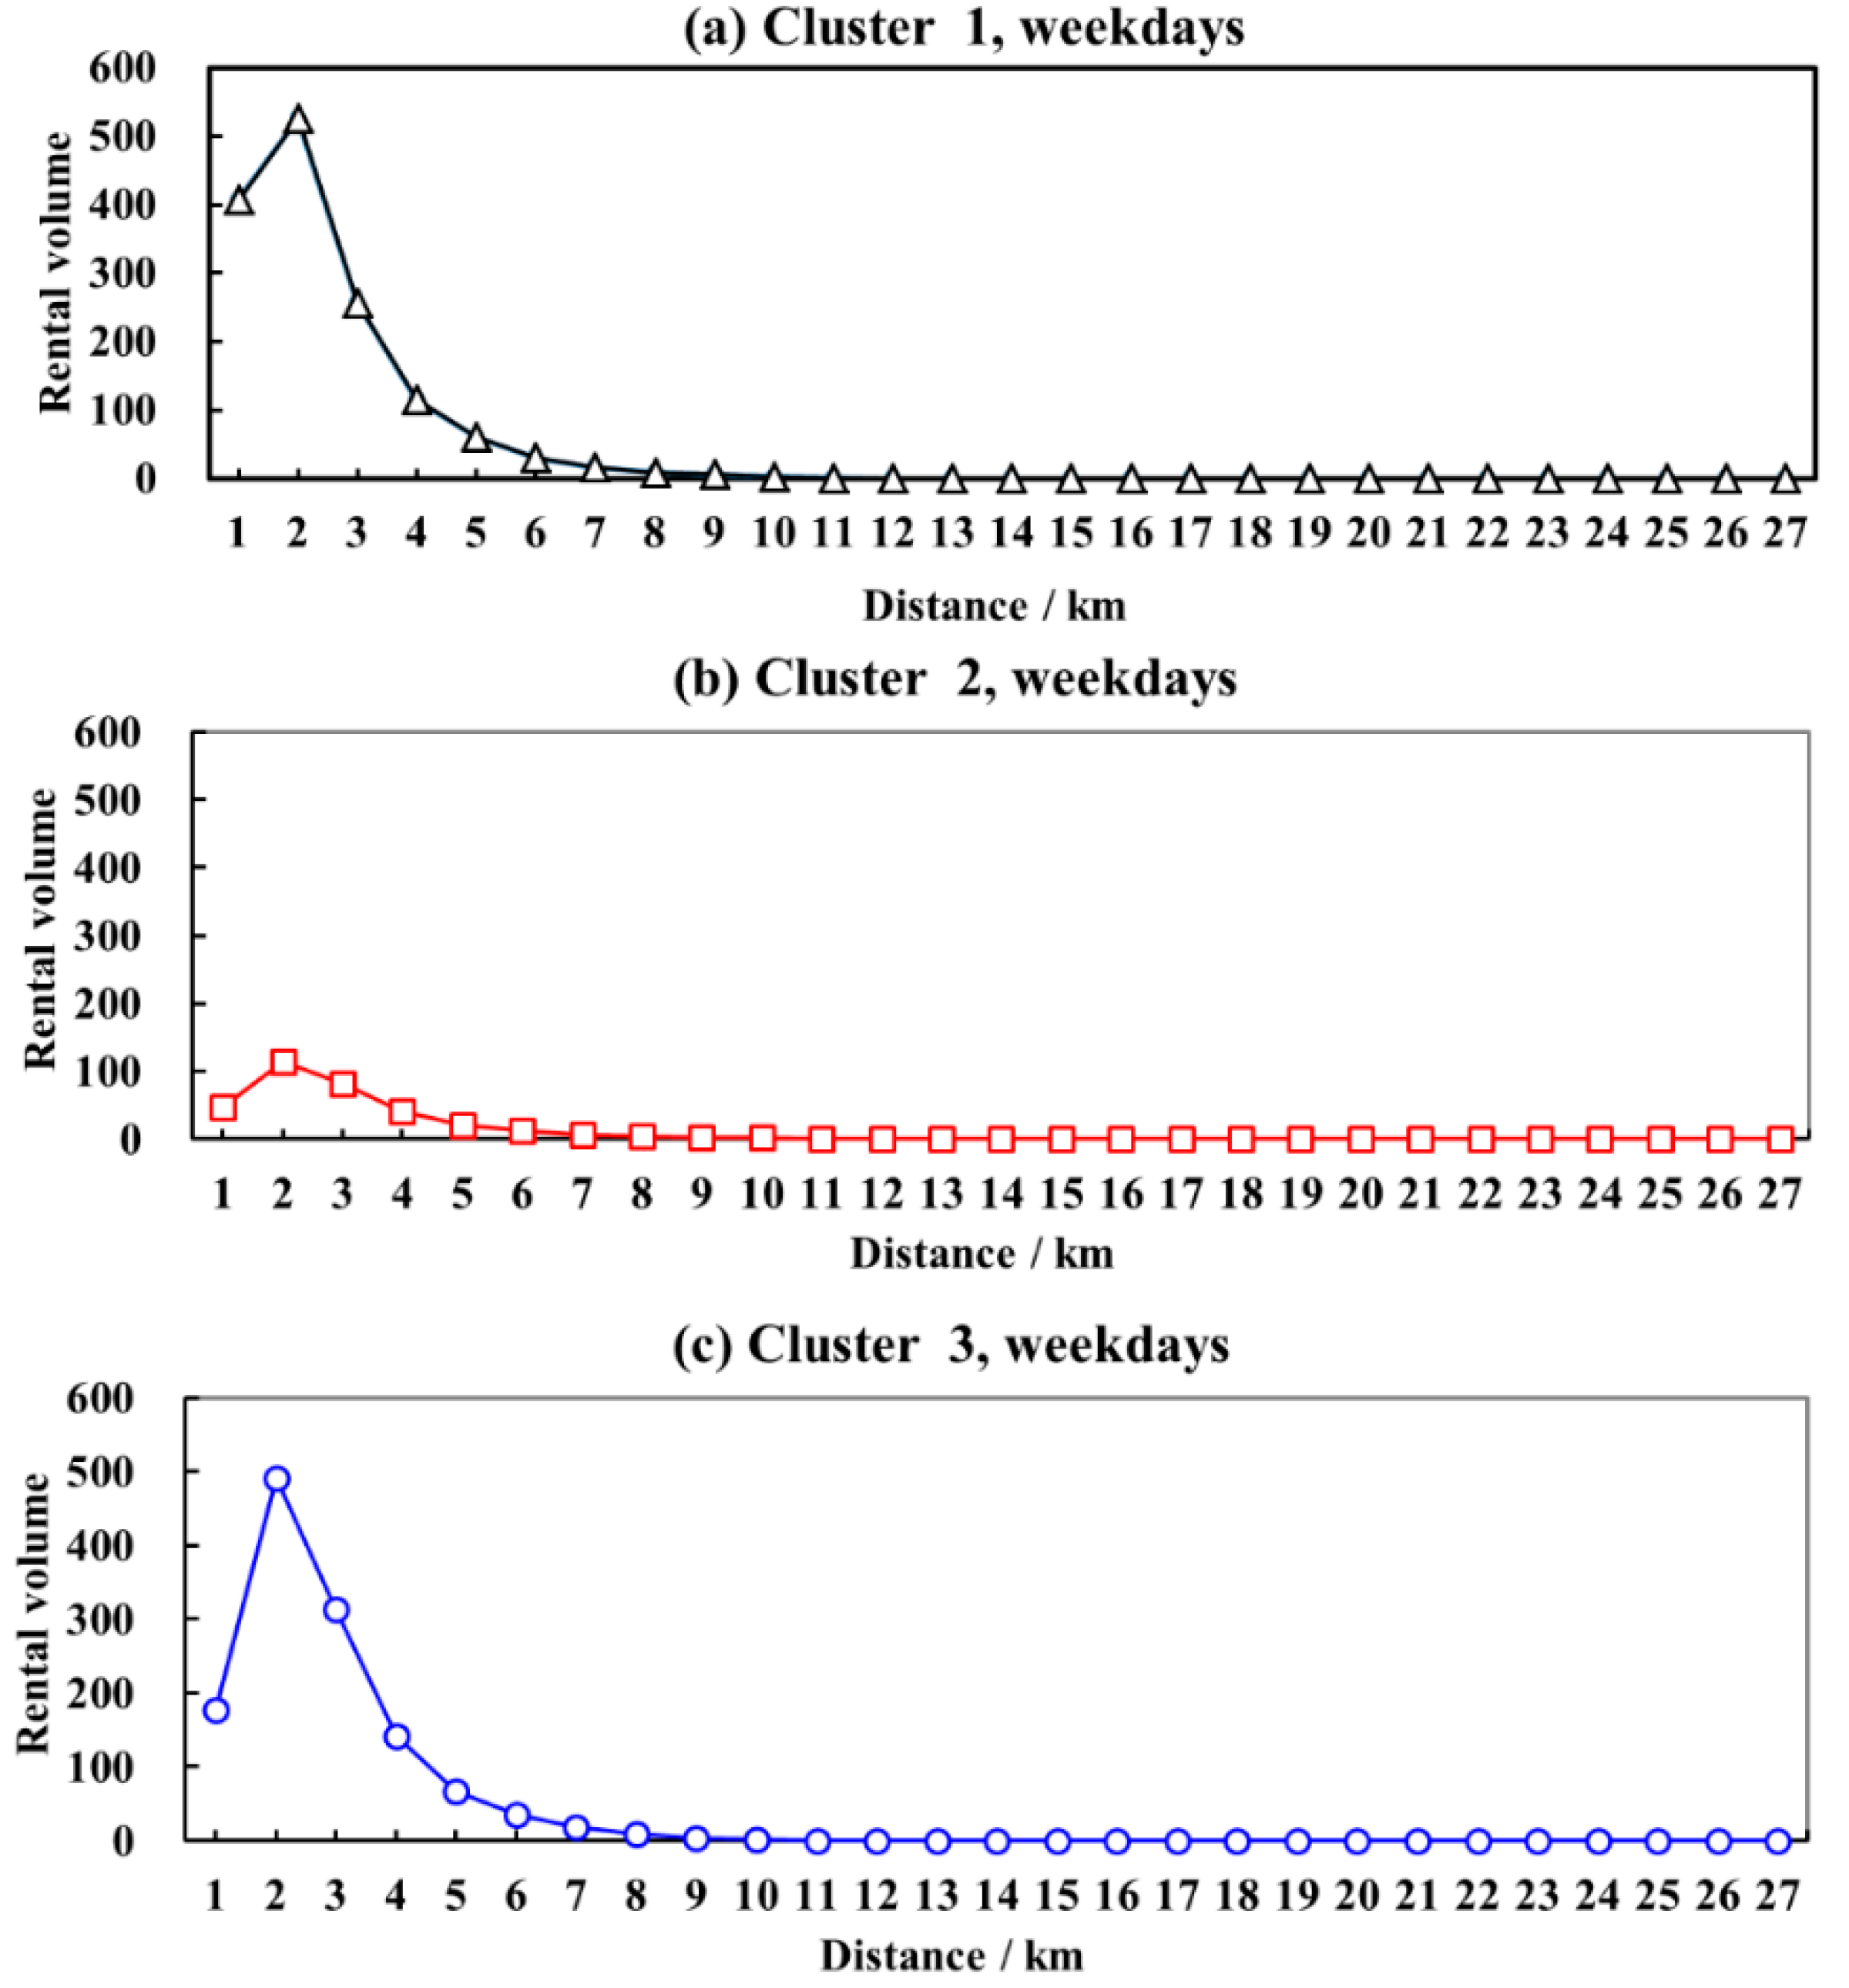
3.1.2. The Features of Clusters on Weekdays and Weekends

Figure 5 illustrates two peak rental periods—one at about 8:00 a.m. and the other at about 6:00 p.m.—on weekdays and weekends, respectively. Another salient feature of the cluster results is that Cluster 1 (Figure 4, top left) had the largest rental volume. We also found two secondary peak periods at about 12:00 noon and 2:00 p.m. on weekdays that were not present on weekends. Furthermore, as shown in Figure 6, three peak periods named “Morning Peak”, “Noon Peak”, and “Evening Peak” are identified. They are also reflected in most of the clusters in Figure 5. Thus, the three peak periods are the common phenomenon of using public bicycles in our study, and this can help us further explain the cluster results more easily. Additionally, most of the public bicycle stations generated an obvious rental volume at about 9:00 p.m.
Other subtle differences were observed among the clusters. First, the stations in Clusters 1 and 3 had much larger rental volumes on weekdays and weekends than the stations in Cluster 2. This finding suggests large differences in the frequencies of use across the clusters, which means that more detailed planning of the stations’ spatial distribution is needed. Second, the weekday usage deserved a focused analysis, and we found that the rental volume of Cluster 1 during the Evening Peak was larger than its volume during the Morning Peak. However, the rental volume of Cluster 3 during the Morning Peak was larger than that of during the Evening Peak. Further, the stations in Cluster 1 had a higher rental volume than the other two clusters had during the Noon Peak. Third, we found that the stations in Cluster 1—but not those in Clusters 2 and 3—maintained relatively high rental volumes throughout the mornings on weekend days.
In fact, from the perspective of spatiotemporal activities, the cluster results evoke some very interesting questions. For example, why are the rental volumes of those three clusters different? Why are there differences between the rental volumes during Morning Peak and Evening Peak in Clusters 1 and 3? Why does Cluster 1 have a relatively sustained peak period of public bicycle rentals on weekend mornings? These questions are addressed in Section 3.2 based on the enrichment factor and proportional factor results.

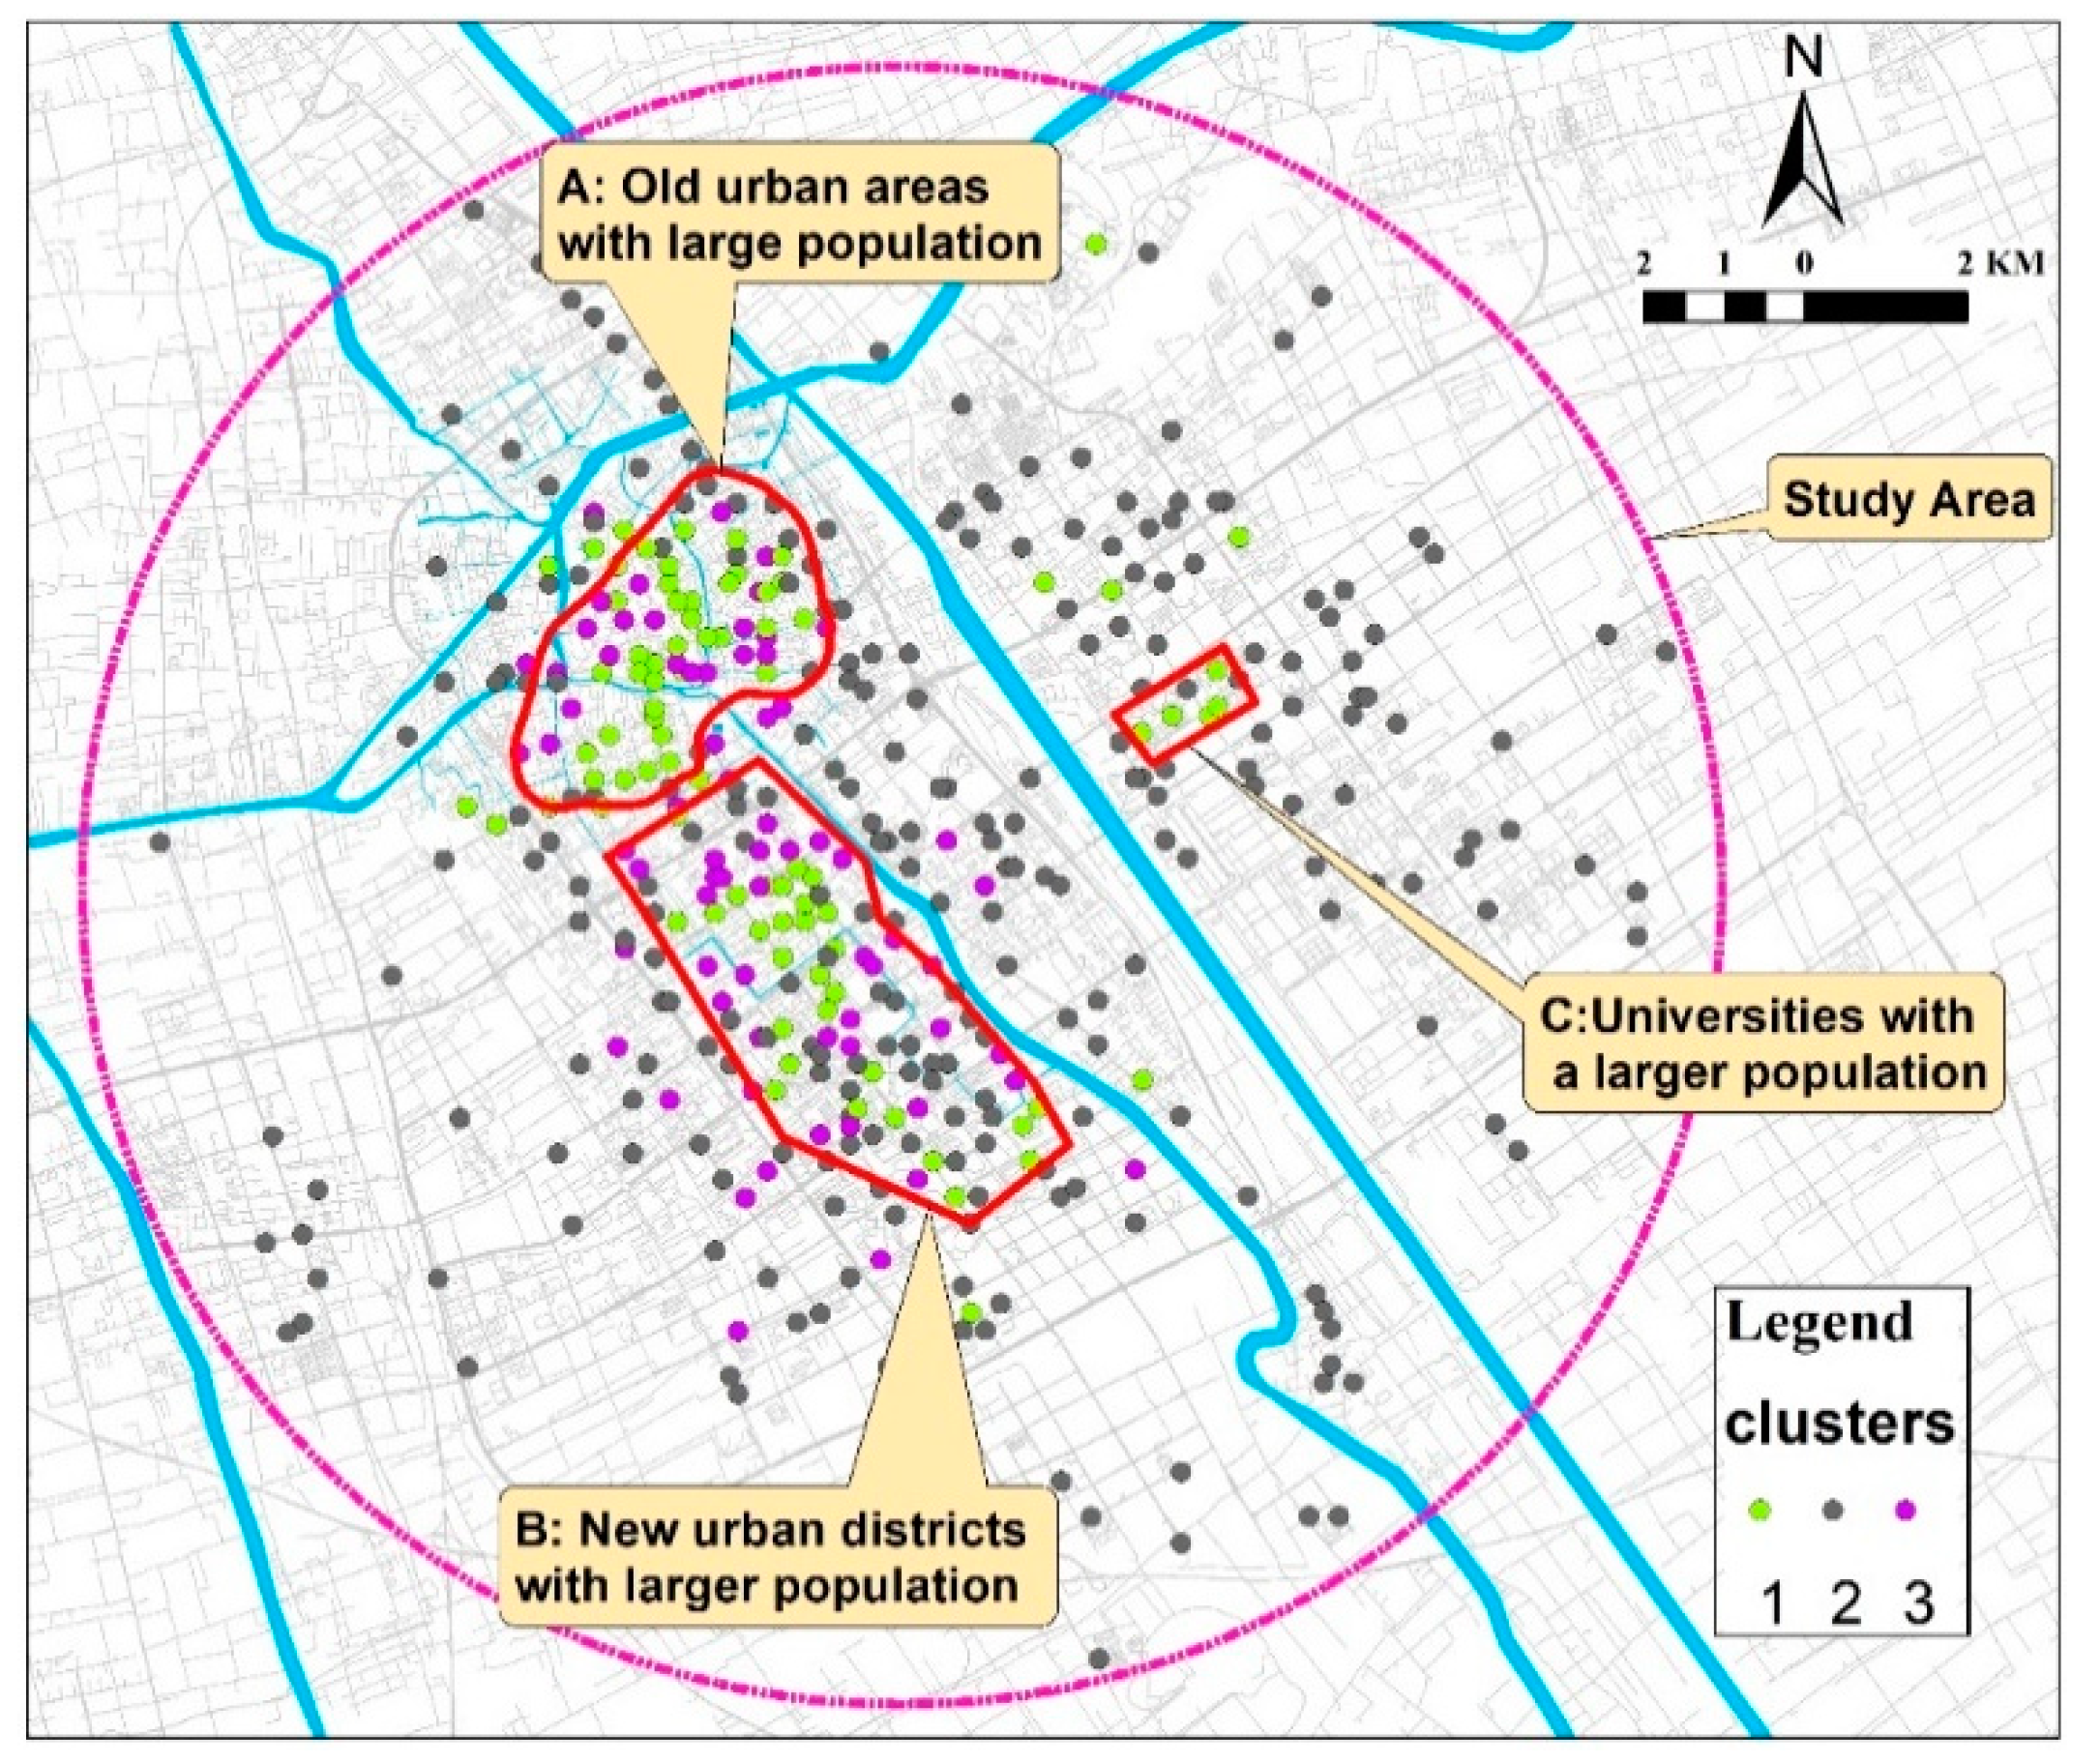
3.2. The Formation Mechanisms of Different Clusters

First, we focused on the rental volume of the public bicycle stations on weekdays. Figure 7a shows the proportional factors of the POI types. Cluster 1 ranked first with regard to the major shopping, catering service, and industrial park types [30]. In contrast, Clusters 2 and 3 exhibited obvious gaps, which indicated that, if there had been more commercial facilities near those public bicycle stations, their rental volumes might have been higher on weekdays. Clusters 1 and 3 had higher proportional factors for the middle school, residence, entertainment venue, and major hospital POI types, and Cluster 2 had higher proportional factors regarding industrial park and long-distance transit station POI types, which were distributed in urban fringe areas (Figure 8a) where it is difficult to generate cycling demand. The Cluster 1 and Cluster 3 stations were mostly located in urban centers or areas adjacent to urban centers (Figure 8) where cycling demand is relatively more likely to occur. Overall, the distribution of the proportional factor values and the locations of the public bicycle stations reasonably explained the rental volume differences among the three clusters.
Figure 7b shows the enrichment factors of the POI types. Cluster 1 had higher enrichment factors with regard to major shopping, industrial park, college, catering service, and middle school types, where peak rental volumes are almost impossible during the morning because bicycles are most likely to be returned in commercial areas in the morning. As shown in Figure 8a, the public bicycle stations in Cluster 1 were mostly in urban centers, which mostly are comprised of commercial facilities and little housing. Thus, in Cluster 1, the rental volume easily formed a Noon Peak and an Evening Peak when workers tended to leave the facilities [31,32]. Fewer people leave at noon than in the evening. Cluster 3 had higher enrichment factors regarding residence and entertainment venue POI types because of its larger proportion of residences and smaller proportion of commercial facilities. Therefore, Cluster 3 experienced much more demand for public bicycle rentals during the morning, and the rental volume easily formed a Morning Peak.
To explain the weekend phenomena, Figure 9a shows that Cluster 1 had higher proportional factors than Clusters 2 or 3 with regard to major shopping, major hospital, and catering service POI types. Cluster 1 also had higher enrichment factors, which were very distinct for the major shopping, major hospital, and catering service POI types (Figure 9b). Generally, people might be more likely to rent public bicycles on weekend mornings from stations in Cluster 1, which are mostly located in urban centers (see Figure 8b), for shopping or similar activities. Thus, a longer-lasting peak in public bicycle rentals occurred in Cluster 1 on weekend mornings.
Third, based on these results, it was concluded that efficient uses of the public bicycle stations were closely related to the temporal aspects of people’s activities, the stations’ locations, the geographic characteristics near the stations, and the proportional distributions of different types of land uses. Therefore, the layout and management of public bicycle stations should fully consider the importance of these factors.

3.3. The Extension of Cluster Analysis Using the DTW Method to Analyze Non-Time Series Data

The results of the extended analysis based on the explanation in Section 3.3 are shown in Figure 10. The Silhouette Coefficient value obviously decreased at three clusters, and the Calinski-Harabasz Index value steeply decreased at four clusters. Thus, we concluded that three clusters would produce the best clustering results using the extended DTW method.
There were strong similarities between the three clusters (Figure 11). Generally, most public bicycle use is short-distance activities according to previous studies [6,33]. In our study, all the clusters generated in most rentals were happened within a one to two km radius of the stations, after which the rental volume was gradually declined. Furthermore, we also found some differences between the three clusters. First, Figure 12 shows that Cluster 1 had higher proportional factors and enrichment factors than Clusters 2 and 3 for most of the POI types, particularly industrial park, major shopping, and catering service, which generate high-frequency and short-distance transportation demands relatively easily. The public bicycle stations in Cluster 1 were in the city centers or busy business areas (Figure 13). Consequently, many short-distance trips within about one km of the stations occurred in Cluster 1. Cluster 2 had a higher proportional factor and a higher enrichment factor only with regard to industrial park and long-distance transit station POI types, which are mostly distributed in the periphery (Figure 13). Thus, the Cluster 2 stations were used much less often. Finally, Cluster 3 had a higher proportional factor and a higher enrichment factor for most POI types, particularly major hospitals. However, some gaps were observed compared to Cluster 1, thus indicating that Cluster 3 had some—but not particularly high—rental volume.
The contrasts shown in Figure 12 and Figure 13 are meaningful and useful for enhancing researchers’ abilities to understand the spatial structure of Yancheng City. On the one hand, public bicycle stations with relatively frequent short-distance trips were more likely to be in the central city areas. As the frequency of short-distance trips decreased, the stations’ likelihood of being in the fringes increased. Therefore, to improve the efficiency of the public bicycle system, cities should ensure logical spatial distances among the stations throughout the city, although that might increase management tasks.

4. Discussion

Our computation results could provide some useful policy recommendations. First, according to the travel characteristics of public bicycles (based on the perspective of time and space), we can propose some refined measures for urban managers. For example, only stations in in urban centers tended to develop sustained peak public bicycle rental periods on weekend mornings. Thus, on weekends, in the city center, it is necessary to pay continuous attention to public bicycle stations with high utilization rates and also focus on ensuring the number of borrowed bicycles of these public bicycles. Second, by using the enrichment factor and the proportional factor based on POI data, it was demonstrated that the land-use structures around the stations were a good way to explain the classification results. Thus, when planning layouts of public bicycle stations, urban planners should first assess the land-use structural characteristics of the target areas, then decide where to place public bicycle stations, and lastly determine the number of public bicycles appropriate to each station. Finally, the classification results revealed that many public bicycle stations with low usage efficiency were located in the city’s fringe areas. Thus, we recommend the bicycle-sharing model for these areas because it allows people to simply leave the bicycles on the street when they have finished using them. City centers should continue to require that public bicycles be returned to public stations to prevent problems related to disorderly bicycle parking and abandonment.
In addition, regarding previous research on China’s public bicycle system, this study makes the following contributions. First, Yancheng is a typical case for exploring the characteristics of public bicycle system for mid-to-large sized cities (but not megacities) in China. Moreover, its data were sufficient to allow us to study the features of the public bicycle system based on the DTW distance-based k-medoids method and the public bicycle card data. Second, this study extended the application of the DTW distance-based k-medoids method to analyze non-time series data, which is very important for exploring phenomena that are difficult to observe. Third, based on the classification results, we discussed concrete ways to improve the rational planning of public bicycle stations in China’s cities; this demonstrates the study’s important practical significance. Finally, although our analysis involved a relatively small sample of China’s public bicycle system data, it could be extended to larger spatial and temporal scales regarding trip patterns, which are vital to the promotion of green transportation in megacities around the world.

5. Conclusions

This study applied a dynamic time warping (DTW) distance-based k-medoids method for classifying public bicycle stations in Yancheng, a third-tier city in China. Several novel findings and proposals emerged from this analysis. First, the DTW distance-based k-medoids method was successfully used for classifying stations based on public bicycle card data. The results indicated three clusters of stations with different spatiotemporal operational characteristics on weekdays and weekends. Second, analysis using the extended DTW method also found three clusters of stations. Third, based on POI data, the classification results were validated by using the enrichment factor and the proportional factor. Finally, this study proved that public bicycle stations have various functions that are embodied in the structure of urban functional zoning, a city’s spatial layout, land-use types, residents’ spatial and temporal activities, and other aspects of urban life. In particular, this meaningful way of classifying public bicycle stations might help us to fully understand a city’s urban functional zoning.
Some aspects of this study require further research attention in order to enhance our findings and clarify the results. First, this analysis involved one typical city, and it is thus difficult to generalize and broadly extrapolate its results. Therefore, more sample cities from different socioeconomic contexts are necessary for future research. Second, we found that the spatial distribution of stations had an important effect on the station clustering result; however, it also may have been influenced by population distribution, traffic organization, weather conditions [34], commuting by bicycle [35], and/or other factors that we did not consider in the analysis. Finally, analyzing data with a longer timeframe would help to validate this study’s results and conclusions. The study’s merits, limitations, and caveats should be considered in future studies of China’s public bicycle system.

Author Contributions

Conceptualization, S.W.; Data curation, S.W. and Z.G.; Formal analysis, Z.G.; Methodology, Z.G and S.W.; Visualization, S.W.; Writing—original draft, S.W., L.W. and S.F.; Writing—review & editing, L.W. All authors have read and agreed to the published version of the manuscript.

Funding

This study is supported by the National Natural Science Foundation of China (41801107 and 41601169).

Conflicts of Interest

No potential conflict of interest was reported by the authors.

References

  1. Tomasz, B.; Agnieszka, K.; Agnieszka, W. Bike-sharing systems in Poland. Sustainability 2019, 11, 2458. [Google Scholar] [CrossRef] [Green Version]
  2. Pucher, J.; Garrard, J.; Greaves, S. Cycling down under: A comparative analysis of bicycling trends and policies in Sydney and Melbourne. J. Transp. Geogr. 2011, 19, 332–345. [Google Scholar] [CrossRef]
  3. Pendakur, V.S. Bicycles in China: Past and Future. Proceedings of Transportation Research Board Annual Meeting, Washington, DC, USA, 22–26 January 2006. [Google Scholar]
  4. Tight, M.; Timms, P.; Banister, D.; Bowmaker, J.; Copas, J.; Day, A.; Drinkwater, D.; Givoni, M.; Gühnemann, A.; Lawler, M.; et al. Visions for a walking and cycling focussed urban transport system. J. Transp. Geogr. 2011, 19, 1580–1589. [Google Scholar] [CrossRef]
  5. Duran, A.C.; Anaya-Boig, E.; Shake, J.D.; Garcia, L.M.T.; Rezende, L.D.; Hérick de Sá, T. Bicycle-sharing system socio-spatial inequalities in Brazil. J. Transp. Health 2018, 8, 262–270. [Google Scholar] [CrossRef]
  6. Wei, S.; Xu, J.; Ma, H. Exploring public bicycle network structure based on complex network theory and shortest path analysis: The public bicycle system in Yixing, China. Transp. Plan. Technol. 2019, 42, 293–307. [Google Scholar] [CrossRef]
  7. O’Brien, O.; Cheshire, J.; Batty, M. Mining bicycle sharing data for generating insights into sustainable transport systems. J. Transp. Geogr. 2014, 34, 262–273. [Google Scholar] [CrossRef]
  8. Chang, X.; Shen, J.; Lu, X.; Huang, S. Statistical patterns of human mobility in emerging Bicycle Sharing Systems. PLoS ONE 2018, 13, e0193795. [Google Scholar] [CrossRef] [Green Version]
  9. Loaiza Monsalve, D.; Pérez Riascos, A. Human mobility in bike-sharing systems: Structure of local and non-local dynamics. PLoS ONE 2019, 14, e0213106. [Google Scholar] [CrossRef]
  10. Liu, B.; Cao, J.; Zhou, Y.; Zhang, H. A Study on the temporal-spatial features of bicycle-sharing activities: A case of Hangzhou. Urban Plan. Forum 2016, 3, 77–84. [Google Scholar]
  11. Faghih-Imani, A.; Eluru, N.; El-Geneidy, A.; Rabbat, M.; Haq, U. How land-use and urban form impact bicycle flows: Evidence from the bicycle-sharing system (BIXI) in Montreal. J. Transp. Geogr. 2014, 41, 306–314. [Google Scholar] [CrossRef]
  12. Zhang, Y.; Thomas, T.; Brussel, M.; Maarseveen, M.F.A.M. Exploring the impact of built environment factors on the use of public bikes at bike stations: Case study in Zhongshan, China. J. Transp. Geogr. 2017, 58, 59–70. [Google Scholar] [CrossRef]
  13. Borgnat, P.; Robardet, C.; Rouquier, J.B.; Abry, P.; Flandrin, P.; Fleury, E. Shared Bicycles in a city: A Signal processing and data analysis perspective. Adv. Complex Syst. 2011, 14, 415–438. [Google Scholar] [CrossRef] [Green Version]
  14. Austwick, M.; Obrien, O.; Strano, E.; Viana, M. The structure of spatial networks and communities in bicycle sharing systems. PLoS ONE 2013, 8, e74685. [Google Scholar]
  15. Lathia, N.; Ahmed, S.; Capra, L. Measuring the impact of opening the London shared bicycle scheme to casual users. Transp. Res. Part C Emerg. Technol. 2012, 22, 88–102. [Google Scholar] [CrossRef]
  16. Yin, Q.; Meng, B.; Zhang, L. Classification of subway stations in Beijing based on passenger flow characteristics. Prog. Geogr. 2016, 35, 126–134. [Google Scholar]
  17. Chen, Y.; Liu, X.; Li, X.; Liu, X.; Yao, Y.; Hu, G.; Xu, X.; Pei, F. Delineating urban functional areas with building-level social media data: A dynamic time warping (DTW) distance based k-medoids method. Landsc. Urban Plan. 2017, 160, 48–60. [Google Scholar] [CrossRef]
  18. Xu, D.; Bian, Y.; Rong, J.; Wang, J.; Yin, B. Study on clustering of free-floating bike-sharing parking time series in beijing subway stations. Sustainability 2019, 11, 5439. [Google Scholar] [CrossRef] [Green Version]
  19. Sarkar, A.; Lathia, N.; Mascolo, C. Comparing cities’ cycling patterns using online shared bicycle maps. Transportation 2015, 42, 541–559. [Google Scholar] [CrossRef]
  20. Chabchoub, Y.; Fricker, C. Classification of the vélib stations using Kmeans, Dynamic Time Wraping and DBA averaging method. In Proceedings of the 2014 International Workshop on Computational Intelligence for Multimedia Understanding, IWCIM 2014, Paris, France, 1–2 November 2014. [Google Scholar]
  21. Wu, J.; Wang, L.; Li, W. Usage patterns and impact factors of public bicycle systems: Comparison between city center and suburban district in Shenzhen. J. Urban Plan.Dev. 2018, 144, 04018027. [Google Scholar] [CrossRef]
  22. Jiang, S.; Alves, A.; Rodrigues, F.; Ferreira, J.; Pereira, F. Mining point-of-interest data from social networks for urban land use classification and disaggregation. Comput. Environ. Urban Syst. 2015, 35, 36–46. [Google Scholar] [CrossRef] [Green Version]
  23. Yuan, J.; Zheng, Y.; Xie, X. Discovering regions of different functions in a city using human mobility and POIs. In Proceedings of the ACM SIGKDD International Conference on Knowledge Discovery and Data Mining, Beijing, China, 12–16 August 2012; Association for Computing Machinery: New York, NY, USA, 2012. [Google Scholar]
  24. Rakthanmanon, T.; Campana, B.; Mueen, A.; Batista, G.; Westover, M.B.; Zhu, Q.; Zakaria, J.; Keogh, E. Addressing big data time series: Mining trillions of time series subsequences under dynamic time warping. ACM Trans. Knowl. Discov. Data 2013, 7. [Google Scholar] [CrossRef] [Green Version]
  25. Keogh, E.; Ratanamahatana, C.A. Exact indexing of dynamic time warping. Knowl. Inf. Syst. 2005, 7, 358–386. [Google Scholar] [CrossRef]
  26. Kate, R.J. Using dynamic time warping distances as features for improved time series classification. Data Min. Knowl. Discov. 2016, 30, 283–312. [Google Scholar] [CrossRef]
  27. Park, H.S.; Jun, C.H. A simple and fast algorithm for K-medoids clustering. Expert Syst. Appl. 2009, 36, 3336–3341. [Google Scholar] [CrossRef]
  28. Caliński, T.; Ja, H. A dendrite method for cluster analysis. Commun. Stat. Theory Methods 1974, 3, 1–27. [Google Scholar] [CrossRef]
  29. Verburg, P.; Nijs, T.; Ritsema van Eck, J.; Visser, H.; de Jong, K. A method to analyse neighbourhood characteristics of land use patterns. Comput. Environ. Urban Syst. 2004, 28, 667–690. [Google Scholar] [CrossRef]
  30. Campbell, A.; Cherry, C.; Ryerson, M.; Yang, X. Factors influencing the choice of shared bicycles and shared electric bikes in Beijing. Transp. Res. Part C Emerg. Technol. 2016, 67, 399–414. [Google Scholar] [CrossRef] [Green Version]
  31. Bachand-Marleau, J.; Lee, B.; El-Geneidy, A. Better understanding of factors influencing likelihood of using shared bicycle systems and frequency of use. Transp. Res. Rec. J. Transp. Res. Board 2012, 2314, 66–71. [Google Scholar] [CrossRef] [Green Version]
  32. Pfrommer, J.; Warrington, J.; Schildbach, G.; Morari, M. Dynamic vehicle redistribution and online price incentives in shared mobility systems. IEEE Trans. Intell. Transp. Syst. 2013, 15, 1567–1578. [Google Scholar] [CrossRef] [Green Version]
  33. Zhang, Y.; Thomas, T.; Brussel, M.J.G.; van Maarseveen, M.F.A.M. Expanding Bicycle-sharing systems: Lessons learnt from an analysis of usage. PLoS ONE 2016, 11, e0168604. [Google Scholar] [CrossRef]
  34. Gebhart, K.; Noland, R.B. The impact of weather conditions on bikeshare trips in Washington, DC. Transportation 2014, 41, 1205–1225. [Google Scholar] [CrossRef]
  35. Heinen, E.; van Wee, B.; Maat, K. Commuting by bicycle: An overview of the literature. Transp. Rev. 2010, 30, 59–96. [Google Scholar] [CrossRef]
Figure 1. Maps of Yancheng that indicate locations of its 420 public bicycle stations.
Sustainability 12 06370 g001
Figure 2. Diagram of the overall methodological framework.
Sustainability 12 06370 g002
Figure 3. Illustration of DTW method for non-time series data analysis process.
Sustainability 12 06370 g003
Figure 4. Variation in the Silhouette Coefficient and Calinski-Harabasz Index values on weekdays and weekends.
Sustainability 12 06370 g004
Figure 5. Distributions of mean rental volumes across time in Clusters 1–3 on weekdays and weekends.
Sustainability 12 06370 g005
Figure 6. Overall volume of bicycle rental across time. Note: In this figure, we show the rental volume of all public bicycle stations on weekdays and weekends in a month at 20-min intervals in one day. This will help us understand the general pattern of daily public bicycle use.
Sustainability 12 06370 g006
Figure 7. The distribution of the proportional and enrichment factor values on weekdays. Note: Cluster 1 had the largest enrichment and proportional factors in Part A, Cluster 2 had the largest enrichment and proportion factors in Part B, and Cluster 3 had the largest enrichment and proportional factors in Part C. This explanation is also relevant to Figures 9 and 12.
Sustainability 12 06370 g007
Figure 8. The spatial distribution of clusters on weekdays and weekends. Note: A, B, and C represent three important population concentrations that are central city areas: A indicates an old urban area, B represents new urban districts that have been developing gradually, and C indicates a small concentrated population that has formed around universities. It is generally known that the old urban area has a large population of local people, so we used the term “large.” After our investigation, we learned that the population in the new urban districts was very dense. This explanation is also relevant for Figure 13.
Sustainability 12 06370 g008
Figure 9. The distribution of the proportional and enrichment factor values on weekends.
Sustainability 12 06370 g009
Figure 10. Variations in the Silhouette Coefficient and Calinski-Harabasz Index values.
Sustainability 12 06370 g010
Figure 11. Mean rental volume distributions on weekdays by cluster.
Sustainability 12 06370 g011
Figure 12. Differences among the clusters in the distribution of the proportional and enrichment factor values based on POIs type.
Sustainability 12 06370 g012
Figure 13. The spatial distribution of clusters.
Sustainability 12 06370 g013
Table 1. The typology and contents of Gaode map POI data after reclassification.
POI TypeAbbreviationPOI Category Contents
1. CollegeCOLUniversities and vocational schools
2. Middle schoolMSLMiddle schools
3. Bus stationBUSBus stations
4. Major hospitalHOSSpecialized hospitals, tertiary first-class hospitals, comprehensive hospitals, and so on
5. Major shoppingSOPShopping malls, comprehensive markets, typical commercial streets, and so on
6. Catering serviceCTSCoffee shops, Kentucky Fried Chicken, McDonald’s restaurants, bars/pubs, and so on
7. Industrial parkIDPIndustrial parks
8. Long-distance transit stationRWSRailway stations, long-distance bus stations
9. ResidenceRESDormitories, residential areas, and so on
10. Entertainment venueETMTourist attractions, parks, and so on

