Article

Understanding the Rural Livelihood Stability System: The Eco-Migration in Huanjiang County, China

1
Department of Land Science and Technology, China University of Geosciences, Beijing 100083, China
2
School of Geographical Sciences, Southwest University, Chongqing 400715, China
*
Authors to whom correspondence should be addressed.
Sustainability 2020, 12(16), 6374; https://doi.org/10.3390/su12166374
Submission received: 6 July 2020 / Revised: 5 August 2020 / Accepted: 6 August 2020 / Published: 7 August 2020
(This article belongs to the Section Sustainable Urban and Rural Development)

Abstract

:
Immigrants are a special group whose livelihood stability is crucial to local sustainable development. To understand the positive effect of eco-migration policy on the immigrants, we innovatively selected the perspective of stability and quantified immigrants’ livelihood stability with relevant concepts, including livelihood capitals and strategies, response capacity, and land-use efficiency, which helped identify the problems and put forward suggestions to enhance livelihood sustainability, achieve better social integration, and promote the sustainable development of the rural resettlement areas. Huanjiang County was used as a study case as it is the largest and most representative eco-migrant resettlement county of the southwestern karst region, China. Aided by participatory rural appraisal (PRA), this paper explores the livelihood stability of immigrants and takes natives as the reference group. The results show that the livelihood stability values of immigrants were less than that of natives, but the gap was smaller than ten years ago; the natural, social, and other capitals owned by immigrants were almost the same as those of natives, demonstrating that the Chinese government’s poverty alleviation policies have benefitted immigrants. However, both immigrants and natives were found to have less natural and social capitals; high income dependency and an unbalanced proportion of income sources in addition to low land-use efficiency. Therefore, there are several suggestions put forward to achieve stable livelihood and rural sustainable development, and these items should be given increased consideration by both the government and households in resettlement areas.

Graphical Abstract

1. Introduction

Environmental vulnerability, ecological imbalances, and exacerbated poverty will likely cause an increasing number of immigrants in the future [1,2,3]. These immigrants leave their original home to search for a suitable place to settle down, but spontaneous, disorderly migration leads to serious social problems [4]. To help alleviate these problems, eco-migration policies have been developed by governments around the world tailored to their particular circumstances, which often take land redistribution, skill training, loan supporting, and others into consideration [5,6]. The implementation of eco-migration policies serves to protect the ecologically fragile environment that is uninhabitable, while simultaneously improving the living and economic prospects of local inhabitants and achieving rural sustainable development in the resettlement areas. However, this creates further problems in studying the associated immigrant areas: it is difficult to efficiently evaluate the effects of eco-migration projects, which has significant influences on the immigrants’ livelihood, rural development, and land use. Researchers worldwide have tended to discriminately develop frameworks designed to assess the effects of the local eco-migration policy from the perspective of the producing and living conditions of immigrants [7,8,9]. The most common method of evaluating the sustainable livelihood level involves developing a sustainable or vulnerability index system [10,11]. For example, Below (2012) and Saxena et al. (2016) established an adaptive index system and resilience index framework to analyze the relationship between livelihood adaptability and the socioeconomic variables of farmers in Tanzania and India, respectively. Margles Weiss et al. (2016) established a livelihood vulnerability index system that included exposure, sensitivity, and adaptability to analyze the sustainable livelihoods of islanders in Grenada. The sustainable livelihood security model also reveals the livelihood risks of farmers and can enhance both their adaptability and livelihood sustainability aided by the local eco-migrant policy (provide mainly concessionary loans and free skill training) [12,13,14,15,16]. Researchers have also examined the challenges of ecological migration policies with respect to immigrant satisfaction with new living conditions and the effects of strategies designed to improve livelihood [17,18,19,20,21]. Meanwhile, more detailed research has been conducted in China focusing on the heterogeneity of farmers [2,22,23] in addition to substitutions and complementary ideas within livelihood capitals [24,25]. Such studies are important for the livelihood stability of immigrants and local farmers and can predict whether immigrants will choose to permanently settle or return home, thus providing governments with guidance on whether relevant policies need to be formulated or improved [26,27,28]. Based on the synthesis of relevant literature, we need to explore more research perspectives to analyze the effects of eco-migration policy on immigrants. Combined with the characteristics of the study area, we introduced a concept of stability and derived information from related literature. Urruty et al. (2016) summarized the concept of stability with a systematic literature review and found it is treated slightly differently according to the scholarly research perspective. For example, it may involve the ability to maintain ecological functions or the ability to return to an initial state of equilibrium regardless of the presence of disturbing factors [29,30,31]. However, these concepts have not been applied to immigrant areas. The stability system is defined as a complex adaptive structure; it involves resilience, unpredictability, self-organization, and nonlinearity in addition to being diverse in form and periodic [32]. Many researchers have studied the stability system in conjunction with livelihood to emphasize its complex background [33]. Current research on the sustainable livelihood of farmers on the background of eco-migrant policy in resettlement areas both in China and abroad is not sufficiently comprehensive. More case support and broader perspectives are required.
Eco-migration policy is a part of the National Plan for Poverty Reduction in China. The karst area in Southern China measures 532,600 km2 and includes the Guangxi Zhuang Autonomous Region, which occupies 34.08% of the total area (Central America, Southwest Europe, and Southern China have the world’s largest karst-concentrated areas [34]). Karst areas are highly water permeable and consist of thin soil layers with poor fertility. Both the scarcity of and lack of access to natural resources cause poverty and restrict agricultural development, and the increasing population and overused land in these areas have resulted in rocky desertification. Thus, a large area of Guangxi (41%) has become unsuitable for vegetative growth [35,36,37]. The poor population living in the mountainous karst areas of Western and Southern China is approximately one million, and the livelihoods of these individuals are at risk, making them key targets of Chinese governmental ecological migration policies designed to eliminate poverty. According to China’s 13th five-year plan, between 2016 and 2020, China will complete the emigration of over 10,000,000 people from ecologically fragile areas in the Southwest and Northwest. This will mitigate the ever-worsening poverty problems in these areas. Large-scale environmental migration is bound to have large impacts on the balance and development of ecological, social, and economic systems in the resettlement areas. Thus, to evaluate the effects of eco-migration policy in China, we chose stability as a tool to measure the livelihoods of immigrants, compared with local indigenous, and we aimed to find ways how to make the immigrants and natives achieve stable livelihood and rural sustainable development. Using Huanjiang County, China, as a case study, we adopted farmers’ livelihood capitals and strategies, response capacities, and land-use efficiency by integrating the scholarly definition of stability with actual circumstances in Huanjiang County to explain the stability system of the resettlement area. Previous research has indicated that the first stages of immigration into Huanjiang County resulted in a significant livelihood transition gap between immigrants and natives, thus showing a low stability level of immigrants [2]. We focused on examining whether eco-migration policy was helpful in achieving stability ten years later, and by establishing a framework of the livelihood-stability-system assessment in Huanjiang County through this research, we hope to provide support for the assessment of eco-migration policies on sustainable livelihood and rural development in other resettlement areas throughout the world.

2. Theoretical Basis and Quantitative Analysis Model

2.1. Theoretical Basis

Sustainable livelihood research has primarily been conducted within the sustainable framework proposed by the Department for International Development (DFID) [38,39,40] (Figure 1). The framework of sustainable livelihood encompasses environmental vulnerability, livelihood capitals, and policies that finally lead to livelihood outcomes. At its core are five livelihood assets (physical, natural, human, financial, and social capitals) that are deemed to underpin livelihoods at the level of household and village. This framework embraces the long-term perspectives of nature and human society by focusing on poverty alleviation. The ultimate goal of such assessments is to aid farmers in eliminating poverty by improving their living standards and quality of life, constructing a liveable human settlement environment, and completing rural development projects rather than simply focusing on raising incomes [41,42,43,44]. Combined with this paper, the fragile environment stimulates immigration policy occurred, and in turn, the latter has an impact on protecting the vulnerable emigrant territory, improving the living standard of immigrants, enhancing livelihood capitals, and increasing incomes.

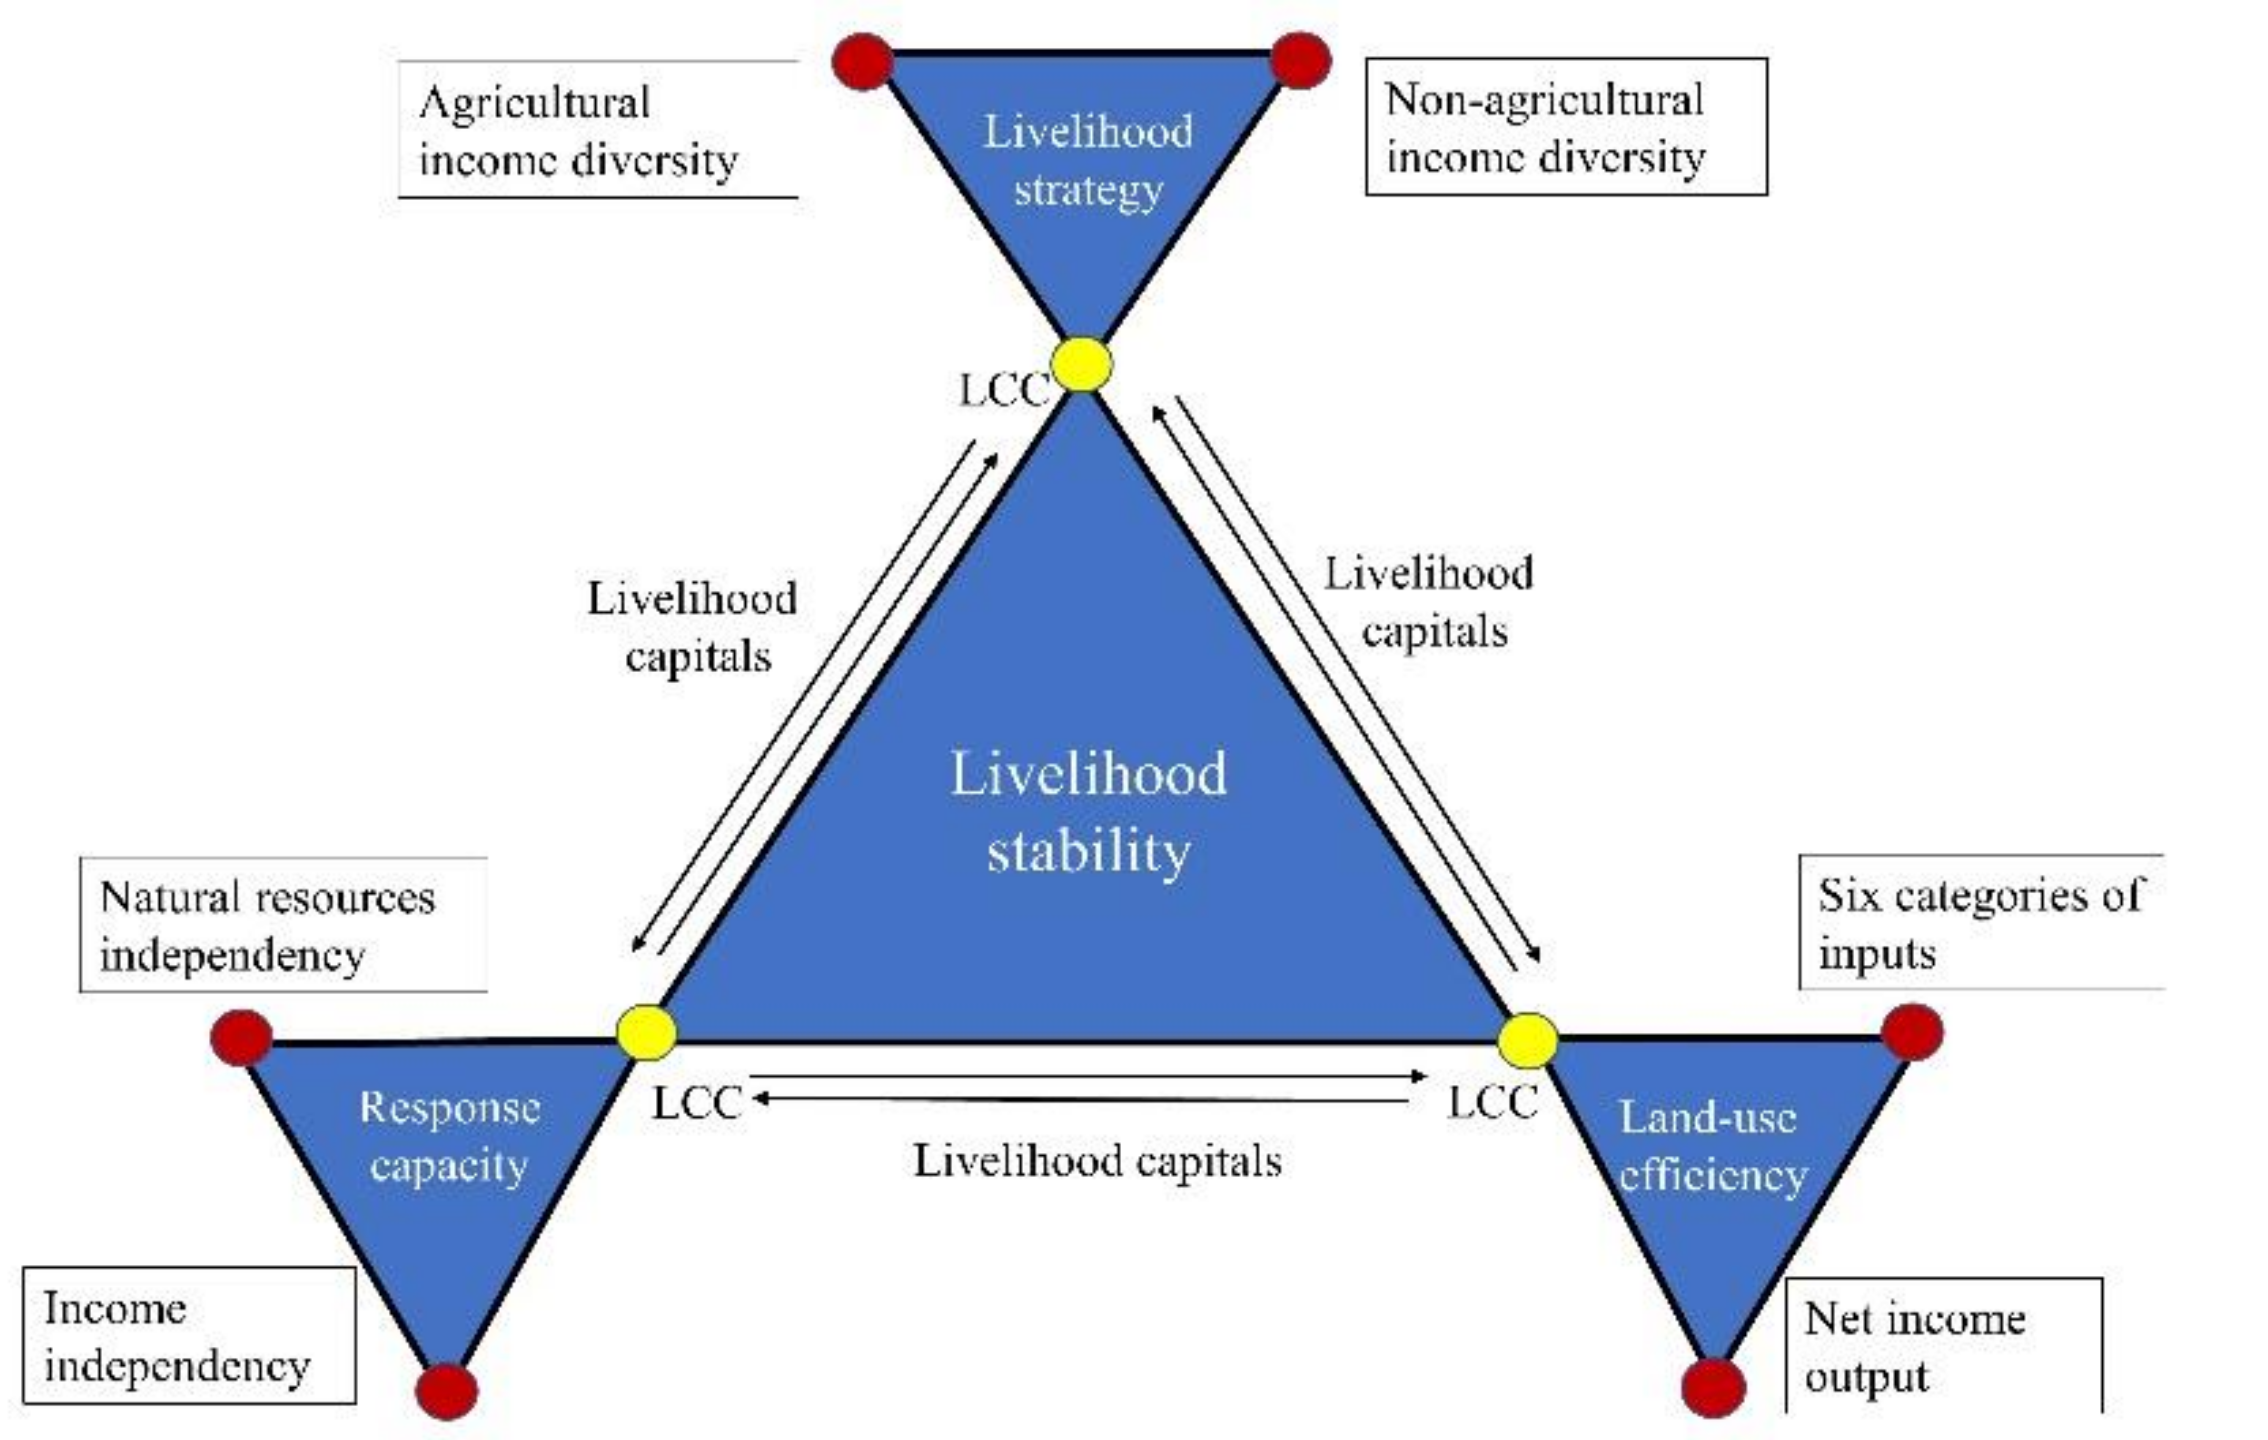
2.2. Livelihood Stability System Model

In order to assess the positive significance of eco-migration policy for improving the livelihood stability of immigrants, we focused on livelihood capital, livelihood strategies, response capacity, and land-use efficiency (red nodes represent the index of the system) and built a livelihood stability model to identify the problems and propose countermeasures to enhance the livelihood stability (Figure 2). Livelihood capital is the key element of livelihood stability, and the coupling coordination model of capitals (yellow nodes) originated from the synergism theory, which is commonly used to analyze correlations and interactions between the systems, determining the level of stability. Combining the characteristics of the research area and available data, the secondary measure index can be flexibly adjusted.

3. The Empirical Study

3.1. Study Area

The study area was located on the slope area of the southern edge of the Guizhou Plateau in China’s Northwestern Guangxi Zhuang Autonomous Region (longitude: 107°51′ E–108°43′ E, latitude: 24°44′ N–25°33′ N). The county’s entire cultivated area measures 24,700 hectares (9.51% of the total area). There is a gradual reduction in terrain from north to south, and the section south of the center is hilly land with a small basin. Located in the subtropical monsoon zone, it has a moderate climate with plenty of rain and is warm in winter and cool in summer. Given the county’s barren hill slopes and the significant concentration of young forests, there is a large contiguous area with considerable potential for agricultural development. Therefore, conditions in the county have been favorable for scaling up development relating to the ecological migration project. Since the early 1990s, the county has received 70,000 eco-migrants, distributed on 290 resettlement sites. Huanjiang has become the largest and most representative eco-migrant resettlement county of the southwestern karst region [28]. The Huanjiang Land and Resources Bureau, Agriculture Department, Poverty Alleviation Office, and local people gave helpful advice before we conducted our field research. We, therefore, chose 22 representative locations in Huanjiang County to which immigrants arrived at approximately the same time (in 1998) and where the style of land use was similar (with rice and corn being the main food crops cultivated) (Figure 3).

3.2. Data Acquisition and Data Management

3.2.1. Data Sources

Based on the concept of participatory rural appraisal (PRA), we conducted low-cost, flexible, semi-structured interviews that were likely to result in high levels of participation. A field survey was conducted to assess the sustainable livelihoods of both immigrants and natives. Each of the groups of villagers was treated as a unit in the survey. Since the number of households in each group was small, a blanket survey of every household was conducted. Therefore we used the household as a sample unit and interviewed either the head of the family or the individual with the most information about the family’s conditions to ensure the quality of the questionnaire data. Household surveys were generally conducted door-to-door, beginning with in-depth interviews with village cadres. We conducted a comprehensive household survey, only excluding those houses that were empty during the survey period in each of the selected survey sites (Figure 1). The questionnaire was divided into three sections: (1) information on the basic characteristics of respondents (i.e., gender, age, career, education level of each family member), (2) household resources (i.e., cultivated land area, crop diversity, number of livestock, and housing conditions), and (3) livelihood strategies (i.e., all types of income and expenditure). The means and standard deviations of the statistical data are shown in Table 1. During the first phase of research, which took place at different times during August 2012, February 2014, and April 2016, we familiarized ourselves with the study area. The survey was then conducted during a subsequent formal phase in September 2018. Specifically, 16 investigators spent a total of 14 days surveying each household for a period of between 1 and 1.5 h. We obtained basic information by examining the official statistics available on the statistics bureau website. As a result, we obtained 164 valid questionnaires (i.e., 122 from immigrants and 42 from native residents) from the 172 we conducted. This resulted in an effective survey rate of 95.35%. We selected all 164 valid samples for natives and immigrants to reflect the actual composition of Huanjiang County.

3.2.2. Establishment of the Index System of Livelihood Stability

We explored every indicator in Table 2 in detail combined with the characteristics of the livelihood of immigrants and natives and the available data. In short, the stronger their ability to resist risk was, the higher their livelihood stability was.

3.2.3. Data Processing

Data should be normalized as each indicator unit is different; thus, this study used Z-score methods to standardize the index values [45,46]. The Entropy Weight Method was adopted to give weight to each index, and the output value of each farmer’s livelihood stability was obtained.
C = i = 1 M X i W i
where: C denotes the comprehensive value, M denotes the ith indicators of criteria on j (j = 1,2, 3, …, n), Wi means the weight of each indicator, and Xi represents the standardized values.

3.3. Results

3.3.1. Livelihood Capitals

As shown in Figure 4, the gap between immigrants and natives in each capital was small. Combined with the data obtained from the field research shown in Appendix A, we provide a detailed analysis of the specific composition of capital as follows. (1) Natives owned more natural capital (0.5454) than immigrants (e.g., orchards and forestlands). However, the amount of natural capital for both immigrants and natives was less than that of three other types of capital (physical, financial, and human) due to land fragmentation in mountainous areas. (2) Natives owned more physical capital (0.6517) than immigrants (e.g., more rooms in their houses, production tools, and livestock). They were also closer to roads, making it more convenient to leave the area. Natives used 50% less fertilizer than immigrants, indicating that natives pay more attention to soil protection. (3) Regarding financial capital, natives relied more on farm income while immigrants primarily relied on non-farming income. This finding was in line with other previous studies [47,48]. Natives have more land, tools, and labor force. The remittance amount received by natives was over twice that of immigrants, which may explain why natives maintain higher social capital values and a wider social network [49,50]. Without considering other factors, remittances were positively correlated with the number of relatives working outside away from home and their levels of wage. (4) Both groups had nearly identical levels of human capital. However, natives were generally in better health, having approximately half the medical expenditure of immigrants, due to immigrants performing more non-farm work than natives, which usually constitutes physical labor that is more taxing on their health. (5) Regarding social capital, more immigrants than natives worked outside and at further distances from home for more than six months per year. Other immigrants working near their villages frequently returned home, resulting in higher transportation costs. However, natives incurred increased costs when contacting their relatives or friends by communication (phone calls). Livelihood capital is an important part of the livelihood stability system and they have a positive relationship. China’s eco-migration policy should continue to focus on improving land resource reallocation, providing relief funds for immigrants and natives, and constructing more harmonious communities. Meanwhile, the five types of livelihood capital were not equally distributed, with more human and financial capital and less natural and social capital for both natives and immigrants.

3.3.2. Livelihood Strategy

Diversity is not only important when implementing a livelihood strategy but is also an efficient method of attaining livelihood stability [51,52]. Immigrants had an income diversity value of 0.5050, while the value for natives was 0.5528. This indicates that natives had more income sources and the proportion of these incomes, therefore, tended to balance. According to this study’s field survey data, the proportions of pure farming and non-farming households were low (less than 15%), while mixed-income households (i.e., farming and business) were more common. We found that natives had a relatively much higher number of farming strategies, possessed a greater variety of agricultural cultivation methods, and diversified their land use. Area food crops include rice, corn, sweet potatoes, soybeans, peanuts, and other vegetables, while cash crops include sugar cane, mulberry, and citrus. There are many types of livestock, including cattle, horses, pigs, sheep, chickens, ducks, geese, and silkworms. There is also a variety of local tree species, including eucalyptus, fir, pine, and walnut. As members of an originally external population, immigrants owned fewer land resources, even if the government had already redistributed the land. Immigrants should pay more attention to increasing their income diversity (have more income sources and make the proportion of incomes tend to balance) to enhance their capacity to maintain livelihood risk resistance and increase stability by increasing the number of non-agricultural activities including small businesses and part-time work in nearby cities.

3.3.3. Response Capacity

The higher the value of income dependence is, the more unbalanced income resources and the more hidden livelihood risk are [53]. Table 2 indicates an income dependency index of 0.6935 for immigrants and 0.6645 for natives, which is both undoubtedly high. According to the survey data, wages accounted for nearly 40% of the total income for immigrants who relied on it. While wages can bring immigrants more money, they may have trouble maintaining normal livelihood practices when uncertain factors result in immigrant worker suspensions. This places them at risk. Meanwhile, the natural resource dependency index was 0.5178 for natives, which was 0.1260 higher than for immigrants (Table 2). Due to the per capita ownership of land resources, natives had more agricultural machinery and larger farm labor forces than immigrants. Agricultural income accounted for nearly half the family net income, while other sources of income were distributed nearly evenly. Natives’ high dependence on natural resources threatens their livelihood stability since droughts and other natural disasters will greatly challenge this population. Thus, it is urgent for both immigrants and natives to decrease the level of income dependency and increase the level of livelihood stability.

3.3.4. Land-Use Efficiency

Rural land use is a livelihood activity of economic nature in which farmers receive corresponding agricultural rewards for their inputs of land, capital, labor, and technology. Land-use efficiency is a measure of how well farmers allocate and use natural or physical resources and what economic results they can achieve, as well as a good measure of the stability of their livelihoods. With regard to the method of measuring the efficiency of agricultural land use, the data envelopment analysis (DEA) method is used to treat the agricultural land use process as an input-output system, the weights of various input factors are determined endogenously by the optimal method. The method has been widely used in the evaluation of agricultural land-use efficiency [54,55]. In this paper, DEA indicators are selected according to the principles of comparability, systematization, integrity, and economy, as shown in Figure 5, and DEA-SOLVER PRO 5.0 software is used to calculate the DEA efficiency of farmers’ land use. The calculation results showed that the average value of DEA efficiency for natives and immigrants was 0.5881 and 0.3922, respectively, which indicated that the actual output of farmers’ land use accounted for only 58.81% and 39.22% of the ideal output, and there was still much room for improvement. We found that this is directly related to local land fragmentation, low productivity, outmoded technology, and incomplete agricultural infrastructure. It is also increasingly difficult to find more arable land [56]. However, the value for natives was slightly higher than that for immigrants, indicating that rational use of land resources by natives in agricultural production included land consolidation and the utilization of marginal land, the abundant crop varieties, and improved planting technologies. Therefore, this paper proposes relevant policy suggestions to improve land-use efficiency of both immigrants and natives. First, the local government and farmers should obtain the maximum output with the minimum input in order to elevate the level of livelihood stability; and second, continuing to promote the level of agricultural modernization, including the improvement of crop varieties and investment in agricultural science and technology.

3.3.5. The Livelihood Stability Values

The resulting livelihood stability value in Huanjiang County was 0.5152 for immigrants (Table 2) and 0.5937 for natives, and natives scored higher than immigrants in all aspects (Figure 6). This indicates that immigrants’ livelihoods are less stable than natives’ livelihoods, and there was a big gap in land-use efficiency. We found that the values for resource dependency and land-use efficiency were higher for natives (1.32 and 1.50 times those of immigrants, respectively). The per capita land area of natives was double that of immigrants, but the number of fertilizers and pesticides used by natives in 2018 was approximately half that of immigrants (Appendix A). Meanwhile, although the main source of income for natives was farming, livelihood risks were reduced by simultaneously increasing the diversity of strategies, expanding the sources of income, and promoting land-use efficiency. Overall, the gap between native and immigrant farmers was generally small. Thanks to relocation policies designed to alleviate poverty, technical support and financial subsidies have improved the lives of immigrants over the past 20 years. According to the values, the government should take more actions to improve the stability of immigrants. In particular, increases in immigrant livelihood stability have been accelerated through governmental policies to reallocate land resources, provide skills training, distribute walnut seedlings, and promote reform of the silkworm industrial structure.

4. Discussion and Conclusion

4.1. Discussion

4.1.1. Policy Implementations

After 20 years of integration and development, the gap between immigrants and natives in Huanjiang County has greatly reduced, and the livelihood stability of immigrants is almost the same as natives. This reduction is evident when we examine the values of livelihood stability indicators. Livelihood capitals come from the core of the sustainable livelihood framework, which is a helpful tool for measuring rural household stability [57,58,59]. Many scholars in both China and abroad have used this tool to research farmers’ livelihood in resettlement areas [60]. This study revealed that the total amount of livelihood capitals available to immigrants was similar to that of natives, suggesting that immigration policy plays an important role. Despite the redistribution of land to ensure that all settlers had sufficient food and subsistence resources, the total amount of land owned by immigrants remains less than that owned by natives. The reason for this is rooted in history: natives were using the land first, and the land reallocation policy was not perfectly implemented. However, the local government has also formulated laws and regulations corresponding to actual regional requirements and has provided active policy support for immigrants (e.g., technical training, employment opportunities, distribution of seedlings, and promotion of the sugarcane and silkworm industries) [2]. This has not only aided in industrial restructuring and increased livelihood strategies and income diversity for farmers but has also promoted integration among farmers and improved livelihood stability and the capacity for rural sustainable development. China is currently involved in its 13th five-year plan, which highlights the arduous tasks and strategic goals that accompany migration and poverty alleviation. Huanjiang County is located in the Guangxi Zhuang Autonomous Region, which is one of China’s underdeveloped areas. The county is still known as an area of relative poverty and resettlement. It is representative of the ongoing need for rural revitalization. Therefore, combined with the research results of this paper, the eco-migration policy needs to be further optimized to enhance livelihood stability of both immigrants and natives in the resettlement area so as to achieve sustainable rural development.

4.1.2. Diversity-Stability Relationship

From the perspective of immigrants’ household in the study area, the diversity of strategies and income have a positive relationship with livelihood stability. First, increasing the education level is the most effective way for farmers to attain higher salary jobs. It is necessary for the government to improve its rural medical policy, impose population control measures, encourage higher education to optimize the income structure, and reasonably resist unforeseen risks. Second, remittance is a source of financial capital for rural development [48,57]. Natives’ remittance was double that of immigrants, which offset their income dependency on farming. We should, therefore, pay more attention to increasing income diversity while decreasing income dependency. Third, orchard areas should be moderately increased, crop strains and livestock should be made more abundant, attention should be paid to transportation, production tools should be improved, and farmers should be encouraged to increase their non-agricultural diversity, which will enhance the community’s sustainability.

4.1.3. Study Limitations

We developed a livelihood stability framework to explore how to achieve peasant livelihood and rural sustainable development, focusing on immigrants compared with natives, aided by PRA. This was an original attempt to evaluate sustainable livelihoods and rural development in resettlement areas. Due to the limits of accessing our collected data, the framework may not reflect all aspects. However, we attempted to explain this limitation in both our literature examination and practice. In future research, we intend to focus on long-term livelihood stability changes for immigrants in the resettlement area under the conditions of natural or man-made disasters. We can then uncover additional factors that specifically affect livelihood stability.

4.2. Conclusions

Eco-migration policies have been implemented around the world with an increasing number of immigrants in the future. These immigrants leave their original home to search for a suitable place to settle down, but spontaneous, disorderly migration leads to serious social problems. [61]. Based on the global eco-migration background of the response to environmental vulnerability, natural disasters, large infrastructural requirements, and the need to alleviate poverty, it is urgent to measure the effects of such policies quantificationally. Huanjiang County is the largest and most representative eco-migration resettlement county of the southwestern karst region in China and has experienced social integration and economic problems because of an influx of immigrants. To determine if policies meant to alleviate these pressures have led to sustainability and benefits for farmers, we developed a livelihood stability framework using livelihood capital and strategies, response capacity, and land-use efficiency to reflect the effects of eco-migration policy. We determined that in terms of livelihood stability values, immigrants’ livelihood is less stable than that of natives, however, the gap between immigrants and natives was relatively small, which suggests that eco-migration policies and poverty alleviation measures (including land redistribution, skill training, seeds ration, and interest-free loan support) benefit immigrants. However, problems still exist, including less natural and social capital, high income dependency, unbalanced proportion of income sources, and low land-use efficiency for both immigrants and natives.
This paper emphasized within the sustainable livelihood system the importance of stability, which is at the core of both immigrants and natives, and rural sustainable development, particularly in developing countries with imperfect rural industrial structures, rural construction plans, and rural development policies [62,63]. The framework in this paper was implemented to determine how to achieve sustainable livelihood and rural development from the perspective of livelihood capitals and activities, response capacity and environmental intervention. Combining the characteristics of the research area and available data, the secondary measure index can be flexibly adjusted. This study comprised an original research perspective to assess immigrants’ livelihood stability with the intent of applying that to other resettlement areas around the world, particularly those in developing countries.

Author Contributions

X.L. contributed to the questionnaire design and drafted the paper; S.X. collected data, performed the analysis, and drafted the paper; Y.H. revised and edited the paper. All authors have read and approved the final paper.

Funding

This study was jointly funded by the National Nature Science Foundation of China (Grant No.41877034) and the Fundamental Research Funds for the central universities of China (Grant No. 2652018036).

Acknowledgments

We would like to thank the local government and residents of Huanjiang County for providing valuable help and participating in our fieldwork. We appreciate the cooperation of all who participated.

Conflicts of Interest

The authors declared no potential conflicts of interest with respect to the research, authorship, and/or publication of this article.

Appendix A

Table A1. The indicators of livelihood capitals.
CategoryVariable Name (Short Forms)Definition (Unit)MeanStandard DeviationMean DeviationStandard Error
NativesImmigrantsNativesImmigrantsNativesImmigrantsNativesImmigrants
Natural Capital (N)Cropland (N1)cropland per household, including drylands and paddy field (mu)7.097.768.33 7.57 5.47 4.91 1.280.69
Orchard (H5)garden land per household (mu)4.261.274.00 3.26 2.83 1.97 0.620.3
Forestland (N3)forest area per household (mu)13.526.6920.46 11.49 12.58 6.79 3.161.04
Land blocks (N4)negative number of land blocks per household cultivated (blocks)8.15.164.56 5.69 3.74 3.23 0.70.51
Crop strains (N5)food crops and cash crops per household (types)4.143.231.37 1.41 1.04 1.10 0.210.13
Physical Capital (P)Housing (P1)number of rooms per household4.293.52.02 1.77 1.54 1.37 0.310.16
Electricity consumption (P2)electricity consumption per month per household (W)82.581.3372.22 91.50 37.38 39.42 11.148.28
Distance to road (P3)distance to the nearest road (negative indicator) (meters)33.9100.9183.18 532.20 41.94 158.77 12.8348.18
Production tools (P4)number of farm machines and durable goods per household4.713.761.90 1.97 1.54 1.66 0.290.18
Livestock (P5)all kinds of livestock in research area: 1 = cattle, 0.8 = horses, 0.3 sheep, 0.2 = pigs, 0.01 chickens, 0.02 = ducks, 0.03 = geese, 0.2 = silkworms, 0.001 = eggs1.351.261.08 2.61 0.75 1.28 0.170.24
Fertilizer (P6) total fertilizer and pesticide amounts applied for the year (negative indicator) (kilograms)581.481033.7509.20 1434.35 328.42 880.80 78.57129.86
Financial Capital (F)Agricultural income (F1)household total income from agricultural work per year (RMB) 14,726.079315.499377.64 11,586.16 7307.36 7626.69 14471048.96
Wages (F2)wage income per year per household (RMB)12,845.2419709.4920,757.16 37,070.33 16,136.05 21,531.04 3202.93356.19
Remittance (F3)remittance income per year per household (RMB)7973.833178.0821,890.46 6878.39 9988.38 4033.22 3377.77627.91
Property (F4)property income per year per household (RMB)0.0295.450.15 552.42 0.00 0.00 0.0250.01
Non-agricultural income (F5)household total income from non-agricultural work per year (RMB)5842.865696.8114,762.56 15,715.82 9121.77 9302.89 2277.911422.84
Loans (F6)whether household can loan from the bank: 1 = Yes; 0 = No0.60.610.50 0.49 0.48 0.47 0.80.04
Borrowings (F7) whether household can borrow from others: 1 = Yes; 0 = No0.790.90.42 0.30 0.34 0.16 0.060.03
Human Capital (H)Labor members (H1)number of household workers refers to able-bodied workers aged 14 to 653.934.180.97 1.83 0.67 1.38 0.150.17
Non-farming laborers (H2)number of workers in non-agricultural industries 1.051.230.91 1.16 0.73 0.92 0.140.11
Labor capacity (H3)including all household members: 1 = sound labor capacity, 0.5 = semi-labor ability, 0 = incapacity0.730.710.21 0.25 0.17 0.20 0.030.02
Education (H4)educational level of all household members: 4 = junior college and above, 3 = high school, 2 = middle school, 1 = primary school, 0 = illiterate1.431.930.45 0.63 0.37 0.51 0.070.06
Educational expenditure (H5)educational expenditure per household in total (RMB)4133.814083.736752.51 6536.50 4479.07 4475.26 1041.94591.79
Male (H6)proportion of males per household (%)0.540.550.17 0.19 0.14 0.15 0.030.02
Health Status (H7)medical expenditures (negative indicator) (Yuan)2416.674255.742730.76 8773.56 2133.33 4440.12 421.36794.32
Social Capital (S)Transportation (S1)annual transport expenditures (RMB)854.861498.14578.63 2566.25 1678.64 1398.00 706.5232.34
Communication (S2)annual communications expenditures (RMB)1405.24962.951175.36 1251.49 895.06 830.04 181.36113.3
Relative network (S3)number of farmers who work in the town for more than six months per year0.710.930.60 0.83 0.51 0.57 0.090.08
Access to notification (S4) number of ways farmers can obtain relative information0.051.190.22 0.80 0.09 0.51 0.030.07

References

  1. Dunn, E.C. Refugee protection and resettlement problems. Science 2016, 352, 772–773. [Google Scholar] [CrossRef] [PubMed]
  2. Hu, Y.; Zhou, W.; Yuan, T. Environmental impact assessment of ecological migration in China: A survey of immigrant resettlement regions. J. Zhejiang Univ.-Sci. A 2017, 19, 240–254. [Google Scholar] [CrossRef]
  3. Scoones, I. Livelihoods perspectives and rural development. J. Peasant. Stud. 2016, 36, 171–196. [Google Scholar] [CrossRef]
  4. Pablo, T. Livelihood strategies, resilience and transformability in African agroecosystems. Agric. Syst. 2014, 126, 3–14. [Google Scholar]
  5. Hu, Y.; Zheng, F.; Xu, S. Evaluation of ecological resettlement project effect in immigration regions in Guangxi. Trans. Chin. Soc. Agric. Eng. 2017, 33, 264–270. (In Chinese) [Google Scholar]
  6. Finco, M.V.A. Poverty-environment trap: A nonlinear probit model applied to rural areas in the north of Brazil. Am.-Eurasian J. Agric. Environ. Sci. 2009, 5, 533–539. [Google Scholar]
  7. Ma, S.; Ma, S. The environmental justice in ecological immigration: A case study of Sanjiangyuan area. Arch. Res. 2015, 17, 147–152. [Google Scholar] [CrossRef] [Green Version]
  8. Turner, B.L. Vulnerability and resilience: Coalescing or paralleling approaches for sustainability science? Glob. Environ. Chang. 2010, 20, 570–576. [Google Scholar] [CrossRef]
  9. Bebbington, A. Capitals and capabilities: A framework for analyzing peasant viability, rural livelihoods and poverty. World Dev. 1999, 27, 2021–2044. [Google Scholar] [CrossRef]
  10. Ligtermoet, E. Maintaining customary harvesting of freshwater resources: Sustainable indigenous livelihoods in the floodplains of northern Australia. Rev. Fish Biol. Fish. 2016, 26, 649–678. [Google Scholar] [CrossRef]
  11. Roberts, M.G.; Yang, G. The international progress of sustainable development research: A comparison of vulnerability analysis and the sustainable livelihoods approach. Prog. Geogr. 2003, 22, 11–21. [Google Scholar]
  12. Cumming, G.S.; Barnes, G.; Perz, S.; Schmink, M.; Sieving, K.E.; Southworth, J.; Bingord, M.; Holt, R.D.; Stickler, C.; VanHolt, T. An exploratory framework for the empirical measurement of resilience. Ecosystems 2005, 8, 975–987. [Google Scholar] [CrossRef]
  13. Below, T.B.; Mutabazi, K.D.; Kirschke, D.; Franke, C.; Sieber, S. Can farmers’ adaptation to climate change be explained by socio-economic household-level variables? Glob. Environ. Chang. 2012, 22, 223–235. [Google Scholar] [CrossRef]
  14. Saxena, A.; Guneralp, B.; Bailis, R.; Yohe, G.; Oliver, C. Evaluating the resilience of forest dependent communities in Central India by combining the sustainable livelihoods framework and the cross-scale resilience analysis. Curr. Sci. 2016, 110, 1159–1207. [Google Scholar]
  15. Margles, S.W.; Agostini, V.N.; Roth, L.M.; Gilmer, B.; Schill, S.R.; Knowles, J.E.; Blyther, R. Assessing vulnerability: An integrated approach for mapping adaptive capacity, sensitivity, and exposure. Clim. Chang. 2016, 136, 615–629. [Google Scholar]
  16. You, H.; Zhang, X. Sustainable livelihoods and rural sustainability in China: Ecologically secure, economically efficient or socially equitable? Res. Conserv. Recycl. 2017, 120, 1–13. [Google Scholar] [CrossRef]
  17. Mahmuda, M.; Anisul, H.; Shah, M.; Jeroen, F.; Philippus, W. Development of a sustainable livelihood security model for storm-surge hazard in the coastal areas of Bangladesh. Stoch. Environ. Res. Risk Assess. 2016, 30, 1301–1315. [Google Scholar]
  18. Nguyen, H.T.; Pham, T.H.; de Bruyn, L.L. Impact of hydroelectric dam development and resettlement on the natural and social capital of rural livelihoods in Bo Hon Village in Central Vietnam. Sustainability 2017, 9, 1–15. [Google Scholar] [CrossRef] [Green Version]
  19. Adam, A.B.; Owen, J.R.; Kemp, D. Households, livelihoods and mining-induced displacement and resettlement. Extr. Ind. Soc. 2015, 2, 581–589. [Google Scholar] [CrossRef]
  20. Kabra, A. Assessing economic impacts of forced land acquisition and displacement: A qualitative rapid research framework. Impact Assess. Impact Assess. Proj. Apprais. 2016, 34, 24–32. [Google Scholar] [CrossRef]
  21. Freeman, H.A.; Ellis, F.; Allison, E. Livelihoods and rural poverty reduction in Kenya. Ladder Work. Pap. 2003, 33, 1–27. [Google Scholar] [CrossRef]
  22. Oberhauser, A.M. (Re)constructing rural-urban spaces: Gendered livelihoods, migration, and natural resources in South Africa. GeoJournal 2016, 81, 489–502. [Google Scholar] [CrossRef]
  23. Guo, X.; Naim, K. Examining the impacts of disaster resettlement from a livelihood perspective: A case study of Qinling Mountains, China. Disasters 2018, 42, 251–274. [Google Scholar] [CrossRef] [PubMed]
  24. Su, F.; Shang, H. Relationship analysis between livelihood assets and livelihood strategies: A Heihe river basin example. Sci. Cold Arid Reg. 2012, 4, 0265–0274. [Google Scholar]
  25. Wang, C.; Zheng, Y. Assessment of sustainable livelihoods of different farmers in hilly red soil erosion areas of southern China. Ecol. Indic. 2016, 64, 123–131. [Google Scholar] [CrossRef]
  26. Li, M.; Huo, X.; Peng, C.; Qiu, H.; Shuangguan, Z.; Chang, C.; Huai, J. Complementary livelihood capitals as a means to enhance adaptive capacity: A case of the Loess Plateau, China. Glob. Environ. Chang. 2017, 47, 143–152. [Google Scholar] [CrossRef]
  27. Arnall, A.; Thomas, D.S.G.; Twyman, C.; Liverman, D. Flooding, resettlement, and change in livelihoods: Evidence from rural Mozambique. Disasters 2013, 37, 468–488. [Google Scholar] [CrossRef]
  28. Castella, J.C.; Lestrelin, G.; Hett, C.; Bourgoin, J.; Fitriana, Y.R.; Heinimann, A.; Pfund, J.L. Effects of landscape segregation on livelihood vulnerability: Moving from extensive shifting cultivation to rotational agriculture and natural forests in Northern Laos. Hum. Ecol. 2013, 41, 63–76. [Google Scholar] [CrossRef]
  29. Singer, J.; Hoang, H.; Ochiai, C. Post-displacement community resilience: Considering the contribution of indigenous skills and cultural capital among ethnic minority Vietnamese. Asia Pac. Viewp. 2015, 56, 208–222. [Google Scholar] [CrossRef]
  30. Harihar, A.; Verissimo, D.; MacMillan, D.C. Beyond compensation: Integrating local communities’ livelihood choices in large carnivore conservation. Glob. Environ. Chang. 2015, 33, 122–130. [Google Scholar] [CrossRef]
  31. Urruty, N.; Tailliez-Lefebvre, D.; Huyghe, C. Stability, robustness, vulnerability and resilience of agricultural systems. A review. Agron. Sustain. Dev. 2016, 36, 1–15. [Google Scholar] [CrossRef] [Green Version]
  32. Smyth, E.; Steyn, M.; Esteves, A.M.; Franks, D.M.; Vaze, K. Five ‘big’ issues for land access, resettlement and livelihood restoration practice: Findings of an international symposium. Impact Assess. Proj. Apprais. 2015, 33, 220–225. [Google Scholar] [CrossRef]
  33. Liu, Y.; Deng, X.; Hu, Y. Rocky land degradation and poverty alleviation strategy in Guangxi karst mountainous area. J. Mount. Sci. 2006, 2, 228–233. (In Chinese) [Google Scholar]
  34. Rodríguez, A.G.P.; López, M.I.R.; Casillas, A.D.; León, J.A.A.; Banik, S.D. Impact of pesticides in karst groundwater. Review of recent trends in Yucatan, Mexico. Groundw. Sustain. Dev. 2018, 7, 20–29. [Google Scholar] [CrossRef]
  35. Moreno-Gómez, M.; Pacheco, J.; Liedl, R.; Catalin, S. Evaluating the applicability of European karst vulnerability assessment methods to the Yucatan karst, Mexico. Environ. Earth Sci. 2018, 77, 682. [Google Scholar] [CrossRef]
  36. Hoy, C.; Sumner, A. Global poverty and inequality: Is there new capacity for redistribution in developing countries? J. Glob. Dev. 2016, 7, 117–157. [Google Scholar] [CrossRef] [Green Version]
  37. Kassa, H.; Dondeyne, S.; Poesen, J.; Frankl, A.; Nyssen, J. Transition from forest-based to cereal-based agricultural systems: A review of the drivers of land use change and degradation southwest Ethiopia. Land Degrad. Dev. 2017, 28, 431–449. [Google Scholar] [CrossRef] [Green Version]
  38. Chao, C.C.; Ee, M.S.; Laffargue, J.P.; Yu, E.S.H. Environmental migration and capital mobility. Int. Rev. Econ. Financ. 2016, 42, 430–441. [Google Scholar] [CrossRef]
  39. Wang, C.; Ren, M.J.; Li, H.Y.; Zhu, Y.Y. Understanding the Rural Production Space System: A Case Study in Jiangjin, China. Sustainability 2019, 11, 2811. [Google Scholar] [CrossRef] [Green Version]
  40. Zaman, M.A.; Jewel, M.A.S.; Hossain, M.Y.; Provhat, S.J.; Jasmine, S.; Ali, M.M.; Hossain, M.I. Impact assessment of sluice gate on fishing activity, fisheries diversity, riverine habitability and livelihood stability of the fishermen in the northwestern Bangladesh. Int. J. Res. Appl. Nat. Soc. Sci. (IJRANSS). 2013, 1, 99–110. [Google Scholar]
  41. Fang, M.; Li, Y.; Li, W. Solving one problem by creating a bigger one: The consequences of ecological resettlement for grassland restoration and poverty alleviation in Northwestern China. Land Use Policy 2015, 42, 124–130. [Google Scholar]
  42. Holling, C.S. Resilience and stability of ecological system. Annu. Rev. Ecol. Syst. 1973, 4, 1–24. [Google Scholar] [CrossRef] [Green Version]
  43. Robinson, B.E.; Li, P.; Hou, X. Institutional change in social-ecological systems: The evolution of grassland management in Inner Mongolia. Glob. Environ. Chang. 2017, 47, 64–75. [Google Scholar] [CrossRef]
  44. Liu, S.; Ge, J.; Li, W.M.; Bai, M. Historic Environmental Vulnerability Evaluation of Traditional Villages Under Geological Hazards and Influencing Factors of Adaptive Capacity: A District-Level Analysis of Lishui, China. Sustainability 2020, 12, 2223. [Google Scholar] [CrossRef] [Green Version]
  45. Fang, Y.; Fan, J.; Shen, M.; Song, M. Sensitivity of livelihood strategy to livelihood capital in mountain areas: Empirical analysis based on different settlements in the upper reaches of the Minjiang River, China. Ecol. Indic. 2014, 38, 225–235. [Google Scholar] [CrossRef]
  46. Yang, H.; Li, Y.; Feng, Q.; Chen, W. A comparative analysis of rural household livelihoods diversity among different regions of Shiyang River Basin, NW China. Arid Land Geog. 2016, 39, 199–206. [Google Scholar]
  47. Hua, X.; Yan, J.; Zhang, Y. Evaluating the role of livelihood assets in suitable livelihood strategies: Protocol for anti-poverty policy in the Eastern Tibetan Plateau. China. Ecol. Indic. 2017, 78, 62–74. [Google Scholar] [CrossRef]
  48. Chami, R.; Fullenkamp, C.; Jahjah, S. Are immigrant remittance flows a source of capital for development? IMF Staff. Pap. 2005, 52, 55–81. [Google Scholar] [CrossRef] [Green Version]
  49. Holtz, G.; Brugnach, M.; Pahl, W.C. Specifying “regime”: A framework for defining and describing regimes in transition research. Technol. Forecast. Soc. Chang. 2008, 75, 623–643. [Google Scholar] [CrossRef]
  50. Lestrelin, G.; Bourgoin, J.; Bouahom, B.; Castella, J.C. Measuring participation: Case studies on village land use planning in northern Lao PDR. Appl. Geogr. 2011, 31, 950–958. [Google Scholar] [CrossRef]
  51. Dong, G.; Bai, J.; Yang, S.; Wu, L.; Cai, M.; Zhang, Y.; Luo, Y.; Wang, Z. The impact of land use and land cover change on net primary productivity on China’s Sanjiang Plain. Environ. Earth Sci. 2015, 74, 2907–2917. [Google Scholar] [CrossRef]
  52. Su, M.M.; Wall, G.; Xu, K. Heritage tourism and livelihood sustainability of a resettled rural community: Mount Sanqingshan World Heritage Site, China. J. Sustain. Tour. 2016, 24, 735–757. [Google Scholar] [CrossRef]
  53. Chen, H.; Zhu, T.; Krott, M.; Calvo, J.F.; Shivakoti, P.G.; Inoue, M. Measurement and evaluation of livelihood assets in sustainable forest commons governance. Land Use Policy 2013, 30, 908–914. [Google Scholar] [CrossRef]
  54. Sachikonye, M.T.B.; Dalu, T.; Gunter, A. Sustainable livelihood principles and urban greening in informal settlements in practice: A case of Zandspruit informal settlement, South Africa. Dev. S. Afr. 2016, 33, 518–531. [Google Scholar] [CrossRef]
  55. Li, C.; Li, S.; Feldman, M.W.; Li, J.; Zheng, H.; Daily, G.C. The impact on rural livelihoods and ecosystem services of a major relocation and settlement program: A case in Shaanxi, China. Ambio 2018, 47, 245–259. [Google Scholar] [CrossRef] [PubMed]
  56. Usamah, M.; Haynes, K. An examination of the resettlement program at Mayan Volcano: What can we learn for sustainable volcanic risk reduction? Bull. Volcanol. 2012, 74, 839–859. [Google Scholar] [CrossRef]
  57. Adger, W.N.; Kelly, P.M.; Winkels, A.; Huy, L.Q.; Locke, C. Migration, remittances, livelihood trajectories, and social resilience. Ambio 2002, 31, 358–366. [Google Scholar] [CrossRef]
  58. Mascia, M.B.; Claus, A.C. A property rights approach to understanding human displacement from protected areas: The case of marine protected areas. Conserv. Biol. 2009, 23, 16–23. [Google Scholar] [CrossRef]
  59. Souksavath, B.; Nakayama, M. Reconstruction of the livelihood of resettlers from the Nam Theun 2 hydropower project in Laos. Int. J. Water Resour. Dev. 2013, 1, 71–86. [Google Scholar] [CrossRef]
  60. Moomen, A.-W.; Dewan, A.; Corner, R. Landscape assessment for sustainable resettlement of potentially displaced communities in Ghana’s emerging northwest gold province. J. Clean. Prod. 2016, 133, 701–711. [Google Scholar] [CrossRef]
  61. McGreevy, S.R. Lost in translation: Incomer organic farmers, local knowledge, and the revitalization of upland Japanese hamlets. Agric. Hum. Values 2012, 29, 393–412. [Google Scholar] [CrossRef]
  62. Bhandari, P.B. Rural livelihood change? Household capital, community resources and livelihood transition. J. Rural. Stud. 2013, 32, 126–136. [Google Scholar] [CrossRef] [PubMed] [Green Version]
  63. Li, J.; Wang, Y. Spatial coupling characteristics of eco-environment quality and economic poverty in Lüliang area. Chin. J. Appl. Ecol. 2014, 25, 1715–1724. [Google Scholar]
Figure 1. The sustainable livelihood framework developed by the Department for International Development (DIFD) (1999–2005).
Sustainability 12 06374 g001
Figure 2. The livelihood stability framework. The nodes represent the elements comprising the livelihood system. Each boundary indicates a bidirectional flow of livelihood capital. LCC: livelihood capitals coordination model.
Sustainability 12 06374 g002
Figure 3. Study area. The red spots represent the villages surveyed in Huanjiang County, Guangxi, China.
Sustainability 12 06374 g003
Figure 4. Livelihood capitals of immigrants and natives in Huanjiang County, China (2018).
Sustainability 12 06374 g004
Figure 5. Household land-use input-output index (short forms) for Huanjiang County.
Sustainability 12 06374 g005
Figure 6. Comparison of livelihood stability between immigrants and natives in Huanjiang County, China (2018).
Sustainability 12 06374 g006
Table 1. Livelihood stability indicators and explanation.
IndicatorsContentFormulaExplanation
Livelihood capitalsNatural, Physical, Financial, Human, Social Capital f t = ( P = 1 5 V p ) / Z f(t) stands for livelihood capitals values; Vp represents the values of natural, physical, financial, human, and social capitals, respectively (i.e., Z = 5).
Livelihood Strategy Income Diversity K inc = n = 1 s P n lnP n Based on the Shannon–Wiener diversity index, this suggests that the higher the income diversity, the more sources of income farmers will have. Thus, the proportion of these income tends to balance. Pn represents the rate of net income of farmers to total income from nth income source; S represents the number of income sources.
Response Capacity (Dependency)Income Dependency D inc = n = 1 s X n X n 1 X X 1 This involves the proportion of a farmer’s income from one source that is much higher than the sum of the others. (Precondition Xn > 1 and X > 1) Xn represents one net income per household from the nth income source; X represents total net income per household.
Resource Dependency D sou = N T This reflects the farmers’ dependency on natural resources. These usually include grain and cash crops, livestock, fruit production, forestry, collected feed, and firewood. N represents agricultural income per household; T indicates total household income.
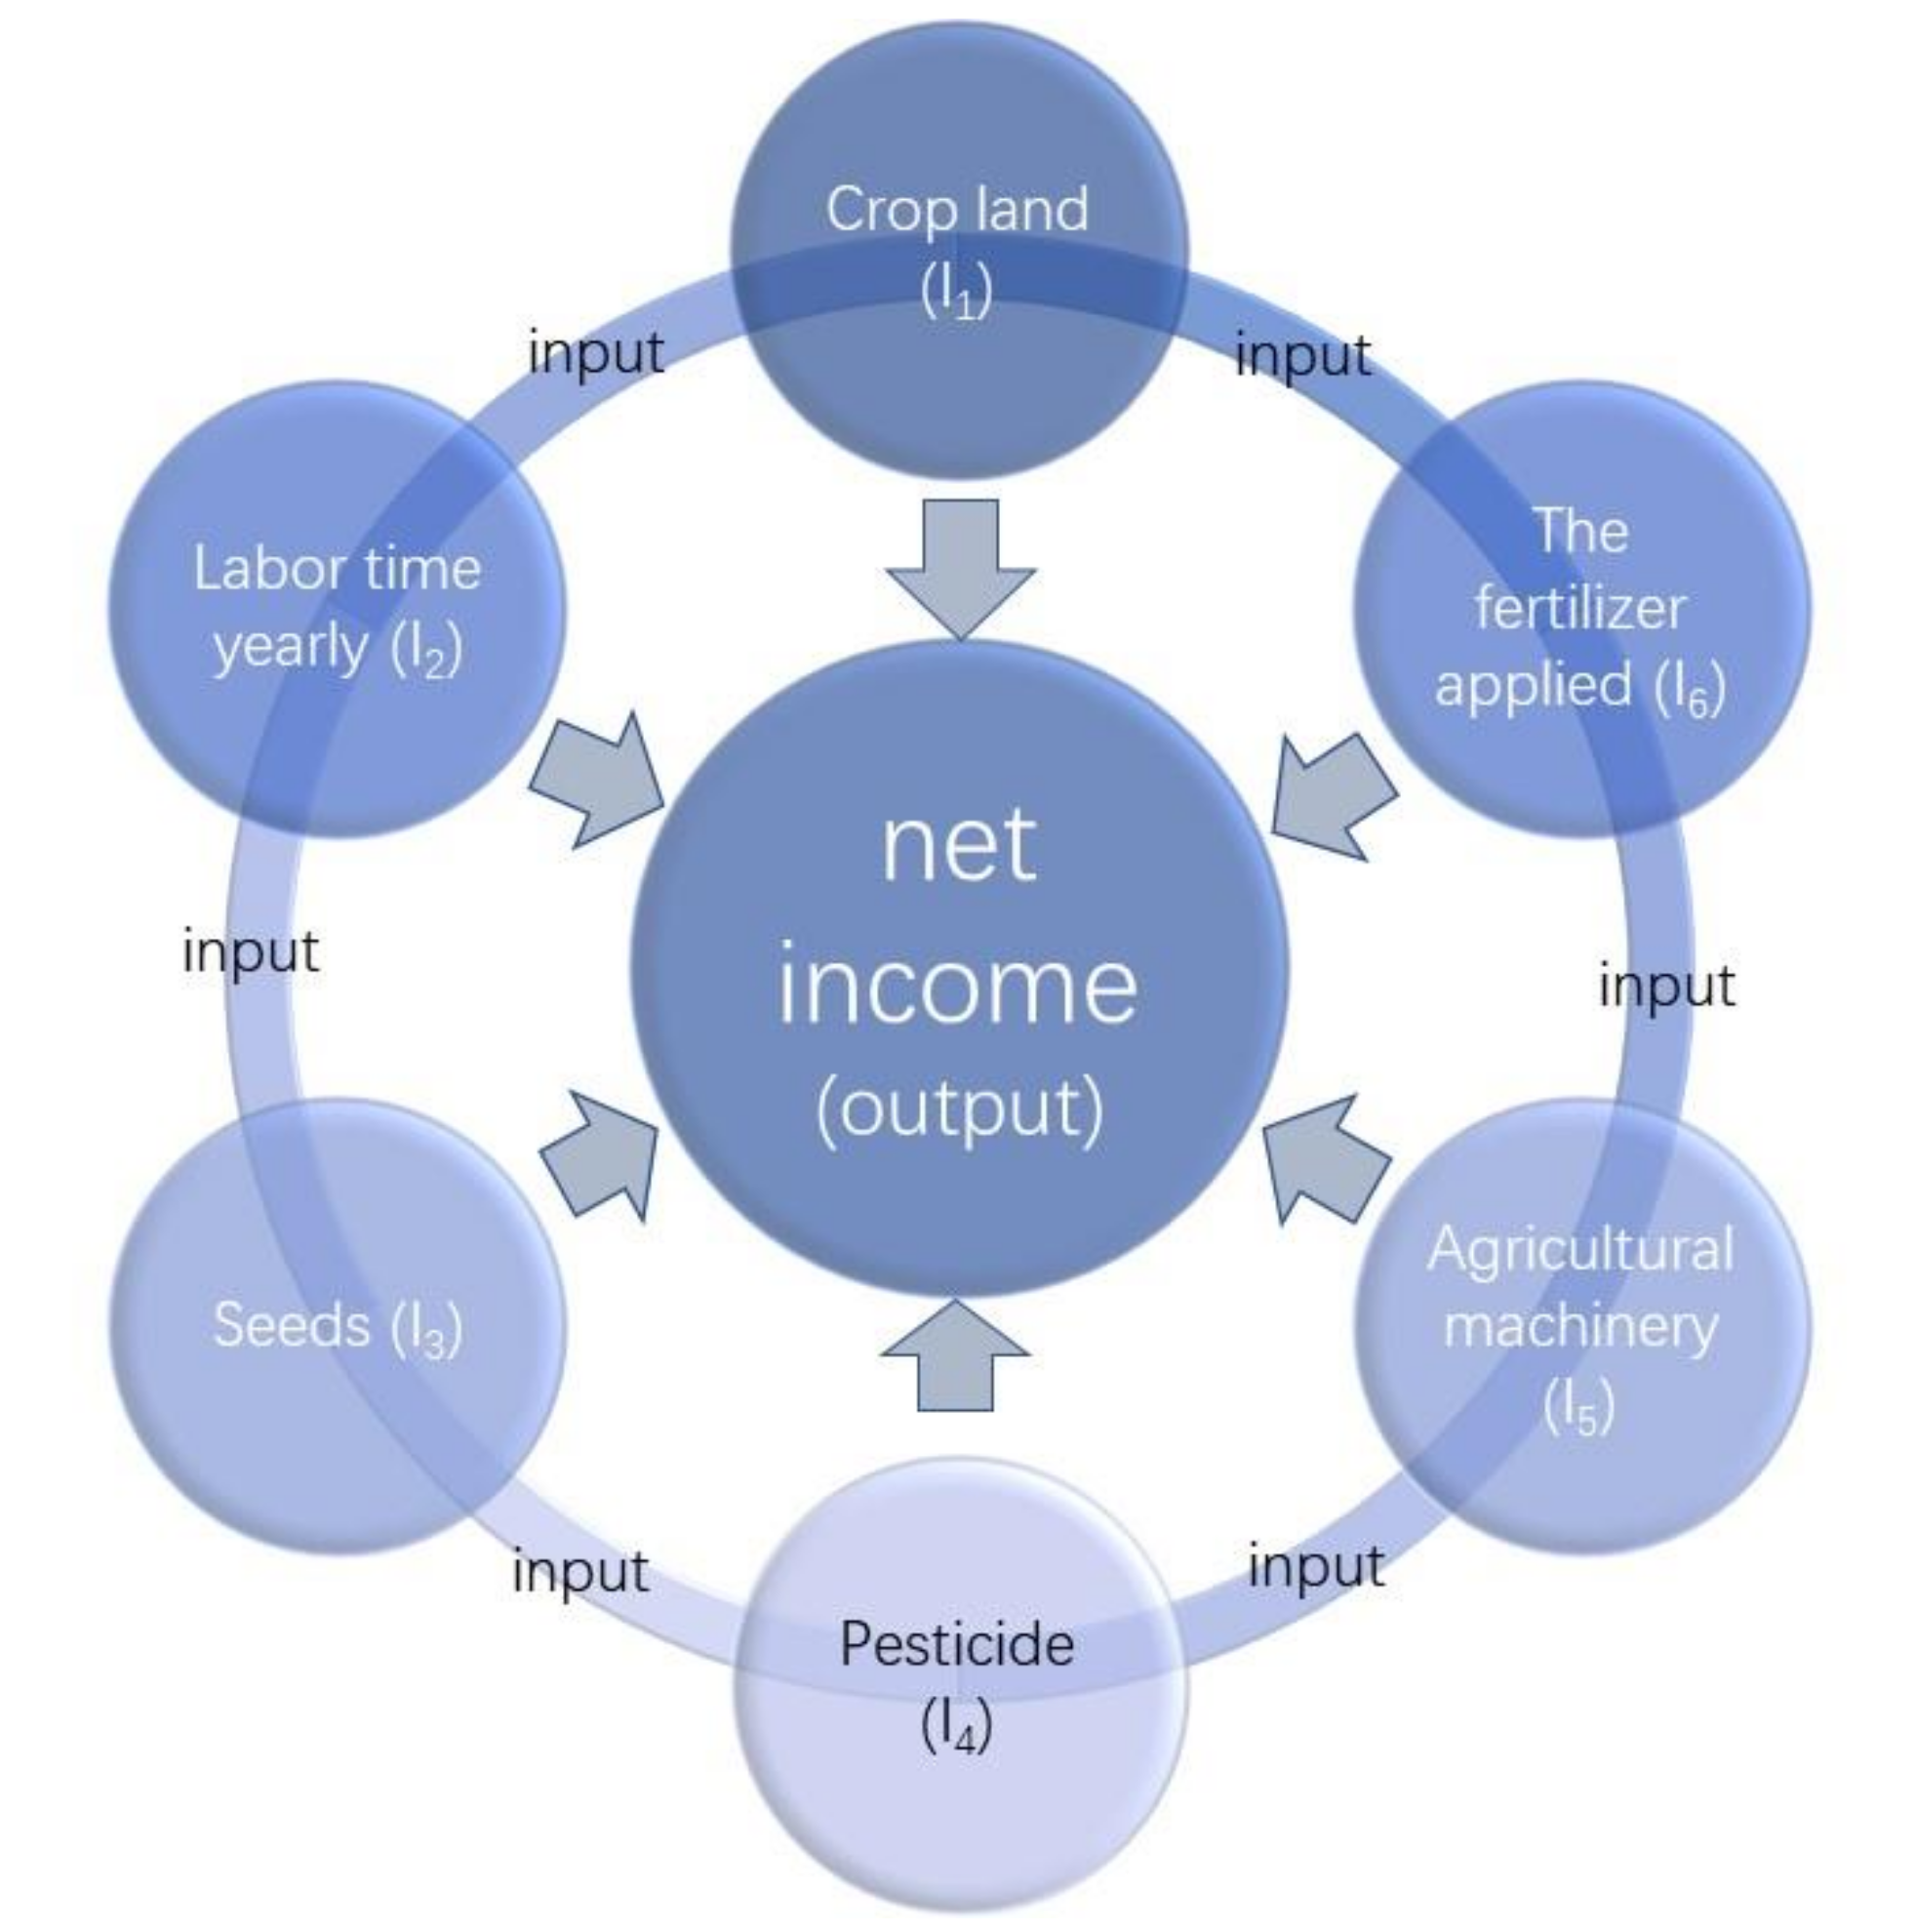
Land-Use Efficiency Land Intensification LevelData envelopment analysis (DEA) (CCR (I) model)It is important for farmers to assess land-use change and rational utilization as well as the potential economic effects. We developed the CCR (I) model (proposed by Charnes, Cooper and Rhodes in 1978) from the perspective of input and output using DEA-SOLVER PRO 5.0 software for data processing, which means from the perspective of input and the current level of output, comparing the proportion of ideal minimum input and actual input (Figure 3).
Table 2. The value of the livelihood stability indicators of natives and immigrants.
TypesLivelihood CapitalsLivelihood StrategyResponse CapacityLand-Use EfficiencyLivelihood Stability
Income DiversityIncome DependencyResource DependencyTotal
Immigrants0.62100.50500.69350.39180.54270.39220.5152
Natives0.64220.55280.6654 0.5178 0.59160.5881 0.5937

