Article

Measurement of Permeability in Horizontal Direction of Open-Graded Friction Course with Rutting

1
Research Institute of Industrial Technology, Pusan National University, Busan 46241, Korea
2
Faculty of Civil Engineering, Can Tho University of Technology, Can Tho 94000, Vietnam
3
Technology Development Center, Saman Corporation, Seoul 05774, Korea
4
Department of Civil and Environmental Engineering, Pusan National University, Busan 46241, Korea
*
Author to whom correspondence should be addressed.
Sustainability 2020, 12(16), 6428; https://doi.org/10.3390/su12166428
Submission received: 22 May 2020 / Revised: 3 July 2020 / Accepted: 15 July 2020 / Published: 10 August 2020
(This article belongs to the Section Sustainable Engineering and Science)

Abstract

:
Although the permeability of open-graded friction course (OGFC) materials in the transverse direction and the reduction in permeability associated with long-term traffic loading are important issues, they have remained under researched thus far. In this study, testing equipment and procedure were developed to evaluate the permeability of an OGFC specimen along the horizontal direction and its reduction due to rutting. Horizontal permeability tests were conducted by varying the hydraulic gradient of specimens with porosities of 19.6%, 15.6%, and 10.3%. The reduction in cross-section due to traffic loading was simulated via a wheel tracking test, and the permeability was subsequently evaluated. The reliability of test methodology was successfully verified; the tendency of the relationship between discharge velocity and hydraulic gradient was in good agreement with existing research results. The reduction in cross-sectional flow area due to rutting decreased and the horizontal permeability. The test results using developed testing equipment will enable efficient OGFC design.

1. Introduction

Problems such as decline in ground water levels, depletion of ground water resources, and increase in flood damage in densely developed areas are becoming increasingly common in the current modern society, because urbanization has led to a decrease in green and permeable areas and an expansion of impervious areas. Low impact developments (LIDs) have been suggested as a suitable approach for resolving such water-related environmental issues and for recovering the water circulation in urban environments. A LID considers the integrated hydrological system, administration of the small-scale distribution, source management, and diversity based on the water circulation characteristics under natural conditions, by applying the concept of better site design devised by Prince George’s County Department of Environmental Resources, Maryland, U.S.A., while planning integrated facilities. Furthermore, transitioning from centralized to decentralized managements and the corresponding applications are dynamically conducted in several countries. Practical examples of LID include the decentralized urban design in the Netherlands and the water-sensitive urban design in the U.K. [1,2]. Such LID facilities in metropolitan regions have been reviewed intensively to reduce the damage caused by floods and non-point source pollution [3,4,5,6].
Among the many factors that influence the coverage of impervious materials in densely developed areas, roads occupy approximately 30% of urban spaces. Roads are laid for the convenience of transportation, and the area of paved roads in urban spaces is approximately twice the area occupied by buildings [7]. Conventionally, paved roads negatively impact the water circulation system (WCS) by discharging rain water that falls on its surface, reducing ground water base flow, potentially increasing flood damage, transporting urban pollution to water sources, and interfering with the natural water circulation cycle. These problems are caused by the materials used to build roads or pavements, such as concrete and asphalt, which are impervious [8,9]. Open-graded friction course (OGFC), which is an LID technique used worldwide, has been suggested as a method for solving such water-related environmental issues and recovering urban water circulation [10].
The most important OGFC parameter during the hydrological design of LID-based road and traffic facilities is porosity [11,12,13]. The porosity of porous asphalt materials can be calculated by measuring the weight of a specimen when it is saturated and dry. Studies on the porosity of porous asphalts have been conducted by Montes et al. [14], Neithalath et al. [15], and Ahn et al. [16].
Further research on porous asphalt remains difficult owing to the problems of pore blockages and aggregate desorption encountered during the early stages. However, the use of OGFC has increased because it supports sustainable development, especially for WCSs [17]. The Federal Highway Administration (FHWA) proposed the consideration of a hydrological design, whereby rain water is discharged through permeable asphalt pavements, introduced a testing method [18,19,20,21], and indicated that additional research on pore blockages is required. The FHWA further stated that urban flooding and the volume of runoff rain water can be reduced by adjusting the thickness of the OGFC, adding a water permeable layer, and using a trench filled with aggregates [22].
Amirjani [23] suggested a permeation test that considered blockages, and Marcaida et al. [24] performed experimental research that assessed the OGFC blockage based on the size of the blockage particles. Suresha et al. [25] and Deo et al. [26] experimentally and theoretically investigated methods to prevent long-term blockages caused by pore clogging. Additionally, they developed the test equipment for evaluating the permeability of OGFCs. Fwa et al. [27,28] conducted experimental research on the permeability characteristics and the phenomenon of blockages. Ahn et al. [29] developed testing equipment that could be applied to permeable base courses, supplementary base courses, and other materials and was also capable of adjusting the hydraulic gradient via a method other than the falling head method. Furthermore, they simulated pore blockage by improving the strengths and addressing the weaknesses of the permeability test device for existing OGFCs (Figure 1).
Andrés-Valeri et al. [30] conducted a performance test of the permeable asphalt in the horizontal direction. However, since Andrés-Valeri et al. [30] installed slab-shaped samples on the floor and measured the amount of interflow induced by the rainfall intensity, it is difficult to evaluate the accurate permeability coefficient inside the pavement.
Research on the vertical rain water permeability in pavements and pavement pore blockage due to sediments has experienced excellent progress in recent years. In the case of an OGFC, it is presumed that the structure allows all drainage water to vertically pass through to the ground because it does not contain any impervious layers. In addition, all the layers of OGFCs are designed such that they feature permeable characteristics. However, research on the permeability of such pavements in the horizontal direction (i.e., transverse direction) is currently insufficient. Moreover, the current research status on testing equipment and analysis methods to predict and simulate the reduction in permeability caused by a reduction in pore size resulting from rutting that occurs, owing to long-term traffic loading, is inadequate. Therefore, the pore characteristics in the discharge direction and the influence of traffic loading on these pore characteristics must be considered during the design phase of OGFCs. Furthermore, permeability should be evaluated to analyze the phenomenon of pore blockage along the permeation direction and that caused by traffic loading and also for the standardization of verification plans and simulation methods and the development of standardized testing equipment.
This study is aimed at developing laboratory-scale equipment to evaluate the permeability of an OGFC specimen in the horizontal direction (by varying the hydraulic gradient) and the pore reduction caused by traffic loading. For this purpose, the compositions of the newly developed testing equipment, procedure, and method are described. A permeability test in the horizontal direction along the hydraulic gradient was conducted based on the proposed testing method, and the pore reduction caused by rutting due to traffic loading was simulated via a wheel tracking (WT) test. Additionally, the permeability was evaluated. Based on the test results, the practical applicability of OGFC and additional research topics are discussed.

2. Materials

OGFC specimens were designed with open-graded aggregate and asphalt binder based on SUPERPAVE (superior performing asphalt pavement) [31]. Specifications of OGFC mixtures and the properties of the asphalt binder used are as shown in Table 1 and Table 2, respectively.
The nominal maximum size used for OGFC mixtures was 10 mm and the gradations are shown in Figure 2. Specimens with dimensions of 300 × 300 × 50 mm (width × length × height) were molded according to the KS F 2374 standard [33]. The maximum theoretical density was calculated by the methods of KS F 2366 [34] and AASHTO T-209 [35], and the porosity was calculated by the ratio of the measured density and the theoretical density of the sample. The target porosities of the specimen were considered as 20%, 15%, and 10%, and the actual porosities were measured to be 19.6%, 15.6%, and 10.3%, respectively.

3. Test Equipment and Method

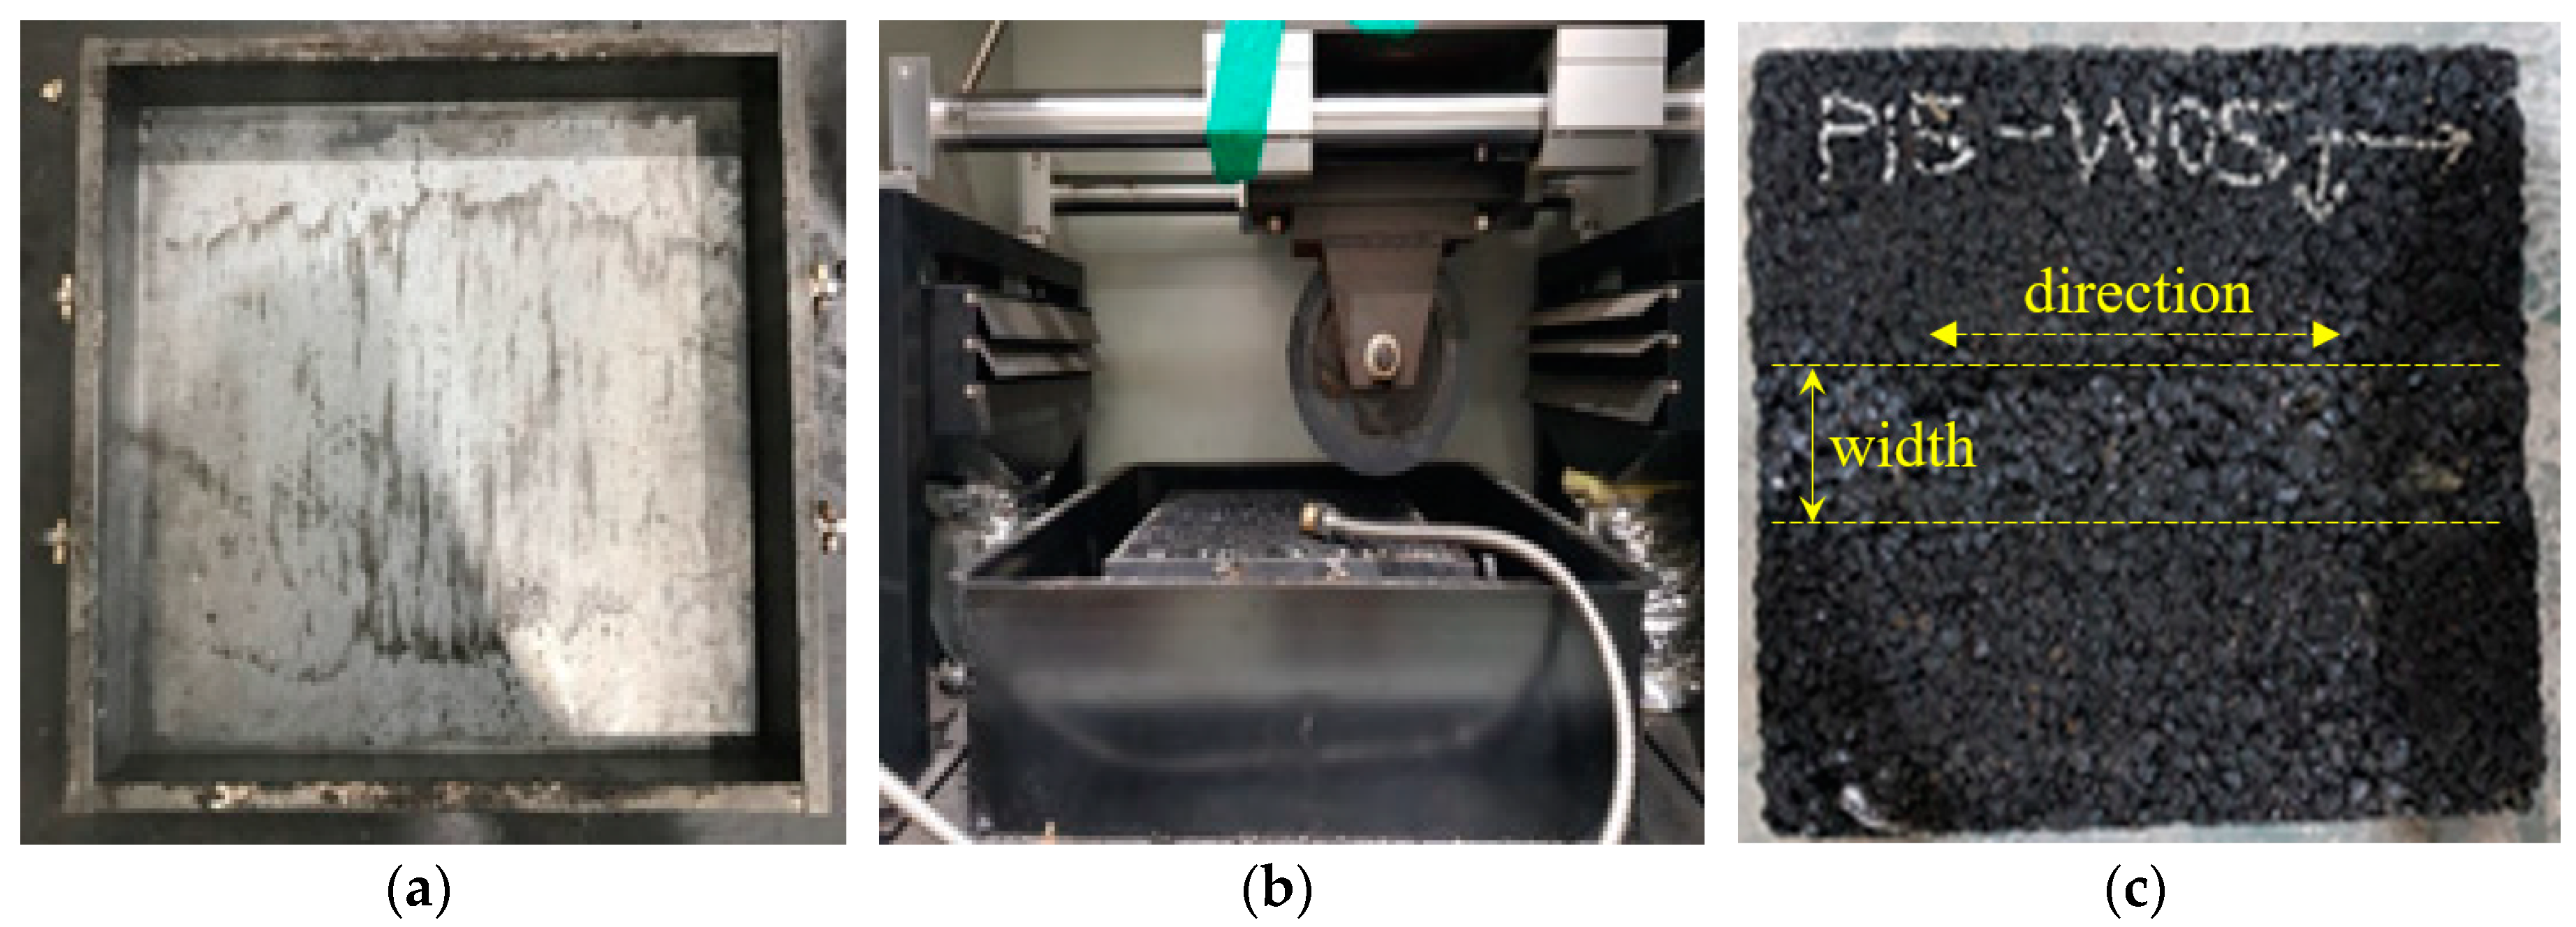
3.1. Wheel Tracking Test

3.1.1. Test Equipment

OGFC composed of porous asphalt material exhibits a viscoelastic behavior under the influence of traffic loading and high temperatures. The pavement material maintains its strength at low temperatures, whereas the mixture becomes soft at high temperatures. Applying a load on the asphalt pavement at high temperatures results in rutting, which permanently transforms the surface characteristics and reduces pavement permeability.
Therefore, pore reduction due to the rutting caused by long-term traffic loading was simulated in this study by using WT test equipment. During the test, the dynamic stability was calculated (Equation (1)) to evaluate the resistance of the pavement to rutting. Dynamic stability occurs when the deformation curve becomes a nearly straight line and the rate of deformation change approaches zero (i.e., the deformation between 45–60 min), as shown in Figure 3. The test was performed in accordance with the KS F 2374 standard [33] and utilized a WT compaction machine and measuring machine (Figure 4). Three specimens with porosities of 10.3%, 15.6%, and 19.6% were subjected to rutting until each specimen reached a rut depth of 4, 8, and 12 mm, respectively. Thereafter, the permeability was evaluated.
D S = 42 × t 2 t 1 d 2 d 1   ( t i m e s / m m )
where d1 (mm) and d2 (mm) represent the deformations at t1 (45 min) and t2 (60 min), respectively.

3.1.2. Specimen Preparation

The test specimens were prepared in accordance with the following steps:
(1)
Preparation of the WT specimen mold (Figure 5a);
(2)
Preparation of the OGFC specimen; shape: square, length of one side: 300 ± 5 mm, and thickness: 50 mm;
(3)
The maximum compaction load is 8820 N [33]. Compact the specimen up to 100% ± 1% of the standard density of the Marshall stability test [36];
(4)
Curing the compacted specimen at room temperature for 12 h;
(5)
Curing the specimen at a constant temperature of 60 ± 0.5 °C for 5 h before beginning the test. Maximum curing time should be 24 h;
(6)
Positioning a testing wheel (width: 50 mm) at the center of the specimen and applying a parallel reciprocating wheel load of 686 N in the vehicle travel direction with a frequency of 42 times per minute at the center of the specimen (Figure 5b); and
(7)
Measuring and recording the depth of rutting at 1, 5, 10, 15, 30, 45, and 60 min. Complete the test when 4, 8, and 12 mm ruts have been generated in the specimens with porosities of 10.3%, 15.6%, and 19.6%, respectively (Figure 5c).

3.2. Horizontal Permeability Test

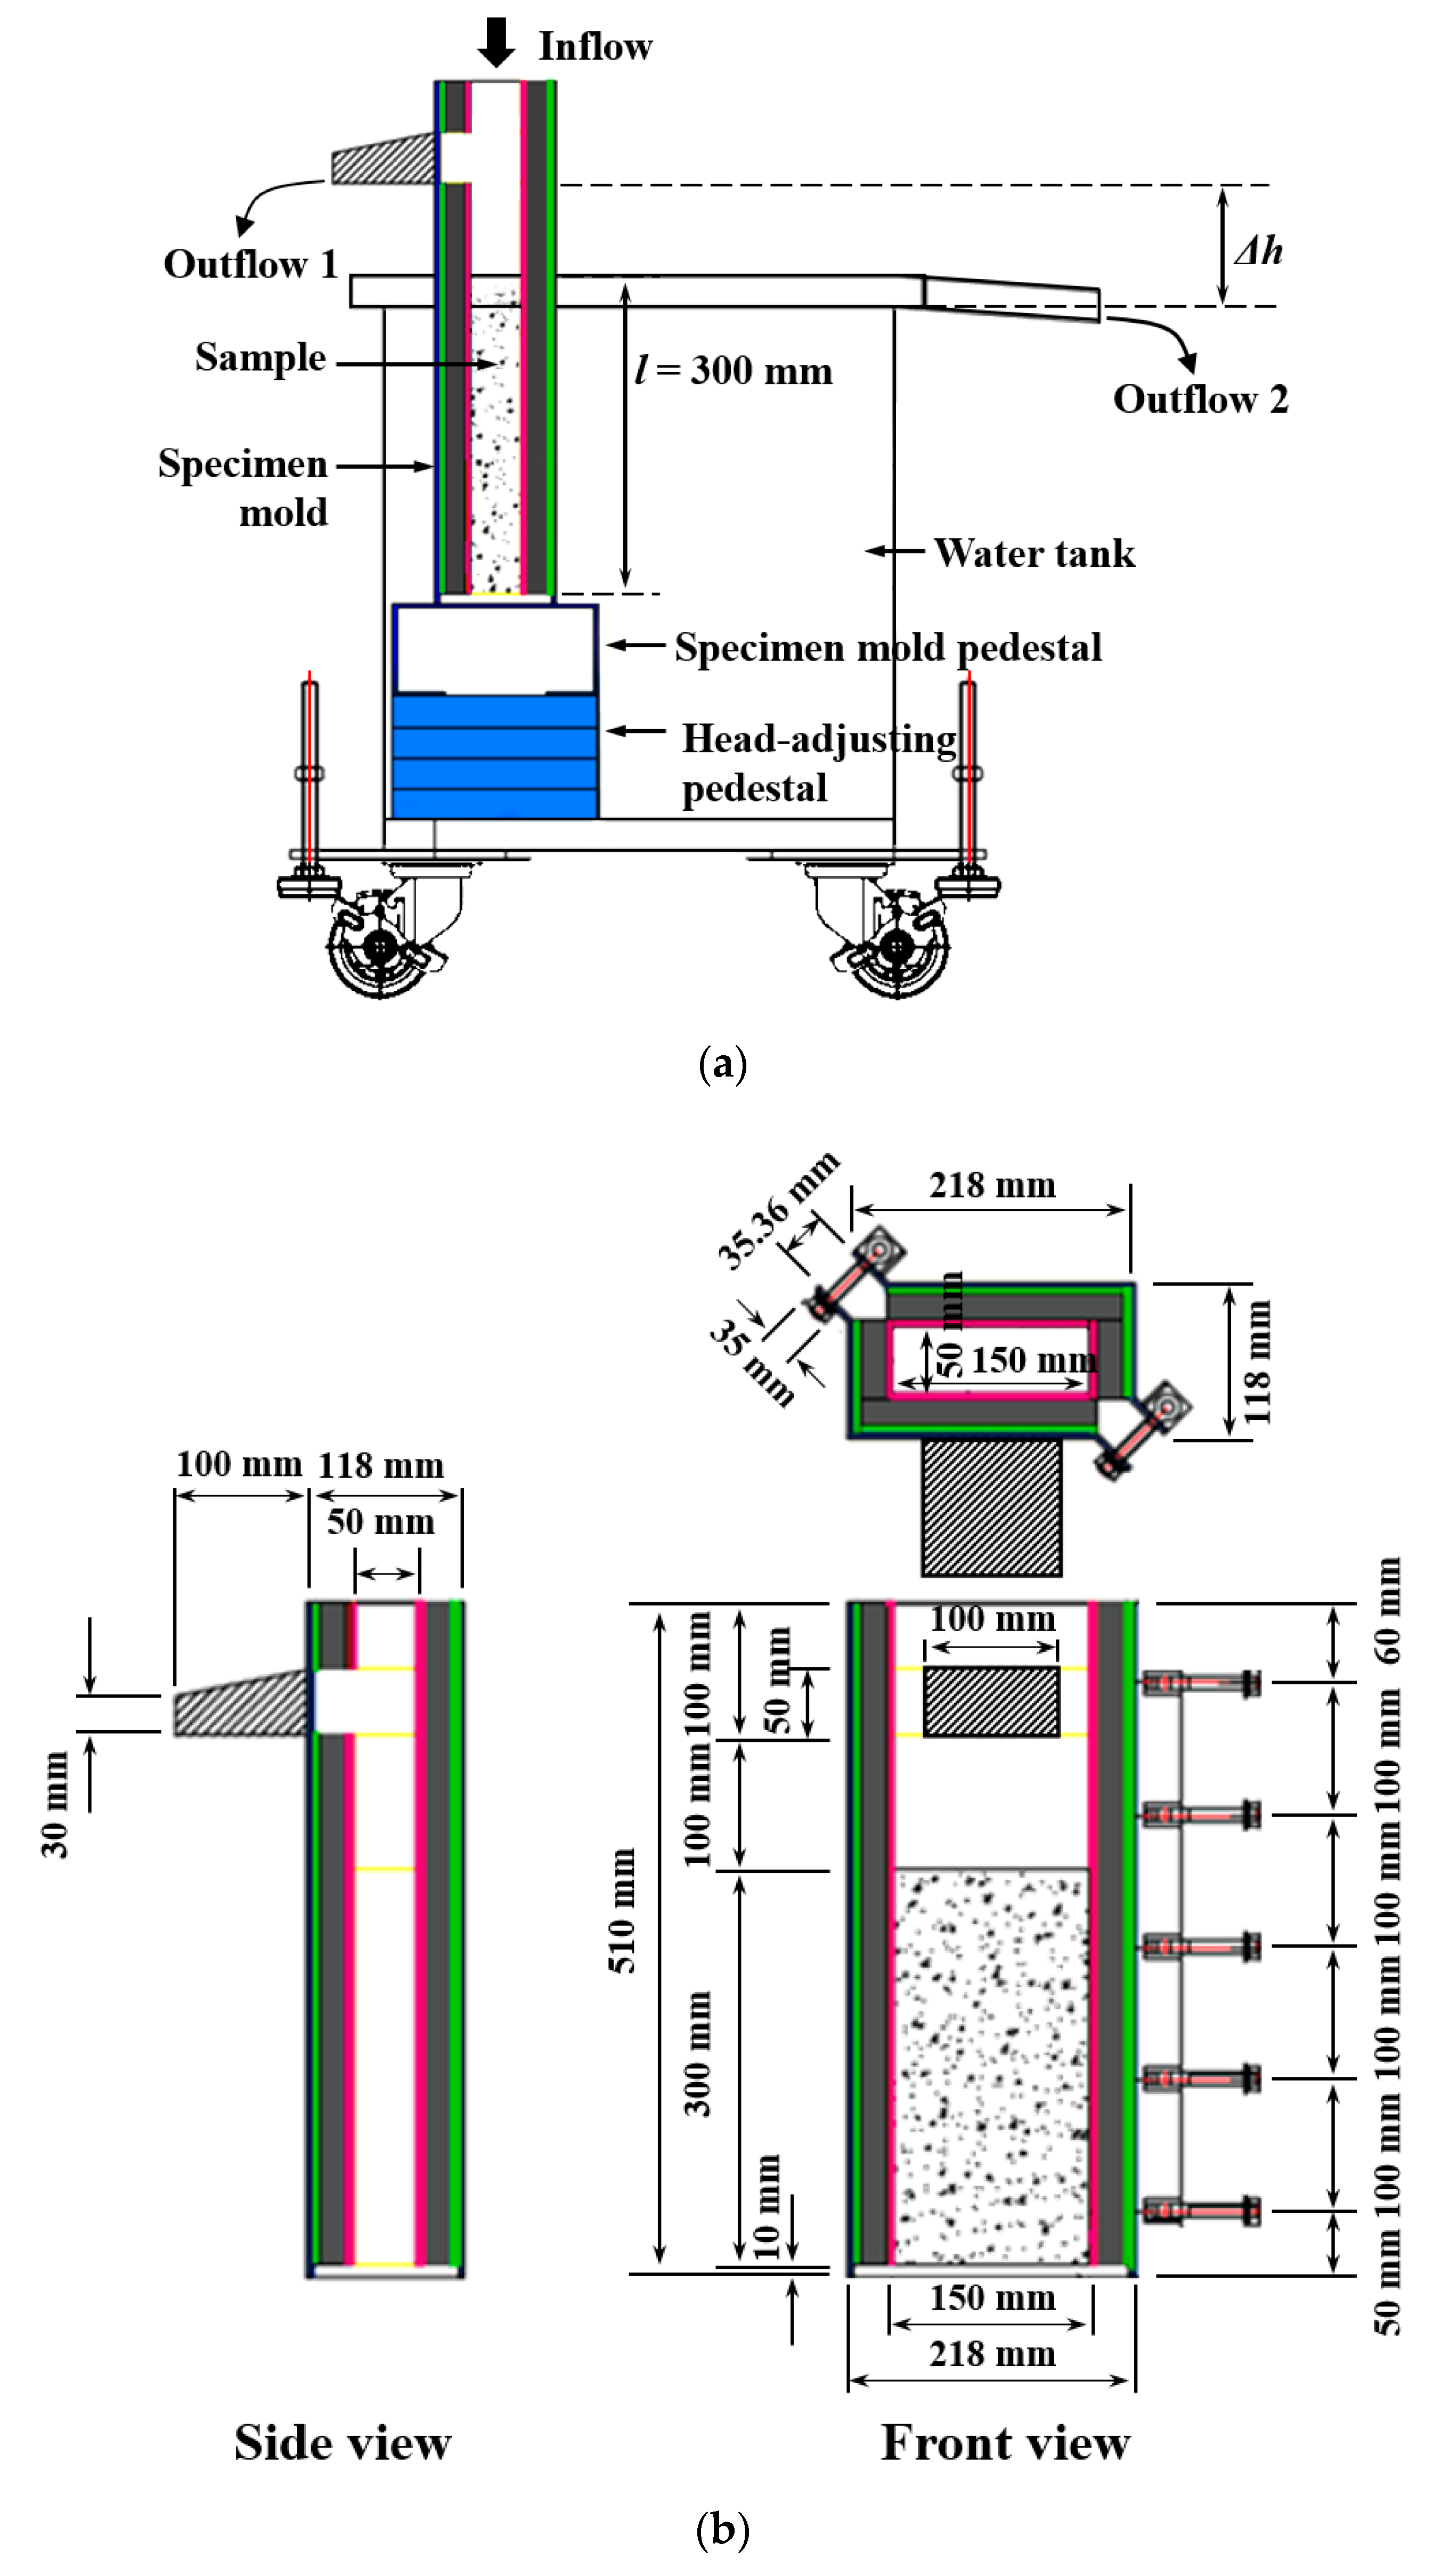
3.2.1. Equipment Development

The testing equipment developed in this study was used to evaluate the permeability in the horizontal (i.e., road transversal direction) and vertical directions of the OGFC, unlike the existing testing equipment, which only evaluates the permeability in the vertical direction.
The configuration of the testing equipment is shown in Figure 6a. The features of this testing equipment include the ability to evaluate non-linear permeability characteristics along the horizontal direction of OGFCs and to adjust the hydraulic gradient. This testing equipment consists of a specimen-fixing mechanism, water tank, and head-adjusting part. The hydraulic gradient can be adjusted by positioning the specimen-fixing mechanism at the top of the head-adjusting part in the water tank.
(1)
Specimen Mold Fixture
A specimen mold fixture was designed to attach the test specimen to the testing apparatus (Figure 6b). However, it is additionally capable of implementing the test for specimens of various dimensions based on the size of the water tank. The test specimen can be firmly fixed using bolts; moreover, as materials that maintain the watertight characteristics of rubber or silicone are used, the tolerance is not affected by water leakage between the specimen and the fixing part. In addition, stainless steel (thickness of 3.0 mm) was used to fabricate the specimen mold fixture to prevent corrosion and deformation.
(2)
Water Tank
The water tank had a dimension of 500 × 500 × 530 mm (width × length × height), as shown in Figure 6c. The tank was used to saturate the specimen and store and discharge the spilled water that penetrated the specimen. Water overflowed through the outlet if the volume of water that passed through the specimen exceeded the capacity of the water tank; in such cases, the volume of water that passed through the specimen was considered as the flow.
(3)
Head-Adjusting Part
The head-adjusting part consisted of head-adjusting pedestals of various heights (30–60 mm) and a specimen-fixing support, as shown in Figure 6d. This part controlled the hydraulic gradient using the head-adjusting pedestals. A sufficient cross-sectional flow area was provided at the specimen-fixing support such that any excess water that penetrated the specimen could be smoothly routed to the water tank to minimize its influence on water flow.

3.2.2. General Procedures

The testing equipment for horizontal permeability is based on constant heads. Permeability is evaluated by measuring the flow that penetrated the OGFC specimen over a specific time interval, by varying the hydraulic gradients against a specimen with a specific cross section and thickness. The testing procedure is performed in accordance with the following steps (Figure 7).
(1)
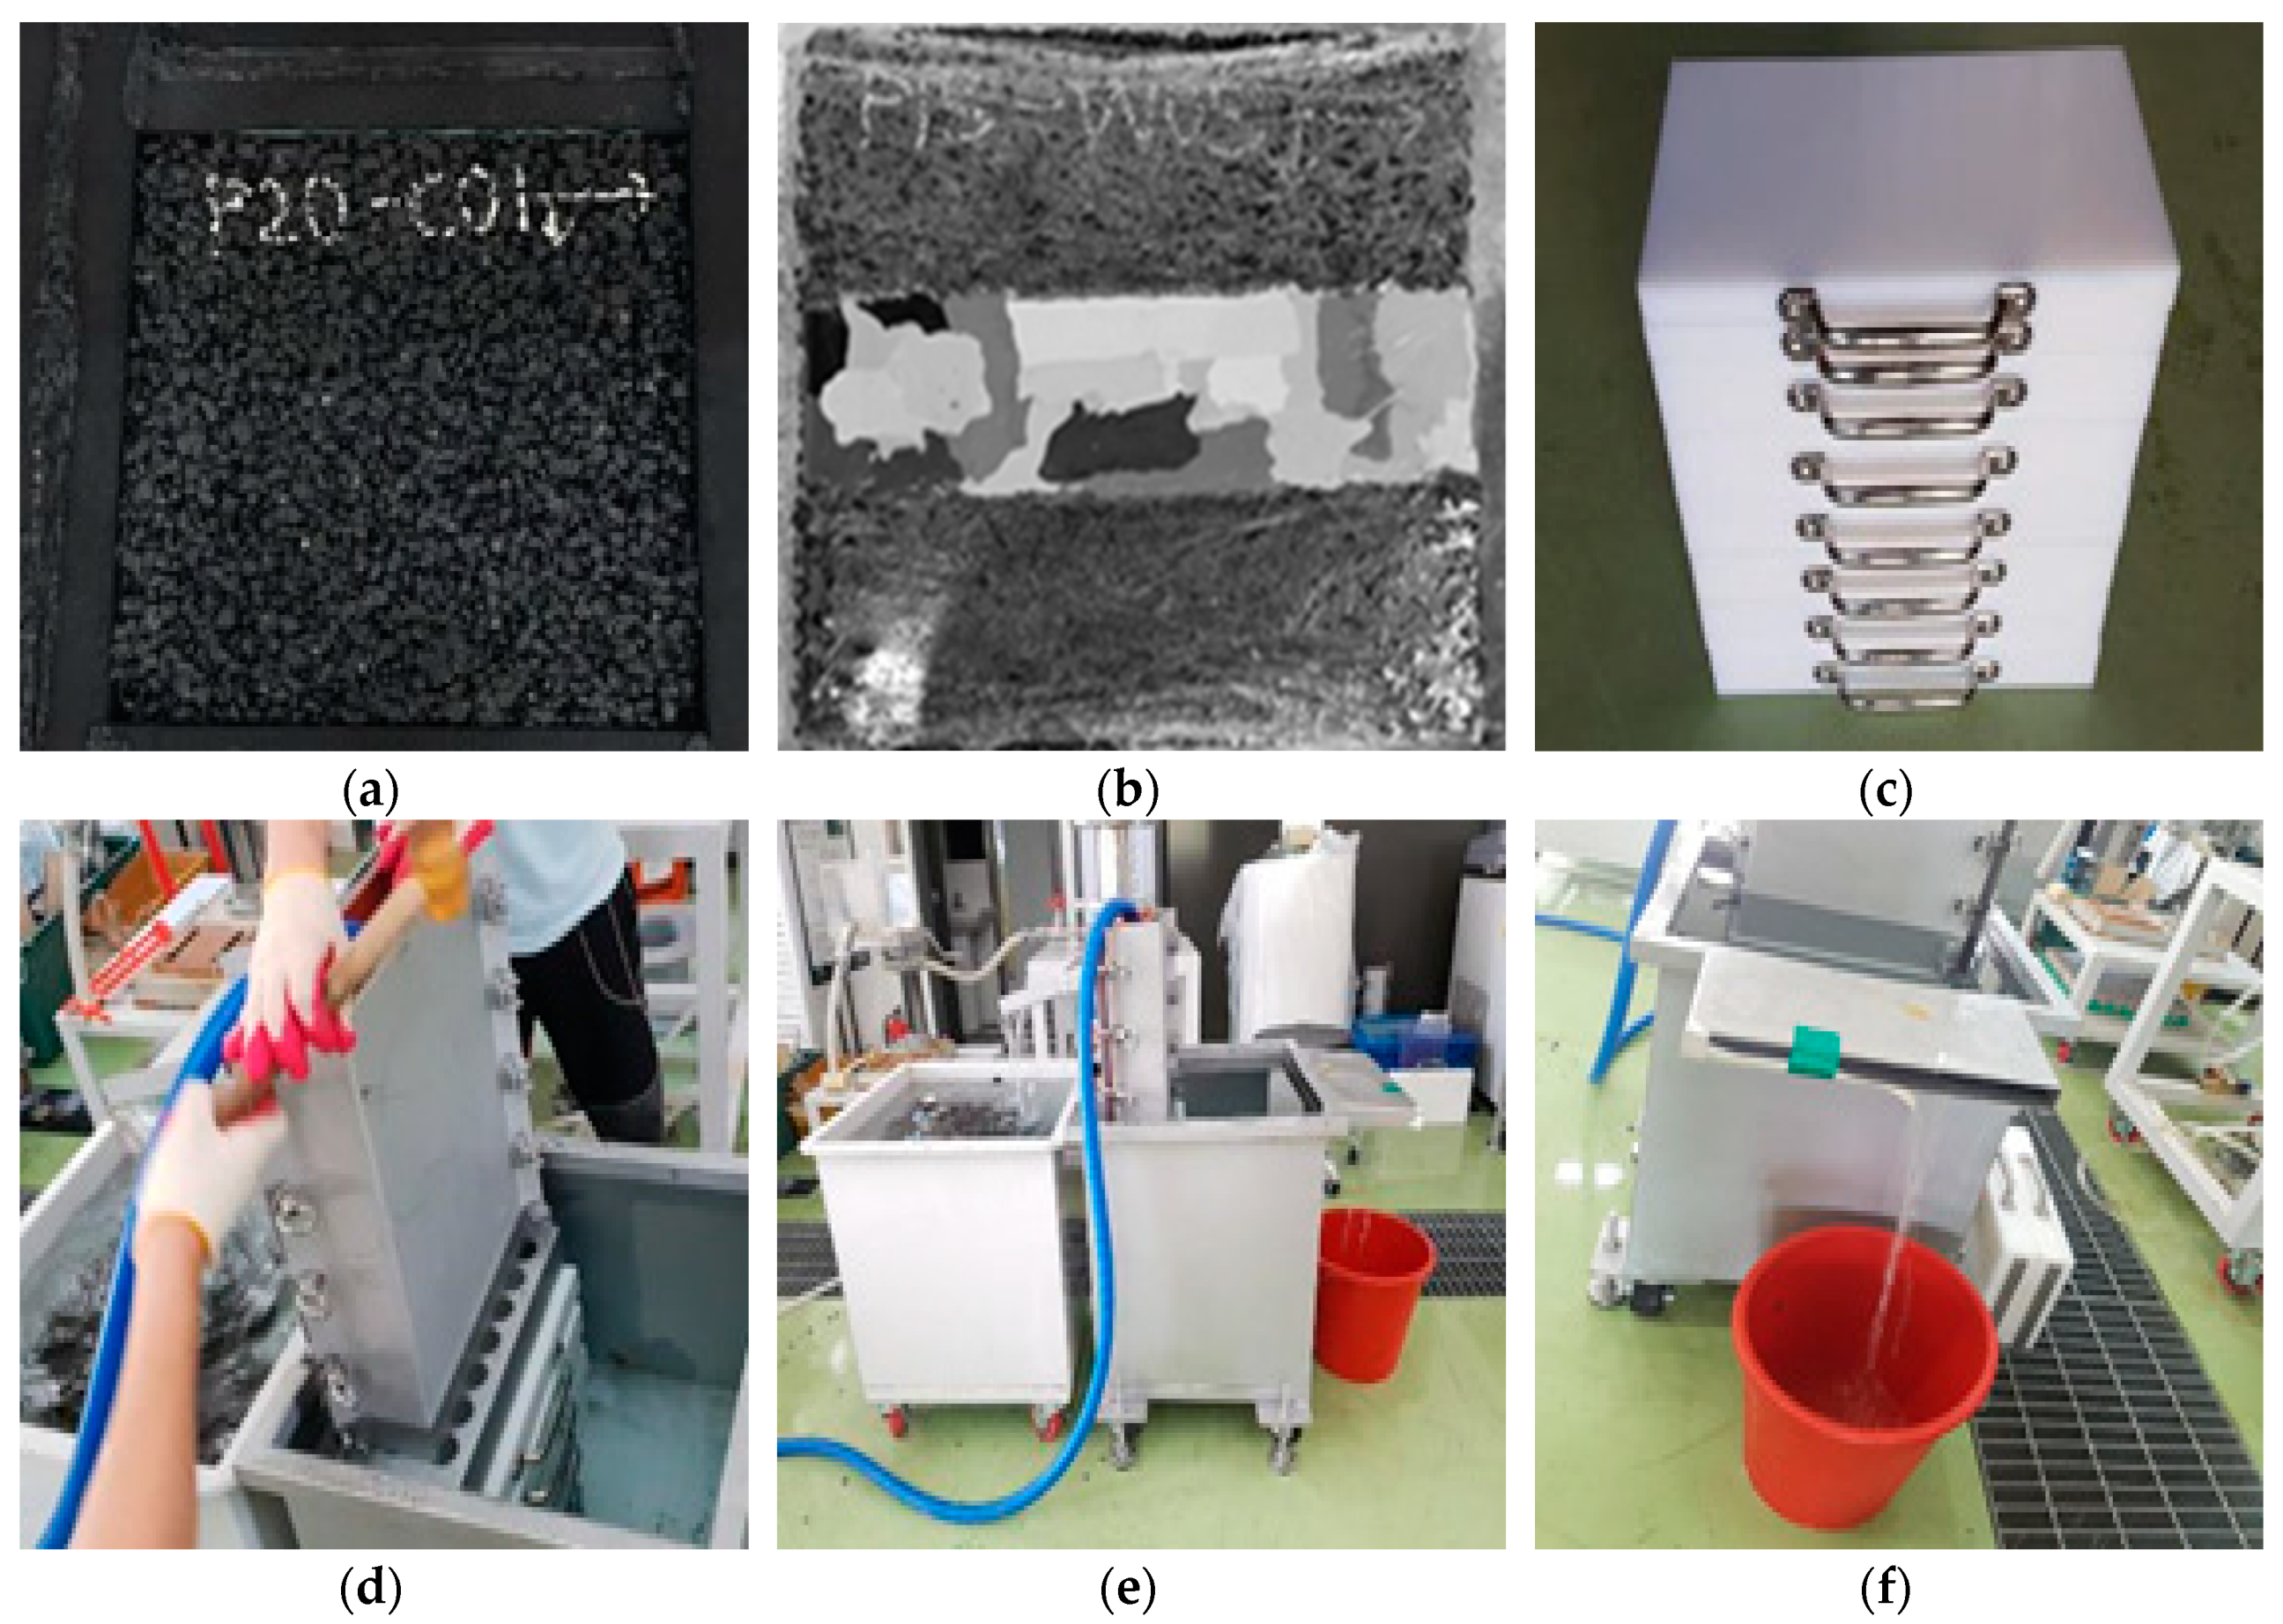
Mark the direction in which the horizontal permeability will be evaluated in the test specimen (Figure 7a).
(2)
Set the hydraulic gradient using the head-adjusting pedestals (Figure 7c) and set up the testing specimen by mounting the specimen on the specimen mold fixture (Figure 7d).
(3)
Commence water penetration and saturating of the test specimen by injecting water at the top of the specimen mold fixture and discharge excess water to the water tank (Figure 7e).
(4)
Measure the amount of overflow per hour and evaluate the horizontal permeability if water accumulates and the water level becomes uniform, based on the overflow (Figure 7f).
(5)
Rotate the test specimen by 90° and repeat the test procedure shown in Figure 7d–f.
The head (Δh) is the ratio of hydraulic gradient (i) to the specimen height (l). The testing equipment developed for this study controls the head (Δh) by positioning the head-adjusting pedestals, specimen-fixing support, and specimen mold fixture in the water tank. The applicable maximum height of the head is 490 mm, because it is restricted by the height of the water tank, and the test can be performed for various hydraulic gradients. The hydraulic gradients with varying thicknesses of the head-adjusting pedestals are listed in Table 3. The minimum and maximum hydraulic gradients (i) that can be tested are 0.1 and 1.3, respectively.
Darcy’s law assumes that the relationship between the discharge velocity and the hydraulic gradient is linear, as expressed in Equation (1), which explains the permeability of typical soil or soil materials, i.e., the discharge velocity (v) is proportional to the hydraulic gradient (i). However, Fwa et al. [28], Huang et al. [37], Coleri et al. [38], and Liu et al. [39] proved through experimental research that the relationship between discharge velocity and the hydraulic gradient is non-linear, because the porous asphalt material is large.
v = k i n
where k = coefficient of permeability or permeability (mm/s), i = hydraulic gradient, and n = experimental coefficient.
This study measured the horizontal permeability in the longitudinal direction (i.e., the driving direction) of the road and the lateral direction across the road to evaluate the permeability of OGFC. The values obtained were averaged and calculated using the following equation:
k = 10 3 × V l A h t
where v = volumetric flow of water (mm3), l = sample length (mm), A = sample area (mm2), h = differential head (mm), and t = time for flow (s).

3.2.3. Permeability after Rutting

In the process of installing a sample in the specimen mold fixture after rutting during the test to determine the permeability, impermeable materials were filled in the space to prevent water from flowing into the space generated by the rutting. The following steps were performed to determine the permeability of the test specimen after rutting.
(1)
Prepare the specimen with rutting via the WT test.
(2)
Seal the rutted portion with impermeable material (Figure 7b).
(3)
Perform the horizontal permeability test.
(4)
Measure the horizontal permeability.
To evaluate the horizontal permeability of the OGFC corresponding to hydraulic gradient and rutting, the test was conducted following the sequences in Figure 8.

4. Test Results

4.1. Horizontal Permeability

Horizontal permeability tests were performed on the OGFC specimens with porosities of 19.6%, 15.6%, and 10.3%. Each test was conducted in accordance with the described test procedure for the horizontal permeability, using the testing equipment developed. For each sample, the permeability tests were conducted at least three times, and the average of discharge velocities and permeabilities from multiple tests were presented in Figure 9 and Figure 10. Figure 9 show that the discharge velocity increased as the hydraulic gradient increased, and the relationship between hydraulic gradient and discharge velocity is non-linear, which is in accordance with the results of Fwa et al. [28], Huang et al. [37], Coleri et al. [38], and Liu et al. [39]. The permeability gradually decreased as the hydraulic gradient increased as presented in Figure 10. As porosity decreased, the horizontal permeability also decreased.

4.2. Horizontal Permeability after Rutting

The permeability was evaluated after making ruts with depths of 4, 8, and 12 mm which simulate the changes in OGFC cross-sections due to long-term traffic loading. Two values of hydraulic gradients, 0.1 and 0.5, were adopted in the tests. To investigate the relative differences among specimens with and without ruts, the permeabilities were normalized by the permeability of the same sample with no rut and defined as the horizontal permeability ratio. Figure 11 and Figure 12 present the horizontal permeability ratios with respect to rut depths, for hydraulic gradients of 0.1 and 0.5, respectively. The results indicated that the horizontal permeability decreased as rutting depth increased; the reduction in cross-sectional flow area caused the decrease in the porosity. In addition, the reduction in horizontal permeability was severer when the hydraulic gradient was smaller.

5. Practical Implications

As mentioned in Section 4, the proposed horizontal permeability testing equipment yielded similar results to those reported by Fwa et al. [28], Huang et al. [37], Coleri et al. [38], and Liu et al. [39]. In addition, the testing equipment and procedures were developed and successfully applied to evaluate the permeability of OGFC specimens in the horizontal (Figure 13a) direction. As the permeability in the horizontal direction could be evaluated by considering the geometric design of the road, it can be applied to the design of OGFCs if the pavement is required to drain water laterally to the side rather than only to the permeable base course vertically.
Roads are designed differently depending on their function and scale (Table 4), and the width of vehicle tires which transfers different wheel loads to the OGFC. The ratio of widths of the specimen (300 mm) and wheel (50 mm) used in WT test was 0.167, which reflects typical range of values in the field. If one assumes a passenger car driving over a local road, the width of wheel may be approximately 0.215 m to 0.265 m and the lane width 3.0 m, resulting in the ratio of wheel width to lane width of 0.143 to 0.177.
This study provided an opportunity to develop an improved testing method that considered factors influencing the permeability of OGFCs, such as horizontal permeability and permeability reduction caused by rutting. Our results are expected to ultimately enable the design and maintenance of efficient OGFCs in the future (Figure 13b).

6. Conclusions

This study developed a permeability testing equipment and procedure to evaluate the permeability of OGFCs in the horizontal direction. Horizontal permeability tests were conducted with varying the hydraulic gradient for specimens with porosities of 19.6%, 15.6%, and 10.3%. The reduction in cross-section of OGFC due to traffic loading was simulated via a wheel tracking test, and the permeability was subsequently evaluated.
After testing OGFCs with no rut, it was found that the hydraulic gradient and discharge velocity is non-linear. The permeability of OGFC was higher when the hydraulic gradient was smaller but the porosity was higher. The reliability of test methodology was successfully verified; the tendency of the relationship between discharge velocity and hydraulic gradient was in good agreement with existing research results.
The rut depth of 4, 8, and 12 mm were made in OGFC specimens to simulate the decrease in cross-section caused by the rutting produced from long-term traffic loading. The results of constant head tests with rutted specimens showed that the horizontal permeability decreases owing to a decrease in the cross-sectional flow area. It would be necessary to incorporate, in design, the effect of the change in permeability due to long-term traffic loading.
The horizontal permeability of OGFC and permeability reduction due to rutting are important considerations in hydrological design. These can be evaluated using the testing equipment and procedure proposed in this study.

Author Contributions

Conceptualization, J.A.; investigation, J.Y., T.H.N., E.L., and Y.L.; methodology and validation, J.Y., and J.A.; writing—original draft, J.Y., T.H.N., E.L., Y.L., and J.A.; writing—review and editing, J.Y., T.H.N., E.L., Y.L., and J.A. All authors have read and agreed to the published version of the manuscript.

Funding

This research was supported by a grant from the Technology Advancement Research Program (grant No. 20CTAP-C152124-02) funded by the Ministry of Land, Infrastructure, and Transport of the Korean government.

Conflicts of Interest

The authors declare no conflict of interest.

References

  1. Thorsten, S.; Lorenzo, C. Integrating decentralized rainwater management in urban planning and design: Flood resilient and sustainable water management using the example of coastal cities in The Netherlands and Taiwan. Water 2013, 5, 593–616. [Google Scholar] [CrossRef] [Green Version]
  2. Morgan, C.; Bevington, C.; Levin, D.; Robinson, P.; Davis, P.; Abbott, J.; Simkins, P. Water Sensitive Urban. Design in the UK; CIRIA, Classic House: London, UK, 2013; pp. 1–20. [Google Scholar]
  3. Collins, K.A.; Hunt, W.F.; Hathaway, J.M. Hydrologic comparison of four types of permeable pavement and standard asphalt in Eastern North Carolina. J. Hydrol. Eng. 2008, 13, 1146–1157. [Google Scholar] [CrossRef]
  4. Damodaram, C.; Giacomoni, M.H.; Khedun, C.P.; Holmes, H.; Ryan, A.; Saour, W.; Zechman, E.M. Simulation of combined best management practices and low impact development for sustainable stormwater management. J. Am. Water Resour. Assoc. 2010, 46, 907–918. [Google Scholar] [CrossRef]
  5. Fassman, E.A.; Blackbourn, S. Urban runoff mitigation by a permeable pavement system over impermeable soils. J. Hydrol. Eng. 2010, 15, 475–485. [Google Scholar] [CrossRef]
  6. Ahiablame, L.M.; Engel, B.A.; Chaubey, I. Effectiveness of low impact development practices: Literature review and suggestions for future research. Water Air Soil Pollut. 2012, 223, 4253–4273. [Google Scholar] [CrossRef]
  7. Hinman, C.; Wulkan, B. Low Impact Development: Technical Guidance Manual for Puget Sound; Washington State University Extension & Puget Sound Partnership: Tacoma, WA, USA, 2012; pp. 1–365. [Google Scholar]
  8. Brattebo, B.O.; Booth, D.B. Long-term stormwater quantity and quality performance of permeable pavement systems. Water Res. 2003, 37, 4369–4376. [Google Scholar] [CrossRef]
  9. Smith, R.D. Permeable Interlocking Concrete Pavements—Design, Specifications, Construction, Maintenance; Interlocking Concrete Pavement Institute: Washington, DC, USA, 2011; pp. 1–48. [Google Scholar]
  10. Kumar, K.; Kozak, J.; Hundal, L.; Cox, A.; Zhang, H.; Granato, T. In-situ infiltration performance of different permeable pavements in a employee used parking lot—A four-year study. J. Environ. Manag. 2016, 167, 8–14. [Google Scholar] [CrossRef]
  11. Tennis, P.; Leming, M.L.; Akers, D.J. Pervious Concrete Pavements; Engineering Bulletin 302.02; Portland Cement Association (PCA): Skokie, IL, USA; National Ready Mixed Concrete Association: Silver Spring, MD, USA, 2004; pp. 1–32. [Google Scholar]
  12. Fleming, P.R.; Frost, M.W.; Lambert, J.P. Review of lightweight deflectometer for routine in situ assessment of pavement material stiffness. Transp. Res. Rec. 2007, 2004, 80–87. [Google Scholar] [CrossRef] [Green Version]
  13. ACI. 522R-10 Report on Previous Concrete; American Concrete Institute (ACI): Farmington Hills, MI, USA, 2010; pp. 1–37. [Google Scholar]
  14. Montes, F.; Valavala, S.; Haselbach, L.M. A new test method for porosity measurements of portland cement pervious concrete. J. ASTM Int. 2005, 2, 1–13. [Google Scholar] [CrossRef]
  15. Neithalath, N.; Sumanasooriya, M.S.; Deo, O. Characterizing pore volume, sizes, and connectivity in pervious concretes for permeability prediction. Mater. Charact. 2010, 61, 802–813. [Google Scholar] [CrossRef]
  16. Ahn, J.; Lee, Y.; Vaidya, S.; Kim, J.-H.; Lee, S.-W. Estimation the porosity of pervious concretes based on X-Ray CT and submerged weight. J. Korean Soc. Hazard Mitig. 2013, 13, 77–81. [Google Scholar] [CrossRef] [Green Version]
  17. Thelen, E.; Howe, L.F. Porous Pavement; The Franklin Institute Press: Philadelphia, PA, USA, 1978; pp. 1–98. [Google Scholar]
  18. ASTM. D 3203/D 3203M-11. In Standard Test Method for Percent Air Voids in Compacted Dense and Open Bituminous Paving Mixtures; ASTM: Philadelphia, PA, USA, 2011. [Google Scholar]
  19. AASHTO. T 305-14. In Standard Method of Test for Determination of Draindown Characteristics in Uncompacted Asphalt Mixtures; American Association of State Highway and Transportation Officials (AASHTO): Washington, DC, USA, 2018. [Google Scholar]
  20. ASTM. D 6857/D 6857M-11. In Standard Test Method for Maximum Specific Gravity and Density of Bituminous Paving Mixtures Using Automatic Vacuum Sealing Method; ASTM: Philadelphia, PA, USA, 2017. [Google Scholar]
  21. ASTM. D 7064/D 7064M-08. In Standard Practice for Open-Graded Friction Course (OGFC) Mix Design; ASTM: Philadelphia, PA, USA, 2013. [Google Scholar]
  22. NAPA. Porous Asphalt Pavements for Storm Water Management: Design, Construction and Maintenance Guide; National Asphalt Pavement Association (NAPA): Greenbelt, MD, USA, 2008. [Google Scholar]
  23. Amirjani, M. Clogging of Permeable Pavements in Semi-Arid Areas. Master of Science; Delft University of Technology: Delft, The Netherlands, 2010. [Google Scholar]
  24. Marcaida, A.; Nguyen, T.; Ahn, J. Investigation of particle-related clogging of sustainable concrete pavements. Sustainability 2018, 10, 4845. [Google Scholar] [CrossRef] [Green Version]
  25. Suresha, S.N.; George, V.; Ravi Shankar, A.U. Effect of aggregate gradations on properties of porous friction course mixes. Mater. Struct. 2010, 43, 789–801. [Google Scholar] [CrossRef]
  26. Deo, O.; Sumanasooriya, M.; Neithalath, N. Permeability reduction in pervious concretes due to clogging: Experiments and modeling. J. Mater. Civ. Eng. 2010, 22, 741–751. [Google Scholar] [CrossRef]
  27. Fwa, T.F.; Tan, S.A.; Chuai, C.T. Permeability measurement of base materials using falling-head test apparatus. Transp. Res. Rec. 1998, 1615, 94–99. [Google Scholar] [CrossRef]
  28. Fwa, T.F.; Tan, S.A.; Guwe, Y.K. Laboratory evaluation of clogging potential of porous asphalt mixtures. Transp. Res. Rec. 1999, 1681, 43–49. [Google Scholar] [CrossRef]
  29. Ahn, J.; Marcaida, A.; Lee, Y.; Jung, J. Development of test equipment for evaluating hydraulic conductivity of permeable block pavements. Sustainability 2018, 10, 2549. [Google Scholar] [CrossRef] [Green Version]
  30. Andrés-Valeri, V.C.; Marchioni, M.; Sañudo-Fontaneda, L.A.; Giustozzi, F.; Becciu, G. Laboratory assessment of the infiltration capacity reduction in clogged porous mixture surfaces. Sustainability 2016, 8, 751. [Google Scholar] [CrossRef] [Green Version]
  31. Kennedy, T.W.; Huber, G.A.; Harrigan, E.T.; Cominsky, R.J.; Hughes, C.S.; Von Quintus, H.; Moulthrop, J.S. Superior performing asphalt pavements (Superpave); The product of the SHRP asphalt research program: Washington, DC, USA, 1994. [Google Scholar]
  32. Nguyen, T.H.; Ahn, J.; Lee, J.; Kim, J.-H. Dynamic Modulus of Porous Asphalt and the Effect of Moisture Conditioning. Materials 2019, 12, 1230. [Google Scholar] [CrossRef] [Green Version]
  33. Korean Agency for Technology and Standards. KS F 2374. In Standard Test Method for Wheel Tracking of Asphalt Mixtures; Korean Agency for Technology and Standards: Seoul, Korea, 2017. [Google Scholar]
  34. Korean Agency for Technology and Standards. KS F 2366. In Standard Test Method for Theoretical Maximum Specific Gravity of Asphalt Mixtures; Korean Agency for Technology and Standards: Seoul, Korea, 2017. [Google Scholar]
  35. AASHTO. T 209. In Standard Method of Test for Theoretical Maximum Specific Gravity (Gmm) and Density of Asphalt Mixtures; American Association of State Highway and Transportation Officials (AASHTO): Washington, DC, USA, 2019. [Google Scholar]
  36. Korean Agency for Technology and Standards. KS F 2337. In Standard Test Method for Marshall Stability and Flow Of Asphalt Mixtures; Korean Agency for Technology and Standards: Seoul, Korea, 2017. [Google Scholar]
  37. Huang, B.; Wu, H.; Shu, X.; Burdette, E.G. Laboratory evaluation of permeability and strength of polymer-modified pervious concrete. Constr. Build. Mater. 2010, 24, 818–823. [Google Scholar] [CrossRef]
  38. Coleri, E.; Kayhanian, M.; Harvey, J.T.; Yang, K.; Boone, J.M. Clogging evaluation of open graded friction course pavements tested under rainfall and heavy vehicle simulators. J. Environ. Manag. 2013, 129, 164–172. [Google Scholar] [CrossRef] [PubMed]
  39. Liu, R.; Liu, H.; Sha, F.; Yang, H.; Zhang, Q.; Shi, S.; Zheng, Z. Investigation of the porosity distribution, permeability, and mechanical performance of pervious concretes. Processes 2018, 6, 78. [Google Scholar] [CrossRef] [Green Version]
Figure 1. Permeability test equipment for permeable block pavements.
Sustainability 12 06428 g001
Figure 2. Particle size distribution of aggregate with porosities of 19.6%, 15.6%, and 10.3%.
Sustainability 12 06428 g002
Figure 3. Typical evaluation of asphalt pavement deformation using a wheel tracking test.
Sustainability 12 06428 g003
Figure 4. Wheel tracking test equipment: (a) production of specimens and compactors; (b) wheel tracking device.
Sustainability 12 06428 g004
Figure 5. Sample preparation: (a) wheel tracking mold; (b) wheel loading test; and (c) rutting.
Sustainability 12 06428 g005
Figure 6. Schematic of the horizontal permeability test equipment: (a) equipment parts; (b) specimen mold fixture; (c) water tank; (d) head-adjusting pedestals.
Sustainability 12 06428 g006aSustainability 12 06428 g006b
Figure 7. Horizontal permeability test equipment for OGFCs: (a) specimen preparation; (b) rut sealing; (c) setting the hydraulic gradient using the head-adjusting pedestal; (d) specimen mounting and saturation on the sample mold; (e) horizontal permeability test equipment setup; (f) measurement of the amount of runoff per hour.
Sustainability 12 06428 g007
Figure 8. Flow charts for horizontal permeability test with rutting simulation.
Sustainability 12 06428 g008
Figure 9. Discharge velocity due to changes in the hydraulic gradient.
Sustainability 12 06428 g009
Figure 10. Horizontal permeability due to hydraulic gradient change for each porosity.
Sustainability 12 06428 g010
Figure 11. Change in horizontal permeability after rutting for each porosity (i = 0.1).
Sustainability 12 06428 g011
Figure 12. Change in horizontal permeability after rutting for each porosity (i = 0.5).
Sustainability 12 06428 g012
Figure 13. Conceptual diagram of an OGFC: (a) rainfall infiltration in the vertical and horizontal directions; (b) rutting due to long-term traffic loading of the OGFC.
Sustainability 12 06428 g013
Table 1. Specification of open-graded friction course (OGFC).
MixtureOGFC-19.6OGFC-15.6OGFC-10.3
Measured density (g/cm3)1.9362.0202.128
Theoretical density (g/cm3)2.4072.3932.373
Air void content (%)19.615.610.3
Asphalt content (%)5.96.06.1
Draindown (%)0.100.130.13
Cantabro loss (%)11.112.613.0
Table 2. Properties of asphalt binder PG82-34 [32].
TestValueUnit
Viscosity (135 °C)3.4Pa·s
G*/sinδ (original) (82 °C)1.27kPa
G*/sinδ (after RTFO) (82 °C)2.49kPa
G*·sinδ (after PAV) (28 °C)564kPa
Flash point342°C
Stiffness (−24 °C)194MPa
m-value (−24 °C)0.32°C
Table 3. Minimum and maximum hydraulic gradient range.
Head-adjusting pedestal thickness (mm)306090120150180210240270300330360390
Hydraulic gradient (i)0.10.20.30.40.50.60.70.80.91.01.11.21.3
Table 4. Standard lane widths of road cross-sections.
Urban ExpresswaysMain Arterial RoadsMinor Arterial RoadsCollector RoadsLocal Roads
Lane width (m)3.53.25–3.53.0–3.253.02.75–3.0
Design speed (km/h)80–10060–8050–6040–5030–40
Main functionNetwork arterial road connectorUrban arterial road network connectorComplementing the main arterial roadsEstablishment of major road networks in urban areasRoad starting and ending points

