Hemp Seed Production: Environmental Impacts of Cannabis sativa L. Agronomic Practices by Life Cycle Assessment (LCA) and Carbon Footprint Methodologies

 ,
,  ,
, 
Abstract
1. Introduction
2. Materials and Methods
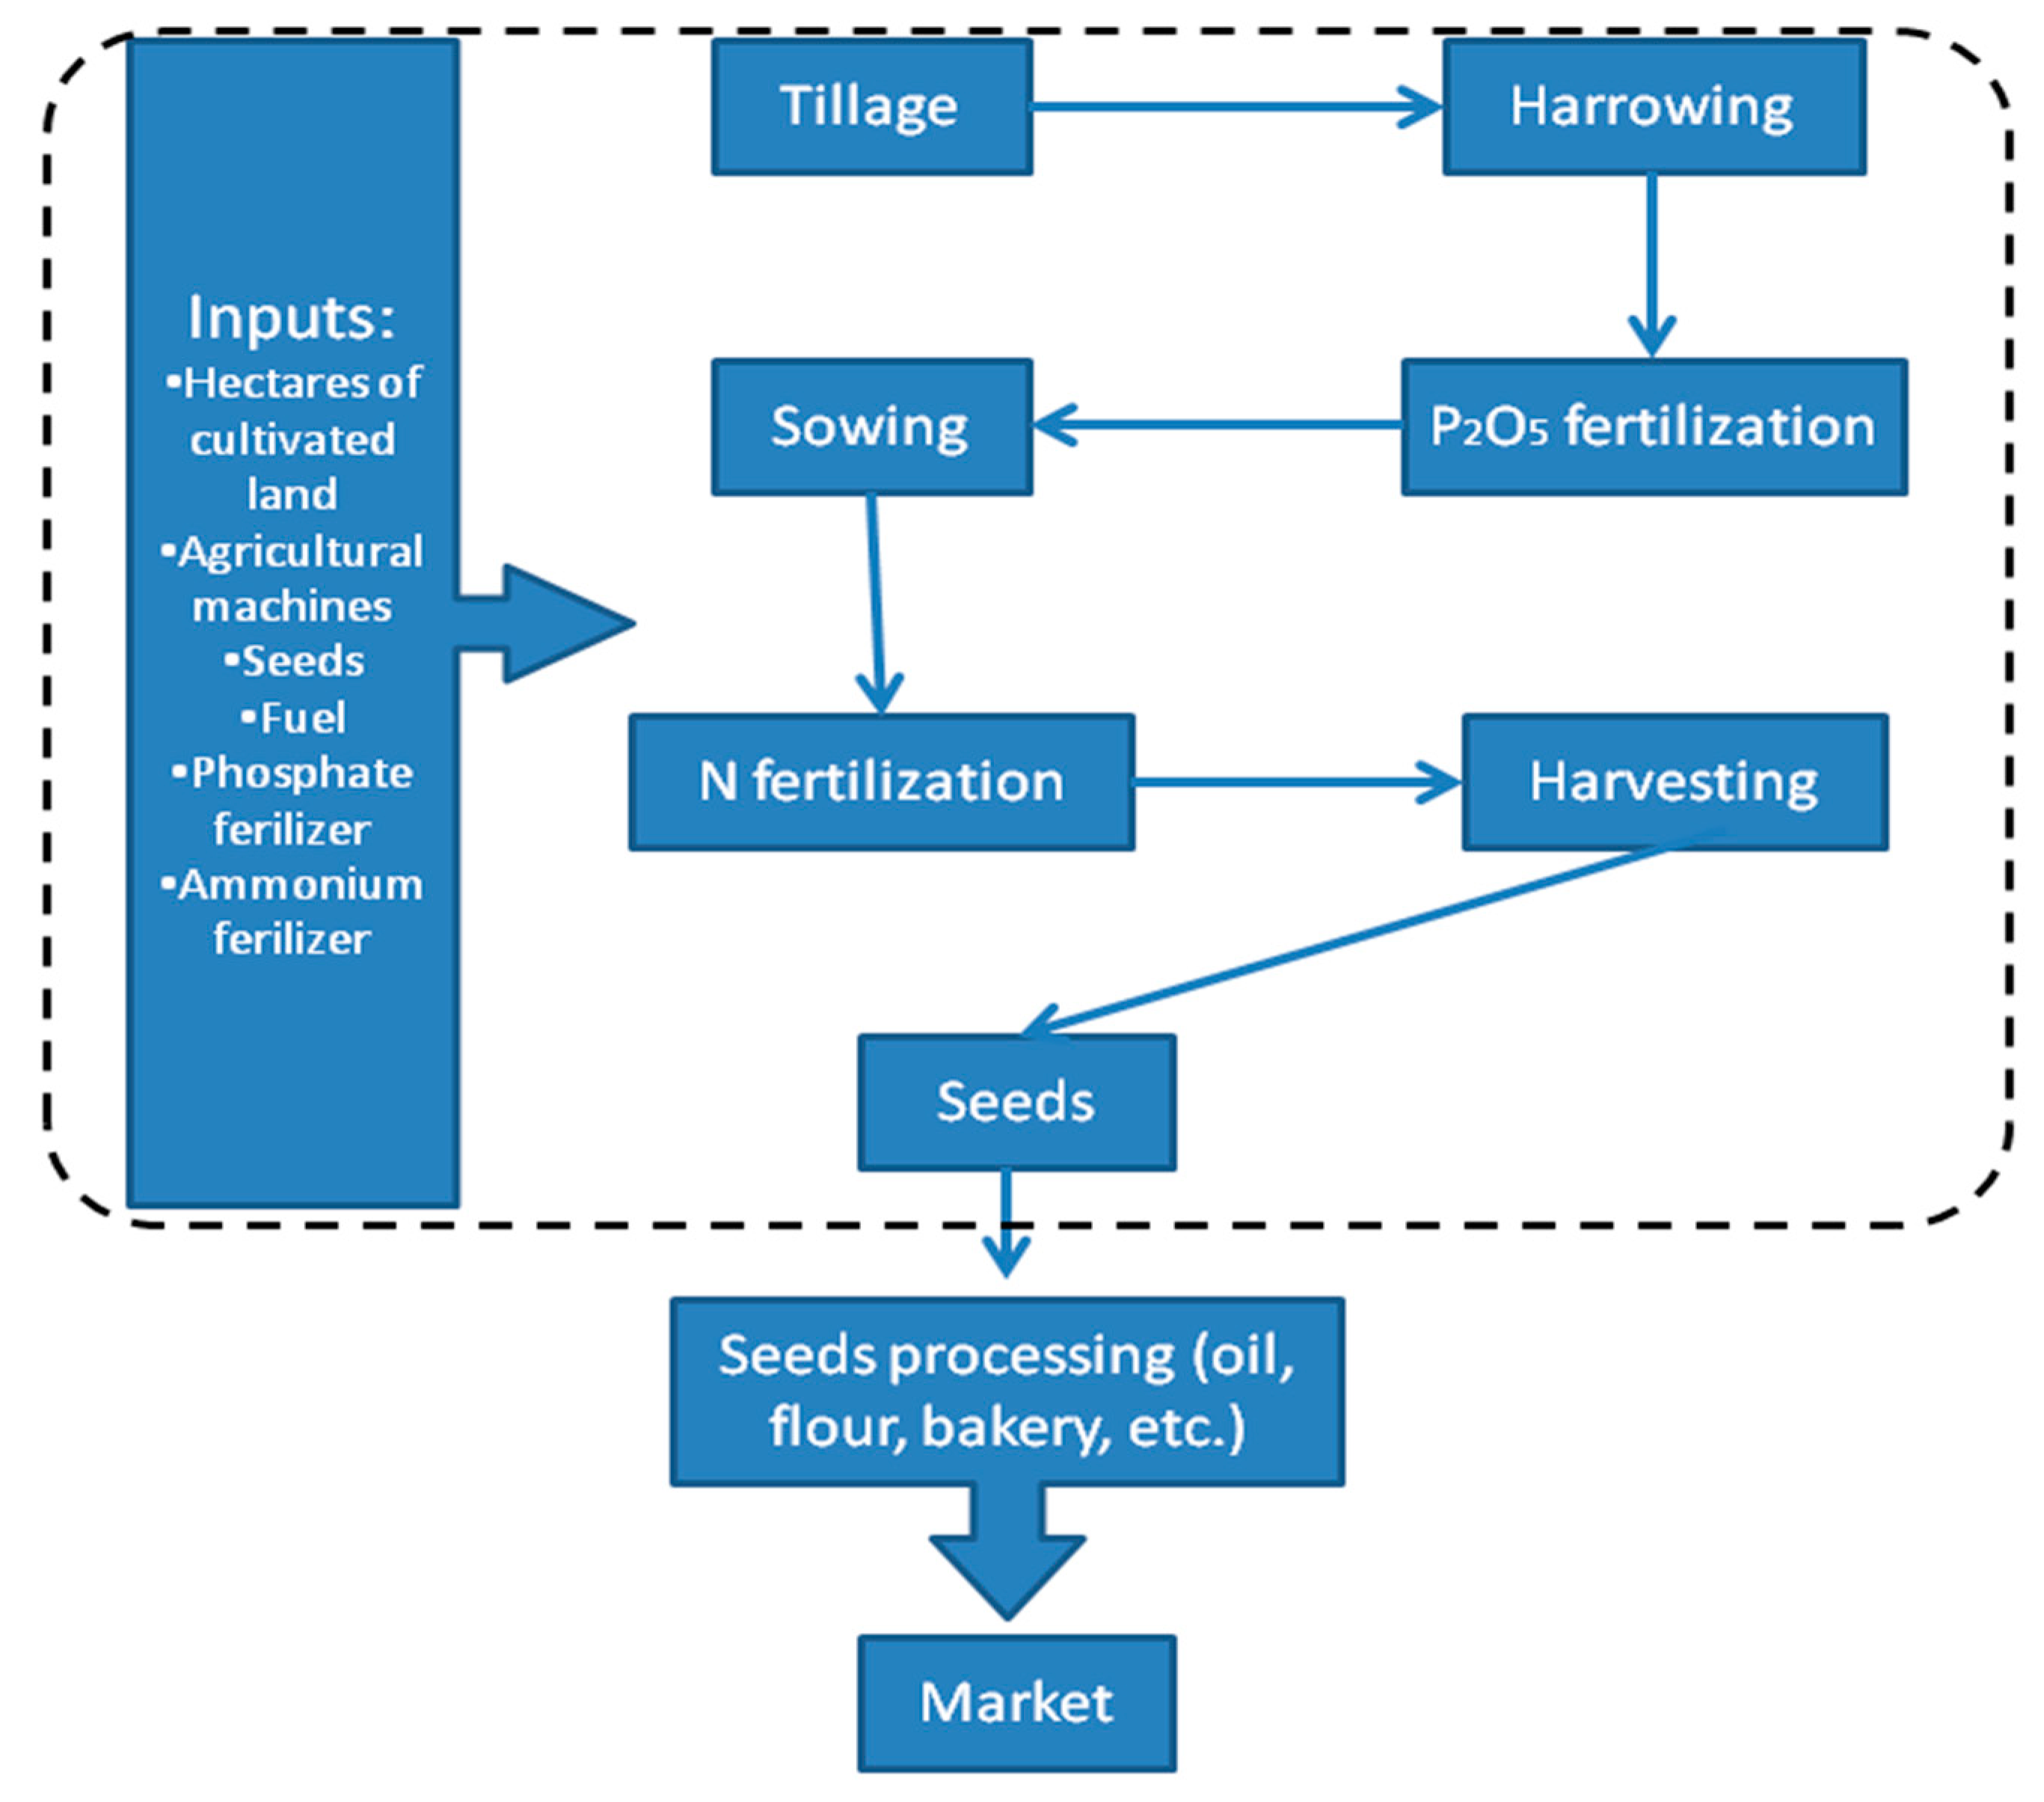
2.1. Life Cycle Assessment
- (i)
- seven industrial hemp varieties [Epsilon 68 (E68), Fedora 17 (F17), Felina 32 (F32), Ferimon (Fe), Futura 75 (F75), Santhica 27 (S27), and Uso 31 (U31)];
- (ii)
- three different plant densities (40, 80, and 120 plants m−2);
- (iii)
- two different level of nitrogen fertilization (50 and 100 kg ha−1 of N) [13].
2.2. Carbon Footprint
3. Results
3.1. Life Cycle Inventory
- hectares of land used,
- N fertilizer,
- P2O5 fertilizer,
- seeds (for sowing),
- agriculture machines involved,
- fuels.
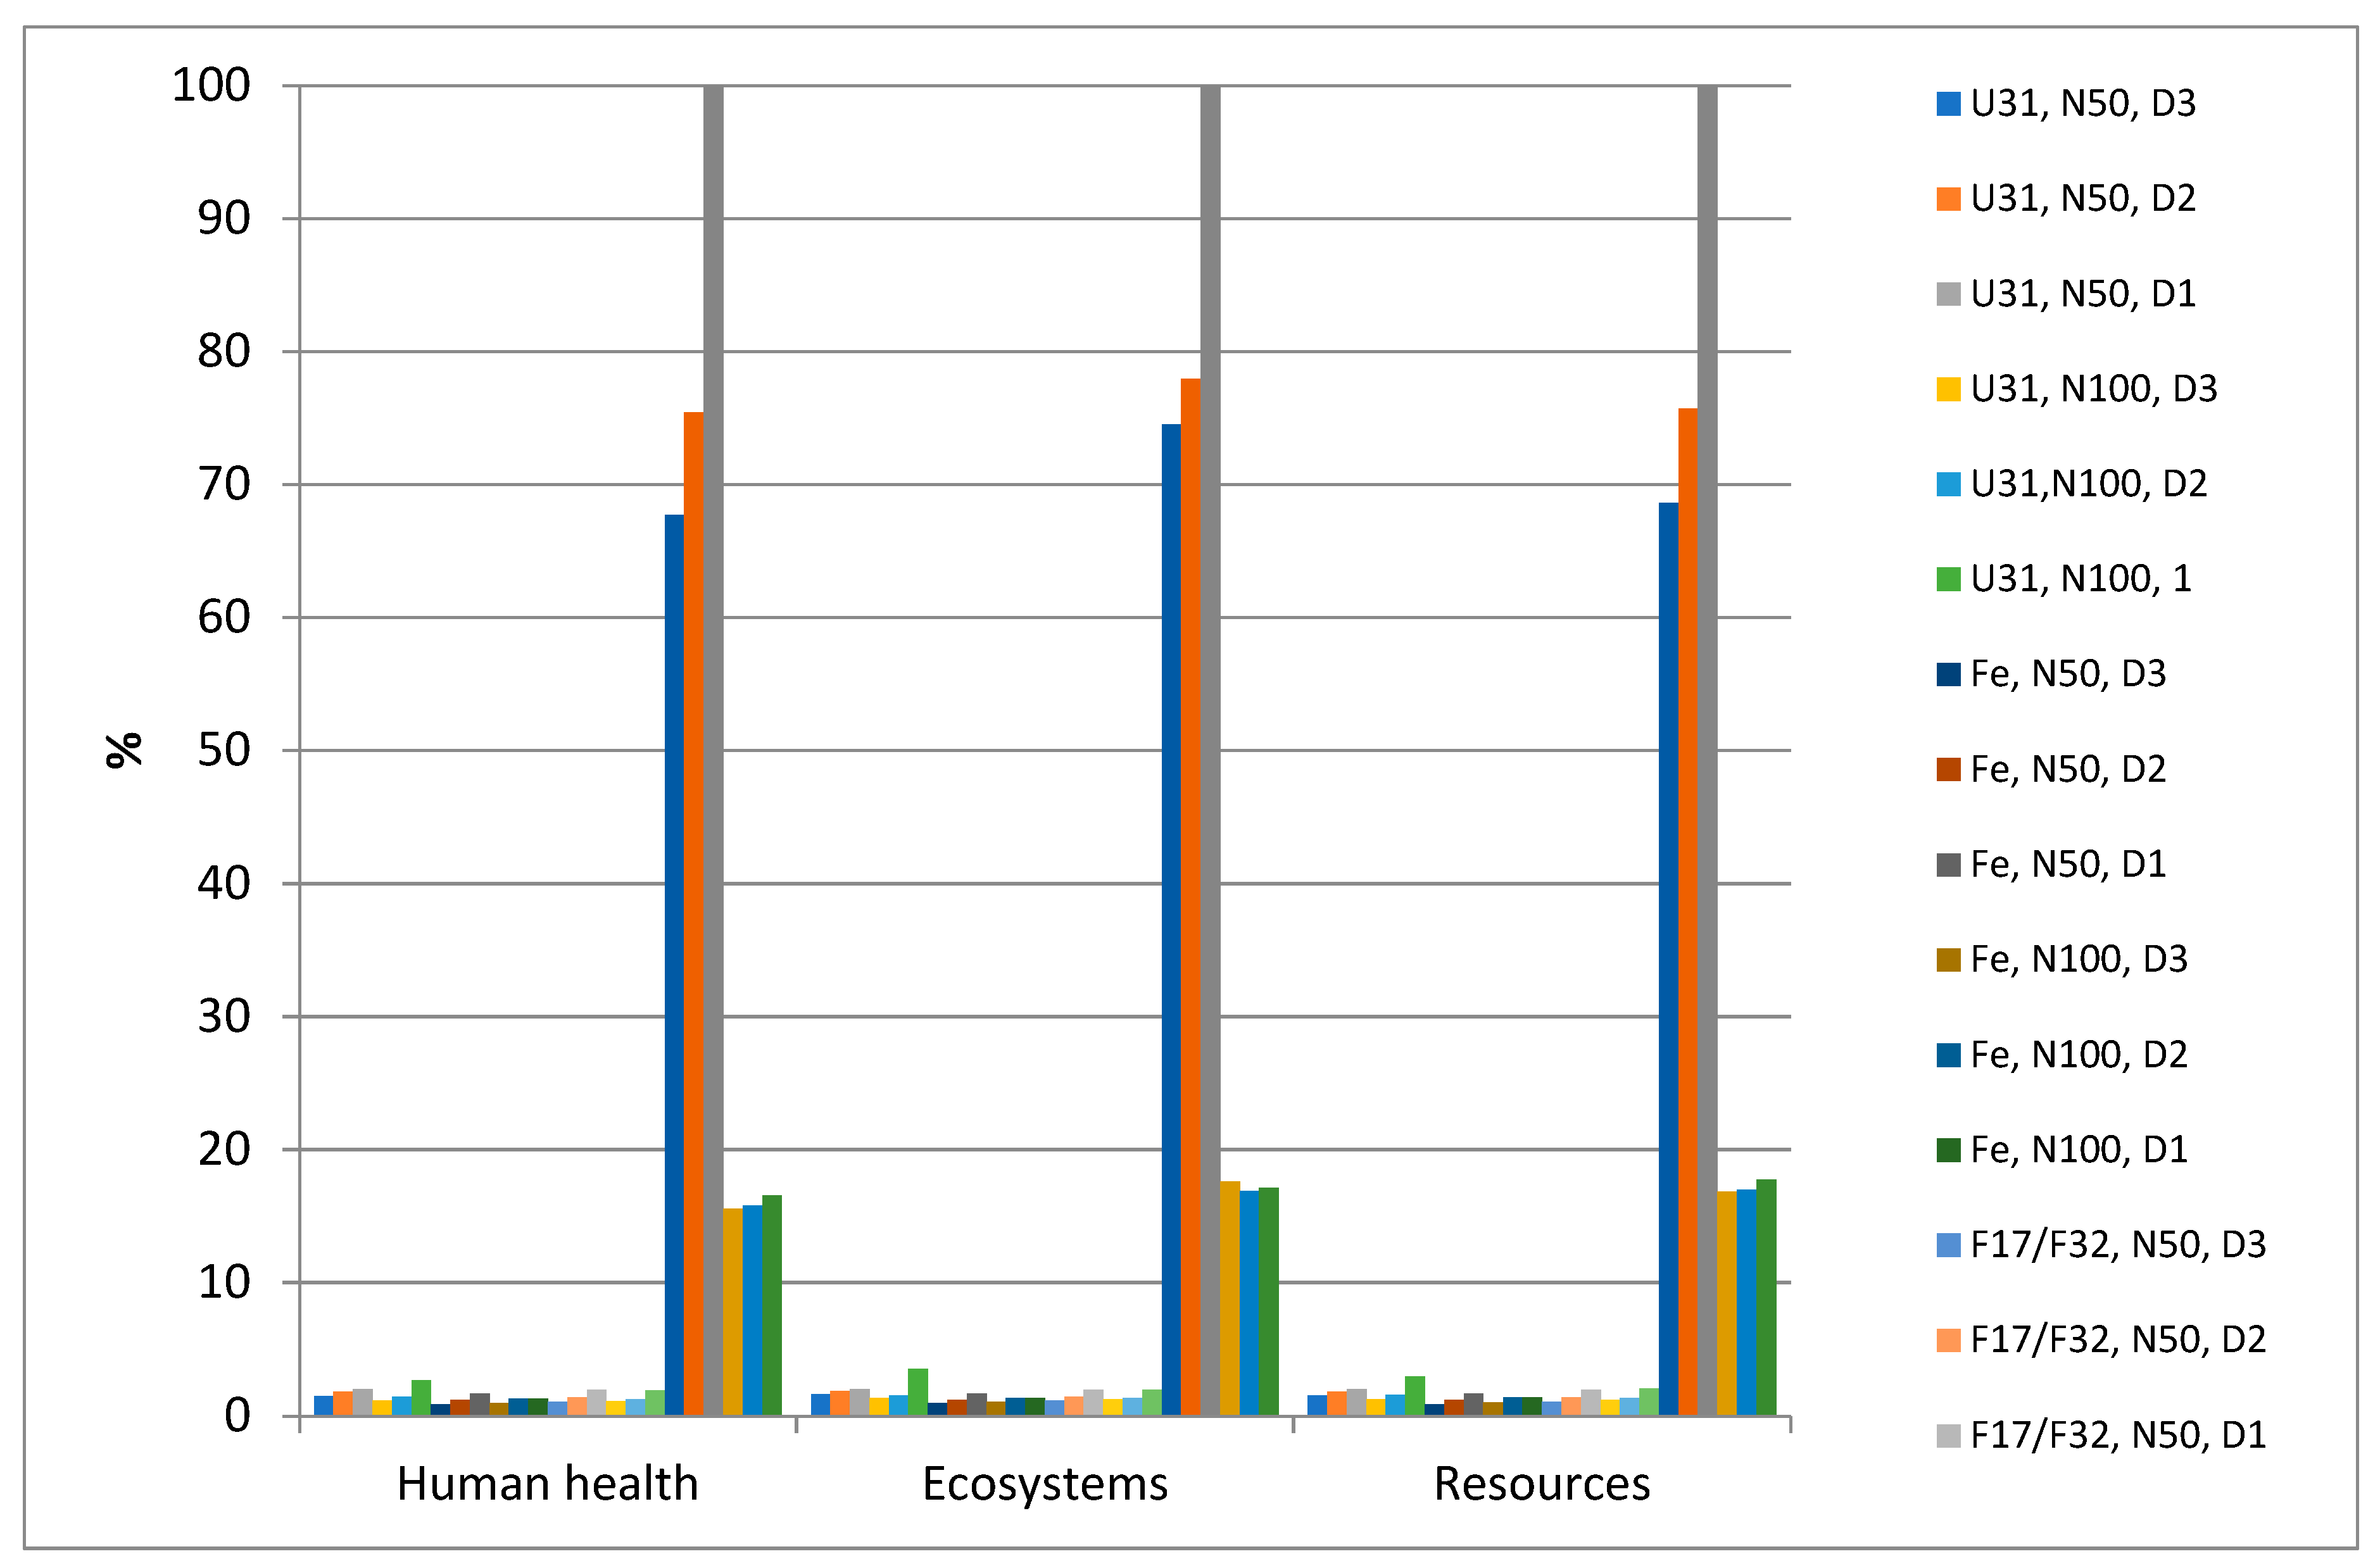
3.2. Life Cycle Impact Assessment
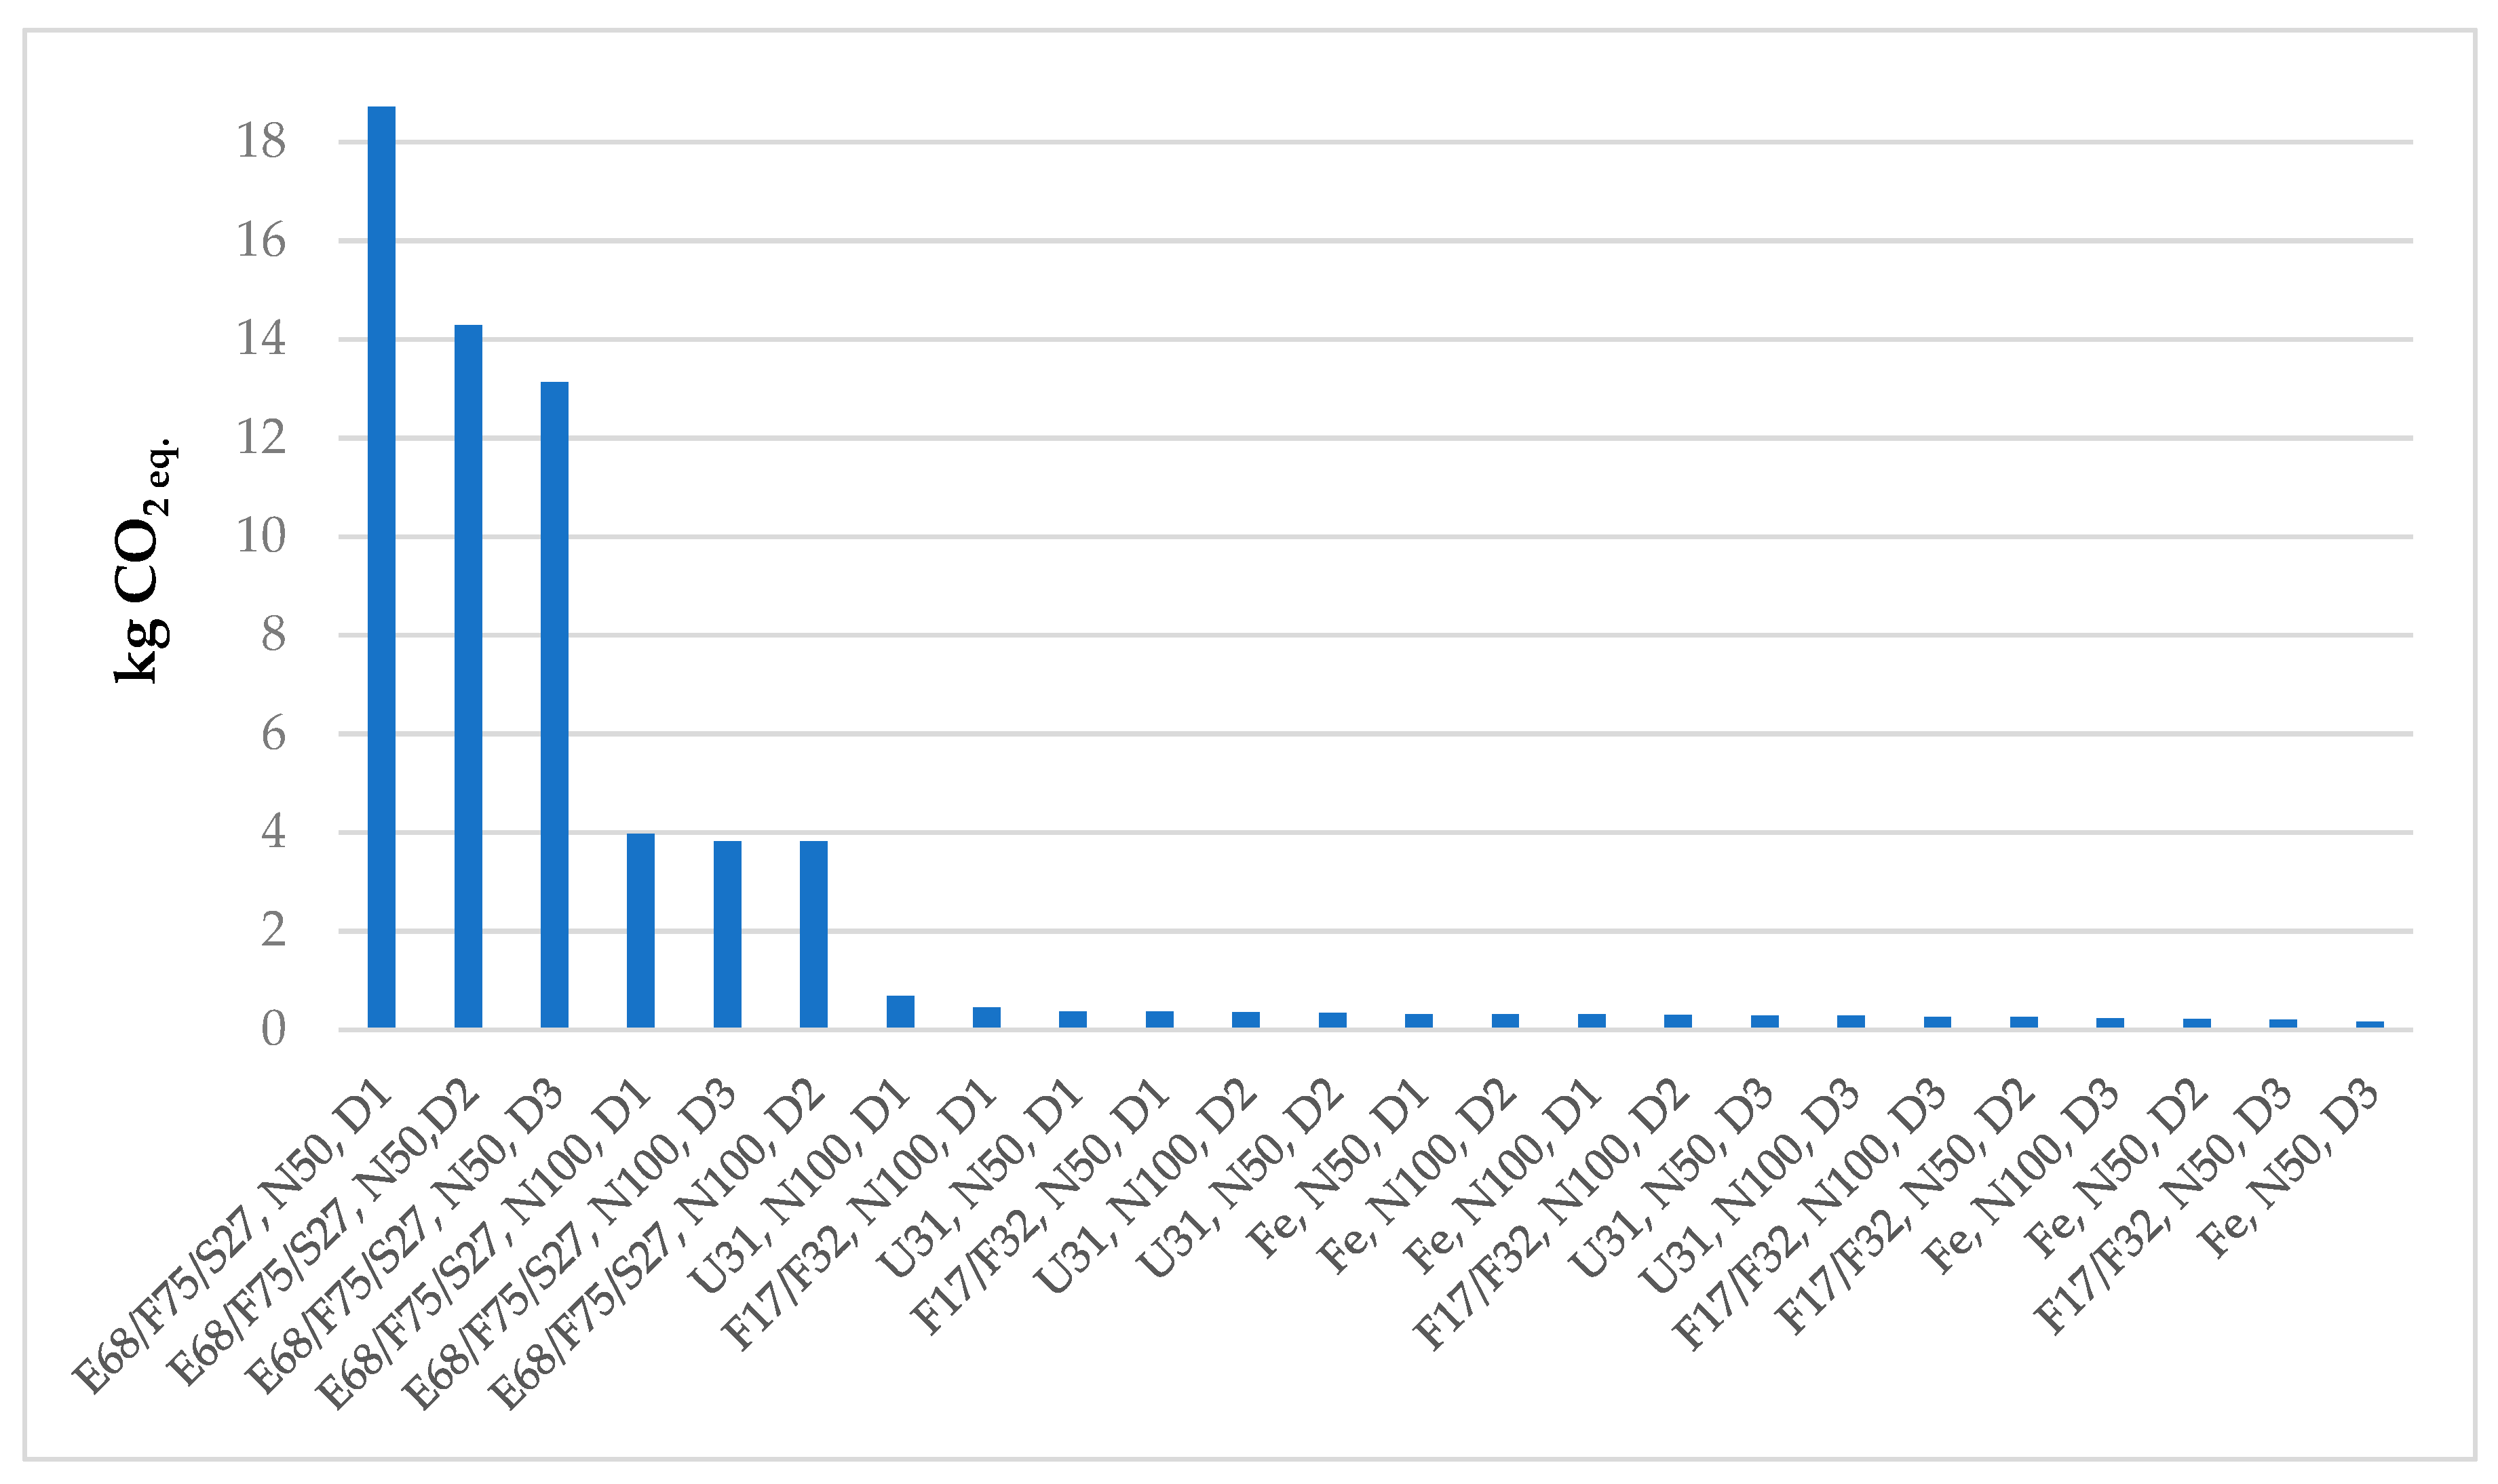
3.3. Carbon Footprint
4. Discussion
5. Conclusions
Author Contributions
Funding
Conflicts of Interest
References
- Carus, M.; Karst, S.; Kauffmann, A. The European Hemp Industry: Cultivation, processing and applications for fibres, shivs and seeds. Eiha 2016, 2003, 1–9. [Google Scholar]
- Groom, Q.; Clarke, R.C.; Merlin, M.D. Cannabis: Evolution and Ethnobotany. Plant Ecol. Evol. 2014, 147, 149. [Google Scholar] [CrossRef]
- Allegret, S. The history of hemp. In Hemp: Industrial Production and Uses; Bouloc, P., Allegret, S., Arnaud, L., Eds.; CAB International: Bar sur Aube, France, 2013; pp. 4–25. ISBN 9781845937928. [Google Scholar]
- European Commission. Common Catalogue of Varieties of Agricultural Plant Species. Available online: https://op.europa.eu/ (accessed on 16 June 2020).
- European Commission. Delegated Regulation (EU) No 639/2014 of Marhc 11. Available online: https://eur-lex.europa.eu/ (accessed on 16 June 2020).
- Amaducci, S.; Scordia, D.; Liu, F.H.; Zhang, Q.; Guo, H.; Testa, G.; Cosentino, S.L. Key cultivation techniques for hemp in Europe and China. Ind. Crops Prod. 2015, 68, 2–16. [Google Scholar] [CrossRef]
- Venturi, P.; Amaducci, S.; Amaducci, M.T.; Venturi, G. Interaction between Agronomic and Mechanical Factors for Fiber Crops Harvesting: Italian Results-Note II. Hemp. J. Nat. Fibers 2007, 4, 83–97. [Google Scholar] [CrossRef]
- Linger, P.; Müssig, J.; Fischer, H.; Kobert, J. Industrial hemp (Cannabis sativa L.) growing on heavy metal contaminated soil: Fibre quality and phytoremediation potential. Ind. Crops Prod. 2002, 16, 33–42. [Google Scholar] [CrossRef]
- Rodriguez-Leyva, D.; Pierce, G.N. The cardiac and haemostatic effects of dietary hempseed. Nutr. Metab. 2010, 7, 32. [Google Scholar] [CrossRef] [PubMed]
- Tang, K.; Struik, P.C.; Yin, X.; Thouminot, C.; Bjelková, M.; Stramkale, V.; Amaducci, S. Comparing hemp (Cannabis sativa L.) cultivars for dual-purpose production under contrasting environments. Ind. Crops Prod. 2016, 87, 33–44. [Google Scholar] [CrossRef]
- Ascrizzi, R.; Ceccarini, L.; Tavarini, S.; Flamini, G.; Angelini, L.G. Valorisation of hemp inflorescence after seed harvest: Cultivation site and harvest time influence agronomic characteristics and essential oil yield and composition. Ind. Crops Prod. 2019, 139, 111541. [Google Scholar] [CrossRef]
- Aubin, M.P.; Seguin, P.; Vanasse, A.; Tremblay, G.F.; Mustafa, A.F.; Charron, J.B. Industrial Hemp Response to Nitrogen, Phosphorus, and Potassium Fertilization. Crop. Forage Turfgrass Manag. 2015, 1, 1–10. [Google Scholar] [CrossRef]
- Campiglia, E.; Radicetti, E.; Mancinelli, R. Plant density and nitrogen fertilization affect agronomic performance of industrial hemp (Cannabis sativa L.) in Mediterranean environment. Ind. Crops Prod. 2017, 100, 246–254. [Google Scholar] [CrossRef]
- Tang, K.; Struik, P.C.; Amaducci, S.; Stomph, T.J.; Yin, X. Hemp (Cannabis sativa L.) leaf photosynthesis in relation to nitrogen content and temperature: Implications for hemp as a bio-economically sustainable crop. GCB Bioenergy 2017, 9, 1573–1587. [Google Scholar] [CrossRef]
- Piotrowski, B.S.; Carus, M. Ecological benefits of hemp and flax cultivation and products. Nov. Inst. 2011, 68, 1–6. [Google Scholar]
- Ruviaro, C.F.; Gianezini, M.; Brandão, F.S.; Winck, C.A.; Dewes, H. Life cycle assessment in Brazilian agriculture facing worldwide trends. J. Clean. Prod. 2012, 28, 9–24. [Google Scholar] [CrossRef]
- ISO 14040. Environmental Management—Life Cycle Assessment—Principles and Framework; International Organization for Standardization: Geneva, Switzerland, 2006. [Google Scholar]
- ISO 14044. Environmental Management—Life Cycle Assessment—Requirements and Guidelines; International Organization for Standardization: Geneva, Switzerland, 2006. [Google Scholar]
- ISO 14067. Greenhouse Gases—Carbon Footprint of Products—Requirements and Guidelines for Quantification and Communication; International Organization for Standardization: Geneva, Switzerland, 2013. [Google Scholar]
- Vinci, G.; Rapa, M. Hydroponic cultivation: Life cycle assessment of substrate choice. Br. Food J. 2019, 121, 1801–1812. [Google Scholar] [CrossRef]
- Werf, H.M.G. Life Cycle Analysis of field production of fibre hemp, the effect of production practices on environmental impacts. Euphytica 2004, 140, 13–23. [Google Scholar] [CrossRef]
- Zampori, L.; Dotelli, G.; Vernelli, V. Life cycle assessment of hemp cultivation and use of hemp-based thermal insulator materials in buildings. Environ. Sci. Technol. 2013, 47, 7413–7420. [Google Scholar] [CrossRef] [PubMed]
- González-García, S.; Hospido, A.; Feijoo, G.; Moreira, M.T. Life cycle assessment of raw materials for non-wood pulp mills: Hemp and flax. Resour. Conserv. Recycl. 2010, 54, 923–930. [Google Scholar] [CrossRef]
- Dekamin, M.; Barmaki, M.; Kanooni, A.; Meshkini, S.R.M. Cradle to farm gate life cycle assessment of oilseed crops production in Iran. Eng. Agric. Environ. Food 2018, 11, 178–185. [Google Scholar] [CrossRef]
- Rebitzer, G.; Ekvall, T.; Frischknecht, R.; Hunkeler, D.; Norris, G.; Rydberg, T.; Schmidt, W.P.; Suh, S.; Weidema, B.P.; Pennington, D.W. Life cycle assessment Part 1: Framework, goal and scope definition, inventory analysis, and applications. Environ. Int. 2004, 30, 701–720. [Google Scholar] [CrossRef]
- Finnveden, G.; Hauschild, M.Z.; Ekvall, T.; Guinée, J.; Heijungs, R.; Hellweg, S.; Koehler, A.; Pennington, D.; Suh, S. Recent developments in Life Cycle Assessment. J. Environ. Manag. 2009, 91, 1–21. [Google Scholar] [CrossRef]
- Zanghelini, G.M.; Cherubini, E.; Soares, S.R. How Multi-Criteria Decision Analysis (MCDA) is aiding Life Cycle Assessment (LCA) in results interpretation. J. Clean. Prod. 2018, 172, 609–622. [Google Scholar] [CrossRef]
- IPPC. 2006 IPCC Guidelines for National Greenhouse Gas Inventories—Volume 3—Industrial Processes. Available online: https://www.ipcc-nggip.iges.or.jp/ (accessed on 16 June 2020).
- Forster, P.; Artaxo, P. Changes in Atmospheric Constituents and in Radiative Forcing. In Climate Change 2007: The Physical Science Basis. Contribution of Working Group I to the Fourth Assessment Report of the Intergovernmental Panel on Climate Change; Solomon, S., Qin, D., Manning, M., Chen, Z., Marquis, M., Averyt, K.B., Tignor, M., Miller, H.L., Eds.; Cambridge University Press: Cambridge, UK; New York, NY, USA, 2007. [Google Scholar]
- Wimmer, W.; Bey, N.; Malsch, A. An integrated approach for introducing ECODESIGN into an industrial company—From customer demands to an Enviromental Product Declaration. In Proceedings of the 14th International Conference on Engineering Design (ICED), Stockholm, Sweden, 19–21 August 2003; Folkeson, A., Gralen, K., Norell, M., Sellgren, U., Eds.; Design Society: Scottland, UK, 2003. [Google Scholar]
- Giraldi-Díaz, M.R.; Medina-Salas, L.; Castillo-González, E.; León-Lira, R. Environmental impact associated with the supply chain and production of grounding and roasting coffee through life cycle analysis. Sustainability 2018, 10, 4598. [Google Scholar] [CrossRef]
- Mungkung, R.; Pengthamkeerati, P.; Chaichana, R.; Watcharothai, S.; Kitpakornsanti, K.; Tapananont, S. Life Cycle Assessment of Thai organic Hom Mali rice to evaluate the climate change, water use and biodiversity impacts. J. Clean. Prod. 2019, 211, 687–694. [Google Scholar] [CrossRef]
- Vinci, G.; D’Ascenzo, F.; Esposito, A.; Musarra, M.; Rapa, M.; Rocchi, A. A sustainable innovation in the Italian glass production: LCA and Eco-Care Matrix evaluation. J. Clean. Prod. 2019, 223, 587–595. [Google Scholar] [CrossRef]
- Rapa, M.; Vinci, G.; Gobbi, L. Life cycle assessment of photovoltaic implementation: An italian case study. Int. J. Civ. Eng. Technol. 2019, 10, 1657–1663. [Google Scholar]
- Vinci, G.; Esposito, A.; Rapa, M.; Rocchi, A.; Ruggieri, R. Sustainability of Technological Innovation Investments: Photovoltaic Panels Case Study. Int. J. Civ. Eng. Technol. 2019, 10, 2301–2307. [Google Scholar]
- Huang, L.; Riggins, C.W.; Rodríguez-Zas, S.; Zabaloy, M.C.; Villamil, M.B. Long-term N fertilization imbalances potential N acquisition and transformations by soil microbes. Sci. Total Environ. 2019, 691, 562–571. [Google Scholar] [CrossRef]
- Raucci, G.S.; Moreira, C.S.; Alves, P.A.; Mello, F.F.C.; Frazão, L.D.A.; Cerri, C.E.P.; Cerri, C.C. Greenhouse gas assessment of Brazilian soybean production: A case study of Mato Grosso State. J. Clean. Prod. 2015, 96, 418–425. [Google Scholar] [CrossRef]
- Yodkhum, S.; Gheewala, S.H.; Sampattagul, S. Life cycle GHG evaluation of organic rice production in northern Thailand. J. Environ. Manag. 2017, 196, 217–223. [Google Scholar] [CrossRef]
- Alhajj Ali, S.; Tedone, L.; Verdini, L.; De Mastro, G. Effect of different crop management systems on rainfed durum wheat greenhouse gas emissions and carbon footprint under Mediterranean conditions. J. Clean. Prod. 2017, 140, 608–621. [Google Scholar] [CrossRef]
- Ankathi, S.K.; Long, D.S.; Gollany, H.T.; Das, P.; Shonnard, D. Life cycle assessment of oilseed crops produced in rotation with dryland cereals in the inland Pacific Northwest. Int. J. Life Cycle Assess. 2019, 24, 627–641. [Google Scholar] [CrossRef]
- Esmaeilzadeh, S.; Asgharipour, M.R.; Bazrgar, A.B.; Soufizadeh, S.; Karandish, F. Assessing the carbon footprint of irrigated and dryland wheat with a life cycle approach in bojnourd. Environ. Prog. Sustain. Energy 2019, 38, 13134. [Google Scholar] [CrossRef]
- Tahmasebi, M.; Feike, T.; Soltani, A.; Ramroudi, M.; Ha, N. Trade-off between productivity and environmental sustainability in irrigated vs. rainfed wheat production in Iran. J. Clean. Prod. 2018, 174, 367–376. [Google Scholar] [CrossRef]
- Forleo, M.B.; Palmieri, N.; Suardi, A.; Coaloa, D.; Pari, L. The eco-efficiency of rapeseed and sunflower cultivation in Italy. Joining environmental and economic assessment. J. Clean. Prod. 2018, 172, 3138–3153. [Google Scholar] [CrossRef]
- Lindgreen, E.R.; Salomone, R.; Reyes, T. A Critical Review of Academic Approaches, Methods and Tools to Assess Circular Economy at the Micro Level. Sustainability 2020, 12, 4973. [Google Scholar] [CrossRef]
- Arzoumanidis, I.; Salomone, R.; Petti, L.; Mondello, G.; Raggi, A. Is there a simplified LCA tool suitable for the agri-food industry? An assessment of selected tools. J. Clean. Prod. 2017, 149, 406–425. [Google Scholar] [CrossRef]


| Seed Yield (t ha−1) | ||||||||||||
|---|---|---|---|---|---|---|---|---|---|---|---|---|
| N50 | N100 | |||||||||||
| Varieties | D1 | D2 | D3 | D1 | D2 | D3 | ||||||
| E68 | 0.02 | cA | 0.02 | cA | 0.03 | dA | 0.12 | cA | 0.11 | cA | 0.12 | cA |
| F17 | 1.06 | bC | 1.61 | aB | 2.02 | abA | 1.04 | bB | 1.68 | bA | 1.93 | abA |
| F32 | 1.01 | bC | 1.36 | abB | 1.92 | bA | 1.13 | bB | 1.69 | bA | 2.00 | abA |
| F75 | 0.03 | cA | 0.04 | cA | 0.04 | dA | 0.13 | cA | 0.15 | cA | 0.14 | cA |
| Fe | 1.20 | aC | 1.75 | aB | 2.44 | aA | 1.60 | aB | 2.26 | Aa | 2.27 | aA |
| S27 | 0.01 | cA | 0.02 | cA | 0.02 | dA | 0.12 | cA | 0.13 | cA | 0.12 | cA |
| U31 | 1.02 | bB | 1.14 | bAB | 1.39 | cA | 0.81 | bB | 1.44 | bA | 1.82 | bA |
| N50 | N100 | |||||
|---|---|---|---|---|---|---|
| D1 | D2 | D3 | D1 | D2 | D3 | |
| Land (ha) | ||||||
| E68/F75/S27 | 0.05000 | 0.03750 | 0.03333 | 0.00811 | 0.00769 | 0.00750 |
| F17/F32 | 0.00097 | 0.00067 | 0.00051 | 0.00092 | 0.00059 | 0.00051 |
| Fe | 0.00083 | 0.00057 | 0.00041 | 0.00063 | 0.00044 | 0.00044 |
| U31 | 0.00098 | 0.00088 | 0.00072 | 0.00123 | 0.00069 | 0.00055 |
| N fertilizer (kg) | ||||||
| E68/F75/S27 | 2.50000 | 1.87500 | 1.66667 | 0.81081 | 0.76923 | 0.75000 |
| F17/F32 | 0.04831 | 0.03367 | 0.02538 | 0.09217 | 0.05935 | 0.05089 |
| Fe | 0.04167 | 0.02857 | 0.02049 | 0.06250 | 0.04425 | 0.04405 |
| U31 | 0.04902 | 0.04386 | 0.03597 | 0.12346 | 0.06944 | 0.05495 |
| P2O5 fertilizer (kg) | ||||||
| E68/F75/S27 | 5.00000 | 3.75000 | 3.33333 | 0.81081 | 0.76923 | 0.75000 |
| F17/F32 | 0.09662 | 0.06734 | 0.05076 | 0.09217 | 0.05935 | 0.05089 |
| Fe | 0.08333 | 0.05714 | 0.04098 | 0.06250 | 0.04425 | 0.04405 |
| U31 | 0.09804 | 0.08772 | 0.07194 | 0.12346 | 0.06944 | 0.05495 |
| Seed for sowing (kg) | ||||||
| E68/F75/S27 | 0.35000 | 0.52500 | 0.93333 | 0.05676 | 0.10769 | 0.21000 |
| F17/F32 | 0.00676 | 0.00943 | 0.01421 | 0.00645 | 0.00831 | 0.01425 |
| Fe | 0.00583 | 0.00800 | 0.01148 | 0.00438 | 0.00619 | 0.01233 |
| U31 | 0.00686 | 0.01228 | 0.02014 | 0.00864 | 0.00972 | 0.01538 |
| Diesel (kg) | ||||||
| E68/F75/S27 | 3.25000 | 2.43750 | 2.16667 | 0.52703 | 0.50000 | 0.48750 |
| F17/F32 | 0.06280 | 0.04377 | 0.03299 | 0.05991 | 0.03858 | 0.03308 |
| Fe | 0.05417 | 0.03714 | 0.02664 | 0.04063 | 0.02876 | 0.02863 |
| U31 | 0.06373 | 0.05702 | 0.04676 | 0.08025 | 0.04514 | 0.03571 |
| Agriculture machines (kg) | ||||||
| E68/F75/S27 | 0.82000 | 0.61500 | 0.54667 | 0.13297 | 0.12615 | 0.12300 |
| F17/F32 | 0.01585 | 0.01104 | 0.00832 | 0.01512 | 0.00973 | 0.00835 |
| Fe | 0.01367 | 0.00937 | 0.00672 | 0.01025 | 0.00726 | 0.00722 |
| U31 | 0.01608 | 0.01439 | 0.01180 | 0.02025 | 0.01139 | 0.00901 |
| Categories | Unit | N50, D1 | N50, D2 | N50, D3 | N100, D1 | N100, D2 | N100, D3 |
|---|---|---|---|---|---|---|---|
| GWHH | DALY | 3.48 × 10⁻⁶ | 3.17 × 10⁻⁶ | 2.70 × 10⁻⁶ | 5.99 × 10⁻⁶ | 2.99 × 10⁻⁶ | 2.44 × 10⁻⁶ |
| GWTE | species/yr | 6.96 × 10⁻⁹ | 6.34 × 10⁻⁹ | 5.40 × 10⁻⁹ | 1.20 × 10⁻⁸ | 5.99 × 10⁻⁹ | 4.88 × 10⁻⁹ |
| GWFE | species/yr | 1.90 × 10⁻¹³ | 1.73 × 10⁻¹³ | 1.47 × 10⁻¹³ | 3.27 × 10⁻¹³ | 1.63 × 10⁻¹³ | 1.33 × 10⁻¹³ |
| SOD | DALY | 6.57 × 10⁻⁹ | 5.96 × 10⁻⁹ | 5.02 × 10⁻⁹ | 1.66 × 10⁻⁸ | 8.83 × 10⁻⁹ | 7.09 × 10⁻⁹ |
| IR | DALY | 7.75 × 10⁻¹⁰ | 6.99 × 10⁻¹⁰ | 5.81 × 10⁻¹⁰ | 1.05 × 10⁻⁹ | 5.59 × 10⁻¹⁰ | 4.49 × 10⁻¹⁰ |
| OFHH | DALY | 6.71 × 10⁻¹⁰ | 6.03 × 10⁻¹⁰ | 4.99 × 10⁻¹⁰ | 8.82 × 10⁻¹⁰ | 4.78 × 10⁻¹⁰ | 3.82 × 10⁻¹⁰ |
| FPMF | DALY | 6.01 × 10⁻⁷ | 5.41 × 10⁻⁷ | 4.49 × 10⁻⁷ | 8.65 × 10⁻⁷ | 4.66 × 10⁻⁷ | 3.73 × 10⁻⁷ |
| OFTE | species/yr | 9.73 × 10⁻¹¹ | 8.75 × 10⁻¹¹ | 7.25 × 10⁻¹¹ | 1.28 × 10⁻¹⁰ | 6.94 × 10⁻¹¹ | 5.54 × 10⁻¹¹ |
| TA | species/yr | 5.89 × 10⁻¹⁰ | 5.31 × 10⁻¹⁰ | 4.42 × 10⁻¹⁰ | 9.68 × 10⁻¹⁰ | 5.19 × 10⁻¹⁰ | 4.15 × 10⁻¹⁰ |
| FEU | species/yr | 1.49 × 10⁻¹⁰ | 1.34 × 10⁻¹⁰ | 1.10 × 10⁻¹⁰ | 1.94 × 10⁻¹⁰ | 1.06 × 10⁻¹⁰ | 8.44 × 10⁻¹¹ |
| MEU | species/yr | 9.11 × 10⁻¹⁴ | 8.18 × 10⁻¹⁴ | 6.76 × 10⁻¹⁴ | 1.19 × 10⁻¹³ | 6.48 × 10⁻¹⁴ | 5.17 × 10⁻¹⁴ |
| TET | species/yr | 1.75 × 10⁻¹¹ | 1.58 × 10⁻¹¹ | 1.30 × 10⁻¹¹ | 2.29 × 10⁻¹¹ | 1.25 × 10⁻¹¹ | 9.95 × 10⁻¹² |
| FET | species/yr | 9.93 × 10⁻¹² | 8.92 × 10⁻¹² | 7.37 × 10⁻¹² | 1.29 × 10⁻¹¹ | 7.06 × 10⁻¹² | 5.63 × 10⁻¹² |
| MET | species/yr | 1.74 × 10⁻⁸ | 1.57 × 10⁻⁸ | 1.29 × 10⁻⁸ | 2.27 × 10⁻⁸ | 1.24 × 10⁻⁸ | 9.88 × 10⁻⁹ |
| HCT | DALY | 2.76 × 10⁻⁶ | 2.48 × 10⁻⁶ | 2.05 × 10⁻⁶ | 3.60 × 10⁻⁶ | 1.96 × 10⁻⁶ | 1.57 × 10⁻⁶ |
| HNCT | DALY | 3.16 × 10⁻⁵ | 2.84 × 10⁻⁵ | 2.35 × 10⁻⁵ | 4.12 × 10⁻⁵ | 2.25 × 10⁻⁵ | 1.79 × 10⁻⁵ |
| LU | species/yr | 1.22 × 10⁻⁹ | 1.84 × 10⁻⁹ | 2.73 × 10⁻⁹ | 1.10 × 10⁻⁸ | 1.45 × 10⁻⁹ | 2.09 × 10⁻⁹ |
| MRS | USD | 0.001435 | 0.001289 | 0.001065 | 0.001869 | 0.001021 | 0.000814 |
| FRS | USD | 0.057579 | 0.05202 | 0.043484 | 0.085886 | 0.045129 | 0.036336 |
| WCHH | DALY | 1.94 × 10⁻⁸ | 1.74 × 10⁻⁸ | 1.44 × 10⁻⁸ | 2.53 × 10⁻⁸ | 1.38 × 10⁻⁸ | 1.10 × 10⁻⁸ |
| WCTE | species/yr | 1.18 × 10⁻¹⁰ | 1.06 × 10⁻¹⁰ | 8.74 × 10⁻¹¹ | 1.54 × 10⁻¹⁰ | 8.39 × 10⁻¹¹ | 6.69 × 10⁻¹¹ |
| WCAE | species/yr | 5.27 × 10⁻¹⁵ | 4.73 × 10⁻¹⁵ | 3.91 × 10⁻¹⁵ | 6.89 × 10⁻¹⁵ | 3.75 × 10⁻¹⁵ | 2.99 × 10⁻¹⁵ |
| Categories | Unit | N50, D1 | N50, D2 | N50, D3 | N100, D1 | N100, D2 | N100, D3 |
|---|---|---|---|---|---|---|---|
| GWHH | DALY | 2.96 × 10⁻⁶ | 2.07 × 10⁻⁶ | 1.54 × 10⁻⁶ | 2.65 × 10⁻⁶ | 2.65 × 10⁻⁶ | 1.96 × 10⁻⁶ |
| GWTE | species/yr | 5.91 × 10⁻⁹ | 4.13 × 10⁻⁹ | 3.07 × 10⁻⁹ | 5.30 × 10⁻⁹ | 5.30 × 10⁻⁹ | 3.92 × 10⁻⁹ |
| GWFE | species/yr | 1.61 × 10⁻¹³ | 1.13 × 10⁻¹³ | 8.39 × 10⁻¹⁴ | 1.45 × 10⁻¹³ | 1.45 × 10⁻¹³ | 1.07 × 10⁻¹³ |
| SOD | DALY | 5.58 × 10⁻⁹ | 3.88 × 10⁻⁹ | 2.86 × 10⁻⁹ | 7.89 × 10⁻⁹ | 7.89 × 10⁻⁹ | 5.68 × 10⁻⁹ |
| IR | DALY | 6.59 × 10⁻¹⁰ | 4.55 × 10⁻¹⁰ | 3.31 × 10⁻¹⁰ | 4.99 × 10⁻¹⁰ | 4.99 × 10⁻¹⁰ | 3.60 × 10⁻¹⁰ |
| OFHH | DALY | 5.70 × 10⁻¹⁰ | 3.93 × 10⁻¹⁰ | 2.84 × 10⁻¹⁰ | 4.28 × 10⁻¹⁰ | 4.28 × 10⁻¹⁰ | 3.06 × 10⁻¹⁰ |
| FPMF | DALY | 5.11 × 10⁻⁷ | 3.53 × 10⁻⁷ | 2.56 × 10⁻⁷ | 4.17 × 10⁻⁷ | 4.17 × 10⁻⁷ | 2.99 × 10⁻⁷ |
| OFTE | species/yr | 8.27 × 10⁻¹¹ | 5.70 × 10⁻¹¹ | 4.13 × 10⁻¹¹ | 6.21 × 10⁻¹¹ | 6.21 × 10⁻¹¹ | 4.44 × 10⁻¹¹ |
| TA | species/yr | 5.00 × 10⁻¹⁰ | 3.46 × 10⁻¹⁰ | 2.52 × 10⁻¹⁰ | 4.64 × 10⁻¹⁰ | 4.64 × 10⁻¹⁰ | 3.33 × 10⁻¹⁰ |
| FEU | species/yr | 1.27 × 10⁻¹⁰ | 8.71 × 10⁻¹¹ | 6.29 × 10⁻¹¹ | 9.49 × 10⁻¹¹ | 9.49 × 10⁻¹¹ | 6.77 × 10⁻¹¹ |
| MEU | species/yr | 7.74 × 10⁻¹⁴ | 5.33 × 10⁻¹⁴ | 3.85 × 10⁻¹⁴ | 5.81 × 10⁻¹⁴ | 5.81 × 10⁻¹⁴ | 4.14 × 10⁻¹⁴ |
| TET | species/yr | 1.49 × 10⁻¹¹ | 1.03 × 10⁻¹¹ | 7.42 × 10⁻¹² | 1.12 × 10⁻¹¹ | 1.12 × 10⁻¹¹ | 7.98 × 10⁻¹² |
| FET | species/yr | 8.44 × 10⁻¹² | 5.81 × 10⁻¹² | 4.20 × 10⁻¹² | 6.33 × 10⁻¹² | 6.33 × 10⁻¹² | 4.51 × 10⁻¹² |
| MET | species/yr | 1.48 × 10⁻⁸ | 1.02 × 10⁻⁸ | 7.37 × 10⁻⁹ | 1.11 × 10⁻⁸ | 1.11 × 10⁻⁸ | 7.92 × 10⁻⁹ |
| HCT | DALY | 2.35 × 10⁻⁶ | 1.62 × 10⁻⁶ | 1.17 × 10⁻⁶ | 1.76 × 10⁻⁶ | 1.76 × 10⁻⁶ | 1.26 × 10⁻⁶ |
| HNCT | DALY | 2.69 × 10⁻⁵ | 1.85 × 10⁻⁵ | 1.34 × 10⁻⁵ | 2.01 × 10⁻⁵ | 2.01 × 10⁻⁵ | 1.44 × 10⁻⁵ |
| LU | species/yr | 1.03 × 10⁻⁹ | 1.20 × 10⁻⁹ | 1.56 × 10⁻⁹ | 7.76 × 10⁻¹⁰ | 7.76 × 10⁻¹⁰ | 1.67 × 10⁻⁹ |
| MRS | USD | 0.00122 | 0.00084 | 0.000607 | 0.000915 | 0.000915 | 0.000652 |
| FRS | USD | 0.048942 | 0.033884 | 0.024773 | 0.040262 | 0.040262 | 0.02913 |
| WCHH | DALY | 1.65 × 10⁻⁸ | 1.13 × 10⁻⁸ | 8.19 × 10⁻⁹ | 1.24 × 10⁻⁸ | 1.24 × 10⁻⁸ | 8.82 × 10⁻⁹ |
| WCTE | species/yr | 1.00 × 10⁻¹⁰ | 6.89 × 10⁻¹¹ | 4.98 × 10⁻¹¹ | 7.52 × 10⁻¹¹ | 7.52 × 10⁻¹¹ | 5.36 × 10⁻¹¹ |
| WCAE | species/yr | 4.48 × 10⁻¹⁵ | 3.08 × 10⁻¹⁵ | 2.23 × 10⁻¹⁵ | 3.36 × 10⁻¹⁵ | 3.36 × 10⁻¹⁵ | 2.40 × 10⁻¹⁵ |
| Categories | Unit | N50, D1 | N50, D2 | N50, D3 | N100, D1 | N100, D2 | N100, D3 |
|---|---|---|---|---|---|---|---|
| GWHH | DALY | 3.43 × 10⁻⁶ | 2.43 × 10⁻⁶ | 1.90 × 10⁻⁶ | 3.91 × 10⁻⁶ | 2.56 × 10⁻⁶ | 2.26 × 10⁻⁶ |
| GWTE | species/yr | 6.86 × 10⁻⁹ | 4.87 × 10⁻⁹ | 3.81 × 10⁻⁹ | 7.82 × 10⁻⁹ | 5.12 × 10⁻⁹ | 4.52 × 10⁻⁹ |
| GWFE | species/yr | 1.87 × 10⁻¹³ | 1.33 × 10⁻¹³ | 1.04 × 10⁻¹³ | 2.13 × 10⁻¹³ | 1.40 × 10⁻¹³ | 1.23 × 10⁻¹³ |
| SOD | DALY | 6.47 × 10⁻⁹ | 4.57 × 10⁻⁹ | 3.54 × 10⁻⁹ | 1.16 × 10⁻⁸ | 7.55 × 10⁻⁹ | 6.57 × 10⁻⁹ |
| IR | DALY | 7.64 × 10⁻¹⁰ | 5.36 × 10⁻¹⁰ | 4.10 × 10⁻¹⁰ | 7.36 × 10⁻¹⁰ | 4.78 × 10⁻¹⁰ | 4.16 × 10⁻¹⁰ |
| OFHH | DALY | 6.61 × 10⁻¹⁰ | 4.63 × 10⁻¹⁰ | 3.52 × 10⁻¹⁰ | 6.31 × 10⁻¹⁰ | 4.08 × 10⁻¹⁰ | 3.54 × 10⁻¹⁰ |
| FPMF | DALY | 5.93 × 10⁻⁷ | 4.15 × 10⁻⁷ | 3.17 × 10⁻⁷ | 6.15 × 10⁻⁷ | 3.98 × 10⁻⁷ | 3.45 × 10⁻⁷ |
| OFTE | species/yr | 9.59 × 10⁻¹¹ | 6.72 × 10⁻¹¹ | 5.11 × 10⁻¹¹ | 9.16 × 10⁻¹¹ | 5.93 × 10⁻¹¹ | 5.13 × 10⁻¹¹ |
| TA | species/yr | 5.80 × 10⁻¹⁰ | 4.08 × 10⁻¹⁰ | 3.12 × 10⁻¹⁰ | 6.84 × 10⁻¹⁰ | 4.43 × 10⁻¹⁰ | 3.85 × 10⁻¹⁰ |
| FEU | species/yr | 1.47 × 10⁻¹⁰ | 1.03 × 10⁻¹⁰ | 7.80 × 10⁻¹¹ | 1.40 × 10⁻¹⁰ | 9.05 × 10⁻¹¹ | 7.82 × 10⁻¹¹ |
| MEU | species/yr | 8.98 × 10⁻¹⁴ | 6.28 × 10⁻¹⁴ | 4.77 × 10⁻¹⁴ | 8.57 × 10⁻¹⁴ | 5.54 × 10⁻¹⁴ | 4.78 × 10⁻¹⁴ |
| TET | species/yr | 1.73 × 10⁻¹¹ | 1.21 × 10⁻¹¹ | 9.19 × 10⁻¹² | 1.65 × 10⁻¹¹ | 1.07 × 10⁻¹¹ | 9.22 × 10⁻¹² |
| FET | species/yr | 9.78 × 10⁻¹² | 6.84 × 10⁻¹² | 5.20 × 10⁻¹² | 9.33 × 10⁻¹² | 6.03 × 10⁻¹² | 5.21 × 10⁻¹² |
| MET | species/yr | 1.72 × 10⁻⁸ | 1.20 × 10⁻⁸ | 9.13 × 10⁻⁹ | 1.64 × 10⁻⁸ | 1.06 × 10⁻⁸ | 9.15 x 10⁻⁹ |
| HCT | DALY | 2.72 × 10⁻⁶ | 1.90 × 10⁻⁶ | 1.45 × 10⁻⁶ | 2.60 × 10⁻⁶ | 1.68 × 10⁻⁶ | 1.45 × 10⁻⁶ |
| HNCT | DALY | 3.11 × 10⁻⁵ | 2.18 × 10⁻⁵ | 1.65 × 10⁻⁵ | 2.97 × 10⁻⁵ | 1.92 × 10⁻⁵ | 1.66 × 10⁻⁵ |
| LU | species/yr | 1.20 × 10⁻⁹ | 1.41 × 10⁻⁹ | 1.93 × 10⁻⁹ | 1.14 × 10⁻⁹ | 1.24 × 10⁻⁹ | 1.93 × 10⁻⁹ |
| MRS | USD | 0.001415 | 0.00099 | 0.000751 | 0.00135 | 0.000873 | 0.000754 |
| FRS | USD | 0.056742 | 0.039933 | 0.03068 | 0.059371 | 0.038572 | 0.033656 |
| WCHH | DALY | 1.91 × 10⁻⁸ | 1.34 × 10⁻⁸ | 1.01 × 10⁻⁸ | 1.82 × 10⁻⁸ | 1.18 × 10⁻⁸ | 1.02 × 10⁻⁸ |
| WCTE | species/yr | 1.16 × 10⁻¹⁰ | 8.12 × 10⁻¹¹ | 6.17 × 10⁻¹¹ | 1.11 × 10⁻¹⁰ | 7.17 × 10⁻¹¹ | 6.20 × 10⁻¹¹ |
| WCAE | species/yr | 5.19 × 10⁻¹⁵ | 3.63 × 10⁻¹⁵ | 2.76 × 10⁻¹⁵ | 4.96 × 10⁻¹⁵ | 3.21 × 10⁻¹⁵ | 2.77 × 10⁻¹⁵ |
| Categories | Unit | N50, D1 | N50, D2 | N50, D3 | N100, D3 | N100, D1 | N100, D2 | N100, D3 |
|---|---|---|---|---|---|---|---|---|
| GWHH | DALY | 0.000177 | 0.000136 | 0.000125 | 3.33 × 10⁻⁵ | 3.44 × 10⁻⁵ | 3.3 × 10⁻⁵ | 3.33 × 10⁻⁵ |
| GWTE | species/yr | 3.55 × 10⁻⁷ | 2.71 × 10⁻⁷ | 2.50 × 10⁻⁷ | 6.67 × 10⁻⁸ | 6.88 × 10⁻⁸ | 6.63 × 10⁻⁸ | 6.67 × 10⁻⁸ |
| GWFE | species/yr | 9.68 × 10⁻¹² | 7.40 × 10⁻¹² | 6.82 × 10⁻¹² | 1.82 × 10⁻¹² | 1.88 × 10⁻¹² | 1.81 × 10⁻¹² | 1.82 × 10⁻¹² |
| SOD | DALY | 3.35 × 10⁻⁷ | 2.55 × 10⁻⁷ | 2.32 × 10⁻⁷ | 9.68 × 10⁻⁸ | 1.02 × 10⁻⁷ | 9.78 × 10⁻⁸ | 9.68 × 10⁻⁸ |
| IR | DALY | 3.95 × 10⁻⁸ | 2.99 × 10⁻⁸ | 2.69 × 10⁻⁸ | 6.13 × 10⁻⁹ | 6.48 × 10⁻⁹ | 6.19 × 10⁻⁹ | 6.13 × 10⁻⁹ |
| OFHH | DALY | 3.42 × 10⁻⁸ | 2.58 × 10⁻⁸ | 2.31 × 10⁻⁸ | 5.21 × 10⁻⁹ | 5.55 × 10⁻⁹ | 5.29 × 10⁻⁹ | 5.21 × 10⁻⁹ |
| FPMF | DALY | 3.07 × 10⁻⁵ | 2.31 × 10⁻⁵ | 2.08 × 10⁻⁵ | 5.09 × 10⁻⁶ | 5.41 × 10⁻⁶ | 5.16 × 10⁻⁶ | 5.09 × 10⁻⁶ |
| OFTE | species/yr | 4.96 × 10⁻⁹ | 3.74 × 10⁻⁹ | 3.36 × 10⁻⁹ | 7.57 × 10⁻¹⁰ | 8.06 × 10⁻¹⁰ | 7.69 × 10⁻¹⁰ | 7.57 × 10⁻¹⁰ |
| TA | species/yr | 3.00 × 10⁻⁸ | 2.27 × 10⁻⁸ | 2.05 × 10⁻⁸ | 5.67 × 10⁻⁹ | 6.02 × 10⁻⁹ | 5.74 × 10⁻⁹ | 5.67 × 10⁻⁹ |
| FEU | species/yr | 7.59 × 10⁻⁹ | 5.72 × 10⁻⁹ | 5.12 × 10⁻⁹ | 1.15 × 10⁻⁹ | 1.23 × 10⁻⁹ | 1.17 × 10⁻⁹ | 1.15 × 10⁻⁹ |
| MEU | species/yr | 4.65 × 10⁻¹² | 3.50 × 10⁻¹² | 3.13 × 10⁻¹² | 77.05 × 10⁻¹³ | 7.54 × 10⁻¹³ | 7.18 × 10⁻¹³ | 7.05 × 10⁻¹³ |
| TET | species/yr | 8.94 × 10⁻¹⁰ | 6.74 × 10⁻¹⁰ | 6.04 × 10⁻¹⁰ | 1.36 × 10⁻¹⁰ | 1.45 × 10⁻¹⁰ | .1.38 × 10−10 | 1.36 × 10⁻¹⁰ |
| FET | species/yr | 5.06 × 10⁻¹⁰ | 3.81 × 10⁻¹⁰ | 3.41 × 10⁻¹⁰ | 7.68 × 10⁻¹¹ | 8.21 × 10⁻¹¹ | 7.82 × 10⁻¹¹ | 7.68 × 10⁻¹¹ |
| MET | species/yr | 8.89 × 10⁻⁷ | 6.69 × 10⁻⁷ | 5.99 × 10⁻⁷ | 1.35 × 10⁻⁷ | 1.44 × 10⁻⁷ | 1.37 × 10⁻⁷ | 1.35 × 10⁻⁷ |
| HCT | DALY | 0.000141 | 0.000106 | 9.50 × 10⁻⁵ | 2.14 × 10⁻⁵ | 2.28 × 10⁻⁵ | 2.18 × 10⁻⁵ | 2.14 × 10⁻⁵ |
| HNCT | DALY | 0.001612 | 0.001213 | 0.001087 | 0.000245 | 0.000261 | 0.000249 | 0.000245 |
| LU | species/yr | 6.20 × 10⁻⁸ | 7.85 × 10⁻⁸ | 1.27 × 10⁻⁷ | 2.85 × 10⁻⁸ | 1.01 × 10⁻⁸ | 1.61 × 10⁻⁸ | 2.85 × 10⁻⁸ |
| MRS | USD | 0.073199 | 0.055103 | 0.049343 | 0.011108 | 0.011876 | 0.011309 | 0.011108 |
| FRS | USD | 2.936431 | 2.223787 | 2.01486 | 0.495994 | 0.522288 | 0.499905 | 0.495994 |
| WCHH | DALY | 9.88 × 10⁻⁷ | 7.44 × 10⁻⁷ | 6.66 × 10⁻⁷ | 1.50 × 10⁻⁷ | 1.60 × 10⁻⁷ | 1.53 × 10⁻⁷ | 1.50 × 10⁻⁷ |
| WCTE | species/yr | 6.01 × 10⁻⁹ | 4.52 × 10⁻⁹ | 4.05 × 10⁻⁹ | 9.13 ×10⁻¹⁰ | 9.76 × 10⁻¹⁰ | 9.29 × 10⁻¹⁰ | 9.13 × 10⁻¹⁰ |
| WCAE | species/yr | 2.69 × 10⁻¹³ | 2.02 ×10⁻¹³ | 1.81 ×10⁻¹³ | 4.09 ×10⁻¹⁴ | 4.36 ×10⁻¹⁴ | 4.16 × 10⁻¹⁴ | 4.09 × 10⁻¹⁴ |
© 2020 by the authors. Licensee MDPI, Basel, Switzerland. This article is an open access article distributed under the terms and conditions of the Creative Commons Attribution (CC BY) license (http://creativecommons.org/licenses/by/4.0/).
Share and Cite
Campiglia, E.; Gobbi, L.; Marucci, A.; Rapa, M.; Ruggieri, R.; Vinci, G. Hemp Seed Production: Environmental Impacts of Cannabis sativa L. Agronomic Practices by Life Cycle Assessment (LCA) and Carbon Footprint Methodologies. Sustainability 2020, 12, 6570. https://doi.org/10.3390/su12166570
Campiglia E, Gobbi L, Marucci A, Rapa M, Ruggieri R, Vinci G. Hemp Seed Production: Environmental Impacts of Cannabis sativa L. Agronomic Practices by Life Cycle Assessment (LCA) and Carbon Footprint Methodologies. Sustainability. 2020; 12(16):6570. https://doi.org/10.3390/su12166570
Chicago/Turabian StyleCampiglia, Enio, Laura Gobbi, Alvaro Marucci, Mattia Rapa, Roberto Ruggieri, and Giuliana Vinci. 2020. "Hemp Seed Production: Environmental Impacts of Cannabis sativa L. Agronomic Practices by Life Cycle Assessment (LCA) and Carbon Footprint Methodologies" Sustainability 12, no. 16: 6570. https://doi.org/10.3390/su12166570
APA StyleCampiglia, E., Gobbi, L., Marucci, A., Rapa, M., Ruggieri, R., & Vinci, G. (2020). Hemp Seed Production: Environmental Impacts of Cannabis sativa L. Agronomic Practices by Life Cycle Assessment (LCA) and Carbon Footprint Methodologies. Sustainability, 12(16), 6570. https://doi.org/10.3390/su12166570