Article

Movie Production Efficiency Moderating between Online Word-of-Mouth and Subsequent Box Office Revenue

1
College of Business Administration, Sejong University, Seoul 05006, Korea
2
Department of Software, Sejong University, Seoul 05006, Korea
*
Author to whom correspondence should be addressed.
Sustainability 2020, 12(16), 6602; https://doi.org/10.3390/su12166602
Submission received: 23 July 2020 / Revised: 6 August 2020 / Accepted: 10 August 2020 / Published: 14 August 2020
(This article belongs to the Section Economic and Business Aspects of Sustainability)

Abstract

:
The studies are almost nonexistent regarding production efficiency of movies which is determined based on the relationship between movie resources powers (powers of actors, directors, distributors, and production companies) and box office. Our study attempts to examine how efficiency moderates the relationship between eWOM (online word-of-mouth) and revenue, and to show the difference in prediction performance between efficient and inefficient movies. Using data envelopment analysis to suggest efficiency of movies, movie efficiency negatively moderates the effects of review depth and volume on subsequent box office revenue compensating negative effects of smaller box office in previous period while efficiency exert a positive moderating effect on the influences of review rating and the number of positive reviews on revenue. This shows that review depth and volume are affected by the slack of movie resources powers for inefficient movies, and high rating and positive response for efficient movies to affect revenue. The results of decision trees, k-nearest-neighbors, and linear regression analysis based on ensemble methods using eWOM or movie variables indicate that the movies with the inefficient movie resources powers are providing greater prediction performance than movies with efficient movie resources powers. This show that diverse variation in the efficiency of movie resources powers contributes to prediction performance.

1. Introduction

The movie industry globally represents one of the fastest developing industries [1]. As box office indicates a direct performance of the movie industry, it represents a crucial issue for assessing the movie success [2,3,4]. The effective prediction of box office is crucial for decreasing market risk, increasing the competitiveness of the movie industry, and promoting the development of a movie-related market for derivative products [5]. Box office prediction always constitute a critical issue in the movie industry.
The factors that exert an influence on a movie’s box office include, for example, socket price, the number of cinema showing a film, number of other movies released at the same time, weather during release, social environment, along with advertising and so on. Thus, it is a complicated task to forecast movie box office, as it is a difficult issue to figure out the crucial factors the volatility of box-office revenue [2,6]. There exists a high risk of accomplishing the break-even point for newly released motion pictures as it is difficult to predict the public’s taste. Only when the box office are accurately predicted, the theatre managers can determine the number of releases and the schedule for showing movie and so on.
The study provides the following motivations in the context of previous studies on predicting box office. First, our study attempts to examine how eWOM (online word-of-mouth) interacts with efficiency to affect revenue. Movie budget is an important determinant for box office [7], and resource powers such as star powers which largely represent movie budget, are greatly likely to affect box office revenue [8,9]. As the studies on movie efficiency are lacking [10,11], our research suggests production efficiency to show additional insights to previous studies as we show four resources powers (powers of actors, directors, distributors, and production companies) as a whole to indicate how much resources are expensed in movie production and indicate the efficiency of resources in producing box office. Thus, our study represents in a more collective manner how much resources are efficiency expensed in terms of box office. This study investigates the efficiency of movies using data envelopment analysis (DEA) and shows the influence of the interaction between eWOM and movie efficiency on subsequent box office revenue.
The characteristics of eWOM encompass volume of total eWOM messages, volume of the comments and retweets in the microblogs, percentage of positive or negative eWOM [12,13]. The influences of eWOM such as review valence and volume on sales have been extensively investigated [14,15,16,17,18]. The relationship between eWOM and product sales can be affected by product traits. Zhu & Zhang [19] examined eWOM’s effect on product sales and suggested that it is affected by consumer and product and characteristics. Lee et al. [20] showed that Facebook “likes” affect sales in social commerce, while product and deal characteristics can be moderators in this influence. In this line of research regarding the relationship between eWOM and product sales, our study focus on movie efficiency as moderators between eWOM and subsequent box office. Where many studies have utilized DEA to analyze the efficiency of businesses, no studies consider moderating effect of production efficiency which is produced from DEA on beyond the concurrent revenue. This study attempts to fill this void.
Second, this study attempts to classify movies according to production efficiency and compares the prediction performance of business intelligence (BI) methods (decision trees using bagging, k-nearest-neighbors using bagging, linear regression using bagging) between efficient and inefficient movies. While there exist previous studies applying various BI methods to predict box office, few studies have considered how the prediction performance becomes different between efficient and inefficient movies. This study attempts to fill this void. Especially, this study adopts DEA to classify movies into efficient and inefficient movies based on input of resources to have the box office revenue. This study posits to use non-statistical and statistical methods to apply a more balanced use of BI methods, and utilizes ensemble methods to improve performance by averaging multiple random movie samples.

2. Production Efficiency for Box Office

Our study posits to adopt production efficiency suggested by DEA as a crucial construct for explaining and predicting beyond the concurrent box office. Although many studies have used business intelligence techniques to forecast box office revenue, the studies using production efficiency of movies are almost nonexistent. Production efficiency is determined based on the relationship between movie resources powers (powers of actors, directors, distributors, and production companies) and box office revenue. Movie budget is a crucial factor for box office [7], and resource powers such as star powers which largely determine movie budget has been posited to affect box office revenue [8,9].
DEA which is described as a non-parametric efficiency measurement approach [21] adopts linear programming to create a piecewise linear production frontier in order to suggest production efficiency pf movies. The efficient frontier is enveloping all records as reference sample against which each decision making unit (DMU) is evaluated [22]. DEA does not require a priori assumption on the production and distribution function [23]. According to classic CCR model [21], our DEAR model can be represented as the following model (1):
θ 0 = m a x r = 1 S u r y r o i 1 = 1 I 1 v i 1 x i 1 0 + i 2 = 1 I 2 v i 2 x i 2 0 + i 3 = 1 I 3 v i 3 x i 3 0 + i 4 = 1 I 4 v i 4 x i 4 0
s . t .   r = 1 S u r y r o i 1 = 1 I 1 v i 1 x i 1 0 + i 2 = 1 I 2 v i 2 x i 2 0 + i 3 = 1 I 3 v i 3 x i 3 0 + i 4 = 1 I 4 v i 4 x i 4 0   1 ,   j = 1 ,   2 ,   n  
u r ,   v i 1 ,   v i 2 ,   v i 3 ,   v i 4 0 ,   r = 1 ,   2 ,   ,   S    i 1 = 1 ,   2 ,       , I 1 . i 2 = 1 ,   2 ,       ,   I 2 ,       i 3 = 1 ,   2 ,       ,   I 3 ,       i 4 = 1 ,   2 ,       ,   I 4 ( 1 )
where v i 1 ,   v i 2 ,   v i 3 ,   v i 4 ,   u r , are the weights on inputs x i 1 , x i 2 ,   x i 3 ,   x i 4 (movie resource powers), and outputs yr (box office) respectively.
The applications of DEA encompass efficiency analysis of controls [24], the relative efficiency of IC design firms [25], operational efficiencies of city bus systems [26], the effect of electronic health record implementation on hospitals’ productivity [27], evaluation of investment [28], strategic R&D portfolio management [29], measuring regional competitiveness [30], productivity assessment of IT service industry [31], project portfolio selection [32], prioritization of patients [33].
There exists the line research on the moderators in the relationship between eWOM and product sales [19,20]. Based on this line of research concerning the relationship between eWOM and product sales, our study investigate movie efficiency as moderators between eWOM and beyond the concurrent box office.
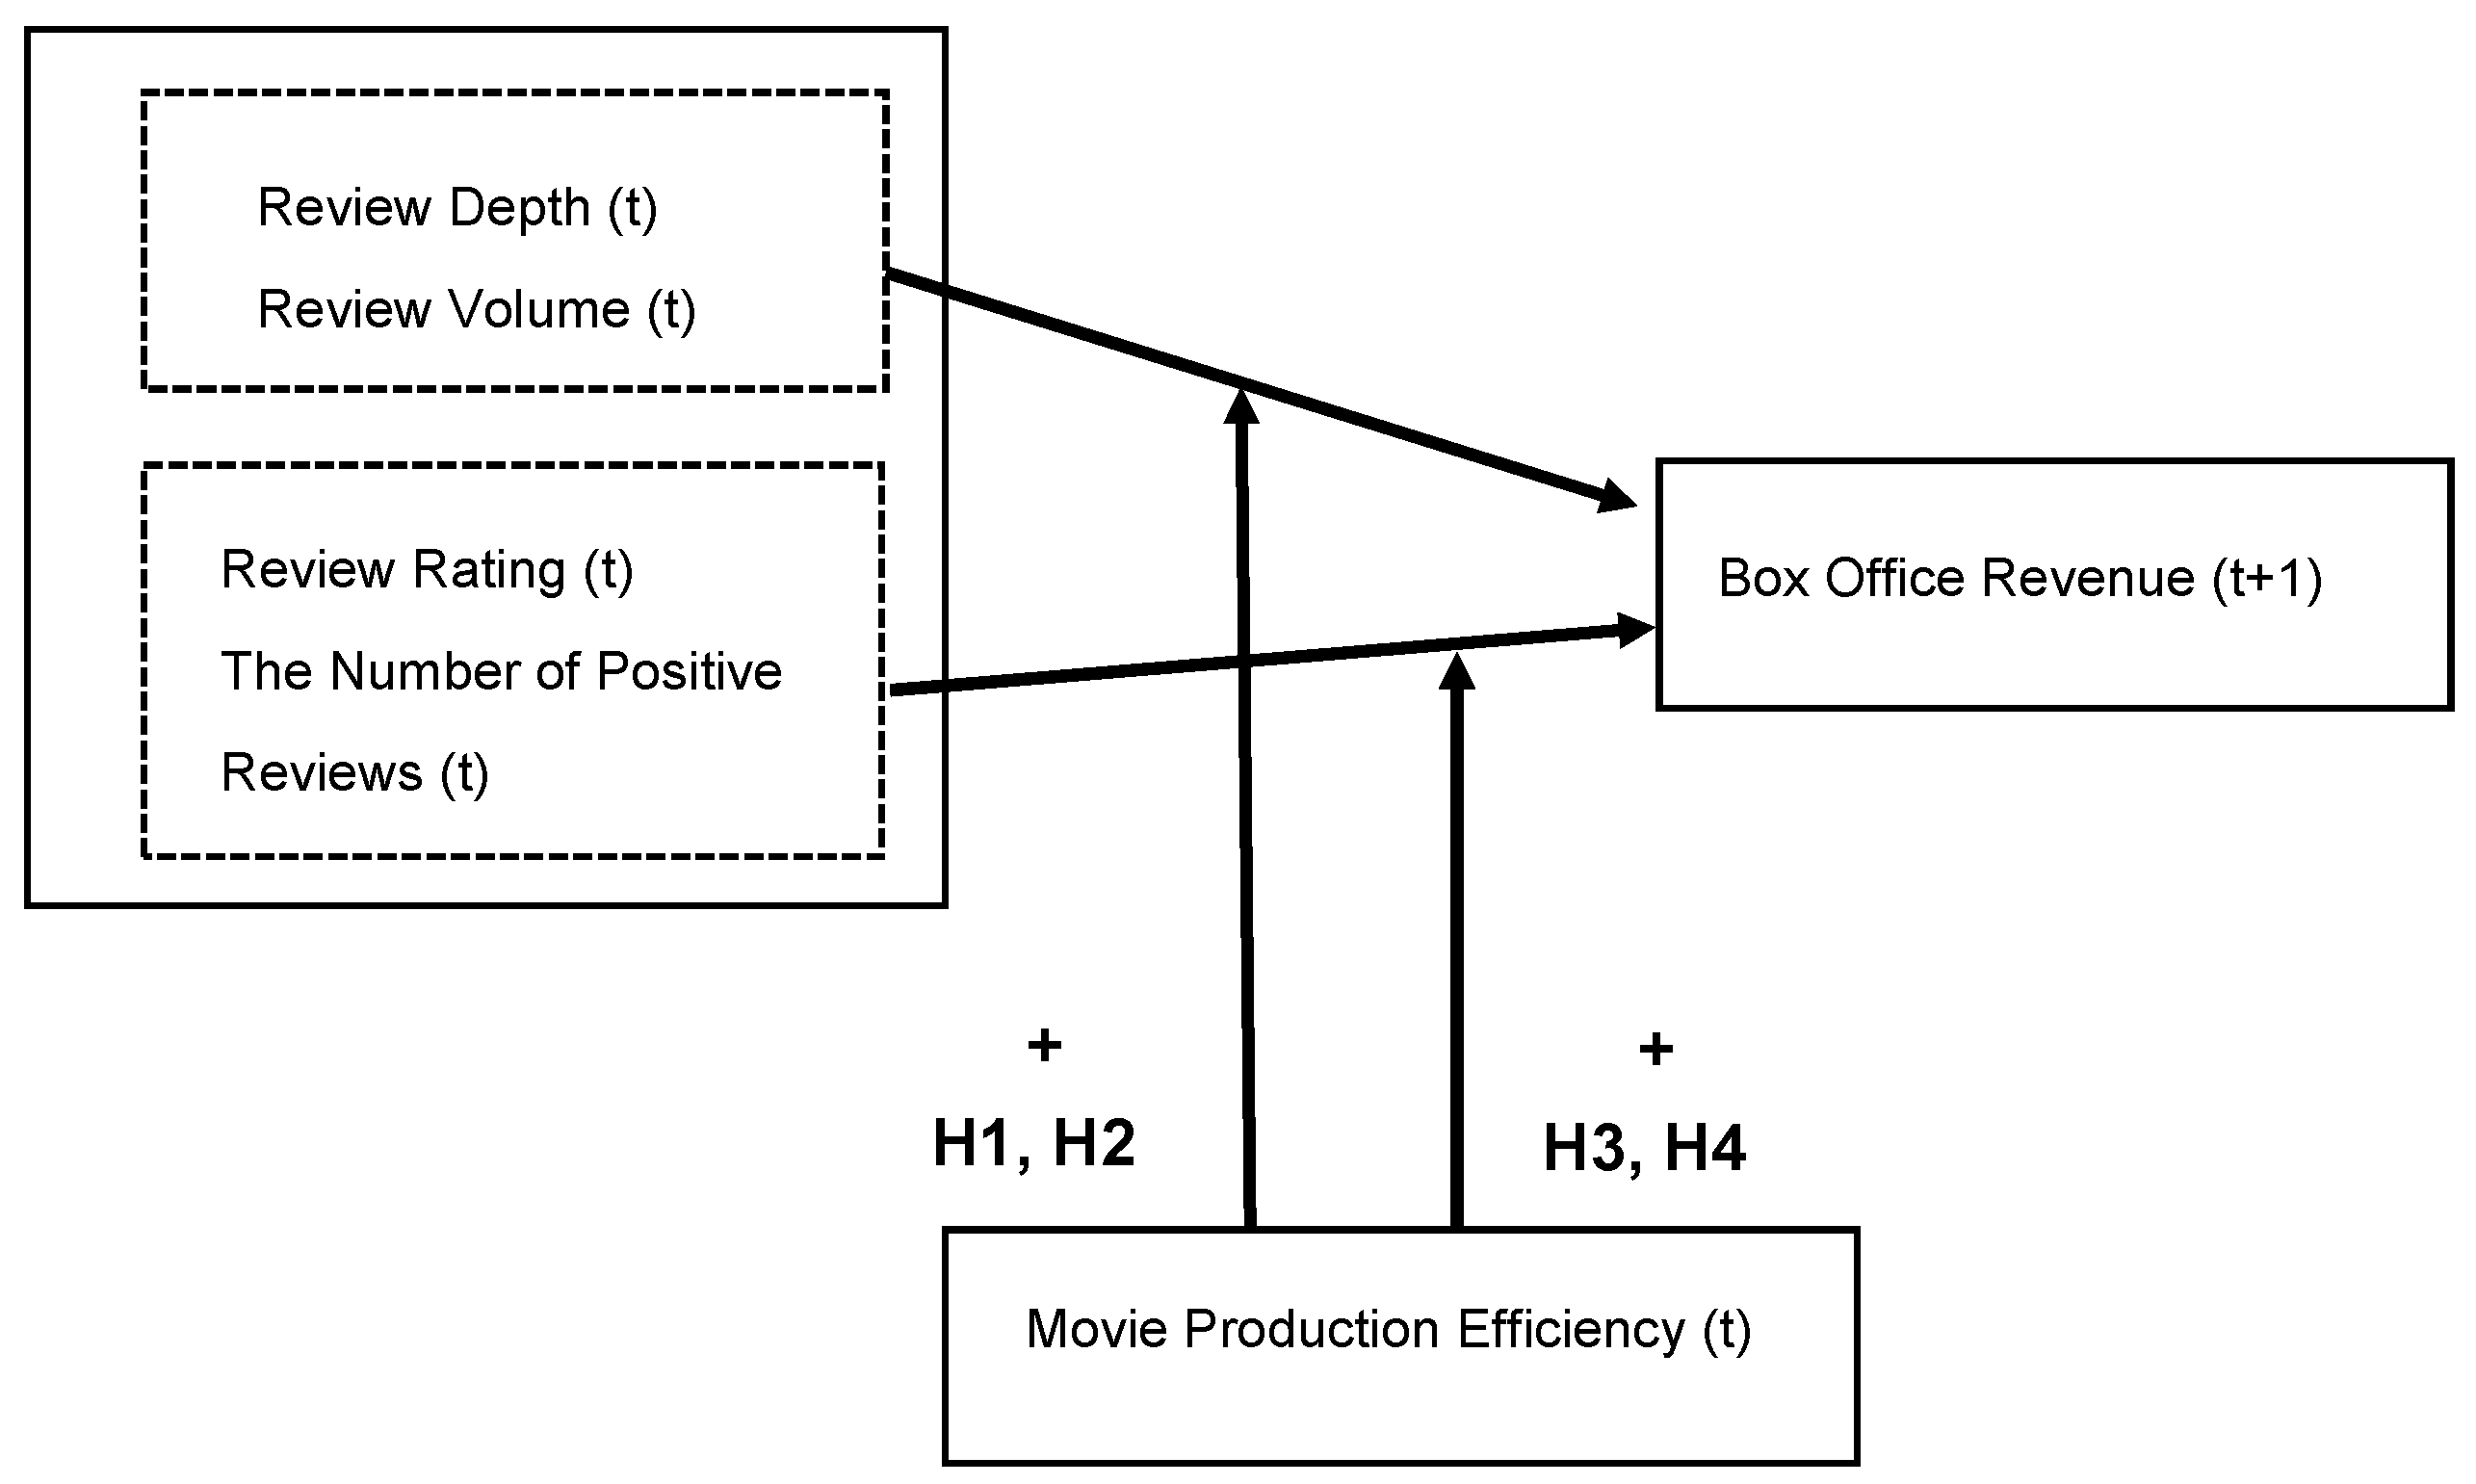
3. Research Model

As movie budget comprises a crucial factor for box office [7], and it is important to considers resource powers such as celebrity powers which determine movie budget affecting box office revenue [8,9], and to more effectively examine the effect of eWOM along with resource powers, this study introduces movie efficiency of movie resources powers (power (past total revenue) of actors, directors, distributors, production companies) for revenue and investigates the moderating effect of efficiency on between eWOM and subsequent box office revenue. This is to extend the line research regarding the moderators in the relationship between eWOM and product sales [19,20]. The research model is presented in Figure 1.
This study uses four eWOM variables, i.e., review depth, review volume, review rating, the number of positive reviews. Review depth and volume represent quantity aspect of eWOM and are related to awareness effect and the amount of activities participating in online reviews. The distribution extent of eWOM affects movie sales in promoting consumer awareness [34]. eWOM’s awareness plays a central role in the positive feedback mechanism. eWOM dissemination ensures a popular movie to generate buzz, which subsequently results in even higher box office sales. Review depth and volume can be influenced by movie efficiency if movies are showing large movie resources powers associated with great box office which are likely to provide awareness effect. People are encouraged to perform online activities if the movies are already created using high profile actors, directors, distributors, and production companies, and if the movie further results in great subsequent box office. Thus, although slack resources powers exist, if this is accompanied by great subsequent box office, they increase review depth and volume which in turn increases subsequent box office revenue. Efficiency which represents efficient slack resources associated with box office has a positive moderating effect on review depth and volume for beyond the concurrent box office revenue.
Hypothesis 1.
Movie efficiency exerts a positive moderating effect on between review depth and beyond the concurrent box office revenue.
Hypothesis 2.
Movie efficiency exerts a positive moderating effect on between review volume and beyond the concurrent box office revenue.
As increases in eWOM valence could increase sales, eWOM’s effect on product evaluation results in the positive feedback mechanism [34] and persuasion effect. Review rating and the number of positive reviews show the valence aspect of reviews, and are representing reviewer evaluation value providing persuasion effect regardless of the amount of activities. Thus, as movie efficiency increases, this is likely to increase review rating and the volume of positive review, and ultimately improve beyond the concurrent box office revenue as review rating and the volume of positive review are related to revenue by themselves. Thus, efficiency which positively represents the likelihood of good evaluation has a positive moderating effect on review rating and the number of positive reviews for subsequent box office.
Hypothesis 3.
Movie efficiency exerts a positive moderating effect on between review rating and beyond the concurrent box office revenue.
Hypothesis 4.
Movie efficiency exerts a positive moderating effect on between the number of positive reviews and beyond the concurrent box office revenue.
Efficient movies are determined according to use of movie resources powers in comparison with revenue. DEA optimizes on individual movie and offers the set of Pareto-efficient movies in the form of a discrete piecewise frontier. For the pairs of the movies resources powers and revenues, the inefficiency of movies that position below the frontier is provided. This inefficiency can be provided by comparing with a single referent movie that positions on the frontier and shows a greater level of revenue having the same level of movie resources powers. Thus, the values of movie resources powers of efficient movies lie on efficient movie production frontier, and show limited variation compared to inefficient movies. This may limit sufficient learning of movie prediction models using learning samples to ensure high performance in validation samples. Thus, the prediction using eWOM and movie related variables is having lower performance in efficient subsamples than in inefficient subsamples.
Hypothesis 5.
The inefficient subsample of movies provides a greater prediction performance than the efficient subsample of movies.

4. Methods

Our study procedures in terms of methods are shown in Figure 2. The explanations for each steps are as follows.
(1) Collection of eWOM and movie data from movie site and efficiency analysis of movies comparing star, directors, distributors and production companies power with box office revenue
Previous studies suggest determinants for box office revenue which are largely classified into movie characteristics and WOM. Movie characteristics encompass genre, sequel, star power, screens in opening week, production budget, and advertising. For instance, the presence of a star increases box office revenue [9]. Treme [8] showed that actors power comprises a crucial factor for box office revenue, meaning that publicity derived from celebrity encourages consumers to watch movies. In addition to star or celebrity power, this study adopts directors and production companies power in terms of total admission and revenue.
Previous studies suggest review volume and rating (review valence) as positive eWOM factors for box office revenue [14]. The effects of eWOM in movie industry are elusive as the effects of review volume and valence on product sales are not consistently significant. For instance Duan et al. [15] showed that the volume of eWOM is significantly influencing box office revenue using aggregated national data, while Chintagunta et al. [14] indicated that valence is a significant factor for box office revenue using local geographic box office for designated market area (DMA). Dellarocas et al. [35] showed an U-shaped relationship between box office and a customer’s likelihood to review and that movie watchers are more likely to create reviews for much obscure movies or much high-grossing movies.
eWOM characteristics encompass volume of eWOM, volume of the comments inthe microblogs, percentage of positive or negative eWOM [13,36]. Our study uses review depth, review volume, review rating, and the number of positive review.
This study utilizes daily movie ticket sales data from the movies released from between November 2003 and February 2005. The final sample includes 1640 movies. The eWOM and movie related data were collected from the Naver Movies website (see http://movie.naver.com/) from three weeks before release to three weeks after release. The revenues and powers data are obtained from KOFIC (see https://www.kofic.or.kr/) site which is a public site to support Korean movie industry. The study chooses independent variables based on previous studies conducted in this field, which are significant in many cases. The variables used in this study are suggested in Table 1. The examples of movie sample are shown in Table A1 in Appendix A.
(2) Examine the moderating effect of efficiency on eWOM for box office and classifying movies into efficient and inefficient movies
In order to investigate the efficiency of movies, DEA model is analyzed using a DEA software which uses radial improvement and constant returns in both inputs and outputs as the means to scale the DEA model. DEA provides multiple analyses of the efficiency for various pairs of inputs (movie resources power) and outputs (box office revenue).
The distributions of efficiency and movie related variables are presented in Table 2 and Table 3. Table 2 presents that the week 1 after release shows significantly greater efficiency than week 2 and 3. Week 2 exhibits significantly greater efficiency than week 3. This indicates that as time passes, the efficiency of movies decreases with the decrease of revenue and with constant movie resources powers.
Table 3 shows that in week 1, fantasy movies, Korean movies, awarded movies, adults and teenager movies, sequel movies, movies released in holidays show greater efficiency than the other classes of movies. Different classes of movies are showing different efficiency in using movie resources powers for box office revenue.
This study uses multiple regression analysis to test the moderating effect of production efficiency. Further this study uses decision trees using bagging, k-nearest-neighbors method using bagging, linear regression analysis using bagging for the prediction of revenue.
(3) Applying BI methods to efficient and efficient movies and comparing their prediction performance
DEA has been also applied in connection with data mining. For instance, DEA has been used in conjunction with discriminant analysis to assess the criticality of R&D expenditure [37], organizational decision support systems with the capabilities combining various methods DEA, cluster analysis, decision trees [38], Tobit analysis for efficiency analysis of microfinance institutions [39]. Our study intends to extend this hybrid approach of DEA with decision trees, k-nearest-neighbors, and linear regression.
By adopting statistical or probabilistic models, many previous work suggested the prediction of box office using IMDB data through stochastic or regression models [2,14]. As machine learning methods, previous studies suggested approaches such as Bayesian networks [40] and neural networks [6]. For instance, Zhang et al. [6] used artificial neural networks (ANN) to classify box office size into one of six predefined classes. Lee & Chang [40] adopted a Bayesian network to classify box office performance into one of three categories, according to the number of audience.
While most theatre chains use brainstorming method for forecasting box office, this may result in low box office and thus, a rigorous approach to forecast box office revenue has a crucial effect the competitiveness of theatres. While there exist complicated issues in the unpredictable nature of box office prediction, several researchers have suggested models primarily utilizing statistics-based forecasting approaches or machine learning approaches like multi-layer perceptron neural networks to suggest the solutions for forecasting box office [6]. For instance, Delen et al. [41] suggested forecasting models for motion picture success by using discriminant analysis, decision trees, and artificial neural network to determine the class of the box office size. While box office prediction is a forecasting problem for real values, this has often been considered as a classification problem which forecasts to show whether a specific movie can show greater revenue than a certain extent [36].
Because this study posits to utilize both non-statistical and statistical BI methods to evaluate how they are different in terms of forecasting performance, this study utilizes three BI methods along with the approaches of combining classifications which create a fast way to provide better solutions [42]. Bagging increases model’s performance stability and supports avoiding overfitting by using separate modelings based on different data samples for combining the results. These approaches are utilized to evaluate the difference of forecasting performance between high and low efficiency subsample.
In order to utilize decision trees, k-nearest-neighbors methods, and regression analysis using bagging, 10 separate learner models are created and combined to present the box office prediction. This approach adjusts the count of “weak” classification models which are built. The ensemble method will stop when the number or classification models created reaches the value set for this option.
In decision trees methods, a decision tree is produced in which each decision node comprising the tree provides a test for some predictor’s value. Decision trees method is constructed through binary recursive partitioning. This represents an iterative process that creates splitting of the data into branches, and then proceeds dividing each branch into smaller groups as the approach is moving up each branch. The tree terminal nodes show the predicted values for output variable. Our study does not require the limit regarding conditions in pruning trees and tree growth.

5. Experimental Results

In case of the box office revenue at week t, the study uses the eWOM and efficiency as independent variables, and movie related variables as control variables at week t-1. Table 4, Table 5, Table 6, Table 7, Table 8 and Table 9 indicate the multiple regression analysis result using four eWOM variables including review depth (t-1), review volume (t-1), review rating(t-1), the number of positive reviews (t-1), the interaction terms between four eWOM variables (t-1) and efficiency (t-1). The control variables include award (1 if movie is awarded), movie rating (2, 1, 0 if movie is for adults only, adults and teenagers (more than 12 years old), or family), sequel (1 if movie is a sequel movie), time of release (1 if movie is released in holidays starting) the revenue of similar movies (t-1), drama (1 if genre is drama), melodrama/romance (1 if genre is melodrama/romance), comedy (1 if genre is comedy), Korean movie (1 if Korean movie), US movie (1 if US movie). 1640 movies are used in multiple regression analysis.
The moderating effects of production efficiency can be assessed using the significance of interaction terms between eWOM and production efficiency in multiple regression analyses where the dependent variable is box office. Table 4 and Table 5 show regression analysis on the box office of second and third week after release where interaction term is about first and second week after release, respectively. Table 4 or Table 5 shows that efficiency provides a negative moderating effect on review depth and volume to affect revenue while efficiency shows a positive moderating effect on review rating and the number of positive reviews for revenue.
In order to assess the results of moderating effects and whether slack resources can affect eWOM, this study performs multiple regression analysis where each of eWOM variables is a dependent variable, and checks whether explanatory power of the regression analysis is different as a whole, which is determined by F values and adjusted R square. F values and adjusted R squares in Table 6 and Table 7 are greater than those of Table 8 and Table 9, which indicates that review depth and volume are more influenced by the movie resources powers than review rating and the number of positive reviews. This explains that the slack resources of inefficient movies can greatly affect revenue in subsequent period by influencing review depth and volume compensating negative effects of smaller box office in previous period. Thus, in contrast to our hypotheses indicating positive moderating effects of efficiency, the moderating effects of movie efficiency on eWOM variables become negative in case of review depth and volume. On the contrary, review rating and the number of positive reviews are much less influenced by movie resources powers than review depth and volume. Further, the greater efficiency represents less slack resources and the review rating and number of positive reviews which are less influenced by slack resources are positively moderated by production efficiency to affect revenue. As production efficiency represents that box office is great while there exists not so much resources power, there may exist other factors than brand powers such as scenario, and special effects etc. to make the movie successful and to make positive response from customers. This indicates that the moderating effects of efficiency on review rating and the number of positive reviews are positive. As a result, the moderating effects of movie efficiency on eWOM variables are negative for review depth and volume, and positive for review rating and the number of positive reviews.
While using the k-nearest-neighbor regression method, our study utilizes the training data set to forecast the value of an outcome variable for each target record in a validation or test data sample. The sample structure is composed of eWOM and movie variables along with box office. For each movie in the target data set, locate the closest movie (k = 1) of the training data set. The measure of Euclidean distance is utilized to assess how close each movie of the training sample is from the target movie. Linear regression is utilized against a dataset to predict box office based on eWOM and movie related variables. The linear regression model is applied toward a selected movie dataset that fits a linear model of the form.
This study intends to show the prediction function learned from the training data, which provides accurate box office prediction. Our paper uses non-statistical and statistical models to perform the box-office prediction. This study applies three business intelligence methods (decision trees, k-nearest-neighbors method, linear regression analysis) using bagging methods. In order to compare the prediction performance between efficient and inefficient subsample, the effect of sample size on prediction performance should be removed. The numbers of movies used in efficient and inefficient subsample should be adjusted to be same and this number is set to be the minimum of two subsamples. Thus, the pair of 469, 409, and 392 movies are included as subsamples in efficient and inefficient subsamples of movies for predicting box office revenue at week 1, 2, 3, respectively. The subsamples in three pairs are divided into two subsamples; a training sample and a validation sample. The training sample is used to estimate their parameters. The subsamples with 469, 409, 392 movies were divided into 31, 31, 30 subsets each of which has 15 or 10 movies, respectively. When each of these subsets is utlized as a validation sample each by each, the movies left over are utilized as training sample. That is, for comparing the prediction performance at week 1 between efficient and inefficient subsamples, 31 pairs of training and validation sample are composed each having 454 and 15 (or 459 and 10) movies, respectively. For comparing the prediction performance at week 2 between efficient and inefficient subsamples, 31 pairs of training and validation set are built each having 394 and 15 (or 399 and 10) movies, respectively. The n-fold cross validation of samples and three dependent variables of box office revenue are used to show the stability of the comparison results. Based on each training sample, BI methods provides a prediction result for the target variables in the corresponding validation sample. The prediction error is computed using root mean square residual. These predictions were contrasted with the true values in the validation sample to provide prediction errors; the prediction errors were then averaged across a number of validation samples.
The results in Table 10, Table 11 and Table 12 show that the average prediction errors are significantly lower in inefficient subsamples than efficient subsamples across week 1, 2, and 3 after release when eWOM, movie related variables, movie resources powers are used as independent variables, respectively. The results of decision trees, k-nearest-neighbors, and linear regression analysis based on ensemble methods show that the movies with the inefficient input of movie resources powers are providing less RMSE and greater prediction performance than movies with efficient input. This indicates that efficient movies may decrease prediction performance by limiting the variation of values in their sample necessary for better learning models. The inefficient movies are having more variation in their values in eWOM and movie related variables and this results in better leaning models and lower RMSE in validation samples, which is averaged across multiple validation samples.
Movie efficiency provides a negative moderating effect on review depth and volume of to affect revenue while movie efficiency shows a positive moderating effect on review rating and the number of positive reviews for revenue. Review depth and volume are influenced by the slack of movie resources powers to affect revenue. This explains that the slack resources of inefficient movies can influence revenue in subsequent week by exerting an effect on review depth and volume. This results in the negative moderating effects of movie efficiency on review depth and volume to affect beyond the concurrent box office. As production efficiency indicates that box office is accomplished while not so much resources power are used, other factors than brand powers such as scenario, and special effects etc. can exist to make the movie successful and to obtain positive response from movie watchers. Thus, review rating and the number of positive reviews are less influenced by slack resources and the interaction effects of review rating and the number of positive reviews with efficiency become positive. The moderation effects of production efficiency can be positively significant for review rating and the number of positive reviews to affect subsequent box office revenue.
The results of decision trees, k-nearest-neighbors, and linear regression analysis based on ensemble methods indicate that the movies with the inefficient input of movie resources powers are providing greater prediction performance than movies with efficient resources powers. This inefficiency may be calculated from comparing with a single referent movie that positions on the frontier and uses the same level of movie resources powers and provides a greater level of revenue [43]. The values of movie resources powers of efficient movies located on efficient frontier from DEA are having limited variations compared to inefficient movies. This may limit sufficient learning of movie prediction models using learning samples to ensure high performance in validation samples. This shows that more various efficiency values of movie resources powers result in diverse values of eWOM and movie related variables, which improves prediction performance. In case of efficient movies, the values of eWOM and movie related variables that are closely associated with movie resources powers are lacking variations necessary for better learning models in that movie resources powers follows only efficient frontier, decreasing prediction performance of eWOM and movie related variables. Thus, prediction performance can be improved by filtering out efficient movies from sample.

6. Conclusions and Implications

6.1. Implications to Research

The study provides several implications in the context of previous studies on predicting movie box office revenue. As movie budget is a critical factor for box office [7], it is important to consider movie resource powers such as star powers which determine movie budget for explaining box office [8,9]. This study considers movie efficiency in resource powers for box office and provides insights in the efficiency of movies by investigating how movie efficiency has a moderating effect on eWOM to affect revenue. Our research utilizing production efficiency is creating additional insights to former studies using star powers because we adopts four resources powers (powers of actors, directors, distributors, and production companies) as a whole to show how much resources are invested in movie production and indicate the efficiency of resources in producing subsequent box office. Thus, our study offers in a more collective manner how much resources are efficiently invested in terms of box office.
Our study adds insights to an existing movie literature on eWOM by suggesting production efficiency as a moderator between eWOM and subsequent box office. This is to strengthen the line of research concerning the moderators in the relationship between eWOM and product sales [19,20]. As production efficiency represents that box office is obtained with the efficient use of resources power and less slack resources, other factors (e.g., scenario, visual effects) than brand powers can exist to accomplish greater box office for efficient movies. Although many studies have utilized DEA to analyze the efficiency of businesses, the production efficiency produced from DEA has not been used in investigating box office revenue. Our study shows that different eWOM variables (depth and volume vs. rating and # of positive reviews) can be differently moderated by efficiency to affect beyond the concurrent box office.
There are several limitations along with future research issues. First, our study adopts the production efficiency, and while this is the promising measure to moderate the relationship between eWOM and beyond the concurrent box office, there can be other causal explanations (positively or negatively moderating) and other movie related variables to be as moderators. Second, the moderating role of production efficiency is rather exploratory in nature, and can be further examined in other setting of data set or other development of the efficiency measure encompassing other resources power or movie budget. The measure of efficiency can be further developed using different parameters to create efficiency other than radial improvement and constant returns in both inputs and outputs as the means to scale the DEA model. In the future study, the effects of production efficiency on subsequent box office can be investigated to provide deeper insights on the effects of efficiency. Because the sample is collected from Korean movies website, our findings can be further expanded using another country’s movies website.

6.2. Implications to Practice

This study shows that besides eWOM it is necessary to consider efficiency to explain revenue, and thus, online marketing managers should consider the efficiency of movie resources powers in view of box office along with eWOM in suggesting how this affects eWOM and subsequent box office. Besides movie budget which is an important factor for box office, resource powers including star, directors, distributors, and production companies can represent movie budget and can be used to show the efficiency of resources powers for the specific time point (e.g., opening week) and predict eWOM and box office revenue for the next time point (e.g., a week after opening week). This study shows the method of offering production efficiency using DEA and suggests the process of interaction between eWOM and movie efficiency on subsequent box office revenue.
This study suggests the difference in prediction performance using decision trees using bagging, k-nearest-neighbors using bagging, linear regression using bagging between efficient and inefficient movies. This provides additional insights in BI literature in movies, because it is crucial to examine how to increase the prediction performance using classes of movies. This study adopts DEA to classify movies into efficient and inefficient movies based on input of resources and show that excluding efficient movies can improve prediction performance. Thus, excluding efficient movies from sample can improve prediction performance for revenue.

Author Contributions

Conceptualization, S.L.; methodology, S.L.; software, S.L. and J.Y.C.; validation, S.L.; formal analysis, S.L.; investigation, S.L.; resources, J.Y.C.; data curation, S.L.; writing—original draft preparation, S.L.; writing—review and editing, S.L.; supervision, S.L.; funding acquisition, S.L. All authors have read and agreed to the published version of the manuscript.

Funding

This research received no external funding.

Conflicts of Interest

The authors declare no conflict of interest.

Appendix A

Table A1. The examples of movie sample.
Movie ID11837030489336803433235546
eff1 (Denoting Whether This Is Efficient Movie in First Week)01111
eff210001
eff301011
Revenue Week 12.37 × 10921,595,0004.85 × 10867,160,0005.17 × 109
Revenue Week 22.25 × 10914,498,50077,178,00023,400,0002.81 × 109
Revenue Week 31.1 × 10910,695,5004,170,00018,893,0001.42 × 109
Actors Power1.86 × 10102003.33 × 1010200200
Directors Power1.05 × 10810,00010,00010,00010,000
Distributors Power6.21 × 101150073,108,5005001.28 × 1010
Production Companies Power 3.01 × 101210006.92 × 1082.96×1091000
Award00000
Rating13220
Sequel00000
Timing of Release10111
Revenue af Similar Movies At Day 12,551,50039,747,50099,571,5001.21 × 1084.39 × 108
Average Review Depth at Prerelease2517231512
Average Review Rating at Prerelease 97889
Average Review Volume at Prerelease3596661763392368
Average Positive Reviews at Prerelease 11111
Revenue of Similar Movies at Week 118,823,0008.06 × 1081.75 × 1098.46 × 1082.01 × 109
Average Review Depth at Week 127.261214.3814.3312.89
Average Review Rating at Week 19.137.338.135.58.40
Average Review Volume at Week 1254386176
Average Positive Reviews at Week 11.1410.3311.09
Revenue of Similar Movies at Week 243,260,7002.47 × 1094.49 × 1095.58 × 1082.55 × 109
Average Review Depth at Week 217.11202215.5711.78
Average Review Rating at Week 2 9.338.59.6798.66
Average Review Volume at Week 2103237125
Average Positive Reviews at Week 2 1.2120.3310.97
Genre 2 (Drama, 1: Yes, 0: No) 11101
Genre 5 (Melodrama/Romance) 00000
Genre 7 (Comedy)00010
Nation 1 (Korea)00000
Nation 2 (US)10101

References

  1. MyPlan, Industry Outlook, Motion Picture & Video Industries. Available online: https://www.myplan.com/careers/industries/motion-picture-and-video-industries/industry-outlook-nature-of-the-industry-06.04.html (accessed on 1 January 2020).
  2. Liu, T.; Ding, X.; Chen, Y.; Chen, H.; Guo, M. Predicting movie Box-office revenues by exploiting large-scale social media content. Multimed. Tool. Appl. 2016, 75, 1509–1528. [Google Scholar] [CrossRef]
  3. McKenzie, J. Bayesian information transmission and stable distributions: Motion picture revenues at the Australian box office. Econ. Rec. 2008, 84, 338–353. [Google Scholar] [CrossRef]
  4. Sharda, R.; Delen, D. Predicting box-office success of motion pictures with neural networks. Expert Syst. Appl. 2006, 30, 243–254. [Google Scholar] [CrossRef]
  5. Eliashberg, J.; Elberse, A.; Leenders, M.A. The motion picture industry: Critical issues in practice, current research, and new research directions. Mark. Sci. 2006, 25, 6386–6461. [Google Scholar] [CrossRef]
  6. Zhang, L.; Luo, J.; Yang, S. Forecasting box office revenue of movies with BP neural network. Expert Syst. Appl. 2009, 36, 6580–6587. [Google Scholar] [CrossRef]
  7. Pangarker, N.A.; Smit, E.v.d.M. The determinants of box office performance in the film industry revisited. S. Afr. J. Bus. Manag. 2013, 44, 475–478. [Google Scholar] [CrossRef]
  8. Treme, J. Effects of celebrity media exposure on box-office performance. J. Media Econ. 2010, 23, 51–56. [Google Scholar]
  9. Treme, J.; Craig, L.A. Celebrity star power: Do age and gender effects influence box office performance? Appl. Econ. Lett. 2013, 20, 440–445. [Google Scholar] [CrossRef]
  10. Asadpour, M.; Shirouyehzad, H. Performance evaluation and ranking of Academy Award winners for best original score applying data envelopment analysis: 1990–2016. Oper. Res. Lett. 2019, 47, 3713–3776. [Google Scholar] [CrossRef]
  11. Hababou, M.; Amrouche, N.; Jedidi, K. Measuring economic efficiency in the motion picture industry: A data envelopment analysis approach. Custom. Needs Solut. 2016, 3, 1441–1458. [Google Scholar] [CrossRef]
  12. Du, J.; Xu, H.; Huang, X. Box office prediction based on microblog. Expert Syst. Appl. 2014, 41, 1680–1689. [Google Scholar] [CrossRef]
  13. Rui, H.; Liu, Y.; Whinston, A. Whose and what chatter matters? The effect of tweets on movie sales. Des. Support Syst. 2013, 55, 863–870. [Google Scholar] [CrossRef] [Green Version]
  14. Chintagunta, P.K.; Gopinath, S.; Venkataraman, S. The effects of online user reviews on movie box office performance: Accounting for sequential rollout and aggregation across local markets. Mark. Sci. 2010, 29, 944–957. [Google Scholar] [CrossRef]
  15. Duan, W.; Gu, B.; Whinston, A.B. The dynamics of online word-of-mouth and product sales—An empirical investigation of the movie industry. J. Retail. 2008, 84, 233–242. [Google Scholar] [CrossRef]
  16. Hennig-Thurau, T.; Wiertz, C.; Feldhaus, F. Does Twitter matter? The impact of microblogging word of mouth on consumers’ adoption of new movies. J. Acad. Mark. Sci. 2015, 43, 3753–3794. [Google Scholar] [CrossRef]
  17. Marchand, A.; Hennig-Thurau, T.; Wiertz, C. Not all digital word of mouth is created equal: Understanding the respective impact of consumer reviews and microblogs on new product success. Int. J. Res. in Mark. 2017, 34, 3363–3454. [Google Scholar] [CrossRef]
  18. Rosario, A.B.; Sotgiu, F.; De Valck, K.; Bijmolt, T.H. The effect of electronic word of mouth on sales: A meta-analytic review of platform, product, and metric factors. J. Mark. Res. 2016, 53, 2973–3118. [Google Scholar]
  19. Zhu, F.; Zhang, X. Impact of online consumer reviews on sales: The moderating role of product and consumer characteristics. J. Mark. 2010, 74, 133–148. [Google Scholar] [CrossRef]
  20. Lee, K.; Lee, B.; Oh, W. Thumbs up, sales up? The contingent effect of Facebook likes on sales performance in social commerce. J. Manag. Inf. Syst. 2015, 32, 109–143. [Google Scholar] [CrossRef]
  21. Charnes, A.; Cooper, W.W.; Rhodes, E. Measuring the efficiency of decision making units. Eur. J. Oper. Res. 1978, 2, 429–444. [Google Scholar] [CrossRef]
  22. Emrouznejad, A.; Anouze, A.L. Data envelopment analysis with classification and regression tree—A case of banking efficiency. Expert Syst. 2010, 27, 231–246. [Google Scholar] [CrossRef]
  23. Cooper, W.W.; Seiford, L.M.; Zhu, J. Data Envelopment Analysis: History, Models and Interpretations. In Hand-Book on Data Envelopment Analysis; Cooper, W.W., Seiford, L.M., Zhu, J., Eds.; Kluwer Academic Publishers Group: Dodrecht, The Netherlands, 2004; pp. 1–39. [Google Scholar]
  24. Lee, S. Using data envelopment analysis and decision trees for efficiency analysis and recommendation of B2C controls. Des. Support Syst. 2010, 49, 4864–4897. [Google Scholar] [CrossRef]
  25. Hsiao, B.; Chern, C.-C.; Yu, M.-M. Measuring the relative efficiency of IC design firms using the directional distance function and a meta-frontier approach. Decis. Support Syst. 2012, 53, 8818–8891. [Google Scholar] [CrossRef]
  26. Chen, C.-M.; Du, J.; Huo, J.; Zhu, J. Undesirable factors in integer-valued DEA: Evaluating the operational efficiencies of city bus systems considering safety records. Dec. Support Syst. 2012, 54, 3303–3335. [Google Scholar] [CrossRef]
  27. Huerta, T.R.; Thompson, M.A.; Ford, E.W.; Ford, W.F. Electronic health record implementation and hospitals’ total factor productivity. Decis. Support Syst. 2013, 55, 4504–4558. [Google Scholar] [CrossRef]
  28. Lei, M.; Zhao, X.; Deng, H.; Tan, K.-C. DEA analysis of FDI attractiveness for sustainable development: Evidence from Chinese provinces. Des. Support Syst 2013, 56, 4064–4118. [Google Scholar]
  29. Vandaele, N.J.; Decouttere, C.J. Sustainable R&D portfolio assessment. Des. Support Syst. 2013, 54, 15211–15532. [Google Scholar]
  30. Charles, V.; Zegarra, L.F. Measuring regional competitiveness through Data Envelopment Analysis: A Peruvian case. Expert Syst. Appl. 2014, 41, 53715–54381. [Google Scholar] [CrossRef]
  31. Chou, Y.-C.; Shao, B.B.M. Total factor productivity growth in information technology services industries: A multi-theoretical perspective. Decis. Support Syst. 2014, 62, 1061–1118. [Google Scholar] [CrossRef]
  32. Tavana, M.; Keramatpour, M.; Santos-Arteaga, F.J.; Ghorbaniane, E. A fuzzy hybrid project portfolio selection method using data envelopment analysis, TOPSIS and Integer Programming. Expert Syst. Appl. 2015, 42, 84328–84444. [Google Scholar] [CrossRef]
  33. Rahimi, S.A.; Jamshidi, A.; Ruiz, A.; Ait-kadi, D. A new dynamic integrated framework for surgical patients’ prioritization considering risks and uncertainties. Des. Support Syst. 2016, 88, 1121–1220. [Google Scholar]
  34. Liu, Y. Word of mouth for movies: Its dynamics and impact on box office revenue. J. Mark. 2006, 70, 748–749. [Google Scholar] [CrossRef]
  35. Dellarocas, C.; Gao, G.; Narayan, R. Are consumers more likely to contribute online reviews for hit or niche products? J. Manag. Inf. Syst. 2010, 27, 1271–1358. [Google Scholar] [CrossRef]
  36. Kim, T.; Hong, J.; Kang, P. Box office forecasting using machine learning algorithms based on SNS data. Int. J. Forecast. 2015, 31, 364–390. [Google Scholar] [CrossRef]
  37. Sueyoshi, T.; Goto, M. A use of DEA–DA to measure importance of R&D expenditure in Japanese information technology industry. Des. Support Syst. 2013, 54, 9419–9452. [Google Scholar]
  38. Samoilenko, S.; Osei-Bryson, K.M. A hybrid DEA-/DM-based DSS for productivity-driven environments. In Advances in Research Methods for Information Systems Research; Osei-Bryson, K.M., Ngwenyama, O., Eds.; Springer Science + Business Media: New York, NY, USA, 2014; pp. 165–181. [Google Scholar]
  39. Widiarto, I.; Emrouznejad, A.; Anastasakis, L. Observing choice of loan methods in not-for-profit microfinance using data envelopment analysis. Expert Syst. Appl. 2017, 82, 2782–2790. [Google Scholar] [CrossRef]
  40. Lee, K.J.; Chang, W. Bayesian belief network for box-office performance: A case study on Korean movies. Expert Syst. Appl. 2009, 36, 280–291. [Google Scholar] [CrossRef]
  41. Delen, D.; Sharda, R.; Kumar, P. Movie forecast guru: A webbased DSS for Hollywood managers. Decis. Support Syst. 2007, 43, 1151–1170. [Google Scholar] [CrossRef]
  42. Shmueli, G.; Bruce, P.; Patel, N. Data Mining for Business Analytics: Concepts, Techniques, and Applications with XL Minerals, 3rd ed.; John Wiley & Sons, Inc.: Hoboken, NJ, USA, 2018. [Google Scholar]
  43. Charnes, A.; Cooper, W.W.; Lewin, A.Y.; Seiford, L.M. Data Envelopment Analysis: Theory, Methodology, and Applications; Kluwer Academic Publishers: Dordrecht, The Netherlands, 1994. [Google Scholar]
Figure 1. Research Model.
Sustainability 12 06602 g001
Figure 2. The procedures of this study.
Sustainability 12 06602 g002
Table 1. Online word of mouth (eWOM) and movie-related variables used in this study.
CategoryVariablesDescriptionNumber of Possible Values
eWOMAverage review depth (Average length of a review in words)Shows the review length in terms of words on the averageReal values
Average review volume (Average number of reviews)Shows the number of reviews on the averageReal values
Average review ratingShows the review rating on the averageReal values
Average positive reviewsShows the number of positive reviews on the averageReal values
Movie-related variablesAwardA binary variable for academy winners/nominees2
RatingShows the rating given based on the scope of age permitted to watch movie0 (family movie)–2 (adult movie)
SequelShows that a movie is a sequel movie
(value of 1) or no sequel movie (value of 0).
2
Timing of releaseBinary variable for holiday starting (July or December)2
Revenue of similar moviesTotal revenue created by similar genre movies at the time when the focal movie is releasedReal values
GenreShows the content category the movie most likely belongs to. This study creates three genres (drama, melodrama/romance, comedy to which movie most likely belongs to.Three binary variables
NationalityShows two binary variables for two nationalities of movies (Korea, US) to which movie most likely belongs to.Two binary variables
Movie resourcesStar powerShows the total revenue created by the actors for each movieReal values
powersDirectors powerShows the total revenue created by the directors for each movieReal values
Distributors powerShows the total revenue created by the distributors for each movieReal values
Production companies powerShows the total revenue created by the production companies for each movieReal values
Table 2. Data envelopment analysis (DEA) Efficiency Results.
Box Office RevenueWeek 1Week 2Week 3Week 1–2Week 1–3Week 2–3
tSig.tSig.tSig.
Number of efficient movies4694093929.360.00010.170.0004.200.000
Number of inefficient movies117112311248
Average efficiency0.2230.1660.128
Table 3. Distributions of efficiency.
CategoryValue# of MoviesPercentTotal Revenue (X 109 Won)Average Efficiency
Week 1Week 2Week 3
GenreDrama76246.52.5438.9233.4630.04
Comedy20512.53.0944.8438.0832.86
Crime20512.54.6349.2341.1451.06
Mello/Romance17610.72.0245.0637.0136.17
Action1136.96.0149.5338.533.71
Documentary1056.40.2756.0452.8646.93
Animation1046.32.2655.9746.8842.59
Horror674.11.4154.1245.3140.21
Thriller/mystery593.62.5750.0933.528.09
Science fiction110.715.7649.9933.9712.49
Family60.41.0748.0129.4334.98
Art40.20.6750.9940.8125.66
History30.214.712.76.530.93
Fantasy10.10.3170.8340.011.19
War10.10.0120.851.990.2
NationKorea65239.84.651.7546.5440.4
US44727.32.6943.1632.4528.66
Japan1529.30.534.229.8231.19
France9860.5339.9432.3729.24
England744.50.6236.4623.8218.97
Spain241.50.1841.7634.8426.49
Germany231.40.2438.3333.8235.01
China221.30.4431.0744.1729.4
Italia211.30.09540.0927.9231.8
Canada191.20.1832.7425.3821.62
Hong Kong140.90.4328.5318.8634.89
AwardAward given3229.9739.3232.2327.95
No award given1608982.5744.6137.5333.77
RatingAdult movie43226.31.7137.9332.4533.02
Age limit is more than 12 and less than 18.94.057.33.4343.8836.5732.14
No restriction in age26816.31.8157.3348.4839.96
SequelSequel movie291.88.8245.7053.2144.98
No sequel movie161198.22.6144.4937.1533.45
Timing of releaseReleased in holidays starting64439.33.8846.8240.1134.96
Released in other times99660.71.9643.0235.7032.81
Table 4. Regression analysis on box office revenue of second week after release. F = 72.4, p = 0.000.
Independent VariablesStandardized CoefficientstSig.
Review depth (t = 1)0.0320.9860.324
Review volume (t = 1)1.08720.7630.000
Review rating (t = 1)0.0562.4160.016
The number of positive reviews (t = 1)−0.02607530.452
Review depth (t = 1) X efficiency (t = 1)−0.156−2.0470.041
Review volume (t = 1) X efficiency (t = 1)−0.596−11.3040.000
Review rating (t = 1) X efficiency (t = 1)0.2023.4060.001
The number of positive reviews (t = 1) X efficiency (t = 1)0.0931.3420.180
Award0.0633.1770.002
Movie rating0.0281.3670.172
Sequel0.1055.3930.000
Time of release0.0351.7540.080
The revenue of similar movies (t = 1)0.0542.6790.007
Drama−0.016−0.7640.445
Korean movie0.0853.6020.000
US movie0.0451.9540.051
Table 5. Regression analysis on box office revenue of third week after release. F = 12.9, p = 0.000.
Independent VariablesStandardized CoefficientstSig.
Review depth (t = 2)0.0771.7760.076
Review volume (t = 2)0.1522.8000.005
Review rating (t = 2)0.0471.4760.140
The number of positive reviews (t = 2)−0.035−0.8180.414
Review depth (t = 2) X efficiency (t = 2)−0.204−2.2740.023
Review volume (t = 2) X efficiency (t = 2)0.0480.8420.400
Review rating (t = 2) X efficiency (t = 2)0.1561.9780.048
The number of positive reviews (t = 2) X efficiency (t = 2)0.2112.4030.016
Award0.1083.7040.000
Movie rating0.0180.6260.532
Sequel0.0903.2290.001
Time of release0.0782.7870.005
The revenue of similar movies (t = 2)0.0391.3460.179
Drama0.02909940.320
Korean movie0.1624.7620.000
US movie0.0651.9360.053
Table 6. Regression analysis on review depth using movie resource powers. (a) The first week after release (F = 132.7, p = 0.000, adjusted R2 = 0.248). (b) The second week after release (F = 64.7, p = 0.000, adjusted R2 = 0.162).
(a)
Independent VariablesStandardized CoefficientstSig.
Actors power0.25710.0980.000
Directors power0.0321.2890.198
Distributors power0.0090.3580.720
Production companies power0.44920.5660.000
(b)
Independent VariablesStandardized CoefficientstSig.
Actors power0.1836.2140.000
Directors power0.0752.5790.010
Distributors power−0.025−0.8640.388
Production companies power0.36714.4860.000
Table 7. Regression analysis on review volume using movie resource powers. (a) The first week after release (F = 79.2, p = 0.000, adjusted R2 = 0.162). (b) The second week after release (F = 30.0, p = 0.000, adjusted R2 = 0.086).
(a)
Independent VariablesStandardized CoefficientstSig.
Actors power0.29611.0680.000
Directors power0.0431.6280.104
Distributors power0.1415.4370.000
Production companies power−0.032−1.4090.159
(b)
Standardized CoefficientstSig.
Actors power0.1826.3320.000
Directors power0.0200.6970.486
Distributors power0.1033.7310.000
Production companies power−0.022−0.8650.387
Table 8. Regression analysis on review rating using movie resource powers. (a) The first week after release (F = 5.9, p = 0.000, adjusted R2 = 0.012). (b) The second week after release (F = 3.2, p = 0.013, adjusted R2 =.006).
(a)
Independent VariablesStandardized CoefficientstSig.
Actors power0.0160.5600.576
Directors power0.0321.1190.263
Distributors power0.0060.2160.829
Production companies power0.1154.6320.000
(b)
Independent variablesStandardized CoefficientstSig.
Actors power0.0050.1510.880
Directors power0.0110.3740.709
Distributors power0.0030.1120.911
Production companies power0.0903.5280.000
Table 9. Regression analysis on the number of positive reviews using movie resource powers. (a) The first week after release (F = 50.1, p = 0.000, adjusted R2 = 0.111). (b) The second week after release (F = 25.9, p = 0.000, adjusted R2 = 0.073).
(a)
Independent VariablesStandardized CoefficientstSig.
Actors power0.2388.5460.000
Directors power0.0090.3230.747
Distributors power0.0130.4990.618
Production companies power0.25810.7800.000
(b)
Independent variablesStandardized CoefficientstSig.
Actors power0.2166.8570.000
Directors power−0.011−0.3610.718
Distributors power0.0260.8460.398
Production companies power0.1906.9900.000
Table 10. Average prediction error using eWOM for efficient and inefficient groups. The prediction error is computed using root mean square residual (RMSE). Average errors are represented in the unit of 109 (The error of decision trees using bagging is 2.274 × 10⁹ for efficient movies).
Box Office RevenueNumber of RMSE Data Used to CompareDecision Trees Using Baggingk-Nearest-Neighbors Method Using BaggingRegression Analysis Using Bagging
Week 1Efficient (469)312.274 2.6652.337
Inefficient (469)311.4471.7021.332
t-value (p-value) 2.944 (0.005)2.945 (0.005)3.395 (0.001)
Week 2Efficient (409)312.0592.7542.304
Inefficient (409)310.9671.1760.907
t-value (p-value) 5.062 (0.000)5.512 (0.000)4.677 (0.000)
Week 3Efficient (392)301.4401.5081.534
Inefficient (392)300.6580.7350.560
t-value (p-value) 3.289 (0.002)3.033 (0.004)3.025 (0.004)
Table 11. Average prediction error (RMSE) using movie-related variables for efficient and inefficient groups.
Box Office RevenueNumber of RMSE Data Used to CompareDecision Trees Using Baggingk-Nearest-Neighbors Method Using BaggingRegression Analysis Using Bagging
Week 1Efficient (469)312.7783.2682.781
Inefficient (469)311.9692.4841.789
t-value (p-value) 2.550 (0.013)2.367 (0.021)3.145 (0.003)
Week 2Efficient (409)312.8683.3042.796
Inefficient (409)311.3001.4511.150
t-value (p-value) 4.485 (0.000)5.315 (0.000)5.057 (0.000)
Week 3Efficient (392)302.2132.4521.983
Inefficient (392)300.7640.8590.708
t-value (p-value) 4.349 (0.000)4.442 (0.000)4.433 (0.000)
Table 12. Average prediction error (RMSE) using movie resource powers for efficient and inefficient groups.
Box Office RevenueNumber of RMSE Data Used to CompareDecision Trees Using Bagging K-Nearest-Neighbors Method Using BaggingRegression Analysis Using Bagging
Week 1Efficient (469)312.5773.1592.551
Inefficient (469)311.5261.9211.651
t-value (p-value) 3.601 (0.001)4.125 (0.000)3.020 (0.004)
Week 2Efficient (409)312.7292.9642.673
Inefficient (409)311.1861.4141.064
t-value (p-value) 4.971 (0.000)4.661 (0.000)5.862 (0.000)
Week 3Efficient (392)301.9922.0891.795
Inefficient (392)300.7710.9080.639
t-value (p-value) 4.258 (0.000)3.973 (0.000)4.734 (0.000)

