Article

Establishing Ecological Security Patterns Based on Reconstructed Ecosystem Services Value in Rapidly Urbanizing Areas: A Case Study in Zhuhai City, China

1
College of Life and Environmental Sciences, Minzu University of China, Beijing 100081, China
2
School of Urban Planning and Design, Peking University, Shenzhen 518055, China
3
School of Geography, University of Leeds, Leeds LS2 9JT, UK
*
Author to whom correspondence should be addressed.
Sustainability 2020, 12(16), 6629; https://doi.org/10.3390/su12166629
Submission received: 9 July 2020 / Revised: 27 July 2020 / Accepted: 11 August 2020 / Published: 17 August 2020
(This article belongs to the Special Issue Integrating Ecosystem Services and Sustainable Development)

Abstract

:
Rapid urbanization has caused a reduction in green lands, negatively affecting the functions of ecosystem services (ESs). The 11th goal and other goals of the United Nations Sustainable Development Goals (SDGs) have highlighted the importance of the balanced development of cities and the environment. ESs are essential for human well-being, so their application in sustainable development study is indispensable. The ecological security pattern (ESP) provides an integrated strategy for maintaining a balance between a sustainable supply of ESs and urbanization. However, establishing an ESP with the goal of satisfying human requirements for ESs in a rapidly urbanizing area has not been well studied. Thus, it is necessary to build an ESP based on ecosystem service value (ESV) reconstruction to manage urban ecosystems sustainably. Based on land use data and field data, this study approached the research gap by related analyses. The first analysis involved dynamic reconstruction of ESVs using the static ESV and importance indices of ESs from 1999–2013. The second analysis involved using hot spot analysis (Getis-Ord Gi * statistics) to distinguish heterogeneous units of the dynamic ESV to identify ecological sources. The third analysis involved establishing the ESP in Zhuhai city, using the minimum cumulative resistance (MCR) model. The results indicated that the ESV of Zhuhai city displayed an upward trend. The functions of water conservation and waste treatment contributed most to the total ESV, while grain production and raw material contributed least in the study area. In the restructuring of ESVs in 2005, 2009, and 2013, the per unit area of the ESV decreased slightly. The areas with high ESVs continued to shrink, while the areas with low ESVs gradually expanded. The ESP of Zhuhai city exhibits great connectivity and strong plasticity, which specifically provides a reliable and visual way to build sustainable cities from a quantitative perspective, generally consistent with the urban ecological planning of Zhuhai city. This study provides an important reference for the application of ESs to achieve SDGs in coastal, rapidly urbanizing regions.

1. Introduction

The 2030 Agenda on Sustainable Development was adopted by the United Nations General Assembly in 2015, which aims to achieve sustainable development by collectively considering the economic, social, and environmental dimensions through Sustainable Development Goals (SDGs) [1]. Among the SDGs, the 9th goal, the 11th goal, and the 12th goal respectively emphasize the economic development model, the planning of human habitation, and the rational use of resources in urban areas. Additional goals have also emphasized the need to maintain a balance between human activities and ecosystems in order to achieve a sustainable state [2]. With the adoption of SDGs, building ecological security patterns and mitigating adverse impacts on the environment have inevitably become a concern. Cities are compound “nature-economy-society” ecosystems that are established by remodeling and adapting the environment with the development of human society. Urbanization plays a crucial role in the sustainable development of the economy, the environment, and society [3,4,5]. Currently, the urbanization process is accelerating globally. It is estimated that by 2030, there will be 43 megacities in the world, each with a population of more than 10 million, most of which will be in developing countries [6]. In China, the urbanization rate has continued with an average annual increase of 1% for the past four decades [7]. Though urbanization has led to economic development and improved the quality of life, it has also had negative consequences, such as overcrowding, reductions in arable land, air pollution, and biodiversity loss [8,9]. Coastal regions are the natural transitional zones between terrestrial and marine ecosystems. Many studies on coastal areas have confirmed the vulnerability of coastal ecosystems [10,11,12,13]. Urbanization in coastal regions exerts negative impacts on coastline ecology [14]. In the process of rapid urbanization in China, coastal areas have become the center of human activity in recent years, and play an important role in supporting economic growth [15,16]. Despite the considerable economic benefits, the area of green lands in cities able to efficiently provide ecosystem services has sharply declined, and the abnormal functioning of ecosystem services has gradually threatened urban ecological security [17]. How to reduce the impact of urbanization on the ecological environment, maintain ecological security, and guarantee the sustainable development of cities have become important issues for urban sustainable management [18,19,20].
Ecological security is the ecosystem including the environment and human health, basic rights, resources, and the ability to adapt to environmental changes [21]. The ecological security pattern (ESP) refers to an ecology framework to interact ecosystems with land use, architecture, and urban design [22]. ESP focuses on the sustainable development of the ecosystem services function, which is the pattern formed by landscape elements, locations, and spatial relations such as nodes, corridors, and patches, all of which are vital to the security and health of ecological processes [23,24,25]. The establishment of an ESP is an effective measure for ameliorating the functions of ecosystems, ensuring the stable output of ecosystem services (ESs), and safeguarding ecological security [26]. The study of ESPs occurs at the global, national, and regional scales, among which the regional scale is important for protecting and restoring biodiversity; maintaining the integrity of ecosystem processes, structure, and functions; and effectively controlling and correcting problems in urbanizing areas [27]. Since cities are the regional units with the most intensive human activities and the most drastic land use changes on the earth’s surface, ESP establishment in cities has been an issue of great concern. Therefore, studying the integrity and stability of key local ecosystems, determining the connectivity of landscape patches, and deeply analyzing the sustainability of ecological services and the regional landscape’s resistance and resilience to disruption by establishing an ESP [28,29,30] are of great significance for realizing an effective analysis of a specific ecological process. In addition, these analyses help guarantee the sustainability of urban ES. However, in the existing literature, most of the studies on building ESPs to enhance landscape connectivity of vegetation is concentrated in areas with good ecological foundation and rarely in areas with rapid urbanization [31], which may lead to an insufficient understanding of ecological problems in specific regions.
Currently, the methods for establishing ESPs mainly center around the minimal cumulative resistance (MCR) model [32]. This model can well simulate the inhibitory effect of a landscape on the spatial motion process. Compared with traditional conceptual models and mathematical models, the MCR can better express the interactive relationships between landscape patterns and ecological processes [33]. This model is applied based on the following three steps: (1) identify ecological sources; (2) construct a resistance surface; and (3) establish the security pattern [18,24,28,34]. Among these steps, the identification of ecological sources is the basis by which an ESP is established. Ecosystem services are the ecological characteristics, functions, or processes that directly or indirectly contribute to human well-being [35]. Since the ecosystem supports the clarification of such services, both ecological and socio-economic aspects can be well weighed when evaluating urban areas [36]. Therefore, the importance of ecosystem services is commonly adopted as the basis for identifying ecological sources [37,38]. However, there are some limitations when assessing the importance of ESs based on the ecosystem service value (ESV). The equivalence factor approach adopted as part of this method usually offers only a static assessment and ignores the temporal and spatial changes in the nature and quality of the ecosystem. However, ecosystem service functions are subject to regulation by a series of ecological mechanisms, showing the spatiotemporal dynamic changes closely related to ecological structure and processes. Therefore, since static assessment cannot reflect the temporally and spatially dynamic conditions of ESs in the ecosystem, its impact regarding the guidance of future regional environmental protection and ecosystem management is weak [39], which is not conducive to the accurate identification of ecological sources. Additionally, the estimation and analysis of the ESV must be based on marginal analysis and should be linked with changes in the total number of ESs instead of just the total number [40]. If we regard different ES types as equally important to human welfare, we will pay increasingly less attention to the ES types with a faster loss of value [41]. Thus, dynamic correction and an importance index are introduced in this research to reflect changes in various ES types changes in order to correct the original method. Meanwhile, ESs do not function alone but depend on dynamic and continuous spatial processes and are influenced by spatial agglomeration [42]. Hence, based on the usage of the importance index, this paper visualizes estimation results for the ESV through ArcGIS and conducts an analysis based on urban land utilization characteristics. Through these analyses, this paper realizes the objective of scientifically identifying ecological sources.
Zhuhai city is the research object of this paper. Zhuhai city is a transitional zone between terrestrial and marine ecosystems. It possesses a great ecological foundation and urban construction background. While experiencing rapid urbanization and economic growth in the past several decades, Zhuhai city has also protected the ecology of its coastal region. The significant changes in the natural landscape have turned this city into an ideal place for examining ecological services. In this research, we analyzed the impact of land use changes on the ecosystem by estimating the static ESV of Zhuhai city. Adopting the importance indices of ESs, the paper dynamically revised the ESV of Zhuhai city in 2005, 2009, and 2013 and visualized the revision results. Based on the reconstructed ESV results in 2013, the paper selected potential ecological sources, adopted an MCR model to identify ecological corridors, and established the ESP of Zhuhai city. Then, based on the above research results and guided by the United Nations SDGs, the paper discusses the problems that arise during the process of achieving sustainable urban development in Zhuhai city and puts forward planning suggestions. Finally, this paper provides a research paradigm for promoting sustainable development during coastal urbanization by studying ESs.

2. Materials and Methods

2.1. Study Area

Zhuhai city is located in southern Guangdong Province, China, between 21°48′–22°27′ N and 113°03′–114°19′ E and has a land area of 1736.46 km2 (Figure 1). It is the only city that is simultaneously connected to Hong Kong and Macao. It is also one of the earliest special economic zones in China to implement the Reform and Opening Up policy [43]. Zhuhai city has three administrative regions under the jurisdiction of Xiangzhou District, Doumen District, and Jinwan District, and has established five economic functional zones, including Hengqin, Hi-tech, and Bonded. It has a transitional monsoon and maritime climate and is located between the southern subtropical zone and the tropical zone. Accompanied by abundant rainfall, a humid climate, and a sufficient sunshine duration, the temperature in Zhuhai city is relatively high throughout the year. The landforms of Zhuhai city are dominated by low mountains and hills, and the terrain slopes from northwest to southeast. Considered one of “China’s Top Ten Livable Cities” and a “National Ecological Demonstration Zone,” Zhuhai city has a top-notch urban landscape. Its regional gross domestic product (GDP) was 291.474 billion yuan in 2018, with a resident population of 1.891 million and an urbanization rate of 90.08%.

2.2. Data Collection

The land use data with a spatial resolution of 30 m for Zhuhai city used in this study from 1999, 2005, 2009, and 2013 were derived from the US satellite Landsat TM/ETM+, and the row number was 122-44/45. We interpreted the remote sensing images through image interpretation and visual interpretation combined with the regional environmental background. Then, ENVI 5.1 was used to preprocess the images, including radiation correction, geometric correction, and frame cropping, and the land use types were finally divided into 7 categories: forestland, grassland, farmland, wetland, bare land, construction land, and water. Raster data were applied to establish the resistance surface including a 25 m DEM, a population spatial distribution, and the normalized difference vegetation index (NDVI); the vector data included river networks, which were all obtained from the website http://www.resdc.cn. The social statistics came from the Guangdong Statistical Yearbook (http://www.nlc.cn).

2.3. Methods

2.3.1. Land Use Change Direction Model (LCDM) Model

The land use change direction model (LCDM) is calculated to initially assess the impact of land use change on ecosystem functions. Its calculation results represent the direction of land use change in the study area [44]. Ecosystem services value coefficients after dynamic modification of Zhuhai city were obtained to calculate the weight of each land use type. The comprehensive ecological level of land use type is represented by the weight value which can be referred [45]. The equation is as follows:
L C D M = i = 1 n [ A i j × ( D j D i ) ] A × 100 %
where LCDM is the value of the model; i is the i-th land use type; j is the j-th land use type transformed from the i-th land type; Aij is the area of land use change from i-th to j-th; D is the ecological level of the land use types; A is the total conversion area of all land use types throughout the research area during the study period.
When LCDM > 0, the conversion of land use is considered beneficial, and the higher the absolute value of LCDM, the more ecosystem functions can be retained. When LCDM < 0, the conversion of land use is considered to be more harmful, and the higher the absolute value of LCDM, the more ecosystem functions will degrade [44].

2.3.2. Estimating the Static ESV

This study estimated the static ESV for four years in Zhuhai city by following the studies of Costanza et al. [46] and Xie et al. [47]. According to the market price of cereals produced extracted in the Guangdong Statistical Yearbook, the average ESV of one equivalent value for Zhuhai city was 1539.02 yuan/ha2 [48]. Bare land, construction land, and undefined land were all classified as other types of land, which were calculated following the value coefficient of the wasteland in this study. The formula is as follows:
E S V s , k , t = a k , t × V C s , k , t
E S V t = C × k s E S V s , k , t
where V C s , k , t refers to the per-hectare value coefficient of each ESs; k is the land use type; t is the study time; s is supplied by each k and t ; a k , t is the area of each k  at time t; E S V t is the total ESV at time t ; C represents the value coefficient based on net primary productivity.

2.3.3. Reconstructing the ESV

The internal structure and external form of the ecosystem are constantly changing, so ESs have dynamic characteristics [49]. Based on the theory of marginal utility in economics, estimating ESV should be linked to changes in the total amount of ESs, not just the total value. Therefore, this study dynamically reconstructed ESVs in 2005, 2009, and 2013 based on the results of static ESV in 1999 as the benchmark.
In this study, the importance indices of ESs was used to adjust the value coefficient to revise the static ESV in the time dimension. The formula is as follows:
β i = v i v ¯
where βi is the importance index of each ESs; i refers to the 9 services included in the ESs; vi refers to the average change rate of the i-th ES in the study years; and v ¯ is considered to be the average value of vi throughout the study period.
In order to verify the rationality of the revised ESV, the coefficient of sensitivity (CS) was obtained by Equation (5), and the estimated ESV sensitivity was analyzed from the calculation results [50]:
C S = | ( E S V j E S V i ) / E S V i ( V C j k V C i k ) / V C i k |
where ESVi and VCik are the ESV and the value coefficients before adjustment, respectively, and ESVj and VCik are the ESV and value coefficients the adjustment of the land-use types, respectively.
In spatial dimension, each ES is not only affected by the rate of value change, but also has a certain difference between its spatial aggregation degree [49]. The revised ESV estimation results can be visualized in a built 0.5 km × 0.5 km grid by using ArcGIS 10.4. The ecosystem service value evaluation formula after dynamic reconstruction is as follows:
E S V k = i = 1 n ( A i k × β i V C i )
where ESVk refers to the total value of the ecosystem service in the k-th grid; Aik represents the area of the i-th land use type in the k-th grid (unit:ha2) ; βi is the importance index of the i-th ES; VCi represents the ESV coefficient of the i-th land use type.

2.3.4. Establishing the ESP

In order to build ESP that can serve the sustainable development of Zhuhai city. A three-step method with the MCR model as the core was adopted in this study. The equation of the MCR model is as follows [51]:
M C R = f m i n j = n i = m D i j · R i
where f represents a function reflecting the positive correlation between the minimum resistance of any point in space and its spatial distance to all sources and features of the landscape base; Dij represents the spatial distance between the influence of any human disturbance at its source j to any spatially explicit grid unit i in the landscape; and Ri is the resistance at grid unit i in terms of the influence of human disturbance.
(1) Identifying the ecological sources
The ecological source is land with important ES functions that play a decisive role in the regional ecological process and function [52]. We applied hot spot analysis (Getis-Ord Gi *) tool [53] in ArcGIS 10.4 to extract the hot spot-90% confidence districts in the dynamic reconstructed ESV in 2013 of Zhuhai city, then combined the surface runoff to identify patches where the two coincide as an alternative area for ecological sources. At the same time, the forestland in 2013 was selected and combined with the alternative areas mentioned above. According to the area characteristics of Zhuhai city, patches that could effectively isolate the outside from interfering with the core area and maintain ecological stability [36] were selected as the ecological source for constructing the ecological security model.
(2) Constructing the resistance surface
The resistance surface as the core of establishing an ESP determines the resistance needed to be overcome and the cost consumption when the ecological source is spread out. The selection of resistance factors and the delineation of resistance levels are the key to the constructing of resistance surfaces. Considering the actual situation in Zhuhai city, we selected six resistance factors: land use type, altitude, slope, population, vegetation coverage, and distance from water. All resistance factors were divided into four levels according to relevant references, the higher the level, the greater the resistance [27,54,55,56,57]. The weight of each resistance factor was determined by analytical hierarchy process (AHP) [58] (Table 1).
(3) Identifying the ecological corridors
Ecological corridor is the efficient access for the exchange of materials and energy between ecological sources, which can enhance the connectivity of the ecosystem and effectively improve the regional ecological security and ecological carrying capacity [31]. On the resistance surface, the path of least resistance cost linking ecological sources is identified as the ecological corridor. The ecological node is a key point of controlling the conventional ecological connection between ecological sources. Ecological corridors were constructed based on the MCR model in this study [59], and determined ecological nodes based on the intersection point of the minimum cost path that controls the ecological flow in the ecological resistance surface model [60,61].
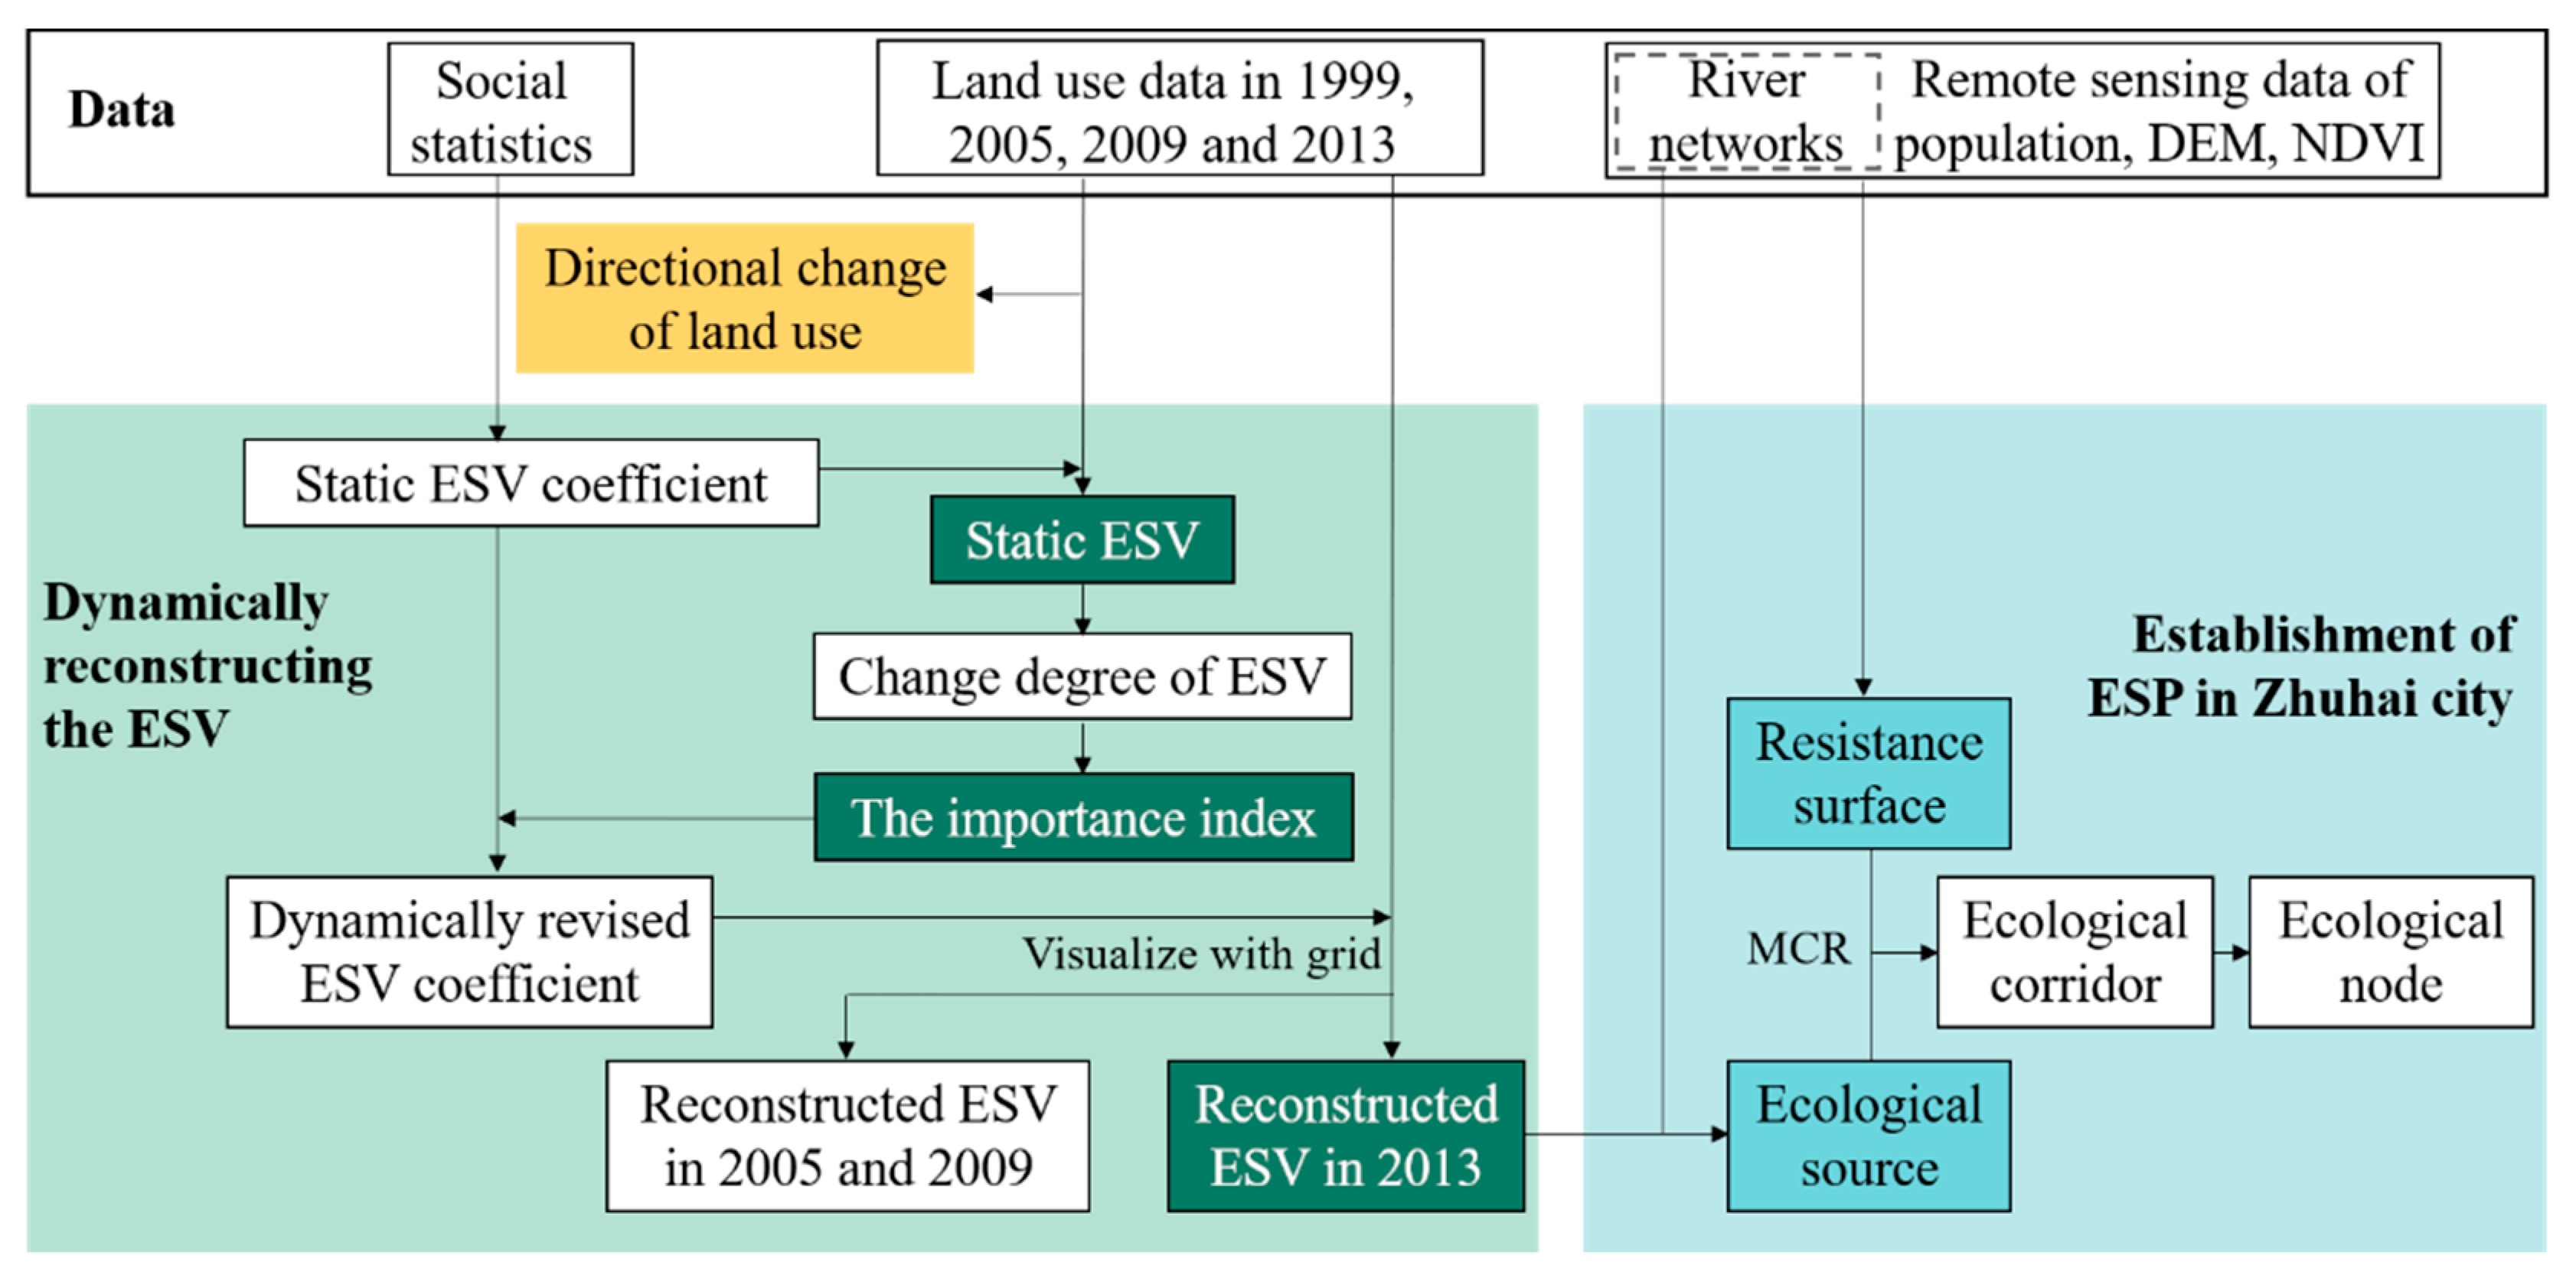
The methodological framework of this study is visually shown in Figure 2.

3. Results

3.1. Directional Change in Land Use

The analysis of the directional change in land use demonstrated that construction land, farmland, forestland, and water areas have changed obviously. Since 1999, forestland, water areas, and construction land increased slightly, which clearly affected the changes in ecosystem function. Therefore, it is necessary to calculate LCDM to assess the influence of land use changes on ESs. The LCDM value was obtained by Equation (1) and was shown as follows: LCDM1999–2005 = 1.78%, LCDM2005-2009 = −1.65%, LCDM2009-2013 = 0.26%, and LCDM1999-2013 = 0.40%. The results indicated that the LCDM value increased from 1999 to 2013, implying that changes in land use had beneficial impacts on the ESs in the study area since 1999. These data also preliminarily confirmed that dynamic ESV reconstruction is an effective base for building ESPs in this study area.

3.2. Estimation of the Static ESV

During 1999–2005, the ESV showed an upward trend, with an increase of 11.97%. Then a general decline followed in the ESV; the value decreased by 10.00% between 2005 and 2009. The period between 2009 and 2013 showed a slight increase in the ESV, reaching 3.70%.
The ESV was mainly composed of regulating services, including gas regulation, climate regulation, water conservation, waste treatment and soil formation, and erosion control. Among these services, water conservation accounted for the largest proportion of the total ESV in Zhuhai city. The proportions of production services, including grain production and raw material, were relatively low compared with those in other regions. From 1999–2013, the values of water conservation, waste treatment, biodiversity conservation, and entertainment culture services all increased; the water conservation service value increased the most, up to 16.96%. However, the value of production services and other regulating services declined by more than 2.56%. (Table 2).

3.3. Dynamic Reconstruction of the ESV

3.3.1. Dynamic Revision of the ESV Coefficient

The importance indices of ESs were used to adjust the value coefficient to revise the static ESV in each given period of time, which was directly related to the degree of change in each ES (Figure 3). From 1999 to 2005, the importance indices of water conservation, waste treatment, and entertainment culture services were relatively high, all of which were above 1.5 (Table 3), while the importance indices of raw materials, gas regulation, and climate regulation services were low, less than 0.4. There were no significant differences among the importance indices of grain production, biodiversity conservation, and soil formation and erosion control services. From 1999 to 2009, the importance index of the grain production service was the highest, reaching 1.74. However, the importance index of the biodiversity conservation service was the lowest, at only 0.2. Other ESs had similar importance indices. From 1999 to 2013, the importance index of grain production service reached 2.55, while that of raw material was only 0.18. The importance indices of climate regulation, water conservation, soil formation and erosion control, and entertainment culture services were all above 1; in contrast, the others were lower.
Results presented in the sensitivity coefficient table (Table 4) illustrated that the revised ESV was inelastic relative to the value coefficient. The coefficient of sensitivity (CS) was less than 1, which meant that the correction result was reasonable.

3.3.2. Reconstruction of the ESV

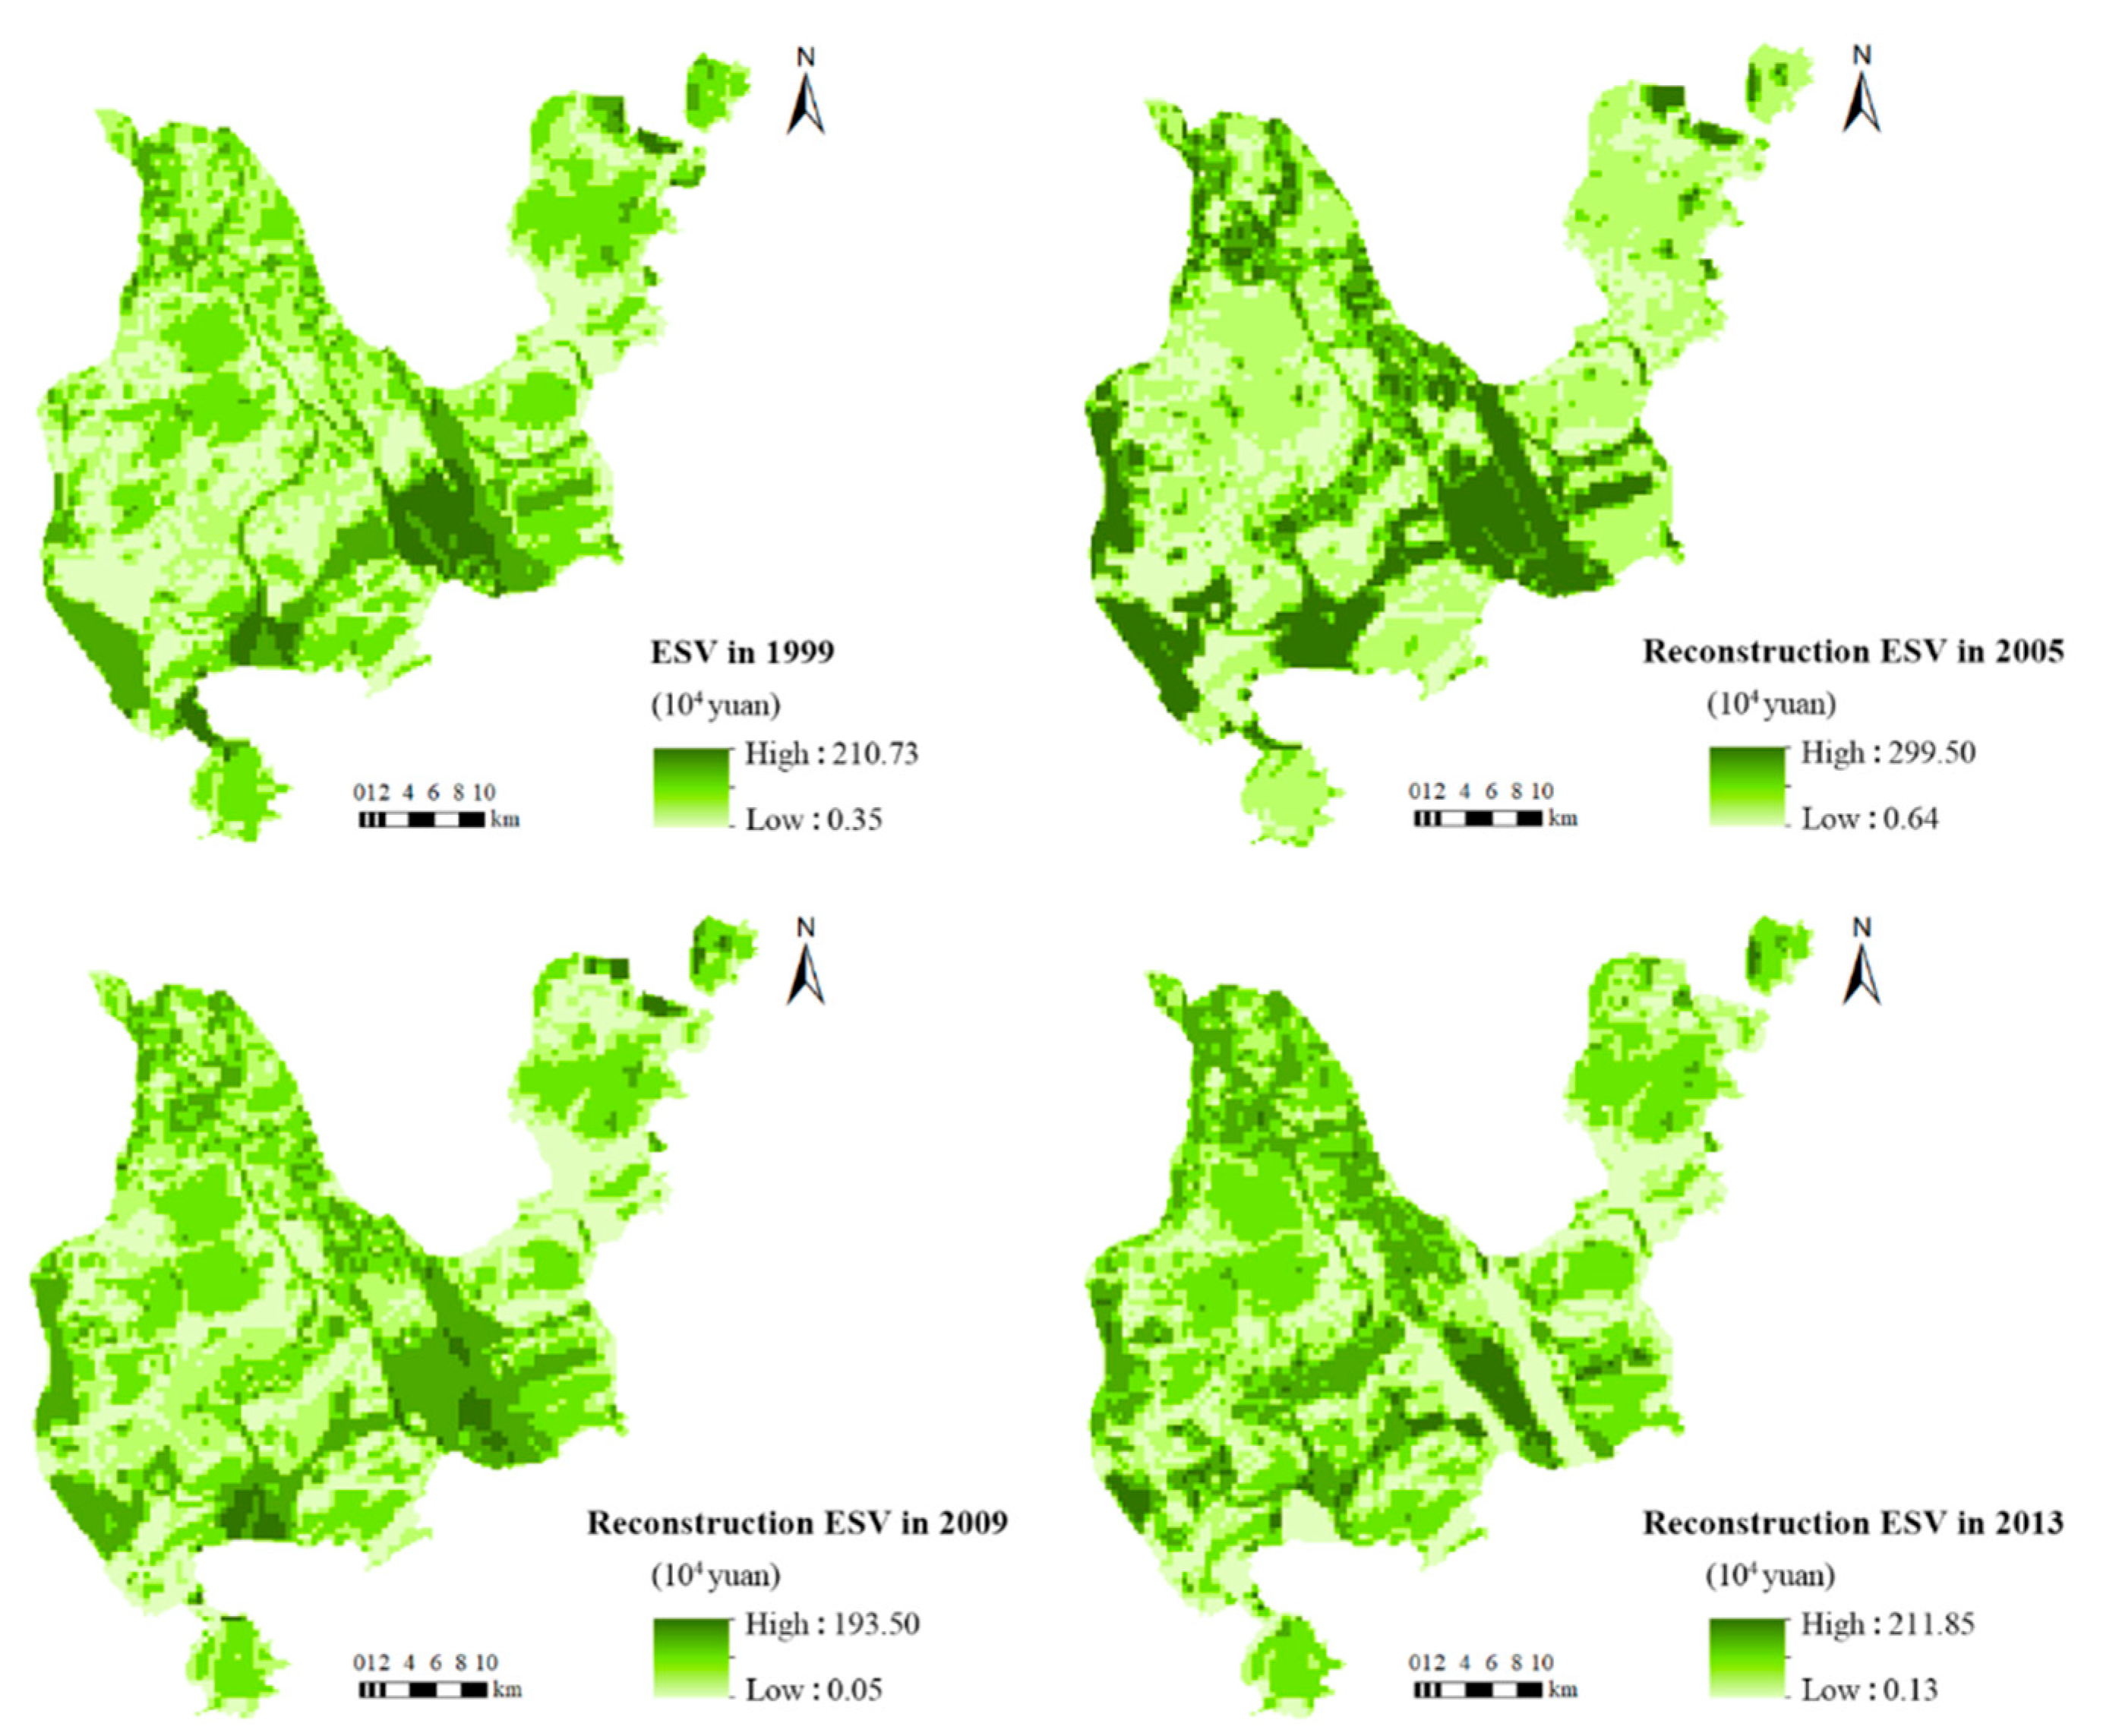
This study reconstructed the ESV of Zhuhai city with the importance indices of ESs and the spatial grid. Dynamic reconstruction of ESVs can help assess the ecological level of the study area. By analyzing the spatial-temporal changes in ESVs, the ability of land to provide ecological services can be investigated. Figure 4 shows the distribution of reconstructed ESV results in Zhuhai city from 2005 to 2013. We found that the overall trends were similar to those for the static ESV.
From 2005–2009, the dynamic ESV significantly decreased from 2.56–1198.00 × 104 yuan/km2 to 0.20–774.00 × 10⁴ yuan/km2. The downtown areas of Zhuhai city, located in the middle of the Xiangzhou District, showed a gradual expansion of low-ESV areas, which was closely related to urban construction during this period.
From 2009–2013, the dynamic ESV rose slightly to 0.52–847.40 × 10⁴ yuan/km2. The area of the intermediate-ESV regions increased, although the area of the high-ESV region in the Jinwan District and northern Xiangzhou District continued to shrink.
From 2005–2013, overall, the dynamic ESV showed a downward trend. Spatially, the high-ESV areas were mainly concentrated in the Jinwan District in the south of Zhuhai city, followed by the Doumen District in the north and Xiangzhou District. In addition, the reconstructed areas with a high ESV overlapped more with surface runoff and were mainly distributed in areas with sufficient water systems. Specifically, the Xiangzhou District was the region in which high-tech industries and economic functional zones in Zhuhai city were concentrated, and the degree of urban construction was relatively high. In this area, the destruction of green land by urban construction resulted in a great loss of ESs. However, the larger forest patches were less affected by urban development, and there was no significant change in the ESV per unit area or patch area.

3.4. Establishment of the ESP

3.4.1. Identifying the Ecological Sources

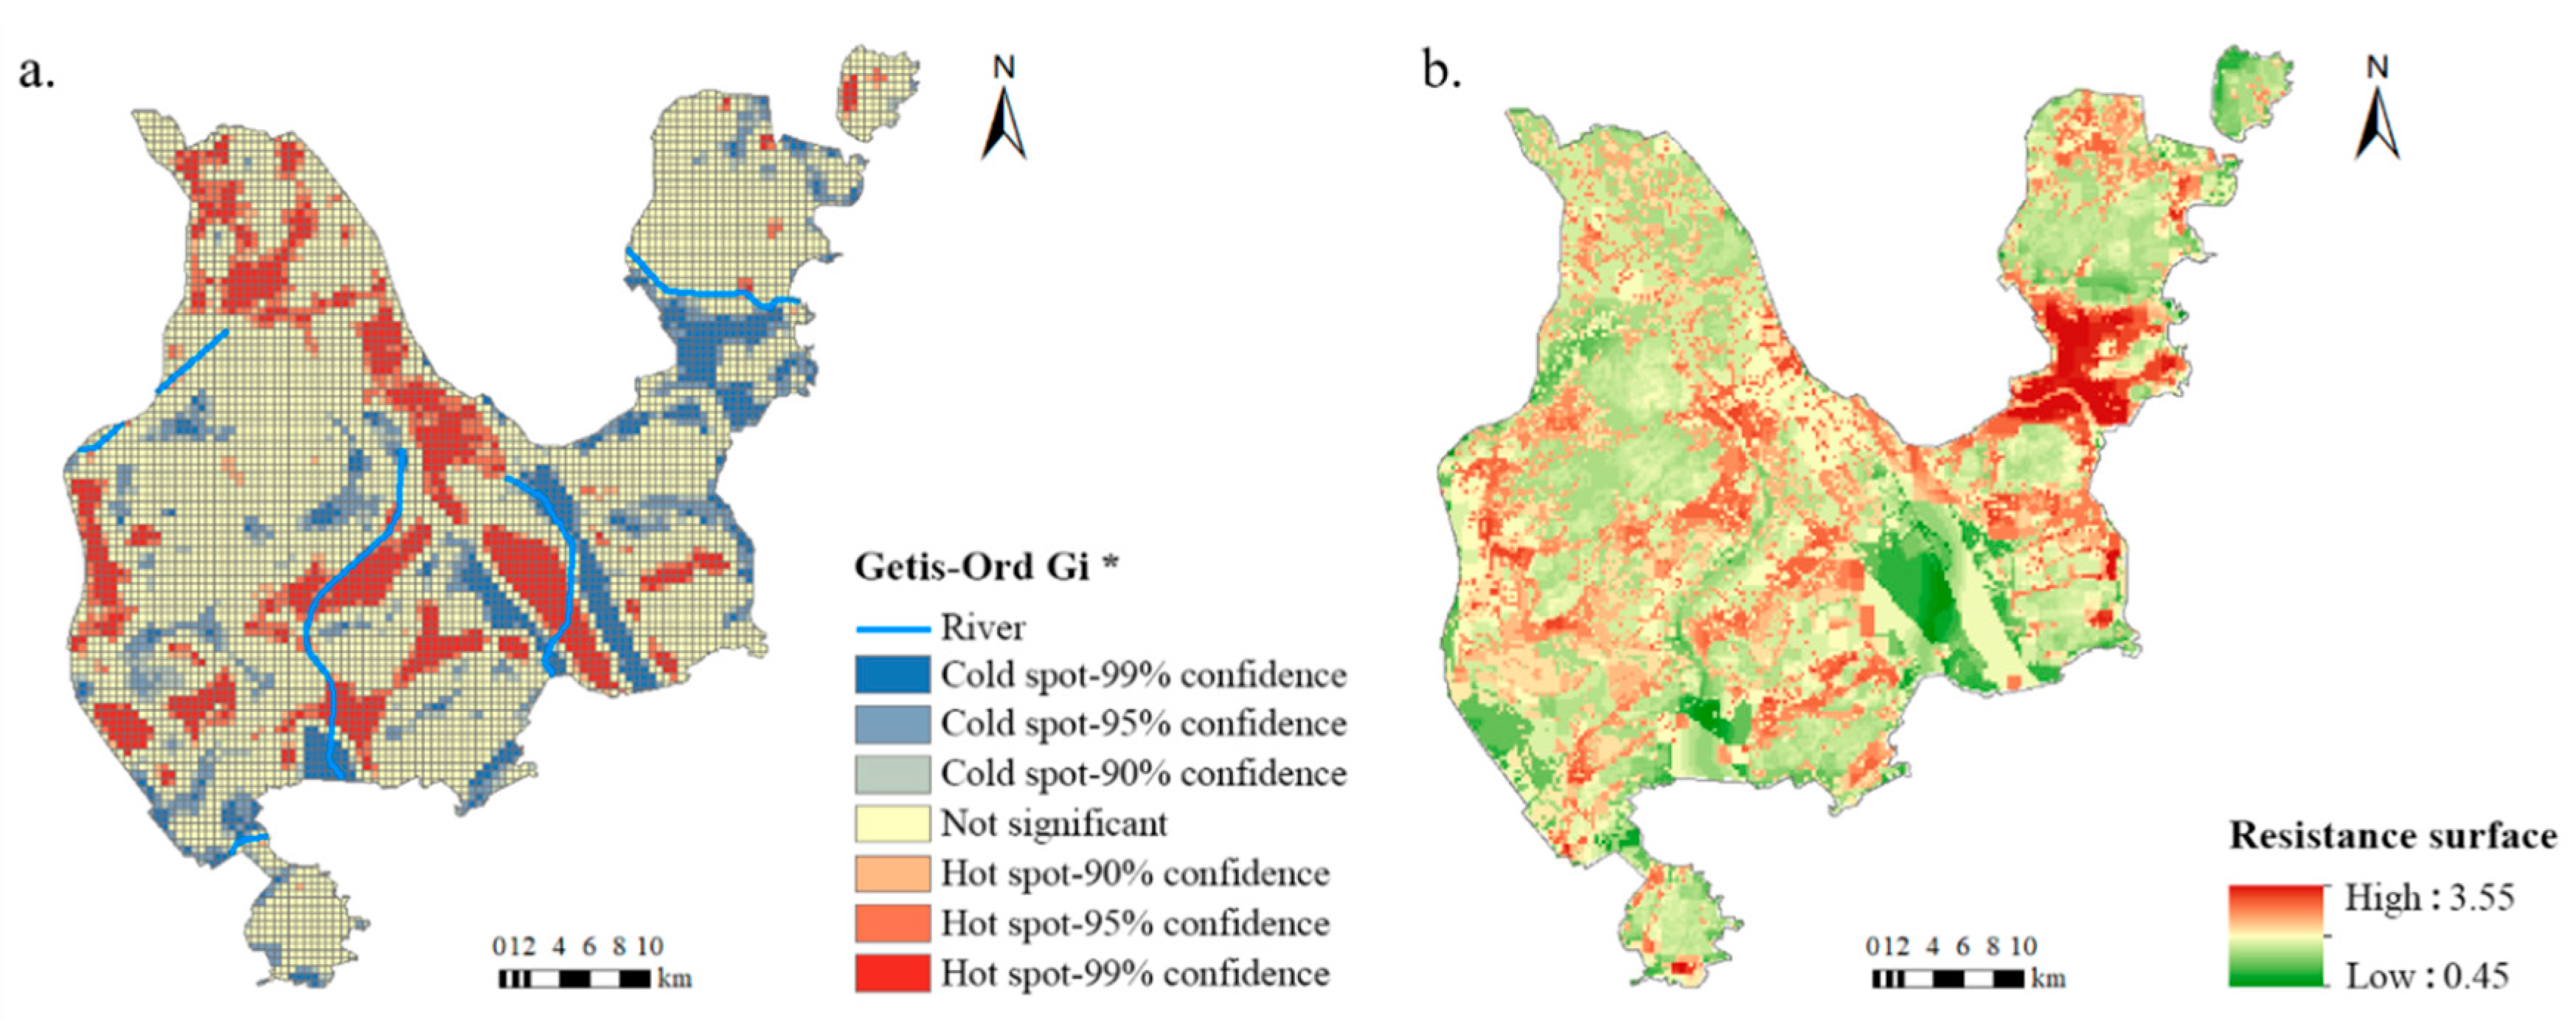
The spatiotemporal distribution of ecological source patches was identified by using Getis-Ord Gi * in ArcGIS software (Figure 5). Identification of ecological sources helps us investigate the sustainability of the ESP more effectively.
The area of ecological sources accounted for 22.53% of the total study area in 2013. Among these ecological sources, forestland patches were mainly distributed in the middle of the Doumen District and to the north of the Xiangzhou District, which confirmed that the output of ecological services is stable by the results of dynamic reconstruction of the ESV. Wetland patches with surface runoff flow-through were mainly distributed on the boundary of the Jinwan District. Adding these wetland patches to the ecological source can improve the connectivity of greenland.

3.4.2. Constructing the Resistance Surface

The resistance values in the study area are shown in Figure 5. The resistance values of the 6 resistance factors were highly consistent in terms of spatial distribution. These values were higher in the middle of the Xiangzhou District. The resistance value of each 0.5 × 0.5 km grid on the resistance surface, calculated from the resistance factors, was 0.45 to 3.55. The residential areas had the highest resistance value, which was mainly distributed in the middle of the Xiangzhou District and on the edge of the mountain in the Doumen District. The area of minimum resistance was distributed between the junction of the Xiangzhou District and the Jinwan District and the southern part of the Jinwan District, whereas the distribution of resistance values in other areas was relatively uniform.

3.4.3. Identifying the Ecological Corridors

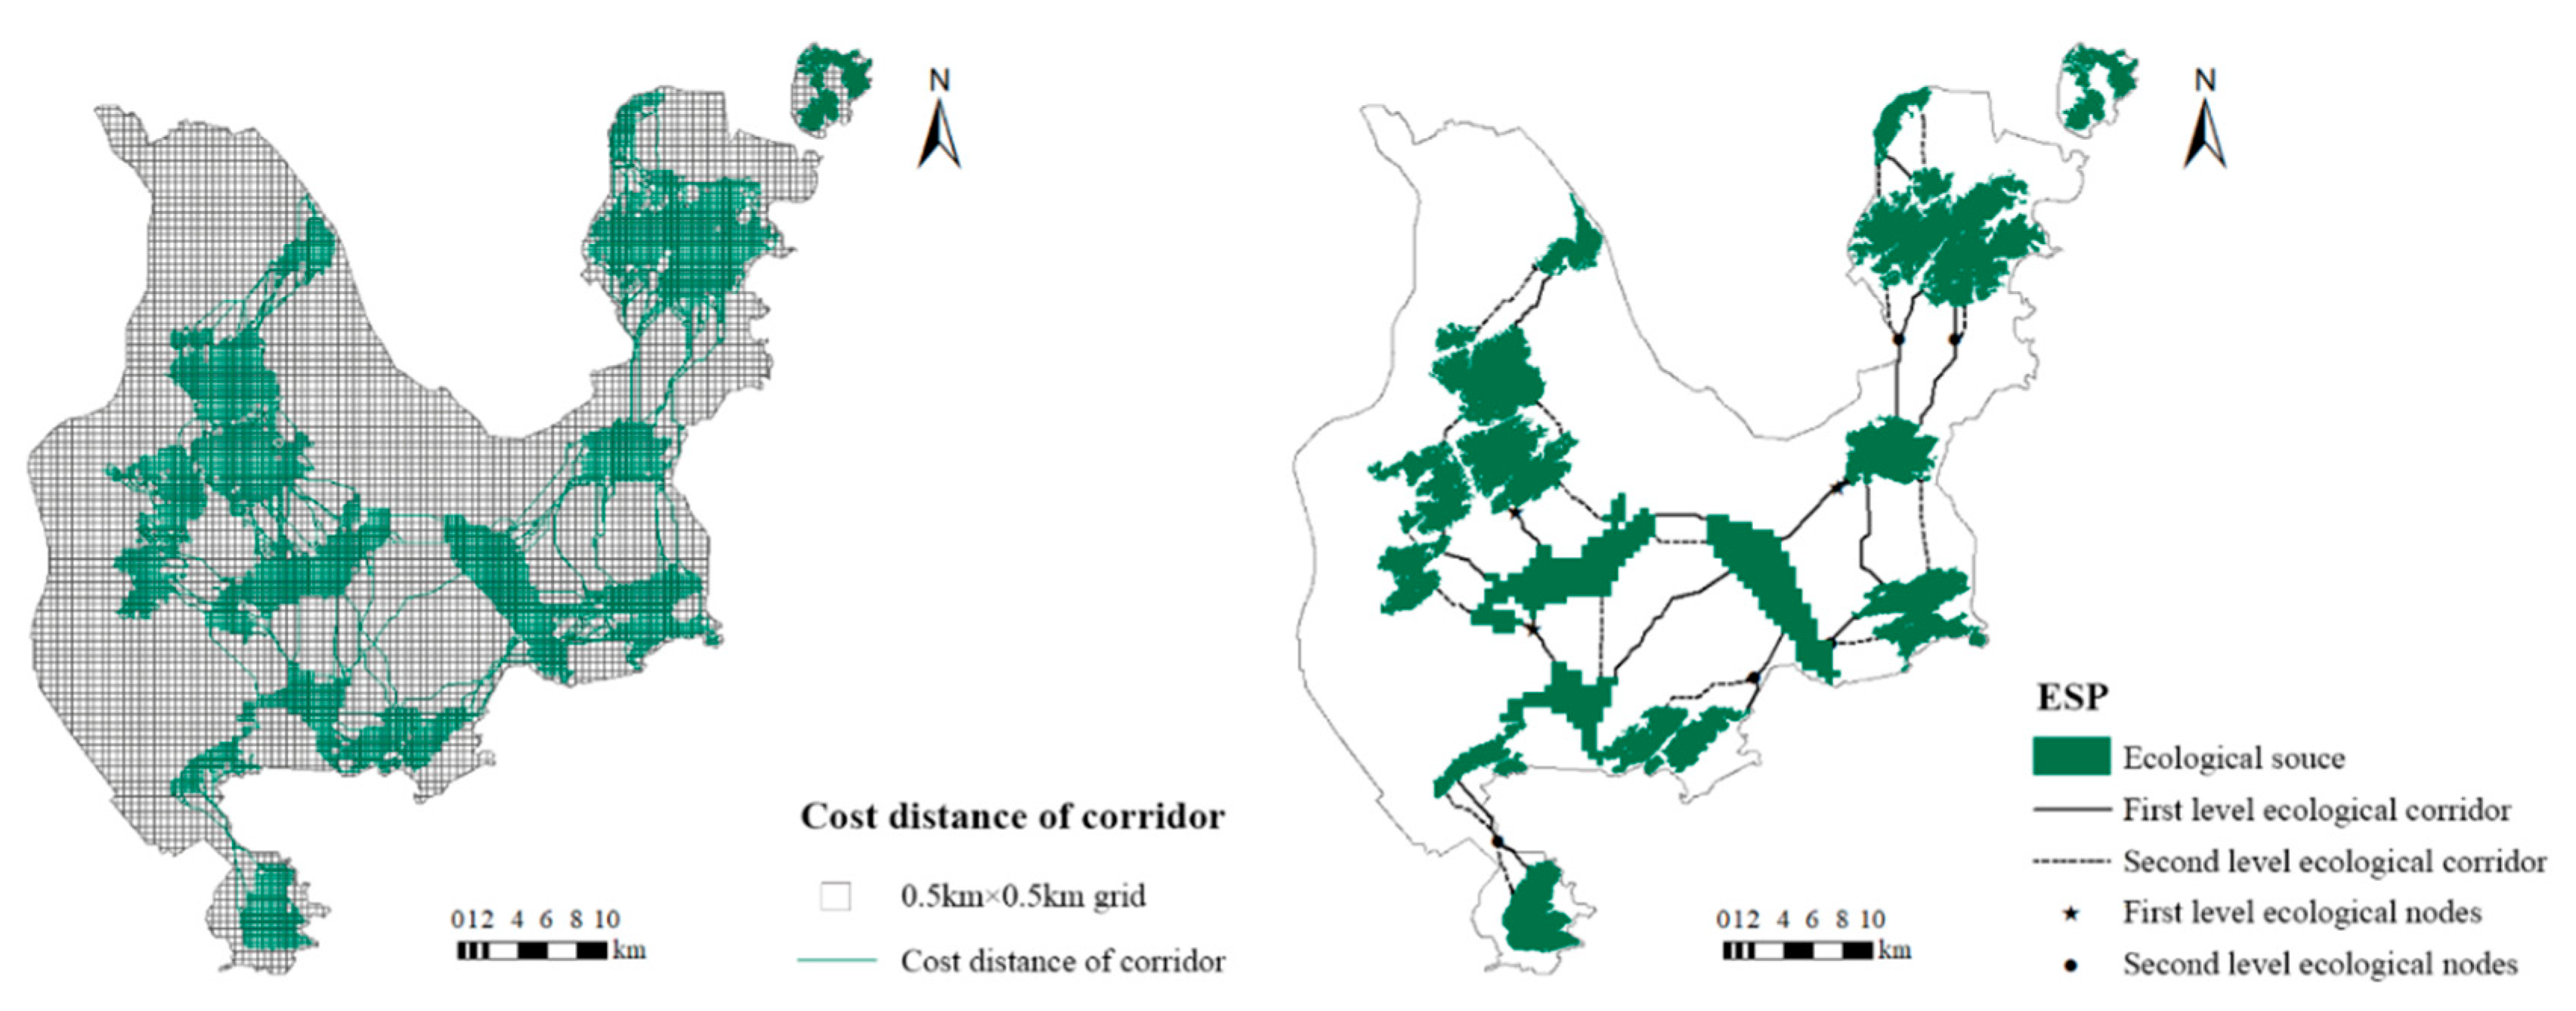
Building and regulation of ecological corridors and ecological nodes are the keys to redeveloping the ESP. Based on a cost path model, we first constructed a network of least resistance paths connecting ecological source patches and then selected ecological corridors and nodes. Ecological corridors were categorized into two levels that represented the different functions as shown in Figure 6. In this ESP, first-level ecological corridors were the shortest paths in the network of paths connecting various ecological sources. Second-level ecological corridors were the auxiliary paths of the first-level corridors, which aimed to promote the circulation of biological information and materials to the remote ends of adjacent patches. The first-level ecological nodes were set at the intersections of ecological corridors, and the second-level nodes were set at the intersections of first-level and second-level corridors. The highest-level urban construction and the most densely populated area between the ecological sources was in the north and the south of the Xiangzhou District, where the most resistance to constructing the corridors in Zhuhai city occurred.

4. Discussion

4.1. Spatial-Temporal Characteristics of ESs

To explore the ecological situation of Zhuhai city, the spatial-temporal characteristics of ESs in Zhuhai city were determined from multiple angles through calculation of LCDM models and reconstruction of the ESV. From the temporal perspective, the whole ESV fluctuated greatly during the study period, indicating that urban managers should pay more attention to the protection and restoration of ecosystem function. For example, the value of the dynamically reconstructed ESV in 2005 was the highest in the whole study area. This result corresponded to the adjustment of government development strategies before 2005 that replaced the sole reliance on policies of “expanding the industrial scale” with the development strategy of low ecological environment loss, such as policies of “rejuvenating the city with science and education” and “functional zone driving.” At the same time, urban expansion was also transformed by the reshaping of old villages in the city. The trough of the ESV occurred in 2009, and recovery occurred in 2013, which corresponded to a change in urban planning strategy from “modernized central city” to “new garden city.” Different urbanization processes determine land use patterns, which in turn affect the function of ESs.
In terms of spatial dimension, we evaluated the spatial distribution of the static ESV and dynamic ESV. The results showed that the areas with high values were mainly located in the middle and western regions, where forests and wetlands were distributed, and these kinds of areas constantly increased from 1999 to 2013. The relatively weak areas were mainly located near the downtown and eastern areas. The value showed an obvious downward trend. The areas of ecological sources in Zhuhai city remained stable throughout the whole study period; the proportion of this type of area slightly increased, which was attributed to local environmental protection.

4.2. Advantages of Establishing an ESP Based on Dynamic Reconstruction of the ESV

To establish a more effective ESP, this study dynamically reconstructed the ESV and identified ecological sources by Getis-Ord Gi *. The ecological corridors and nodes were extracted as key data, as they are the important links in the urban ESP. The results showed that the ESP could be established effectively by these means.
The connectivity of ecological sources is very important for maintaining the stability of ecosystem functions. Forest patches were stable in Zhuhai city, but the patches were far from one another with poor overall connectivity. This leads to barriers in information exchange and many obstacles when building corridors between them. The selection of ecological sources based on the results of dynamic reconstruction of the ESV in this research can effectively help overcome the difficulties in selecting ecological sources in Zhuhai city, thus enabling the function per unit area of ESs to be expressed more accurately in terms of value and location. In addition, the introduction of the importance index can highlight land use patches with more drastic changes in ESVs in the study period. While providing a high service value, these patches also have higher plasticity and can more quickly adapt to the changes in urban development. The selected patches have exactly made up for defects in the long distance between forest patches as ecological sources in Zhuhai city contributed to the building of corridor networks and strengthened the overall connectivity of ecological sources of Zhuhai city. Thus, the ecological sources that were selected based on the dynamic reconstruction of ESVs have not only satisfied the demand of ecosystem functions but also improved the distribution of sources from the systematic and dynamic perspectives, fully guaranteeing the subsequent construction of the ESP.

4.3. Implications for Urban Planning and Sustainable Development

Urbanization is highlighted in the United Nations SDGs. The question of how to balance the relationship between urban sprawl and environmental conservation was always worried by urban managers. Although some solutions, such as building ESPs, were provided by many studies, some imperfections still exist. For instance, some studies did not take into account the influences of dynamic ESVs. In this study, based on the results of the reconstructed ESV and ESP in Zhuhai city, we provide reasonable suggestions for sustainable development. The following section provides detailed suggestions on ecological safety.
In terms of sustainable production models that SDGs focuses on and based on the estimation results of static ESVs among the ESs provided by the current land use model in Zhuhai city, the two production-related services have a relatively low value; therefore, it is inappropriate for the primary industry to serve as the economic pillar. The contribution of water conservation service to ecosystems is rather prominent. Meanwhile, the water conservation service also possesses the ability to dispose of a large amount of waste. Therefore, Zhuhai city is more inclined to develop toward a new type of city that takes the secondary and tertiary industries as main economic pillars. This economic development direction exactly responds to the call for technological innovation in the SDGs. The growth of biodiversity conservation and entertainment culture by a small margin may become the wind vane that steers Zhuhai city toward an ecological tourism city. However, from the perspective of the increase and decrease in various ESs, the values of regulation services other than water conservation, such as gas and climate regulation and soil formation and erosion control, have displayed a downward trend. An alarm for the land use model of Zhuhai city should be sounded, as the ecosystem will not be able to regulate itself during the process of urban development in the future, which may lead to environmental damage that can hardly be restored.
Furthermore, the SDGs also emphasize the balanced development of society and ecosystems, such as constructing sustainable infrastructure to strengthen the city’s ability to respond to environmental changes. According to the spatial-temporal results for ecological safety in the study area, Zhuhai city mainly exhibited a continuous reduction in high-ESV areas and a decline in ESV. High-ESV areas are mostly identified as ecological sources. Therefore, on the basis of protecting the ecological source, we recommend that Zhuhai city strengthen the construction of ecological corridors while paying attention to the ecological state of ecological nodes. Given the nature of Zhuhai city as a special economic zone, economic development and ecological construction are equally important, and its resource utilization efficiency for ecological construction should be improved. Accordingly, ecological corridors and nodes can be constructed based on local conditions. The edge of forest natural reserves, or green belts, on the coast or riverbank can serve as ecological corridors to strengthen the ecological functions of the green barriers among city groups. Ecological nodes can also be planned as parks for urban residents’ recreational activities. This way, while enhancing the connectivity of the ecosystem and maintaining ecological security, it also increases the citizens wellbeing in terms of social functions. Linking the ecological network with the network of public services and mobility is expected to improve the resilience of the urban ecological network and the resulting benefits on the quality of life of citizens. The vulnerability of ecological conditions can be effectively protected by this ESP, and environmental problems such as reductions in urban green space can be effectively slowed in the study area. Instead of urban sprawl, improving the utility of the landscape through the construction of green infrastructure within the city, should be a driver for sustainable development.
Since 2013, the urbanization process of Zhuhai city has gradually slowed down, and the government has attached importance to protect green space through planning. The urban pattern of Zhuhai city has roughly formed a scale. We will compare the ESP constructed in this article with the current ESP in Zhuhai city in the later study.

5. Conclusions

The ESP is very important for the sustainable development of cities and the stable supply of ESs is the basis for selecting ecological sources; thus, research on dynamic reconstruction of ESVs and how to identify ecological sources provides a new integrated approach for establishing the ESP under rapid urbanization. As demonstrated by this study in Zhuhai city, importance indices of ESs and a spatial grid with a unit area of 0.25 km were used to reconstruct the ESV, and ecological sources were identified using the dynamic ESV and Getis-Ord Gi *. Then, the ESP was established based on the dynamically restructured ESV while providing a novel and comprehensive evaluation system for the realization of SDGs. It also establishes a sustainable development paradigm in coastal, rapidly urbanizing areas.
The estimated results for the static ESV demonstrated that the overall ecosystem service function of the study area showed an upward trend. Among the ESVs reconstructed in 2005, 2009, and 2013, the value of ESV per unit area declined. The areas with a high ESV continued to shrink, while the areas with a low ESV gradually expanded. The reconstructed areas with a high ESV overlapped most with surface runoff, mostly wetlands. The ESV per unit area of forest patches fluctuated slightly, and the area of these patches did not change significantly. Hence, the ecological function of the ecological source composed of wetland patches and forestland patches was stable. That is, the ESP of Zhuhai city was well connected and exhibited strong plasticity. The ESP adapts to local urban and ecological construction and can benefit from the exchange of ecological elements.
Land use changes caused by urbanization are the fundamental aspects that affect the functioning of ESs. Therefore, we believe that in the construction of coastal cities, it is essential to enhance the elasticity of the urban ecological network while limiting the urban expansion. Furthermore, ecological corridors should be designed to improve service delivery and reduce heterogeneity so that regions can obtain ecosystem services more equitably. In the future, establishment of ESPs will guide urban construction by integrating regional economic function and ecological function considerations. Our study can be used for reference by more research in the rapid urbanization of coastal areas in the world. While protecting the fragile ecosystem of coastal cities around the world, establishing ESPs based on ESV reconstruction will become an effective means with which to complete the SDGs proposed by the United Nations within a specified time.

Author Contributions

Writing draft, Y.L.; funding acquisition, L.G.; methodology, Y.L., N.C., and R.H.; supervision, L.G. All authors have read and agreed to the published version of the manuscript.

Funding

This research was funded by the Ministry of Science and Technology of China (no. 2017YFC0505601), to which we are very grateful.

Acknowledgments

We acknowledge the constructive comments of anonymous reviewers.

Conflicts of Interest

The authors declare no conflict of interest.

References

  1. UN. Transforming Our World: The 2030 Agenda for Sustainable Development. 2015. Available online: https://sustainabledevelopment.un.org/post2015/transformingourworld (accessed on 25 September 2015).
  2. UN. The Sustainable Development Goals Report 2018; United Nations: New York, NY, USA, 2018; Available online: https://www.un.org/development/desa/publications/the-sustainable-development-goals-report-2018.html (accessed on 20 June 2018).
  3. Tiitu, M. Expansion of the built-up areas in Finnish city regions—The approach of travel-related urban zones. Appl. Geogr. 2018, 101, 1–13. [Google Scholar] [CrossRef]
  4. Chaudhuri, G.; Clarke, K.C. Modeling an Indian megalopolis—A case study on adapting SLEUTH urban growth model. Comput. Environ. Urban. Syst. 2019, 77, 101358. [Google Scholar] [CrossRef] [Green Version]
  5. Zhou, L.; Dang, X.; Sun, Q.; Wang, S. Multi-scenario simulation of urban land change in Shanghai by random forest and CA-Markov model. Sustain. Cities Soc. 2020, 55, 102045. [Google Scholar] [CrossRef]
  6. Department of Economic and Social Affairs. 2018 Revision of World Urbanization Prospects. Available online: https://www.un.org/development/desa/publications/2018-revision-of-world-urbanization-prospects.html (accessed on 16 May 2018).
  7. Xie, H.; He, Y.; Choi, Y.; Chen, Q.; Cheng, H. Warning of negative effects of land-use changes on ecological security based on GIS. Sci. Total Environ. 2020, 704, 135427. [Google Scholar] [CrossRef] [PubMed]
  8. Yang, L.; Chau, K.; Chu, X. Accessibility-based premiums and proximity-induced discounts stemming from bus rapid transit in China: Empirical evidence and policy implications. Sustain. Cities Soc. 2019, 48, 101561. [Google Scholar] [CrossRef]
  9. Agyemang, F.S.; Silva, E.A. Simulating the urban growth of a predominantly informal Ghanaian city-region with a cellular automata model: Implications for urban planning and policy. Appl. Geogr. 2019, 105, 15–24. [Google Scholar] [CrossRef]
  10. Xu, C.; Pu, L.; Zhu, M.; Li, J.; Chen, X.; Wang, X.; Xie, X. Ecological Security and Ecosystem Services in Response to Land Use Change in the Coastal Area of Jiangsu, China. Sustainability 2016, 8, 816. [Google Scholar] [CrossRef] [Green Version]
  11. Parthasarathy, A.; Natesan, U. Coastal vulnerability assessment: A case study on erosion and coastal change along Tuticorin, Gulf of Mannar. Nat. Hazards 2014, 75, 1713–1729. [Google Scholar] [CrossRef]
  12. Islam, A.; Mitra, D.; Dewan, A.; Akhter, S.H. Coastal multi-hazard vulnerability assessment along the Ganges deltaic coast of Bangladesh–A geospatial approach. Ocean. Coast. Manag. 2016, 127, 1–15. [Google Scholar] [CrossRef]
  13. Hereher, M. Assessment of Egypt’s Red Sea coastal sensitivity to climate change. Environ. Earth Sci. 2015, 74, 2831–2843. [Google Scholar] [CrossRef]
  14. Todd, P.; Heery, E.C.; Loke, L.H.L.; Thurstan, R.H.; Kotze, D.J.; Swan, C. Towards an urban marine ecology: Characterizing the drivers, patterns and processes of marine ecosystems in coastal cities. Oikos 2019, 128, 1215–1242. [Google Scholar] [CrossRef] [Green Version]
  15. Wu, J.; Chen, B.; Mao, J.; Feng, Z. Spatiotemporal evolution of carbon sequestration vulnerability and its relationship with urbanization in China’s coastal zone. Sci. Total Environ. 2018, 645, 692–701. [Google Scholar] [CrossRef] [PubMed]
  16. Liu, C.; Yang, M. An empirical analysis of dynamic changes in ecological sustainability and its relationship with urbanization in a coastal city: The case of Xiamen in China. J. Clean. Prod. 2020, 256, 120482. [Google Scholar] [CrossRef]
  17. Das, M.; Das, A. Dynamics of Urbanization and its impact on Urban Ecosystem Services (UESs): A study of a medium size town of West Bengal, Eastern India. J. Urban. Manag. 2019. [Google Scholar] [CrossRef]
  18. Breuste, J.; Qureshi, S.; Li, J. Applied urban ecology for sustainable urban environment. Urban. Ecosyst. 2013, 16, 675–680. [Google Scholar] [CrossRef]
  19. Wu, J. Urban sustainability: An inevitable goal of landscape research. Landsc. Ecol. 2009, 25, 1–4. [Google Scholar] [CrossRef] [Green Version]
  20. Zhang, L.; Peng, J.; Liu, Y.; Wu, J. Coupling ecosystem services supply and human ecological demand to identify landscape ecological security pattern: A case study in Beijing–Tianjin–Hebei region, China. Urban. Ecosyst. 2016, 20, 701–714. [Google Scholar] [CrossRef]
  21. Zhang, R.; Pu, L.; Li, J.; Zhang, J.; Xu, Y. Landscape ecological security response to land use change in the tidal flat reclamation zone, China. Environ. Monit. Assess. 2015, 188, 1–10. [Google Scholar] [CrossRef]
  22. Su, Y.; Chen, X.; Liao, J.; Zhang, H.; Wang, C.; Ye, Y.; Wang, Y. Modeling the optimal ecological security pattern for guiding the urban constructed land expansions. Urban. For. Urban. Green. 2016, 19, 35–46. [Google Scholar] [CrossRef]
  23. Yu, K.; Li, D.; Li, N. The evolution of Greenways in China. Landsc. Urban. Plan. 2006, 76, 223–239. [Google Scholar] [CrossRef]
  24. Lin, Q.; Mao, J.; Wu, J.; Li, W.; Yang, J. Ecological Security Pattern Analysis Based on InVEST and Least-Cost Path Model: A Case Study of Dongguan Water Village. Sustainability 2016, 8, 172. [Google Scholar] [CrossRef] [Green Version]
  25. Teng, M.; Wu, C.; Zhou, Z.; Lord, E.; Zheng, Z. Multipurpose greenway planning for changing cities: A framework integrating priorities and a least-cost path model. Landsc. Urban. Plan. 2011, 103, 1–14. [Google Scholar] [CrossRef]
  26. Liu, D.; Chang, Q. Ecological security research progress in China. Acta Ecol. Sin. 2015, 35, 111–121. [Google Scholar] [CrossRef]
  27. Wei, S.; Pan, J.; Liu, X. Landscape ecological safety assessment and landscape pattern optimization in arid inland river basin: Take Ganzhou District as an example. Hum. Ecol. Risk Assess. Int. J. 2018, 26, 782–806. [Google Scholar] [CrossRef]
  28. Li, S.; Xiao, W.; Zhao, Y.; Lv, X. Incorporating ecological risk index in the multi-process MCRE model to optimize the ecological security pattern in a semi-arid area with intensive coal mining: A case study in northern China. J. Clean. Prod. 2020, 247, 119143. [Google Scholar] [CrossRef]
  29. Xu, J.; Fan, F.; Liu, Y.; Dong, J.; Chen, J. Construction of Ecological Security Patterns in Nature Reserves Based on Ecosystem Services and Circuit Theory: A Case Study in Wenchuan, China. Int. J. Environ. Res. Public Health 2019, 16, 3220. [Google Scholar] [CrossRef] [Green Version]
  30. Fu, Y.; Shi, X.; He, J.; Yuan, Y.; Qu, L. Identification and optimization strategy of county ecological security pattern: A case study in the Loess Plateau, China. Ecol. Indic. 2020, 112, 106030. [Google Scholar] [CrossRef]
  31. Grafius, D.R.; Corstanje, R.; Warren, P.H.; Evans, K.L.; Hancock, S.; Harris, J. The impact of land use/land cover scale on modelling urban ecosystem services. Landsc. Ecol. 2016, 31, 1509–1522. [Google Scholar] [CrossRef] [Green Version]
  32. Knaapen, J.P.; Scheffer, M.; Harms, B. Estimating habitat isolation in landscape planning. Landsc. Urban. Plan. 1992, 23, 1–16. [Google Scholar] [CrossRef]
  33. Yu, K. Security patterns and surface model in landscape ecological planning. Landsc. Urban. Plan. 1996, 36, 1–17. [Google Scholar] [CrossRef]
  34. Li, J.; Xu, J.-G.; Chu, J. The Construction of a Regional Ecological Security Pattern Based on Circuit Theory. Sustainability 2019, 11, 6343. [Google Scholar] [CrossRef] [Green Version]
  35. Costanza, R.; De Groot, R.; Braat, L.; Kubiszewski, I.; Kubiszewski, I.; Sutton, P.C.; Farber, S.; Grasso, M. Twenty years of ecosystem services: How far have we come and how far do we still need to go? Ecosyst. Serv. 2017, 28, 1–16. [Google Scholar] [CrossRef]
  36. Grêt-Regamey, A.; Altwegg, J.; Sirén, E.A.; Van Strien, M.J.; Weibel, B. Integrating ecosystem services into spatial planning—A spatial decision support tool. Landsc. Urban. Plan. 2017, 165, 206–219. [Google Scholar] [CrossRef] [Green Version]
  37. Wu, J.S.; Zhang, L.Q.; Peng, J.; Feng, Z.; Liu, H.M.; He, S.B. The integrated recognition of the source area of the urban ecological security pattern in Shenzhen. Acta Ecol. Sin. 2013, 33, 4125–4133. [Google Scholar] [CrossRef]
  38. Xie, G.D.; Zhang, C.X.; Zhang, L.M.; Chen, W.H.; Li, S.M. Improvement of the evaluation method for ecosystem service value based on per unit area. J. Natl. Resour. 2015, 30, 1243–1254. [Google Scholar] [CrossRef]
  39. Xie, G.; Zhang, C.; Zhen, L.; Zhang, L. Dynamic changes in the value of China’s ecosystem services. Ecosyst. Serv. 2017, 26, 146–154. [Google Scholar] [CrossRef]
  40. Ekins, P.; Pearce, D. Economic Values and the Natural World. Int. Aff. 1993, 69, 774. [Google Scholar] [CrossRef]
  41. Peng, J.; Pan, Y.; Yanxu, L.; Zhao, H.; Wang, Y. Linking ecological degradation risk to identify ecological security patterns in a rapidly urbanizing landscape. Habitat Int. 2018, 71, 110–124. [Google Scholar] [CrossRef]
  42. Talukdar, S.; Singha, P.; Shahfahad; Mahato, S.; Praveen, B.; Rahman, A. Dynamics of ecosystem services (ESs) in response to land use land cover (LU/LC) changes in the lower Gangetic plain of India. Ecol. Indic. 2020, 112, 106121. [Google Scholar] [CrossRef]
  43. Sheng, N.; Tang, U.W. Zhuhai. Cities 2013, 32, 70–79. [Google Scholar] [CrossRef]
  44. Zubaida, M.B.; Xia, J.X.; Polat, M.; Shi, Q.D.; Zhang, R. Spatiotemporal changes of land use/cover from 1995 to 2015 in an oasis in the middle reaches of the Keriya River, southern Tarim Basin, Northwest China. Catena 2018, 171, 416–425. [Google Scholar] [CrossRef]
  45. Çay, T.; Uyan, M. Evaluation of reallocation criteria in land consolidation studies using the Analytic Hierarchy Process (AHP). Land Use Policy 2013, 30, 541–548. [Google Scholar] [CrossRef]
  46. Costanza, R.; D’Arge, R.; De Groot, R.; Farber, S.; Grasso, M.; Hannon, B.; Limburg, K.; Naeem, S.; O’Neill, R.V.; Paruelo, J.; et al. The value of the world’s ecosystem services and natural capital. Nature 1997, 387, 253–260. [Google Scholar] [CrossRef]
  47. Xie, G.D.; Lu, C.X.; Leng, Y.F.; Zheng, D.; Li, S.C. Ecological assets valuation of the Tibetan Plateau. J. Nat. Resour. 2003, 18, 189e196. [Google Scholar] [CrossRef]
  48. Cui, N.; Feng, C.-C.; Han, R.; Guo, L. Impact of Urbanization on Ecosystem Health: A Case Study in Zhuhai, China. Int. J. Environ. Res. Public Health 2019, 16, 4717. [Google Scholar] [CrossRef] [Green Version]
  49. Wang, Y.; Pan, J. Building ecological security patterns based on ecosystem services value reconstruction in an arid inland basin: A case study in Ganzhou District, NW China. J. Clean. Prod. 2019, 241, 118337. [Google Scholar] [CrossRef]
  50. Wan, L.; Ye, X.; Lee, J.; Lu, X.; Zheng, L.; Wu, K. Effects of urbanization on ecosystem service values in a mineral resource-based city. Habitat Int. 2015, 46, 54–63. [Google Scholar] [CrossRef]
  51. Xiao, Y.; Zhao, J.; Sun, S.; Guo, L.; Axmacher, J.; Sang, W. Sustainability Dynamics of Traditional Villages: A Case Study in Qiannan Prefecture, Guizhou, China. Sustainability 2019, 12, 314. [Google Scholar] [CrossRef] [Green Version]
  52. Dong, R.; Zhang, X.; Li, H. Constructing the Ecological Security Pattern for Sponge City: A Case Study in Zhengzhou, China. Water 2019, 11, 284. [Google Scholar] [CrossRef] [Green Version]
  53. Tran, D.X.; Pla, F.; Latorre-Carmona, P.; Myint, S.W.; Caetano, M.; Kieu, H.V. Characterizing the relationship between land use land cover change and land surface temperature. ISPRS J. Photogramm. Remote. Sens. 2017, 124, 119–132. [Google Scholar] [CrossRef] [Green Version]
  54. Ye, H.; Yang, Z.; Xu, X. Ecological Corridors Analysis Based on MSPA and MCR Model—A Case Study of the Tomur World Natural Heritage Region. Sustainability 2020, 12, 959. [Google Scholar] [CrossRef] [Green Version]
  55. Jiang, W.; Cai, Y.; Tian, J. The application of minimum cumulative resistance model in the evaluation of urban ecological land use efficiency. Arab. J. Geosci. 2019, 12, 714. [Google Scholar] [CrossRef]
  56. Li, S.; Xiao, W.; Zhao, Y.; Xu, J.; Da, H.; Lv, X. Quantitative Analysis of the Ecological Security Pattern for Regional Sustainable Development: Case Study of Chaohu Basin in Eastern China. J. Urban. Plan. Dev. 2019, 145, 04019009. [Google Scholar] [CrossRef]
  57. Peng, W.; Zhou, J. Development of Land Resources in Transitional Zones Based on Ecological Security Pattern: A Case Study in China. Nat. Resour. Res. 2018, 28, 43–60. [Google Scholar] [CrossRef]
  58. Liu, G.; Liang, Y.; Cheng, Y.; Wang, H.; Yi, L. Security Patterns and Resistance Surface Model in Urban Development: Case Study of Sanshui, China. J. Urban. Plan. Dev. 2017, 143, 05017011. [Google Scholar] [CrossRef]
  59. Peng, J.; Yang, Y.; Liu, Y.; Hu, Y.; Du, Y.; Meersmans, J.; Qiu, S. Linking ecosystem services and circuit theory to identify ecological security patterns. Sci. Total Environ. 2018, 644, 781–790. [Google Scholar] [CrossRef] [Green Version]
  60. Luo, Y.; Wu, J.; Wang, X.; Wang, Z.; Zhao, Y. Can policy maintain habitat connectivity under landscape fragmentation? A case study of Shenzhen, China. Sci. Total Environ. 2020, 715, 136829. [Google Scholar] [CrossRef]
  61. Chen, C.; Shi, L.; Lu, Y.; Yang, S.; Liu, S. The Optimization of Urban Ecological Network Planning Based on the Minimum Cumulative Resistance Model and Granularity Reverse Method: A Case Study of Haikou, China. IEEE Access 2020, 8, 43592–43605. [Google Scholar] [CrossRef]
Figure 1. Location of the study area.
Sustainability 12 06629 g001
Figure 2. Methodological framework used in this study.
Sustainability 12 06629 g002
Figure 3. Degree of change in the value of a single ecosystem service in Zhuhai city. ES names in the image: Grain production (G.P.), Raw material (R.M.), Gas regulation (G.R.), Climate regulation (C.R.), Water conservation (W.C.), Waste treatment (W.T.), Soil formation and erosion control (S.F.E.C.), Biodiversity conservation (B.C.), Entertainment culture (E.C.).
Sustainability 12 06629 g003
Figure 4. The distribution map of ESVs in 1999, 2005, 2009, and 2013 in Zhuhai city.
Sustainability 12 06629 g004
Figure 5. (a) Results of Getis-Ord Gi *; (b) Resistance surface.
Sustainability 12 06629 g005
Figure 6. Ecological security pattern (ESP) in Zhuhai city.
Sustainability 12 06629 g006
Table 1. The level and weight of resistance factor.
Resistance FactorUnitLevel of ResistanceWeight
1st Level2nd Level3rd Level4th Level
Land Use Type Water bodies, forestlandWetland, grasslandFarmlandBare land, construction land0.30
Altitudem<125125–250250–375>3750.05
Slope <77–1515–25>250.10
Population <17431743–34863486–5229>52290.20
Vegetation Coverage >0.700.55–0.700.40–0.55<0.400.20
Distance from Waterm<500500–10001000–1500>15000.15
Table 2. Ecosystem service value (ESV) in Zhuhai city in 1999, 2005, 2009, and 2013 (108 yuan).
YearG.P.R.M.G.R.C.R.W.C.W.T.S.F.E.C.B.C.E.C.Total
19991.402.343.785.9014.3311.604.215.924.2953.74
20051.182.293.635.7317.9314.123.836.335.1460.17
20091.162.123.365.2415.7612.513.625.804.5854.15
20130.922.283.484.9416.7612.823.556.084.9055.73
Ecosystem service (ES) names in the table: Grain production (G.P.), Raw material (R.M.), Gas regulation (G.R.), Climate regulation (C.R.), Water conservation (W.C.), Waste treatment (W.T.), Soil formation and erosion control (S.F.E.C.), Biodiversity conservation (B.C.), Entertainment culture (E.C.).
Table 3. Importance indices of ecosystem services in Zhuhai city.
YearG.P.R.M.G.R.C.R.W.C.W.T.S.F.E.C.B.C.E.C.
20051.280.200.340.242.111.830.750.581.67
20091.740.951.121.111.010.791.390.200.69
20132.550.180.581.211.260.781.170.211.06
ES names in the table: Grain production (G.P.), Raw material (R.M.), Gas regulation (G.R.), Climate regulation (C.R.), Water conservation (W.C.), Waste treatment (W.T.), Soil formation and erosion control (S.F.E.C.), Biodiversity conservation (B.C.), Entertainment culture (E.C.).
Table 4. Results of the sensitivity coefficient.
Land UseForestlandGrasslandFarmlandWetlandWaterOthers
20050.200.010.030.030.720.01
20090.330.010.050.030.560.01
20130.280.020.050.040.630.02