Article

Research on Annual Thermal Environment of Non-Hvac Building Regulated by Window-to-Wall Ratio in a Chinese City (Chenzhou)

1
School of Architecture and Art, Central South University, Changsha 410083, China
2
College of Landscape and Art Design, Hunan Agricultural University, Changsha 410128, China
*
Author to whom correspondence should be addressed.
Sustainability 2020, 12(16), 6637; https://doi.org/10.3390/su12166637
Submission received: 22 July 2020 / Revised: 13 August 2020 / Accepted: 14 August 2020 / Published: 17 August 2020
(This article belongs to the Section Sustainable Urban and Rural Development)

Abstract

:
As the window-to-wall ratio, a microclimatic factor in residential districts, regulates the indoor thermal environment and implicates the energy consumption, this research was aimed at interpreting the microclimate effects of the window-to-wall ratio on the indoor thermal environment of the non-Hvac building located in the block from the view of a full year. Urban built parameters and building material parameters applied in Chenzhou were investigated, with the ENVI-met model serving as the analytical tool calculating the meteorological data recorded in the local national meteorological station. The thermal perception criterion of Chenzhou citizens was investigated, and thermal isotherms were employed to interpret the thermal perception distribution throughout the year. Analytical results revealed that the annual indoor thermal environment would deteriorate along with the growth of the window-to-wall ratio in Chenzhou, with the very hot thermal perception environment covering the months from March to October once the window-to-wall ratio outnumbered 60.00%. Furthermore, the hot and very hot thermal perception environments originated in the ranges of 0.00% to 20.00% and that of 20.00% to 40.00%, respectively. Furthermore, if the window-to-wall ratios (WWRs) outnumbered 40%, their effects on the indoor thermal perception environment would gradually decrease and be powerless once that exceeded 80%.

1. Introduction

The energy consumption in residential buildings represents roughly 21.1% of the total energy consumption in China [1], among which heating and cooling account for about 70% of all the residential energy consumption [2]. Thus, reducing the building energy demand in residential buildings for both cooling and heating is a great opportunity for energy savings. Microclimate, a passive solution to minimize the energy demand, has been proposed by urban designers as it optimizes urban thermal comfort [3,4]. Among the aspects related to the design of the urban environment, the window-to-wall ratio (WWR), namely, the ratio of the transparent area to the opaque wall, is a parameter that deeply affects both the energy consumption [5,6] and the appearance of the buildings [7]. However, in the architectural design process, the “transparency” of the building is generally considered more for aesthetic implications than for energy-saving performance [8,9]. Furthermore, this set is usually made in the initial stage of the total design process and will not be subject to subsequent modifications, different from that of many other aspects, including materials, operations, and equipment, which can be easily optimized at the later stage [10]. The set of a suitable WWR for a building should be implemented at the very first stage with an energy-wise method, and therefore it is of significance that this set is made rationally.
In terms of building thermal performance, the influences of the WWR have been broadly investigated [11,12]. However, more often, such research only analyzed individual buildings [13,14], ignoring their surrounding environments, while the effects of the WWR have been confirmed to be influenced by the surroundings evidently [15,16] including the topography, layout, and structural features [17]. Moreover, most of the research did not consider a full-year evaluation of the environmental impacts of the WWR. Only typical summer days or hours were considered [18,19]. The existing studies also lack a comprehensive evaluation which integrates both the confirmed positive effects and the rarely noticed negative impacts of the WWR on the environment.
Residential buildings located in economically backward areas of China are not equipped with air conditioning. A passive environmental regulation design is particularly important for those residents’ life. Due to the diversities existing in the local climate, building materials, the heat tolerance of the human body, etc., each place has its own optimal WWR for non-Hvac residential buildings. While the design criterion of the WWR in China is that the WWR facing north shall not exceed 0.25, that of the east-west direction is not more than 0.3, and that of south direction is not higher than 0.35, which is a general rule in China’s five climatic regions [20]. Therefore, it is greatly important for urban and rural designers to study the influence of the WWR on the indoor thermal environment based on local climate characteristics and building material properties to identify the optimum WWR locally.
This research was aimed at, first, interpreting the yearly variation of indoor thermal conditions in non-Hvac residential buildings according to different WWRs, and second, identifying the critical value of the WWR for achieving the acceptable indoor thermal perception of the non-Hvac building in Chenzhou, Hunan, China, exploring a referable method for identifying the critical value of the WWR in cities of other climates. Specifically, urban setting parameters and building materials of Chenzhou were investigated, as well as the hourly meteorological data of each day in 2018 were derived from the local meteorological station. Then, the hourly indoor air temperature of each month was simulated in six different cases using ENVI-met [21], covering 1728 h (24 h/1 day × 12 months/year × 6 cases). Subsequently, the Kriging algorithm of the SURFER software [22] served to draw the indoor thermal isotherms of the six WWRs (0.00%, 20.00%, 40.00%, 60.00%, 80.00%, 100.00%).

2. Research Methods

Based on the local climate parameters and building material properties, the indoor thermal environments under different WWRs were calculated by ENVI-met, and the regulations of WWRs on the indoor thermal environment were explored. Based on the thermal perception characteristics of local citizens, the indoor thermal acceptability under different WWR scenarios was analyzed. The details of the method are shown as follows.

2.1. Evaluation Index

There is no unified thermal perception standard as an individual’s physiological acclimatization and psychological habituation are variable [23]. Many researchers have carried out studies on thermal comfort criteria in different geographical areas, such as Singapore, Taiwan, and Changsha [24]. In this research, the classification of the temperature perception was derived from 7851 sample surveys in Changsha City [25], which shared the same climatic conditions as Chenzhou, with similar local climate and individual’s physiological acclimatization and psychological habituation [26,27]. The thermal perception standard of this research is shown in Table 1.

2.2. Study Model

2.2.1. Technical Model

The ENVI-met model was employed to calculate the indoor air temperature in varied meteorological conditions for its function of the interaction between outdoor microclimate and indoor climate. ENVI-met provides high-resolution modeling of the heat and humidity transfer at the building facade and a prognostic calculation of wall and indoor temperatures. Compared with the other traditional computational fluid dynamic simulation software platforms, ENVI-met realizes the analysis of small scale changes in urban design, such as tree setting and building configuration [28,29], which makes it a widely used analytical tool in the field of the built environment. ENVI-met is also well known among the scientific community for its higher accuracy, with the Pearson value of its predictions being proved as 0.956, exceeding 0.866 (Solweig model) and 0.867 (Rayman model) [30,31]. The principles and mathematical models of ENVI-met can be seen in Bruse’s paper [32].

2.2.2. Case Model

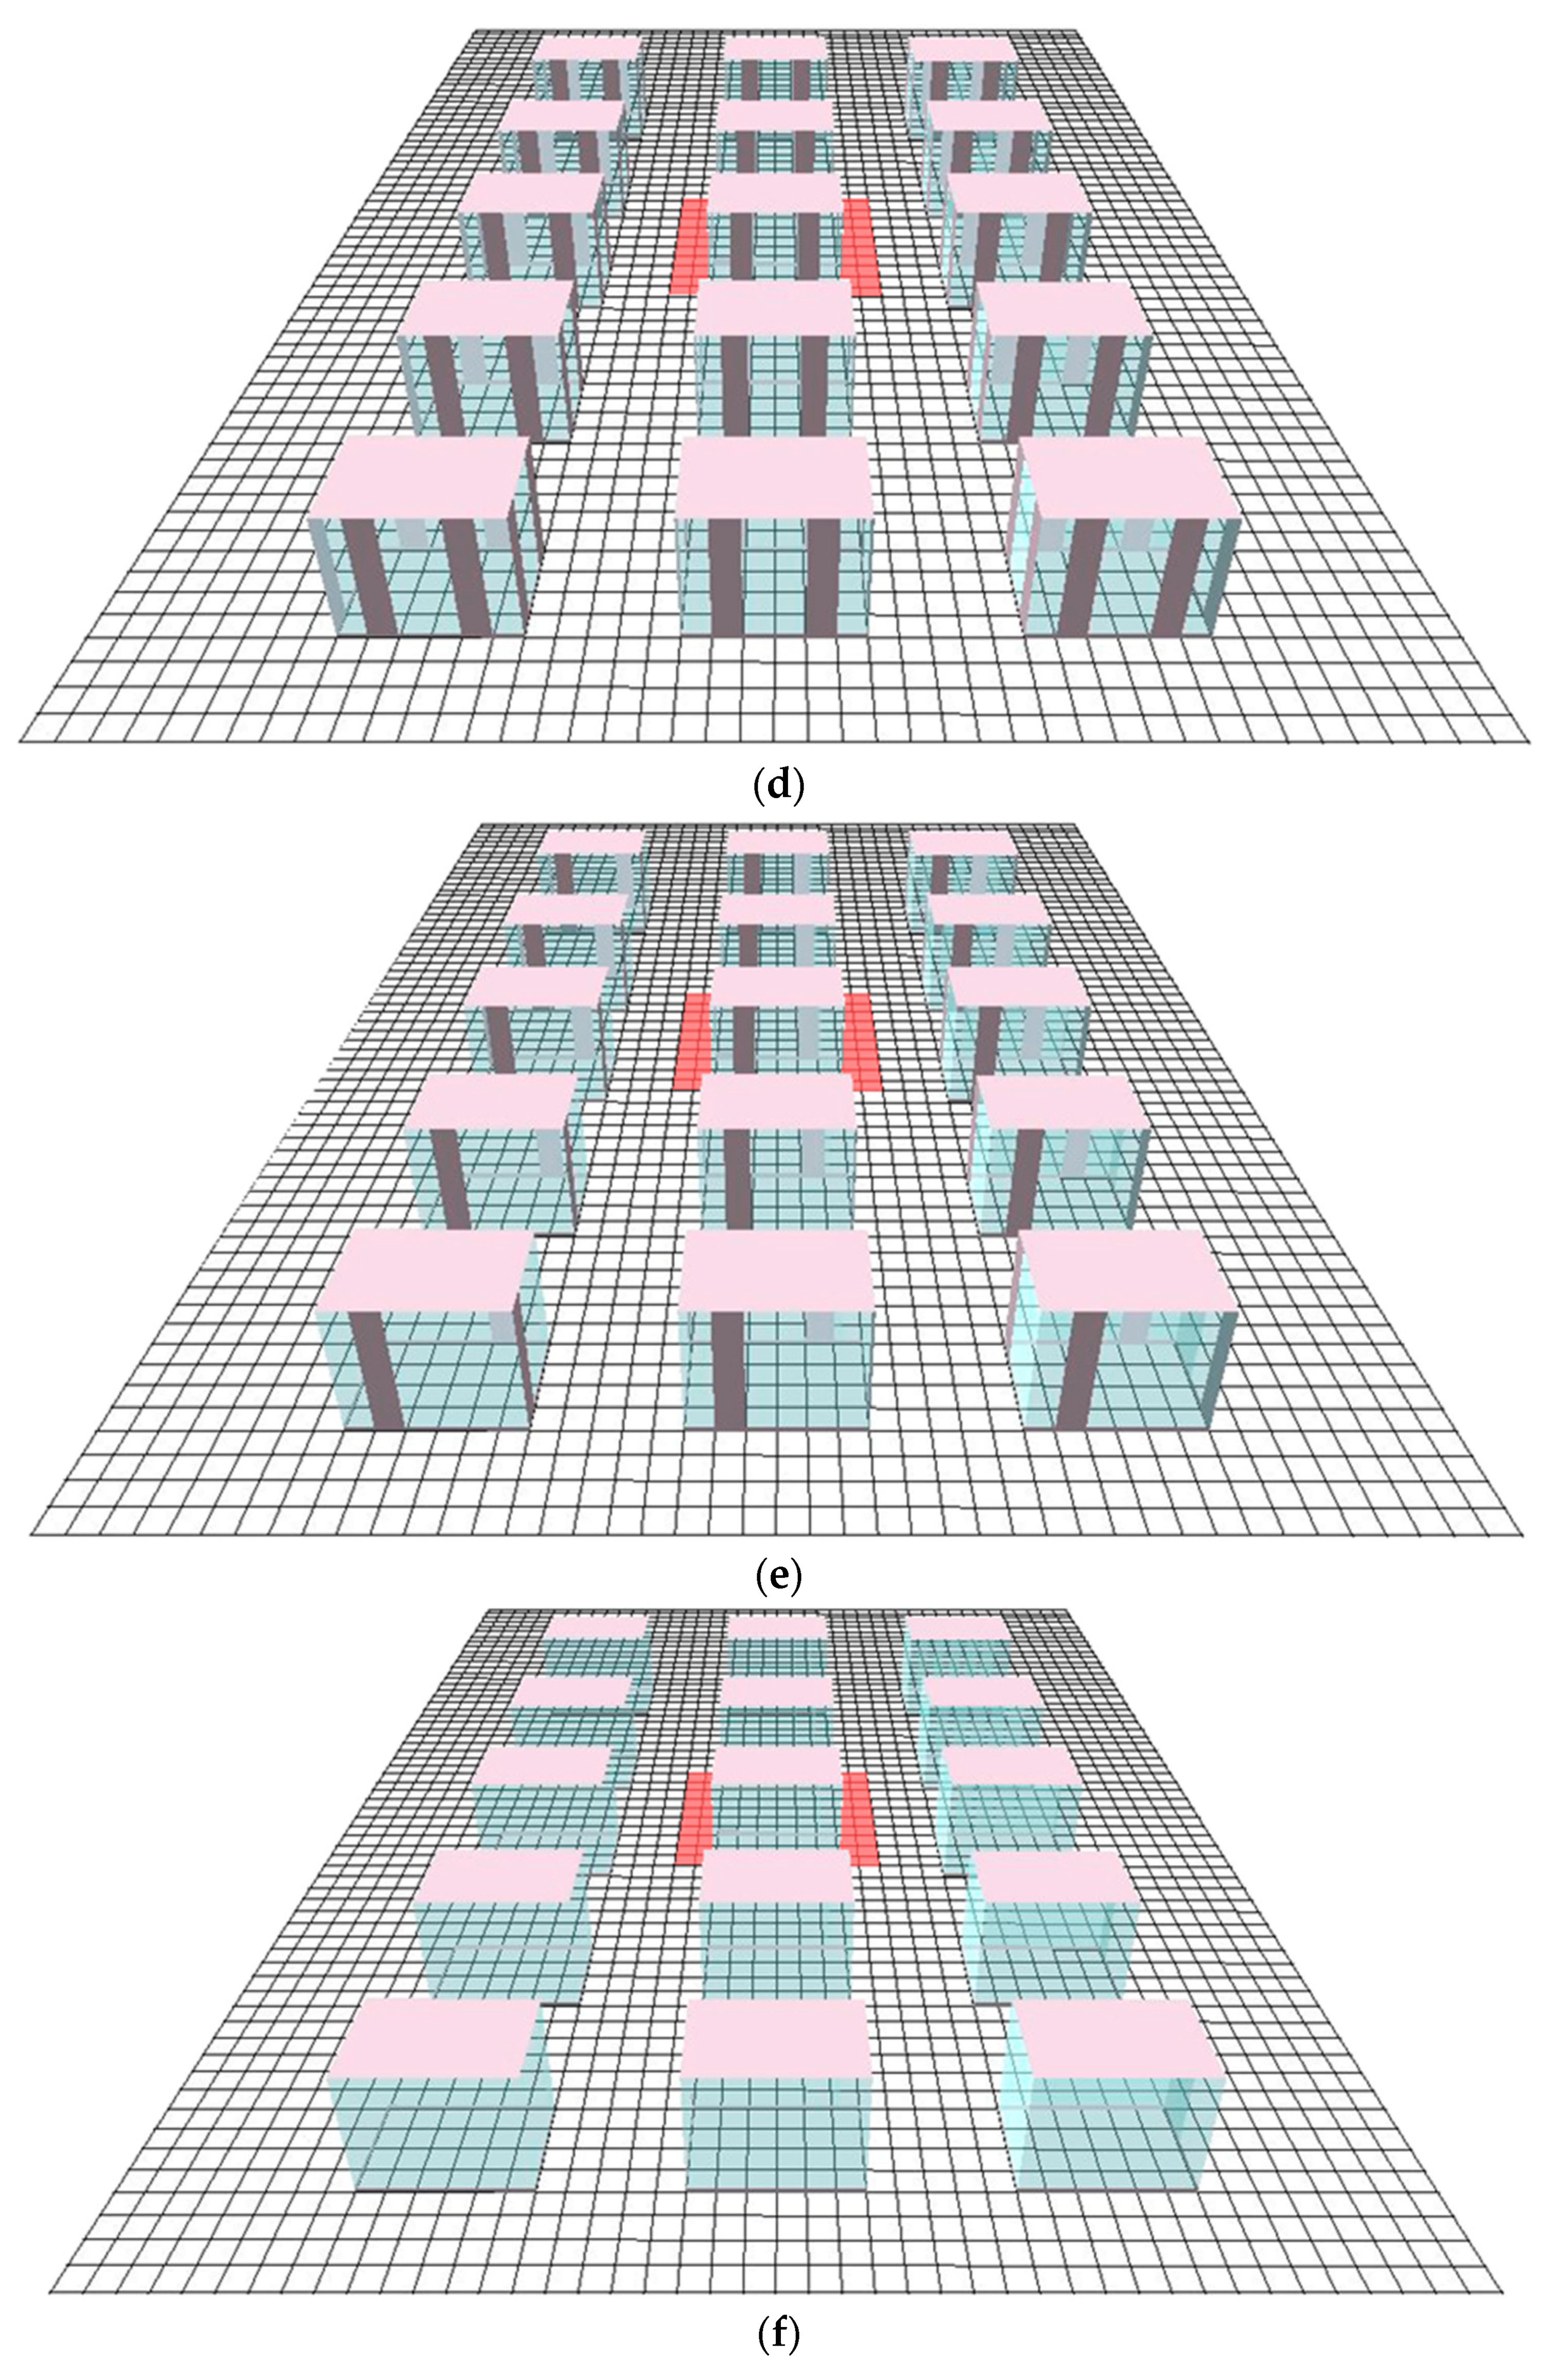
Chenzhou city is located at the northern foot of Nanling Mountain in the southern part of the hot summer and cold winter climatic zone of China. This location has the strongest heat radiation in summer and the coldest winter caused by the cold fronts blocked by the Nanling Mountain [33,34]. Chenzhou is the main city in the north of Nanling Mountain, making it the most suitable target for this research. The case model was located at 113°04′ E, 25°79′ N, 149 m above the sea level and was built in conformity with the actual residential community of Chenzhou, specifically, constructed by the actual height of 6 m, the height/width ratio of 1.2 [35]. The WWRs of 0%, 20%, 40%, 60%, 80%, and 100% were selected to explore their impacts on indoor thermal comfort, which are shown as a, b, c, d, e, and f subgraphs in Figure 1. The indoor air temperature of the center building in red was adopted as the analysis data, seen in Figure 1.

2.3. Window-to-Wall Ratio Settings

An investigation of the local construction materials was first carried out by visiting the Chenzhou housing-management department. Concrete hollow-brick wall and plexiglass are the most commonly used building materials in Chenzhou city, and these two materials were considered respectively for the walls and the windows in this research (see the specific parameters in Table 2).

2.4. Sources and Settings of Meteorological Data

The meteorological data were collected from the National Meteorological Station (No. 57972) located at 113°02′ E, 25°48′ N, at 184.9 m above the sea level in Chenzhou city. Hourly data (air temperature, humidity, wind speed, and direction) in the year of 2018 were collected, with a total of 8760 (24 × 365) items of meteorological data achieved.
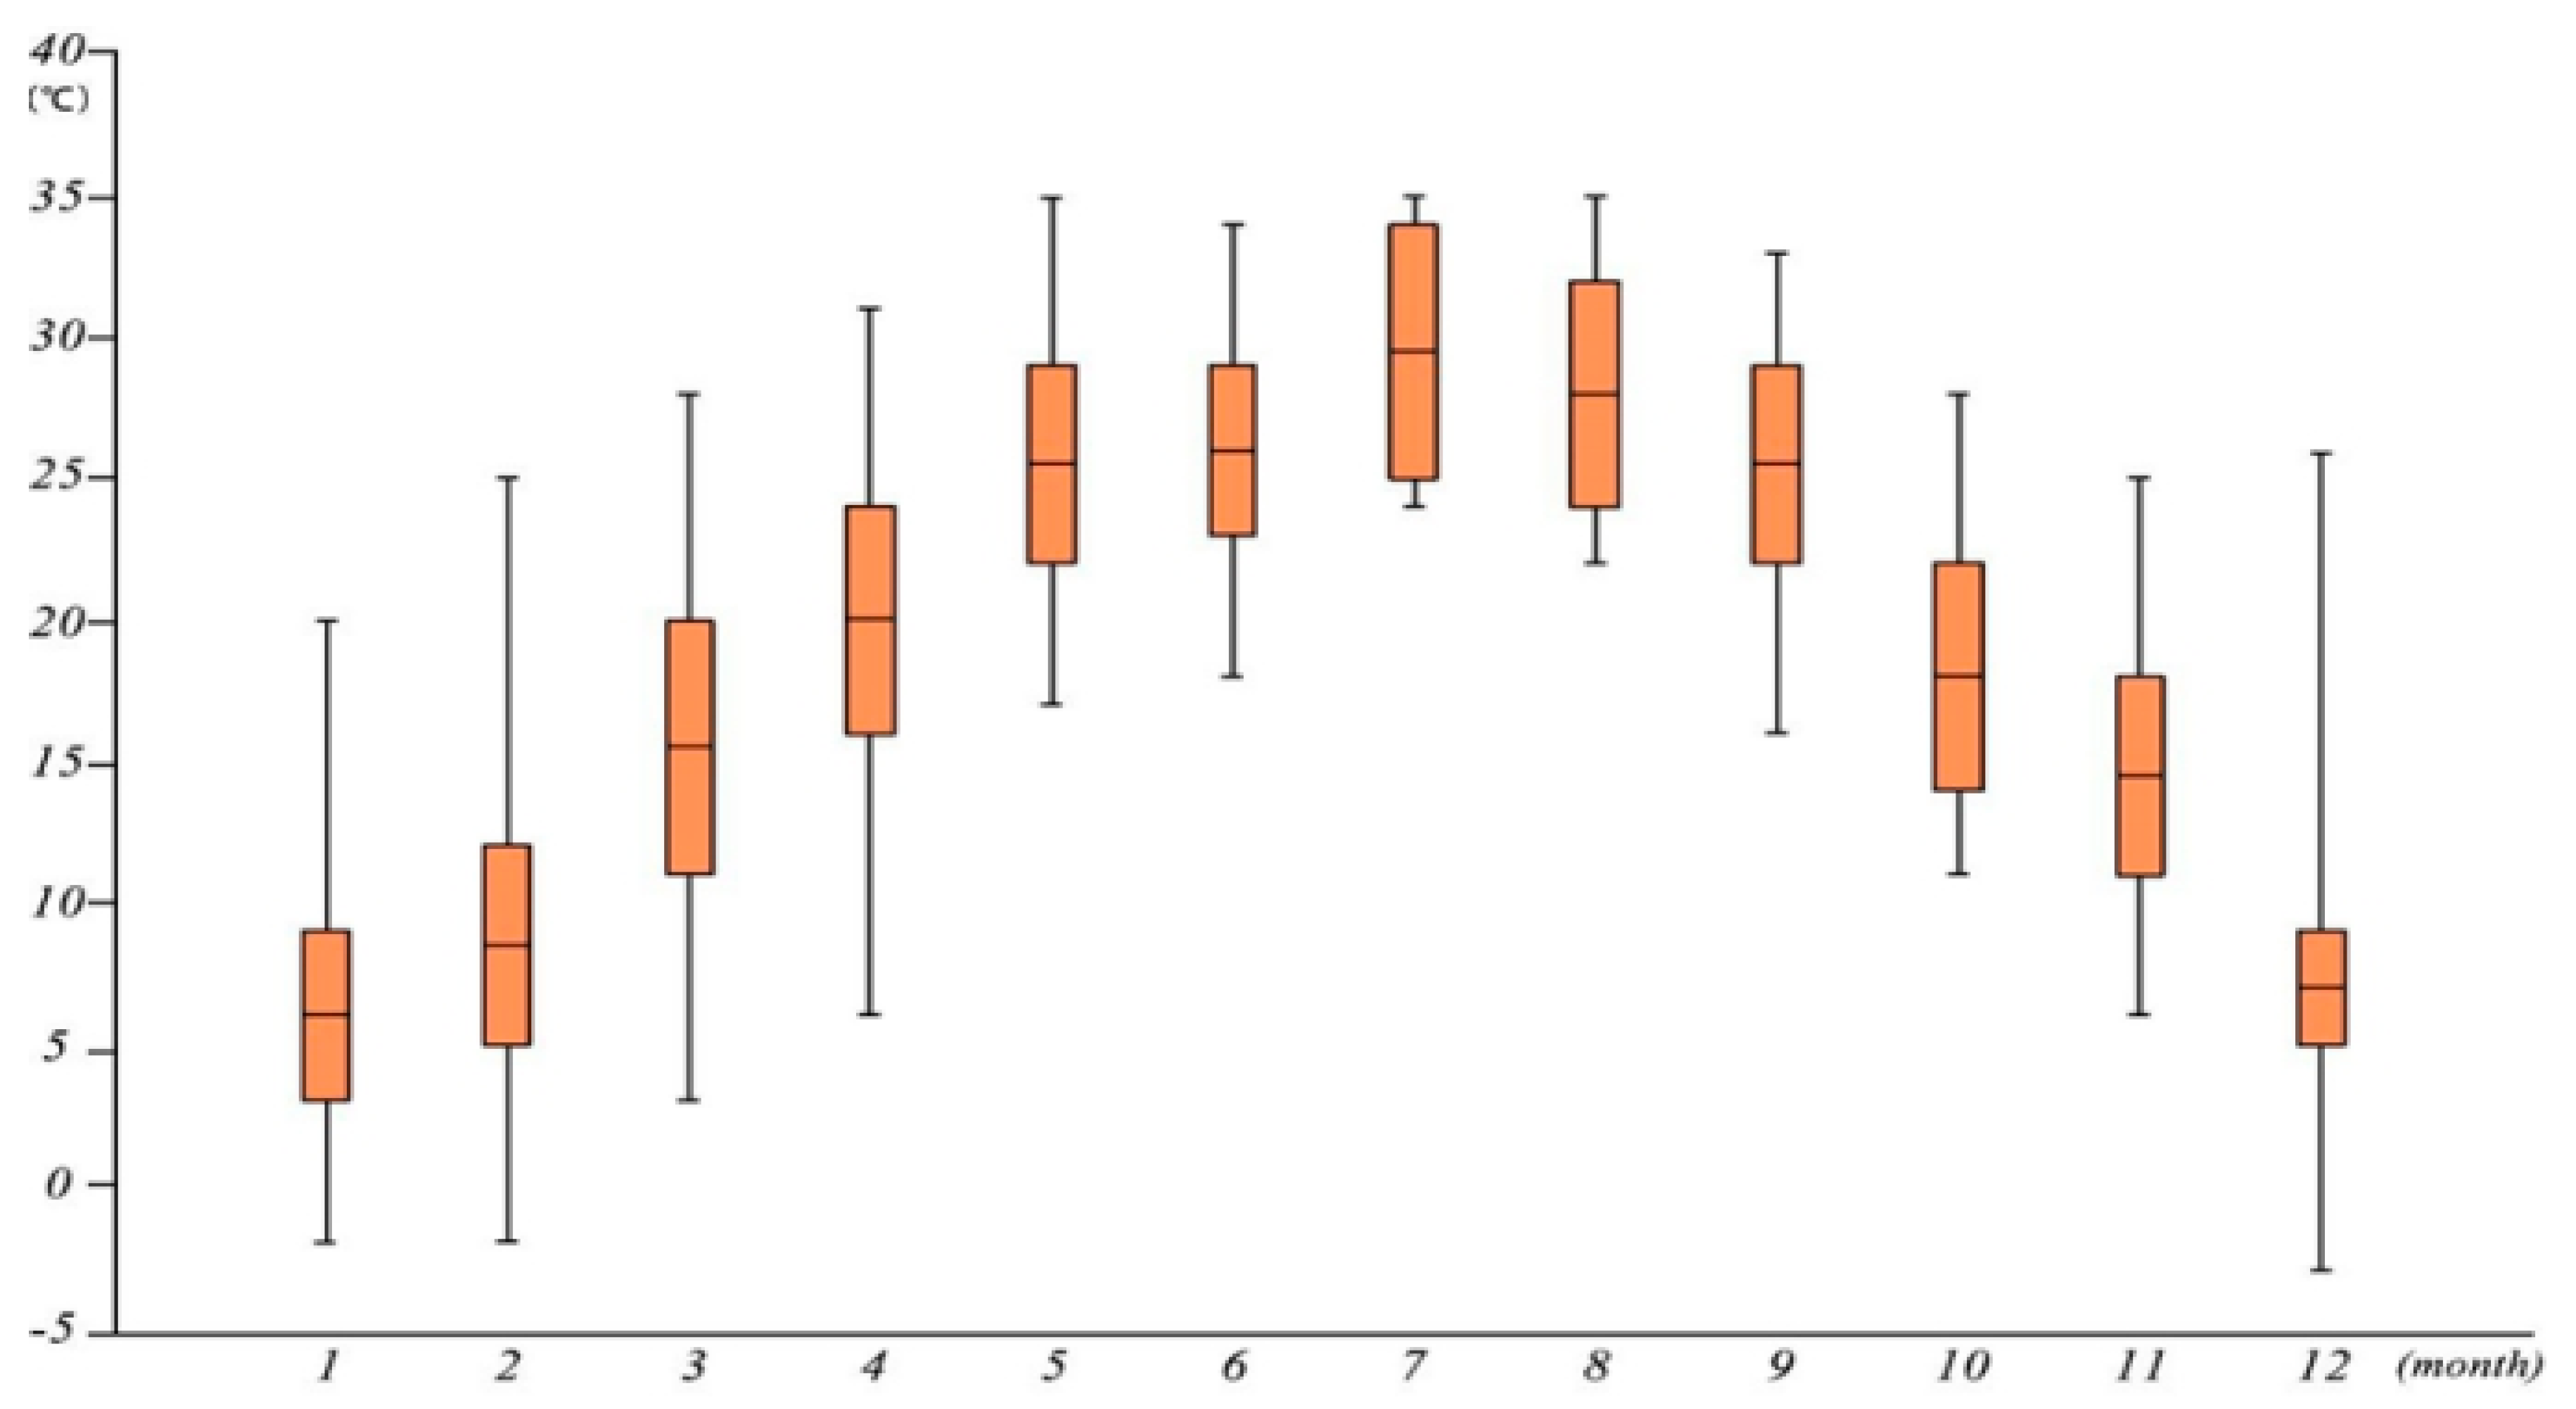
To represent the general monthly characteristics of the climate, average hour meteorological data of each month were calculated. For instance, the average air temperature recorded at 6 a.m. of the 31 days in January was employed to indicate the general air temperature of 6 a.m. in January. By analogy, 288 (12 × 24) pieces of monthly general data were calculated, affiliated to 12 months respectively. The total monthly characteristics of the Chenzhou air temperature are presented in Figure 2 where the middle line of each yellow box indicates the median air temperature. The bottom and top lines of each box represent the lower and upper quartiles, respectively, and the upper and lower bars represent the 90% and 10% limits.
The meteorological setting of the research is shown in Table 3.

3. Results and Discussion

3.1. The Mean Monthly Effects of WWRs on Indoor Air Temperature

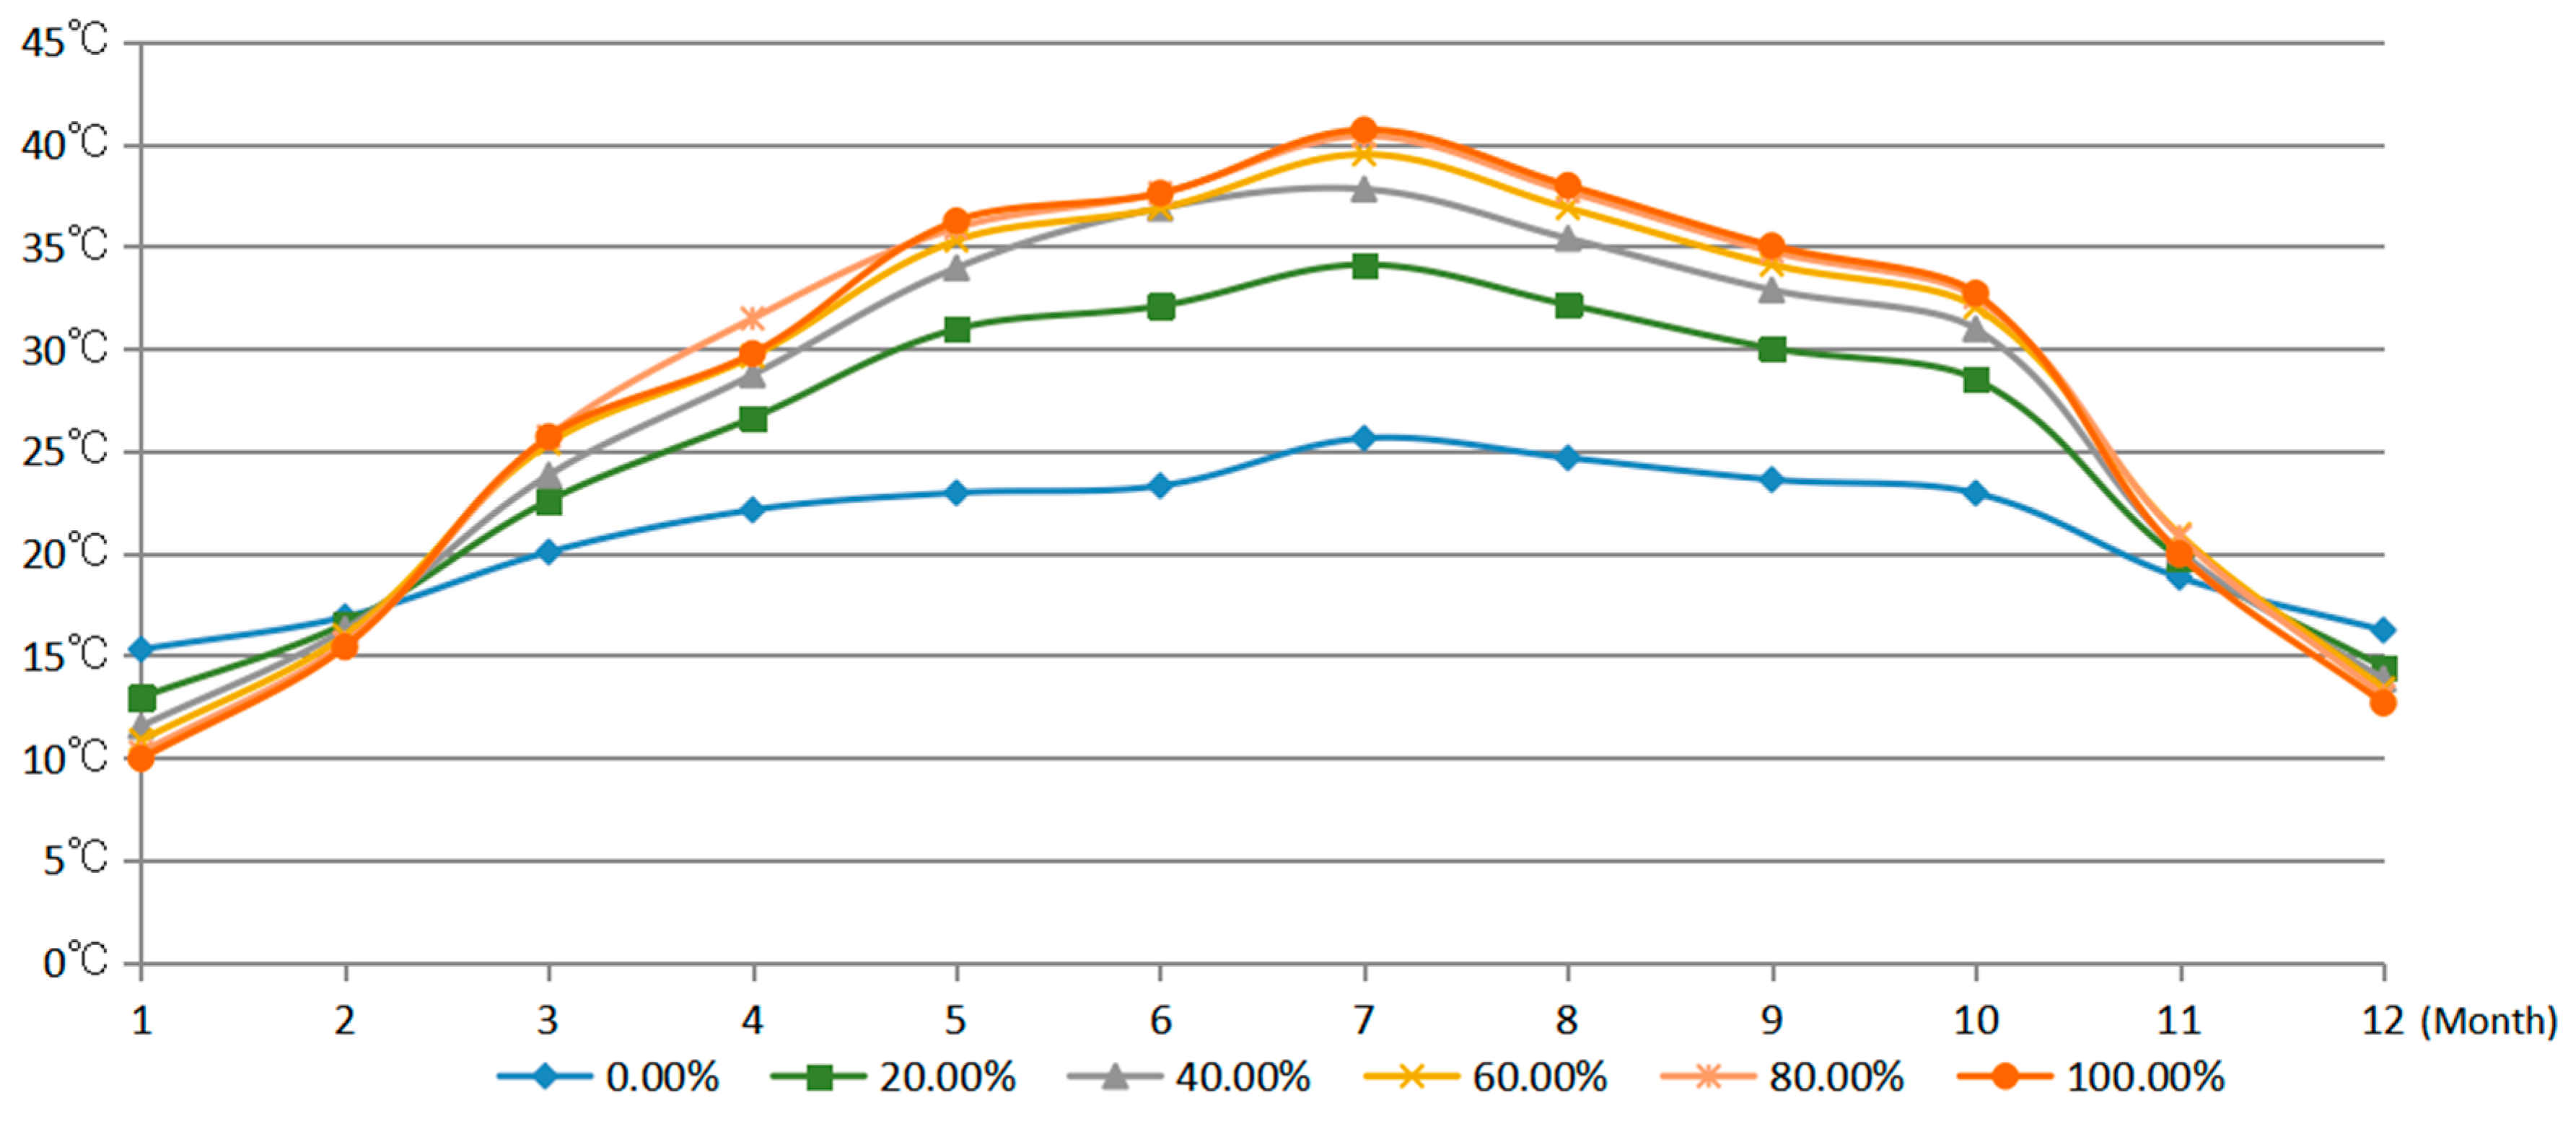
The monthly indoor temperatures of the six cases are shown in Figure 3, where the x coordinate indicates the 12 months and the y coordinate represents the monthly average air temperature, with six different lines showing the corresponding cases. In general, the annual variation range of indoor temperature increased with the rise of the WWR. In winter (December, January, February), the lower WWR benefited the indoor thermal environment by conserving heat indicated by approaching “neutral”. For summer, the higher WWR deteriorated the indoor thermal environment indicated by escaping the “neutral”. For the 0.00% WWR, the “neutral” thermal environment months covered January, February, March, April, November, and December, while that of 20% decreased to only February, March, and November. As for the other cases, the “neutral” thermal environment only comprised February and November.
Specifically, the annual indoor thermal perception of 0.00% WWR ranged from 15 °C to 26 °C, followed by that of 20.00% with the range of 13 °C to 34 °C. The indoor temperature difference gradually narrowed when the WWR varied from 40% to 100%, which revealed that when the WWR exceeded the threshold of 40%, the influence of WWR on the indoor thermal environment became weak.

3.2. The Distribution of Annual Thermal Comfort

Although the total month characteristics of the indoor thermal environment were clarified according to varied WWRs, its statistical data were unable to reflect the indoor thermal environment from the time dimension and it was impossible to describe the daily variation of the indoor thermal environment (for example, the difference between 9:00 a.m. and 9:00 p.m. in the same day). Kriging model has been proved to be suitable for the interpolation of temperature data in many references [36]. Therefore, the Kriging model of the SURFER software was selected for calculation, with the thermal isotherm for each WWR formed for exhaustive interpretation.
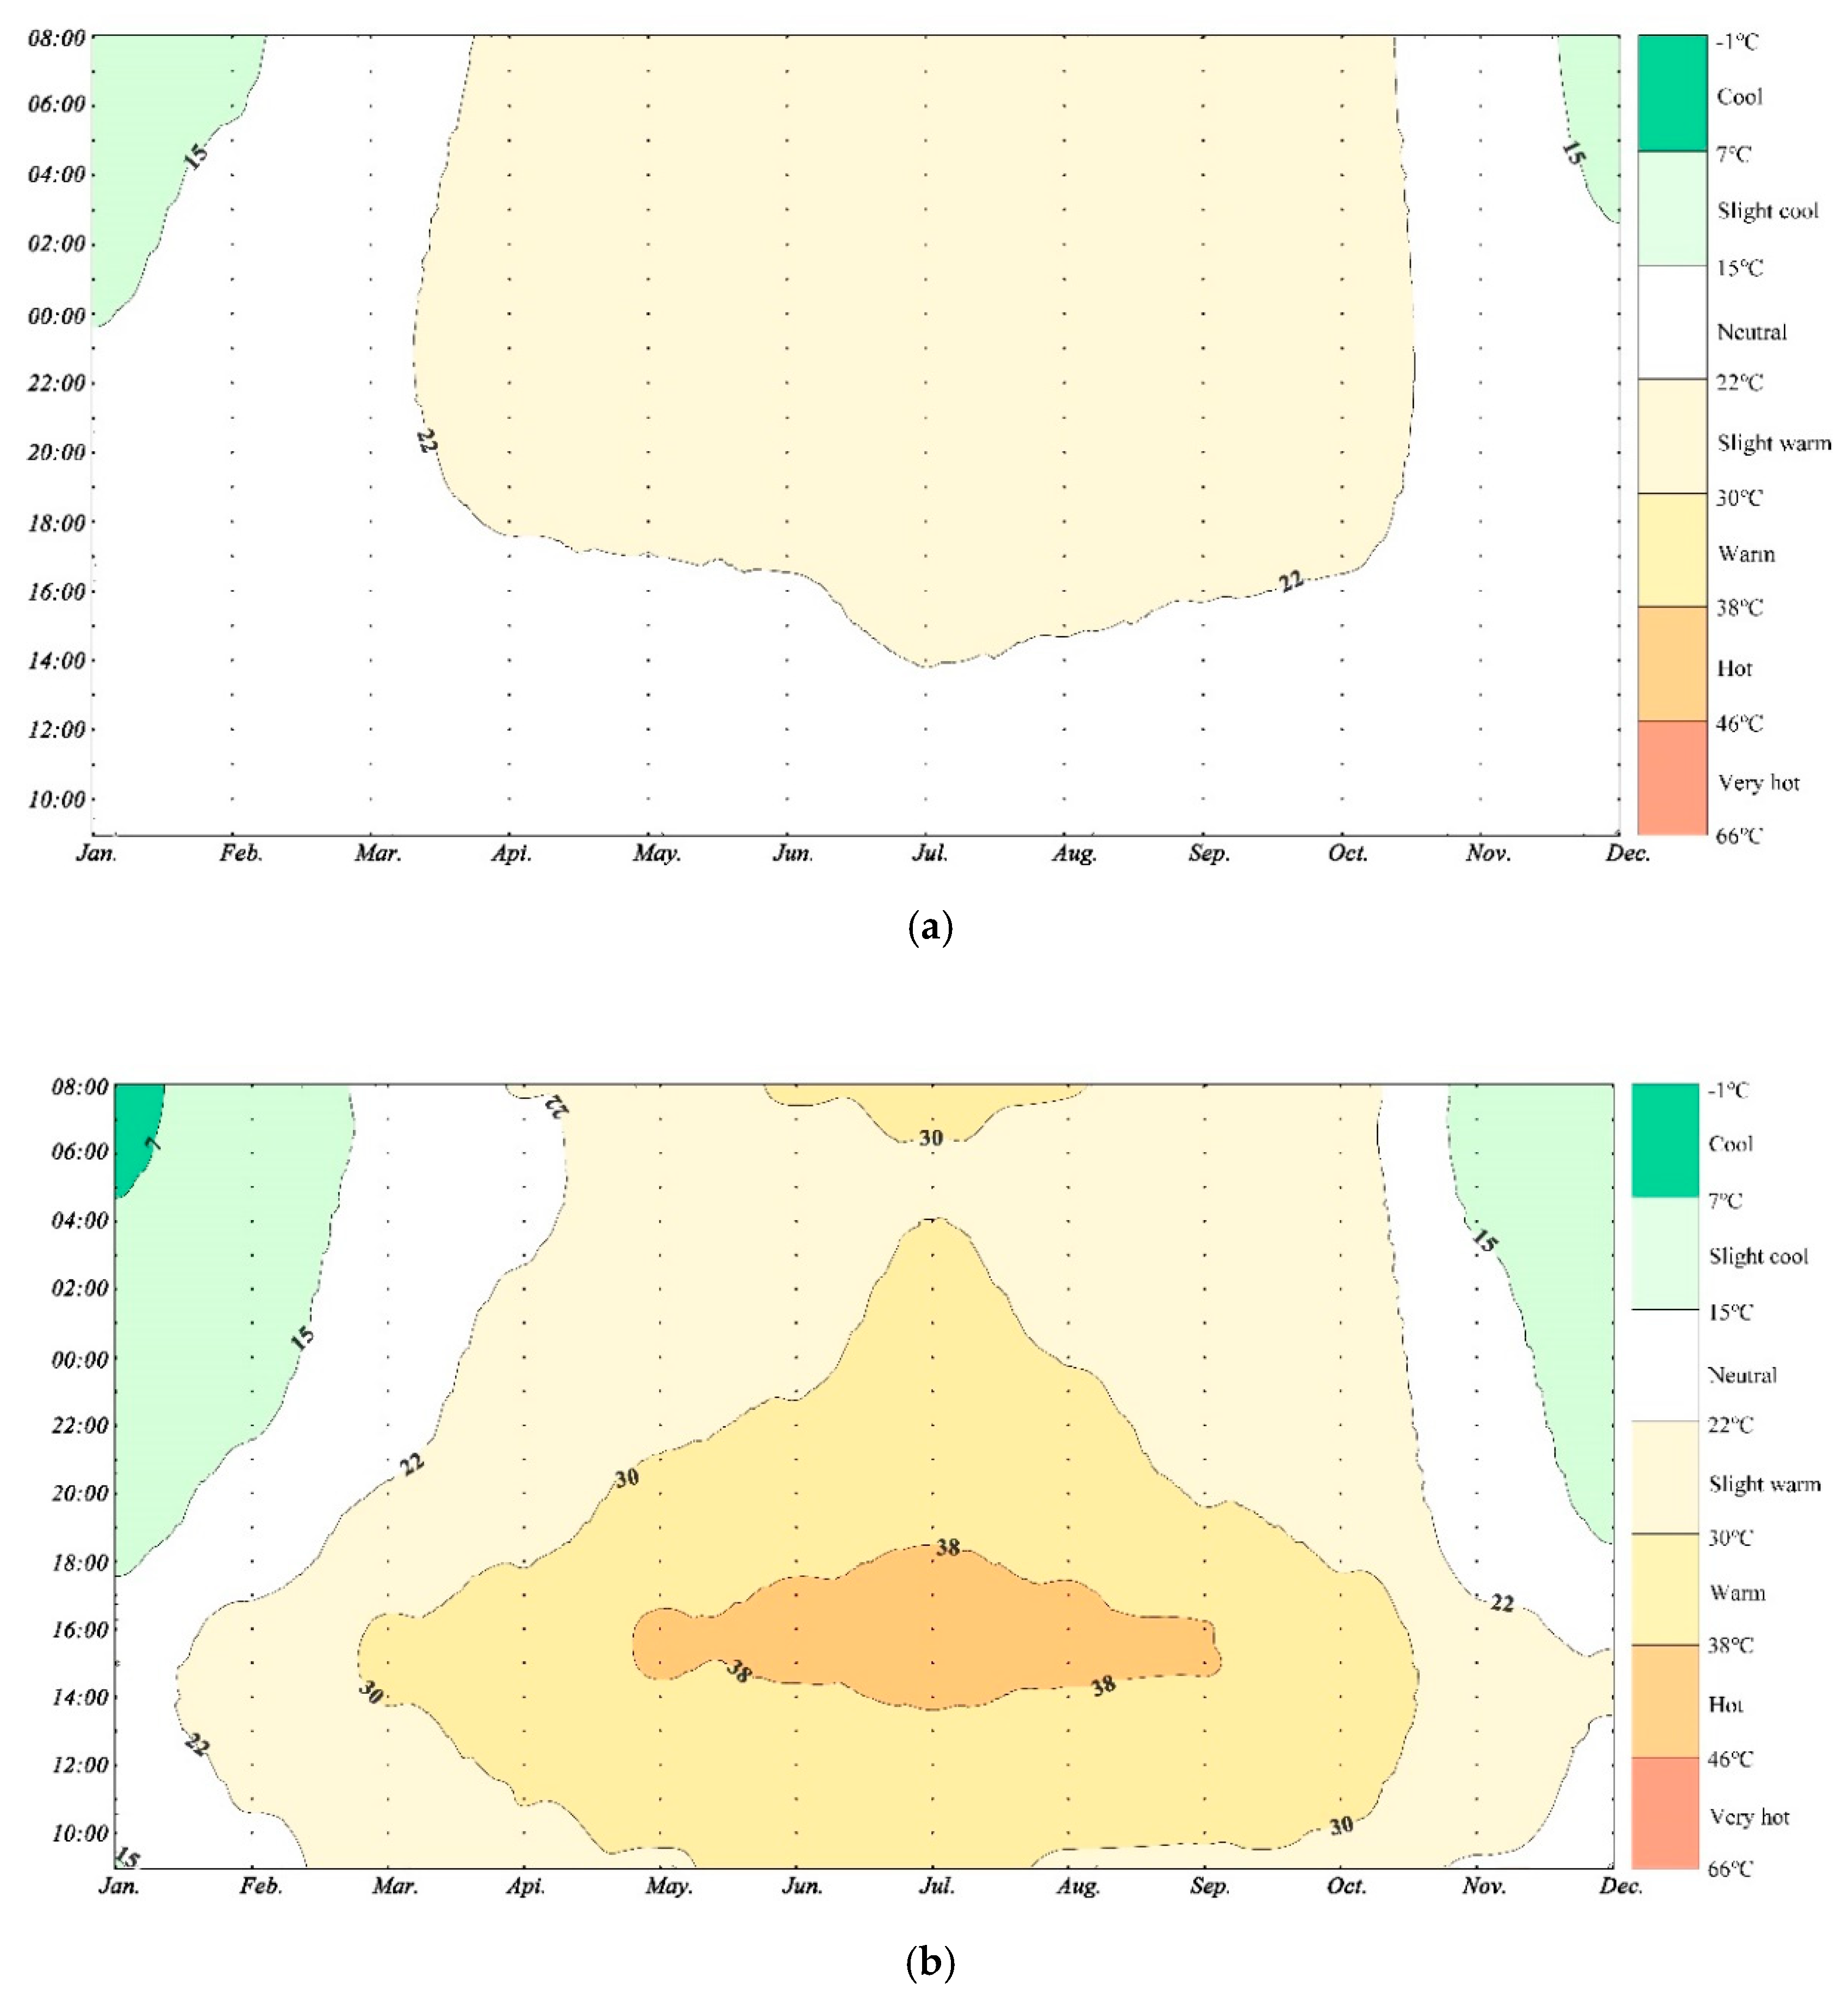
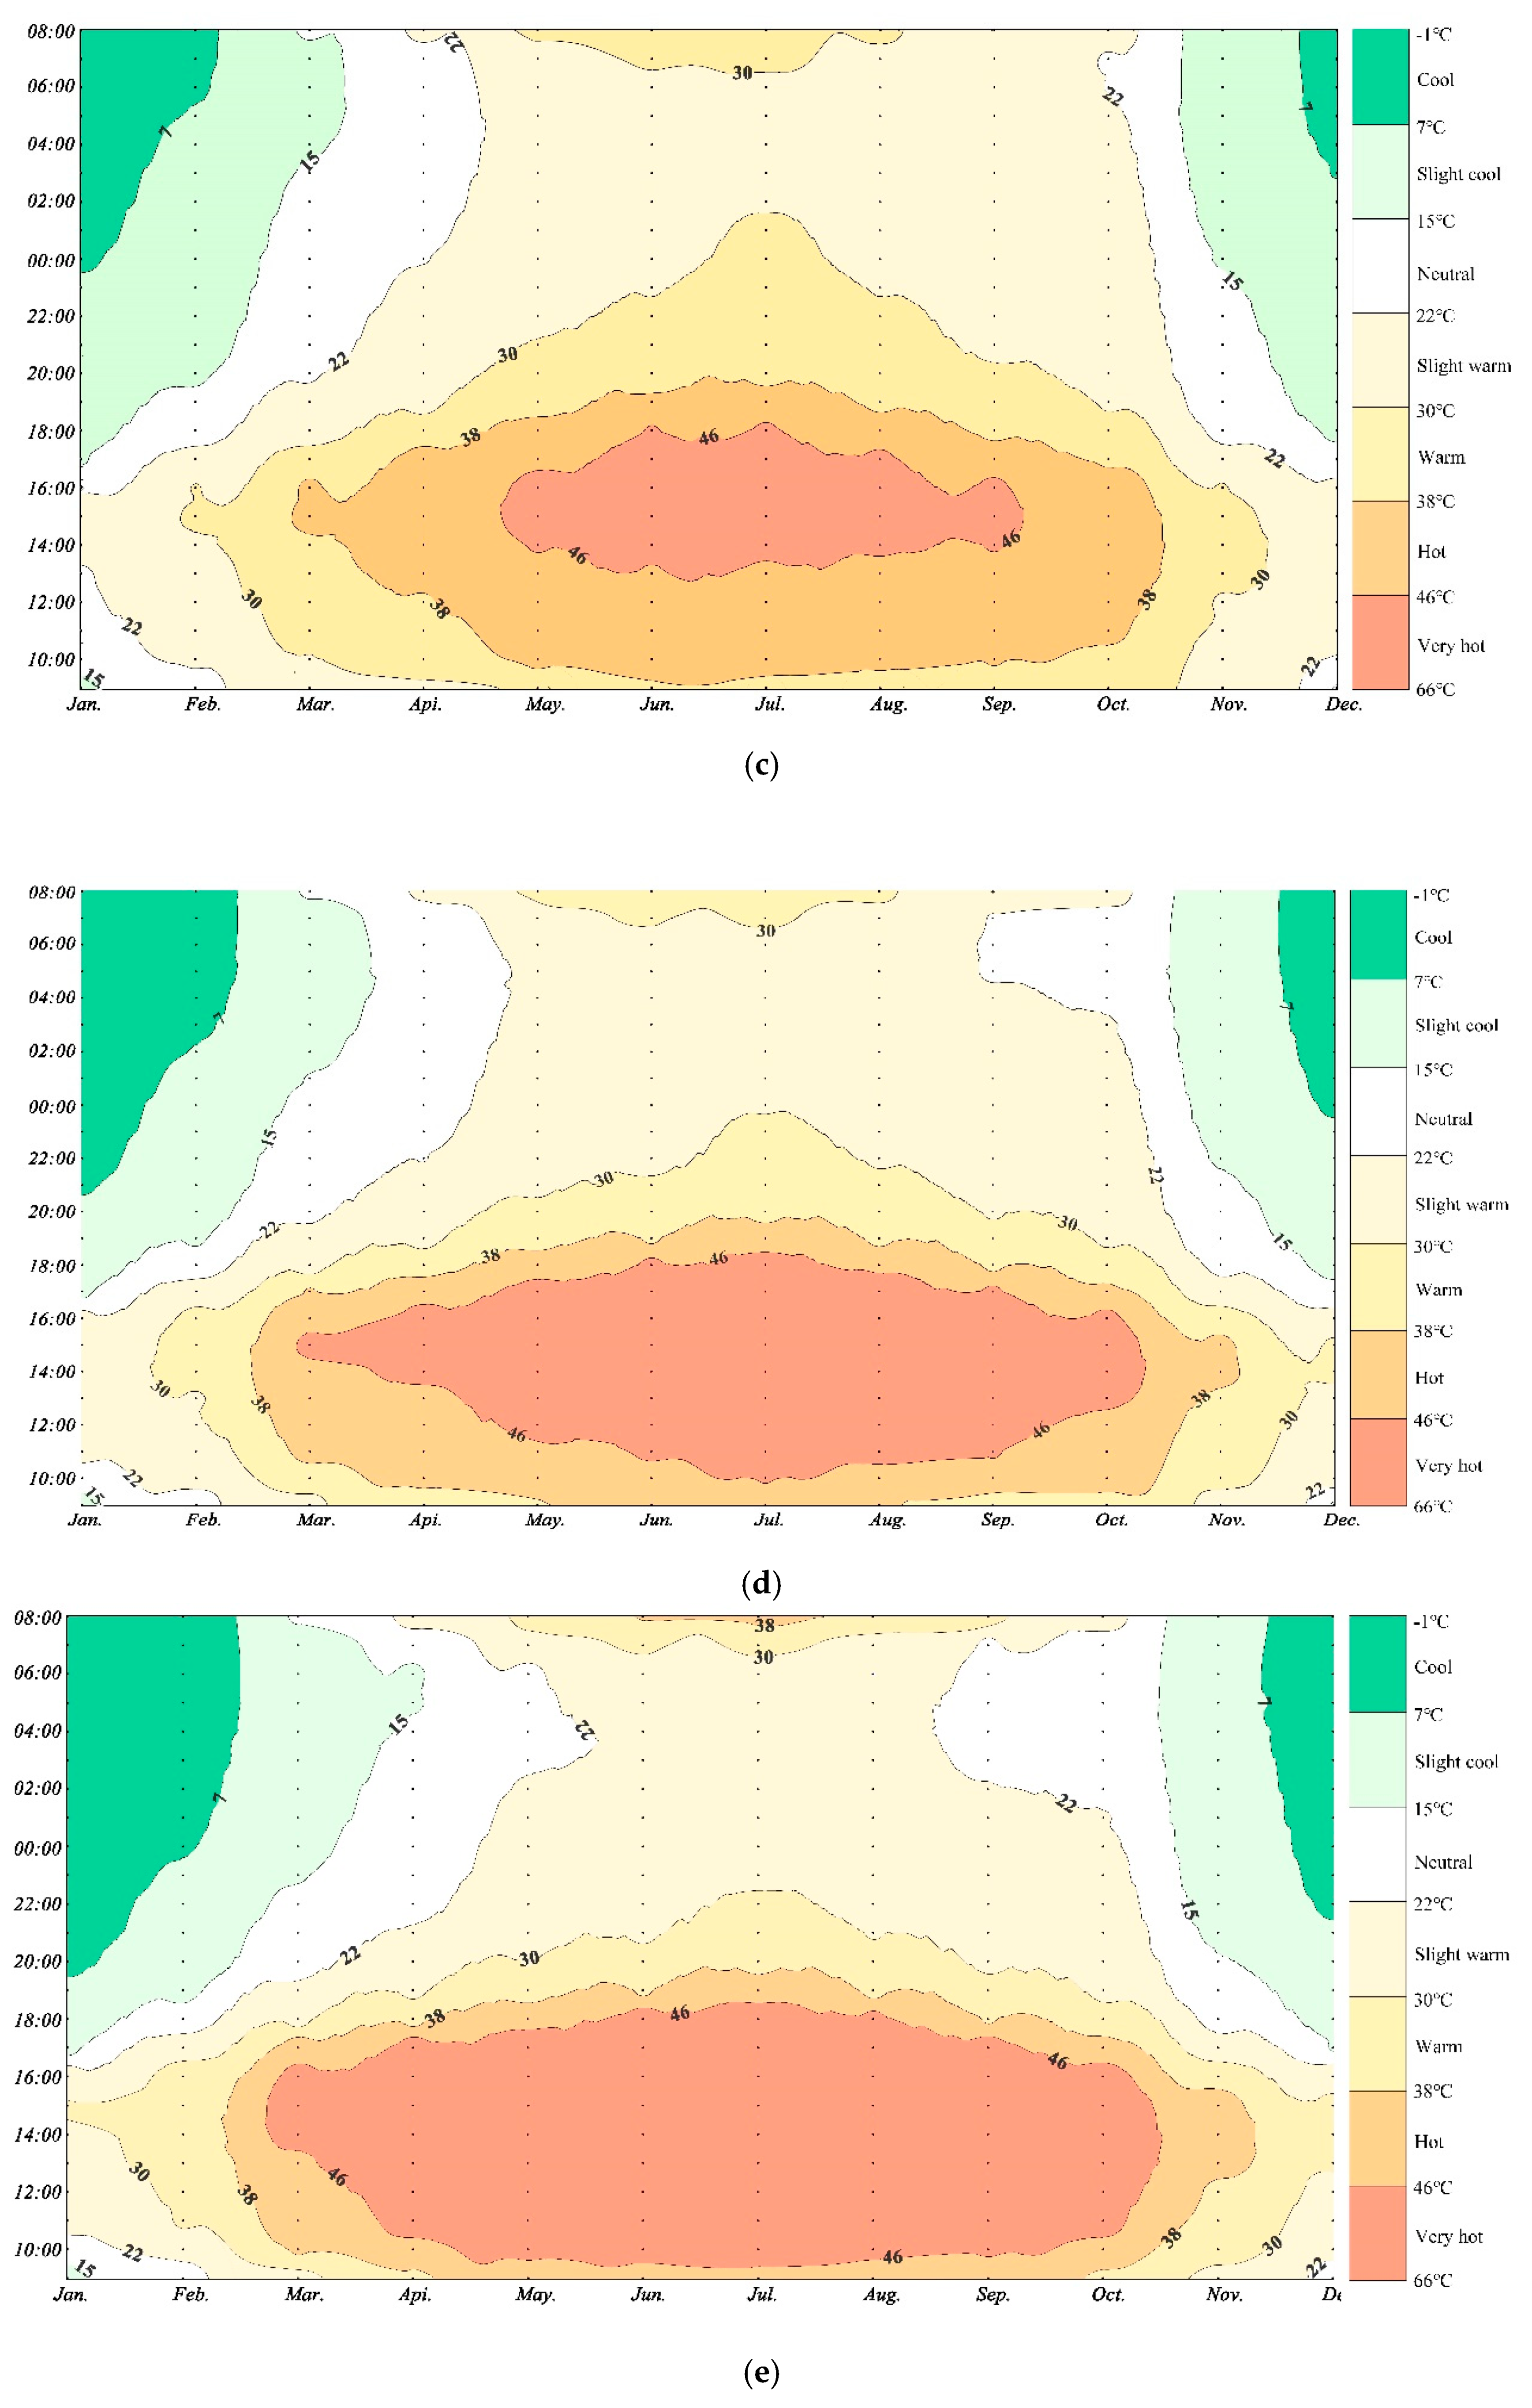
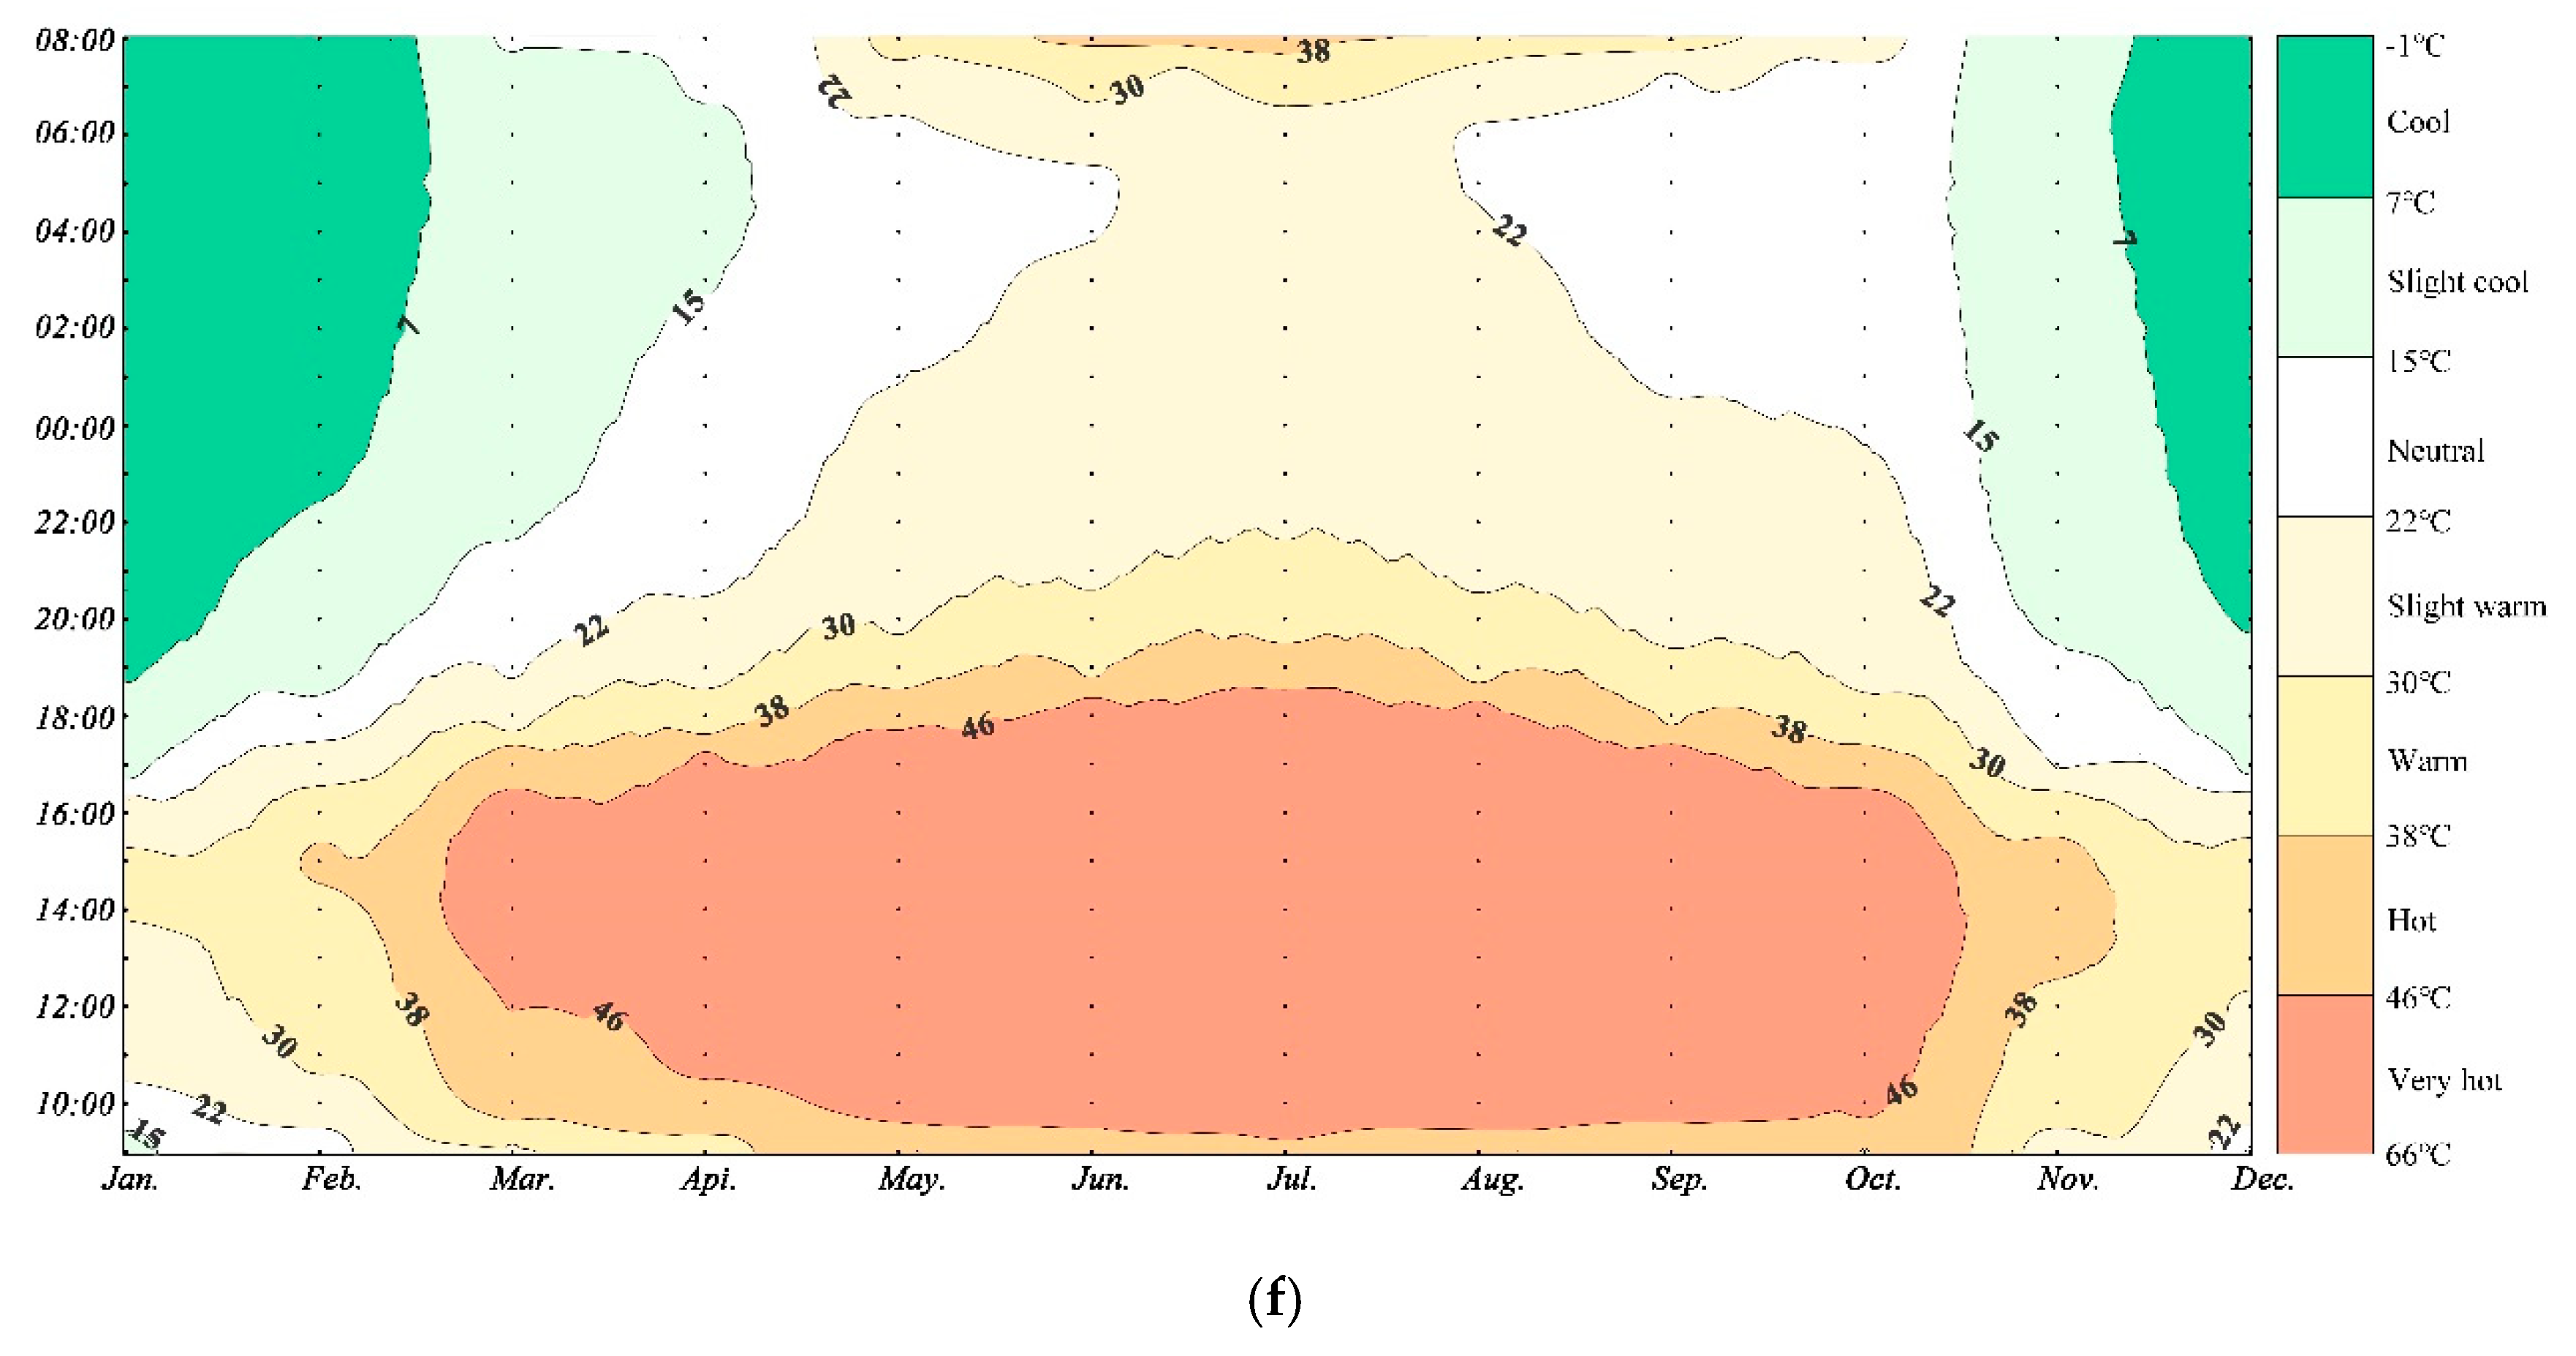
Figure 4 shows the thermal perception, where the x coordinate means the 12 months, the y coordinate represents the daily time, and z-value represents the average indoor temperature at the hour, which was calculated from the average temperature at this time on all days of the month. For example, the general indoor air temperature of 9:00 a.m. in March was derived from the average meteorological data recorded at 9:00 a.m. of the 31days in March. Based on this calculation principle, 1728 (24 × 12 × 6) cases of indoor air temperature was calculated. Adopting the temperature perception criterion of Changsha, the indoor thermal isotherms of the six cases of WWRs were drawn with the Kriging algorithm of the SURFER software, presented as a, b, c, d, e, and f subgraphs in Figure 4.
For the 0.00% case, the high air temperature occurred at around 22:00 according to the characteristics of daily distribution, while for the other cases with windows, the maximum temperature occurred at roughly 15:00. On the contrary, the general minimum temperature all happened at about 6:00.
From the view of temperature perception, the 0.00% WWR case comprised three temperature perceptions (slightly warm, neutral, and slightly cool) followed by that of 20.00% WWR case with six temperature perceptions composed of hot, warm, slightly warm, neutral, slightly cool, and cool. Meanwhile, the other four cases all contained seven temperature perceptions (very hot, hot, warm, slightly warm, neutral, slightly cool, and cool). Thus, decided by the climate and building material features of Chenzhou, the problem occurred in the indoor thermal environment of the non-Hvac building in Chenzhou lies in extreme heat, rather than extreme cold, since the indoor thermal perceptions of “very cold” and “cold” did not happen. Furthermore, the percentage of “very hot” and “hot” perceptual duration expanded with the rise of the WWR. Therefore, the lower the WWR was, the better the annual thermal perception of building interior would be.

3.3. The Total Improvement of Indoor Air Temperature Perception Caused by the WWR

To evaluate the annual improvement of indoor thermal environment caused by different WWRs, the time length and proportion of each perceptual temperature (PT) were statistically analyzed, with the proportion counted by area ratio, as shown in Table 4.
From the perspectives of time length and proportion, it indicates that the “hot” temperature perception originated in the ranges of 0.00% to 20.00% WWR and the “very hot” temperature perception happened between 20% and 40% WWR. Table 4 demonstrates that when the WWR was less than 40%, the time length of “very hot” and “hot” temperature perceptions can be prolonged by an average of 0.56 percent for each additional percentage of WWR. However, if that was between 40% and 80%, each additional percentage of WWR brought only a 0.29 percent extension of “very hot” and “hot” perceptions. Furthermore, once the WWRs exceeded 80%, the “very hot” temperature perception only had 0.71% room for change, as well as the “hot” temperature perception only had 1.07 percent left to vary. Generally, if the WWRs outnumbered 40%, their effects on the indoor thermal perception environment gradually decreased and were powerless once that exceeded 80%.

4. Conclusions

This research analyzed the impacts of WWRs on their improvement and distribution of indoor thermal environment. Meteorological data from the national weather station were employed and the ENVI-met model served as the analytical tool. The temperature perception criterion of Changsha investigated by Qihong Deng was employed as the evaluation criteria, and the thermal isotherms were generated for further interpretation of the variation of the indoor temperature perception according to the WWR. The research originates a new technical approach by integrating the existing meteorological data and the ENVI-met model to clarify the perceptible effects of WWRs on non-Hvac buildings in the study area. This methodology can be used for reference in other climate regions.
Decided by the local climatic conditions and the typical building material used in Chenzhou, indoor thermal discomfort in non-Hvac buildings in Chenzhou is more perceptible under extreme heat conditions, rather than extreme cold conditions. The WWR has four types of impact on indoor temperature perception. First, it changes the occurrence time of indoor peak temperature; second, the lower the WWR, the better the annual indoor thermal perception; third, the “hot” and “very hot” temperature perception originates in the ranges of 0.00% to 20.00% and 20% to 40% WWRs, respectively; fourth, the impact of the WWR on indoor thermal perception gradually decreases after the WWR surpasses 40% and has almost no effect once beyond 80%.
The evaluation of the annual effect of the WWR on indoor thermal perception as demonstrated above is of significance to the architectural design of non-Hvac buildings in Chenzhou city. And the method introduced in this research can be used for reference to identify the critical WWR values in cities of other climatic zones. However, there are still some issues worthy of further study, including the combination performance of the WWR and building orientation, the coupling effect of outdoor vegetation layout, and others.

Author Contributions

Conceptualization, J.L.; methodology, J.L. and B.Z.; software, X.C. and K.B.B.; validation, B.Z. and Y.Z.; formal analysis, J.L. and X.C.; investigation, J.R.; resources, B.Z.; data curation, B.Z.; writing—original draft preparation, J.L.; writing—review and editing, K.B.B.; visualization, Y.Z.; supervision, J.L.; project administration, B.Z.; funding acquisition, B.Z. and J.L. All authors have read and agreed to the published version of the manuscript.

Funding

This research was funded by the National Natural Science Foundation of China, grant number 51478470; Hunan Provincial Innovation Foundation for Postgraduate, grant number CX20200375; the Fundamental Research Funds for the Central University of Central South University, grant number 1053320191968. The APC was funded by the Hunan Provincial Innovation Foundation for Postgraduate.

Acknowledgments

Thanks are given to Chen Yipu and Luo Chen for their work in the meteorological data collection.

Conflicts of Interest

The authors declare no conflict of interest.

References

  1. Bilgen, S. Structure and environmental impact of global energy consumption. Renew. Sustain. Energy Rev. 2014, 38, 890–902. [Google Scholar] [CrossRef]
  2. Fan, J.-L.; Yu, H.; Wei, Y.-M. Residential energy-related carbon emissions in urban and rural China during 1996–2012: From the perspective of five end-use activities. Energy Build. 2015, 96, 201–209. [Google Scholar] [CrossRef]
  3. Shafaghat, A.; Keyvanfar, A.; Manteghi, G.; Lamit, H.B. Environmental-conscious factors affecting street microclimate and individuals’ respiratory health in tropical coastal cities. Sustain. Cities Soc. 2016, 21, 35–50. [Google Scholar] [CrossRef]
  4. Mauree, D.; Coccolo, S.; Perera, A.T.D.; Nik, V.; Scartezzini, J.-L.; Naboni, E. A new framework to evaluate urban design using urban microclimatic modeling in future climatic conditions. Sustainability 2018, 10, 1134. [Google Scholar] [CrossRef] [Green Version]
  5. Liu, Z.; Wu, D.; Li, J.; Yu, H.; He, B. Optimizing building envelope dimensions for passive solar houses in the Qinghai-Tibetan region: Window to wall ratio and depth of sunspace. J. Therm. Sci. 2019, 28, 1115–1128. [Google Scholar] [CrossRef]
  6. Zhai, Y.; Wang, Y.; Huang, Y.; Meng, X. A multi-objective optimization methodology for window design considering energy consumption, thermal environment and visual performance. Renew. Energy 2019, 134, 1190–1199. [Google Scholar] [CrossRef]
  7. Costanzo, V.; Evola, G.; Marletta, L. Thermal and visual performance of real and theoretical thermochromic glazing solutions for office buildings. Sol. Energy Mater. Sol. Cells 2016, 149, 110–120. [Google Scholar] [CrossRef]
  8. Raji, B.; Tenpierik, M.J.; Dobbelsteen, A.V.d. Early-stage design considerations for the energy-efficiency of high-rise office buildings. Sustainability 2017, 9, 623. [Google Scholar] [CrossRef] [Green Version]
  9. Acosta, I.; Campano, M.Á.; Molina, J.F. Window design in architecture: Analysis of energy savings for lighting and visual comfort in residential spaces. Appl. Energy 2016, 168, 493–506. [Google Scholar] [CrossRef]
  10. Kheiri, F. A review on optimization methods applied in energy-efficient building geometry and envelope design. Renew. Sustain. Energy Rev. 2018, 92, 897–920. [Google Scholar] [CrossRef]
  11. Inanici, M.N.; Demirbilek, F.N. Thermal performance optimization of building aspect ratio and south window size in five cities having different climatic characteristics of Turkey. Build. Environ. 2000, 35, 41–52. [Google Scholar] [CrossRef]
  12. Amaral, A.R.; Rodrigues, E.; Gaspar, A.R.; Gomes, Á. A thermal performance parametric study of window type, orientation, size and shadowing effect. Sustain. Cities Soc. 2016, 26, 456–465. [Google Scholar] [CrossRef] [Green Version]
  13. Ma, P.; Wang, L.-S.; Guo, N. Maximum window-to-wall ratio of a thermally autonomous building as a function of envelope U-value and ambient temperature amplitude. Appl. Energy 2015, 146, 84–91. [Google Scholar] [CrossRef]
  14. Shaeri, J.; Habibi, A.; Yaghoubi, M.; Chokhachian, A. The optimum window-to-wall ratio in office buildings for hot‒humid, hot‒dry, and cold climates in Iran. Environments 2019, 6, 45. [Google Scholar] [CrossRef] [Green Version]
  15. Yaghoobian, N.; Kleissl, J. An indoor-outdoor building energy simulator to study urban modification effects on building energy use—Model description and validation. Energy Build. 2012, 54, 407–417. [Google Scholar] [CrossRef]
  16. Tombazis, A.; Preuss, S. Design of passive solar buildings in urban areas. Sol. Energy 2001, 70, 311–318. [Google Scholar] [CrossRef]
  17. Freitas, S.; Catita, C.; Redweik, P.; Brito, M.C. Modelling solar potential in the urban environment: State-of-the-art review. Renew. Sustain. Energy Rev. 2015, 41, 915–931. [Google Scholar] [CrossRef]
  18. Gijón-Rivera, M.; Xamán, J.; Álvarez, G.; Serrano-Arellano, J. Coupling CFD-BES Simulation of a glazed office with different types of windows in Mexico City. Build. Environ. 2013, 68, 22–34. [Google Scholar] [CrossRef]
  19. Marino, C.; Nucara, A.; Pietrafesa, M. Does window-to-wall ratio have a significant effect on the energy consumption of buildings? A parametric analysis in Italian climate conditions. J. Build. Eng. 2017, 13, 169–183. [Google Scholar] [CrossRef]
  20. Fayaz, R.; Kari, B.M. Comparison of energy conservation building codes of Iran, Turkey, Germany, China, ISO 9164 and EN 832. Appl. Energy 2009, 86, 1949–1955. [Google Scholar] [CrossRef]
  21. Tsoka, S.; Tsikaloudaki, A.; Theodosiou, T. Analyzing the ENVI-met microclimate model’s performance and assessing cool materials and urban vegetation applications—A review. Sustain. Cities Soc. 2018, 43, 55–76. [Google Scholar] [CrossRef]
  22. Dell’Accio, F.; Di Tommaso, F. On the hexagonal Shepard method. Appl. Numer. Math. 2020, 150, 51–64. [Google Scholar] [CrossRef]
  23. Ji, W.; Cao, B.; Geng, Y.; Zhu, Y.; Lin, B. Study on human skin temperature and thermal evaluation in step change conditions: From non-neutrality to neutrality. Energy Build. 2017, 156, 29–39. [Google Scholar] [CrossRef]
  24. Potchter, O.; Cohen, P.; Lin, T.-P.; Matzarakis, A. Outdoor human thermal perception in various climates: A comprehensive review of approaches, methods and quantification. Sci. Total Environ. 2018, 631, 390–406. [Google Scholar] [CrossRef] [PubMed]
  25. Liu, W.; Zhang, Y.; Deng, Q. The effects of urban microclimate on outdoor thermal sensation and neutral temperature in hot-summer and cold-winter climate. Energy Build. 2016, 128, 190–197. [Google Scholar] [CrossRef]
  26. Cui, Y.; Yan, D.; Chen, C.-F. Exploring the factors and motivations influencing heating behavioral patterns and future energy use intentions in the hot summer and cold winter climate zone of China. Energy Build. 2017, 153, 99–110. [Google Scholar] [CrossRef]
  27. Guo, S.; Yan, D.; Peng, C.; Cui, Y.; Zhou, X.; Hu, S. Investigation and analyses of residential heating in the HSCW climate zone of China: Status quo and key features. Build. Environ. 2015, 94, 532–542. [Google Scholar] [CrossRef]
  28. Morakinyo, T.E.; Lam, Y.F. Simulation study on the impact of tree-configuration, planting pattern and wind condition on street-canyon’s micro-climate and thermal comfort. Build. Environ. 2016, 103, 262–275. [Google Scholar] [CrossRef]
  29. Li, J.; Zheng, B.; Shen, W.; Xiang, Y.; Chen, X.; Qi, Z. Cooling and Energy-Saving Performance of Different Green Wall Design: A Simulation Study of a Block. Energies 2019, 12, 2912. [Google Scholar] [CrossRef] [Green Version]
  30. Szucs, Á.; Gál, T.; Andrade, H. Comparison of measured and simulated mean radiant temperature. Case study in Lisbon (Portugal). Finisterra Rev. Port. Geogr. 2014, 98, 95–111. [Google Scholar] [CrossRef] [Green Version]
  31. Lee, H.; Mayer, H.; Chen, L. Contribution of trees and grasslands to the mitigation of human heat stress in a residential district of Freiburg, Southwest Germany. Landsc. Urban Plan. 2016, 148, 37–50. [Google Scholar] [CrossRef]
  32. Bruse, M.; Fleer, H. Simulating surface-plant-air interactions inside urban environments with a three dimensional numerical model. Environ. Model. Softw. 1998, 13, 373–384. [Google Scholar] [CrossRef]
  33. Zhong, W.; Cao, J.; Xue, J.; Ouyang, J. A 15,400-year record of climate variation from a subalpine lacustrine sedimentary sequence in the western Nanling Mountains in South China. Quat. Res. 2015, 84, 246–254. [Google Scholar] [CrossRef]
  34. Bitsa, E.; Flocas, H.; Kouroutzoglou, J.; Hatzaki, M.; Rudeva, I.; Simmonds, I. Development of a Front Identification Scheme for Compiling a Cold Front Climatology of the Mediterranean. Climate 2019, 7, 130. [Google Scholar] [CrossRef] [Green Version]
  35. Xu, X.; Xu, X.; Guan, P.; Ren, Y.; Wang, W.; Xu, N. The cause and evolution of urban street vitality under the time dimension: Nine cases of streets in Nanjing City, China. Sustainability 2018, 10, 2797. [Google Scholar] [CrossRef] [Green Version]
  36. Li, J.; Heap, A.D. A review of comparative studies of spatial interpolation methods in environmental sciences: Performance and impact factors. Ecol. Inform. 2011, 6, 228–241. [Google Scholar] [CrossRef]
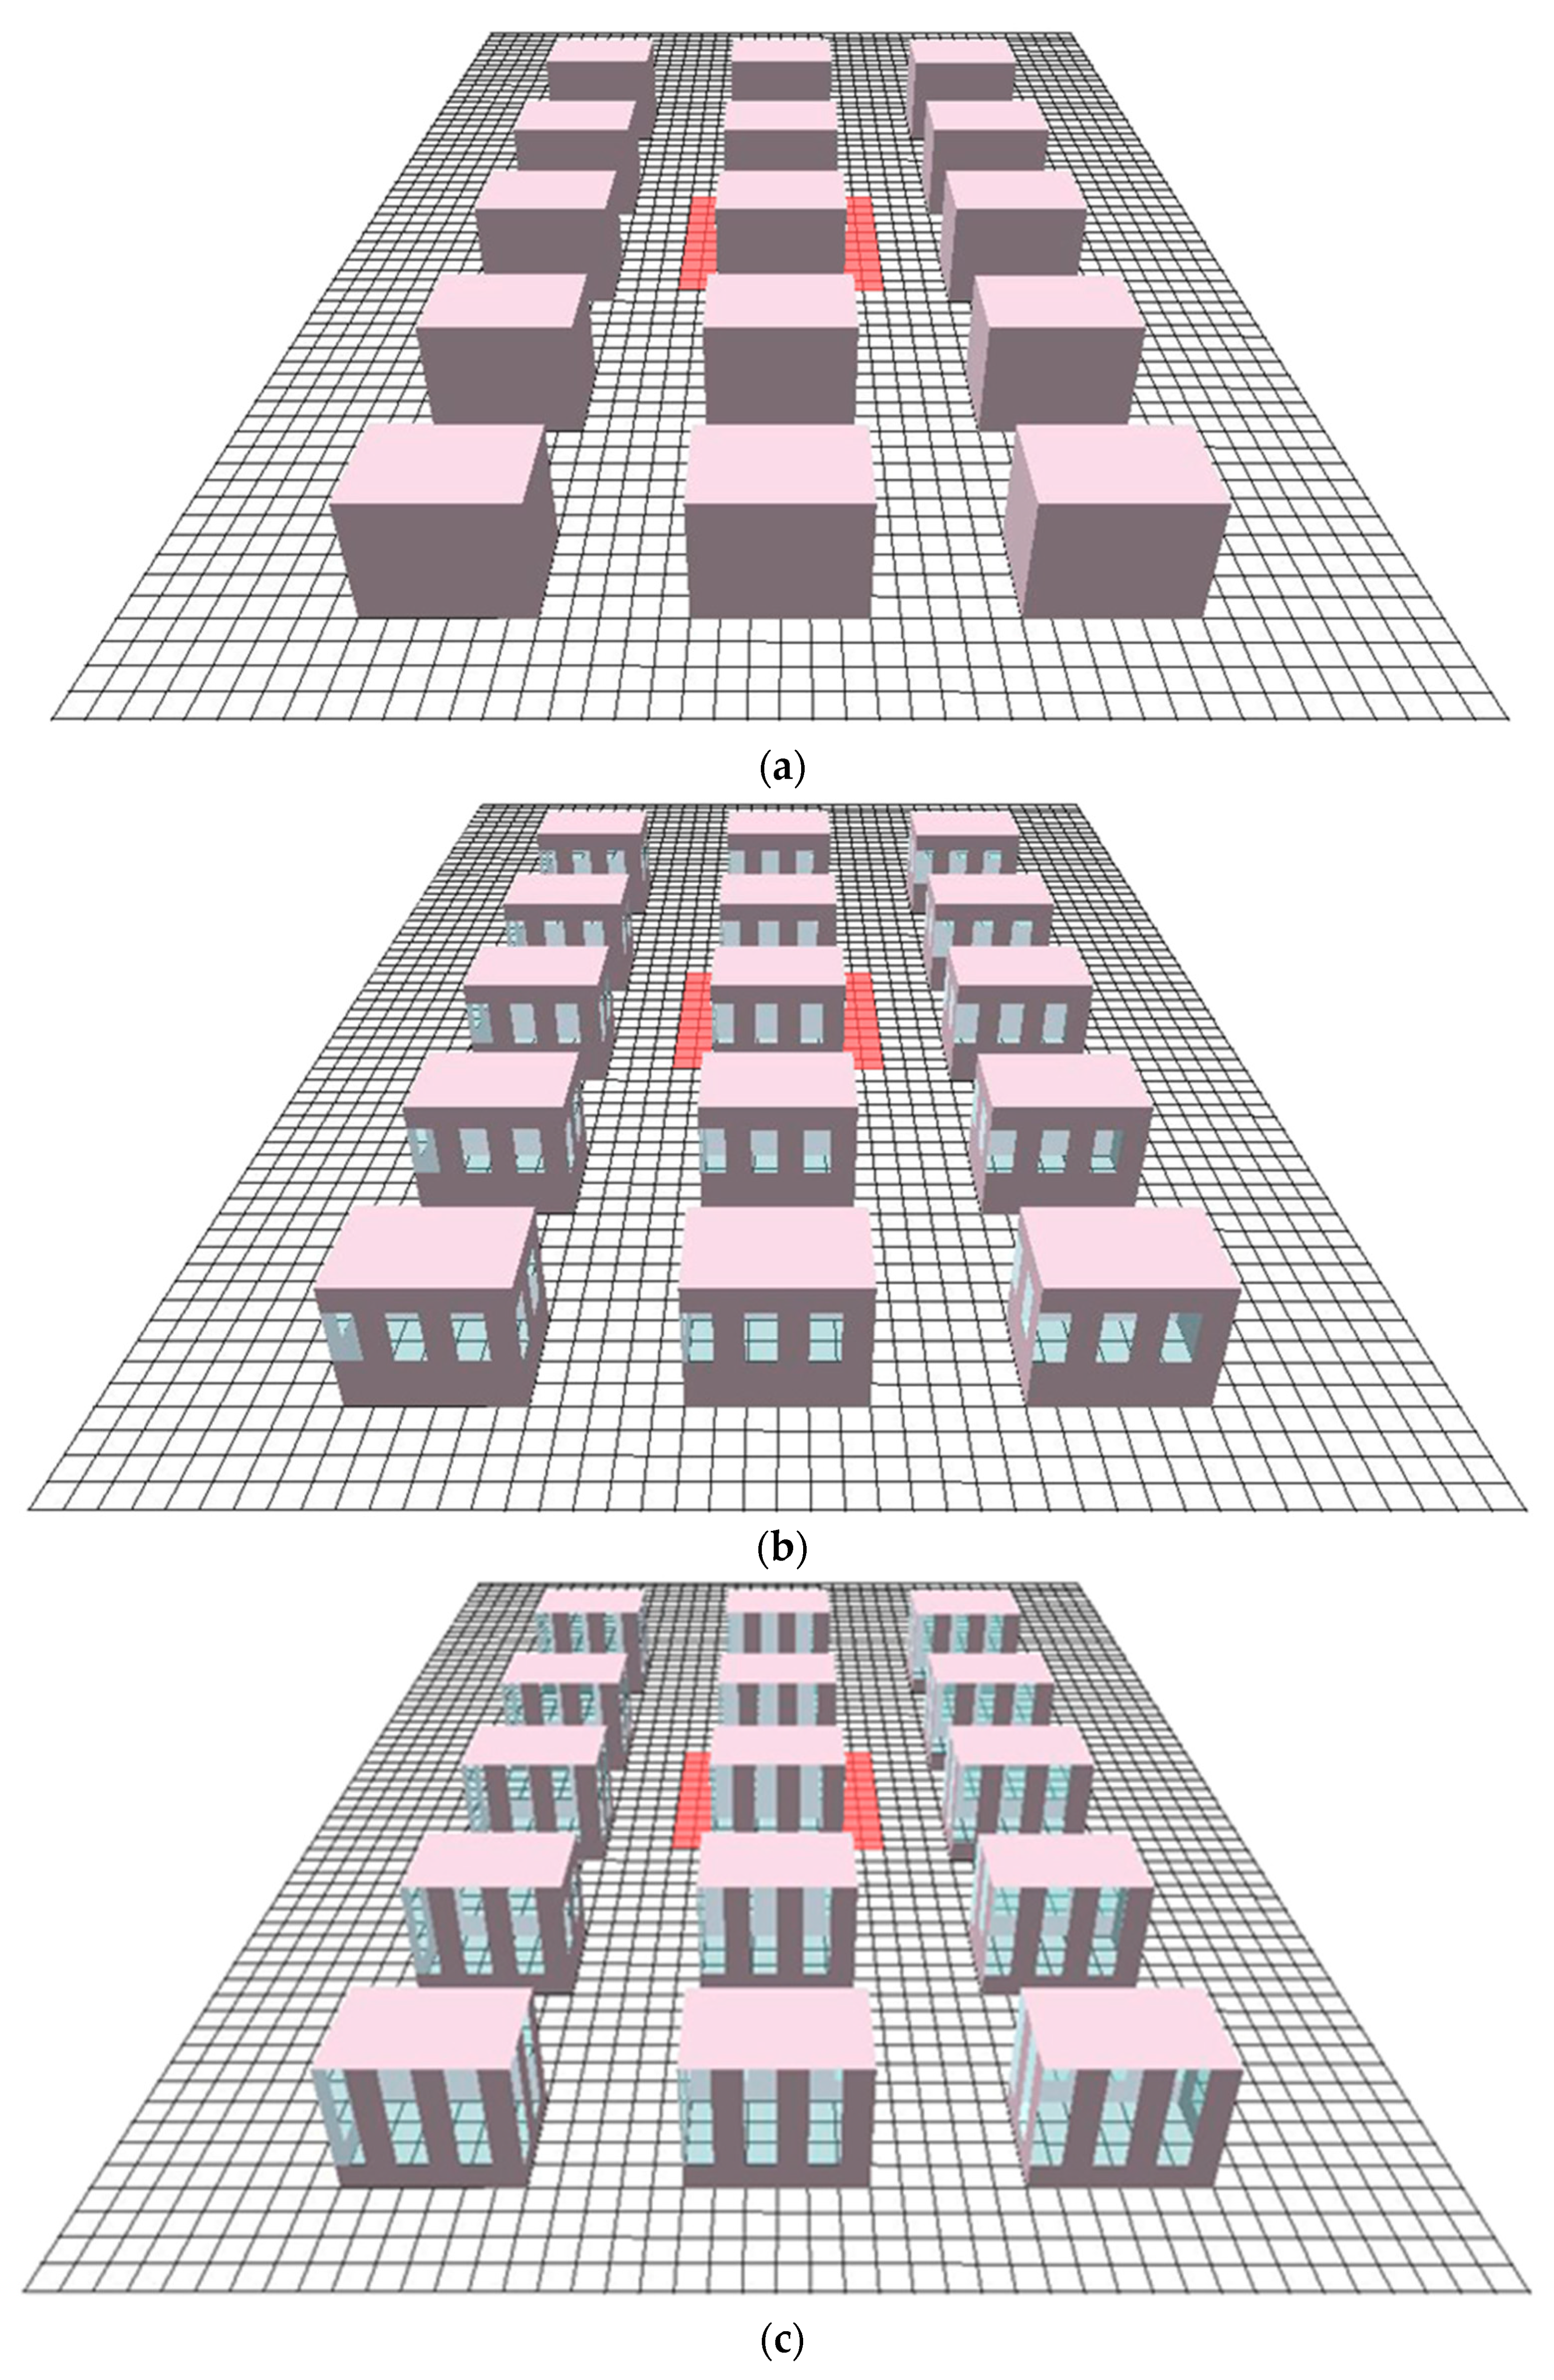
Figure 1. The models of residential community. WWR: window-to-wall ratio. (a) 0.00% WWR.; (b) 20.00% WWR.; (c) 40.00% WWR.; (d) 60.00% WWR.; (e) 80.00% WWR.; (f) 100.00% WWR.
Sustainability 12 06637 g001aSustainability 12 06637 g001b
Figure 2. The total month characteristics of the Chenzhou air temperature.
Sustainability 12 06637 g002
Figure 3. The mean monthly effects of indoor air temperature by WWR.
Sustainability 12 06637 g003
Figure 4. The annual distribution of indoor thermal environment caused by WWRs. (a) The annual indoor thermal distribution of 0.00% WWR.; (b) The annual indoor thermal distribution of 20.00% WWR.; (c) The annual indoor thermal distribution of 40.00% WWR.; (d) The annual indoor thermal distribution of 60.00% WWR.; (e) The annual indoor thermal distribution of 80.00% WWR.; (f) The annual indoor thermal distribution of 100.00% WWR.
Sustainability 12 06637 g004aSustainability 12 06637 g004bSustainability 12 06637 g004c
Table 1. The thermal perception standard of this research.
Thermal PerceptionTemperature Range
Very cold<−8 °C
Cold−8–1 °C
Slightly cool−1–7 °C
Cool7–15 °C
Neutral15–22 °C
Slightly warm22–30 °C
Warm30–38 °C
Hot38–46 °C
Very hot>46 °C
Table 2. The attributes of concrete hollow brick and plexiglass.
ParameterValue (Concrete Hollow Brick)Value (Plexiglass)
Thickness (m)0.300.05
Absorption (Frac)0.700.90
Transmission (Frac)0.000.05
Reflection (Frac)0.300.90
Emissivity (Frac)0.901500.00
Specific Heat840.000.19
Thermal conductivity (w/m2·k)0.860000.19000
Thermal Conductivity0.861180.00
Density (kg/m3)930.001180.00
Table 3. The meteorological setting of the research.
MonthInitial Meteorological ParametersValueMonthInitial Meteorological ParametersValue
Januarywind velocity (10 m off the ground)1.5 m/sJulywind velocity (10 m off the ground)4.4 m/s
wind angle wind angle 135°
relative humidity 79%relative humidity 67%
min air temperature 3 °Cmin air temperature 25 °C
max air temperature 9 °Cmax air temperature 34 °C
Februarywind velocity (10 m off the ground)1.5 m/sAgustwind velocity (10 m off the ground)3.3 m/s
wind angle wind angle 135°
relative humidity 78%relative humidity 72%
min air temperature 5 °Cmin air temperature 24 °C
max air temperature 12 °Cmax air temperature 32 °C
Marchwind speed (10 m off the ground)2.5 m/sSeptemberwind speed (10 m off the ground)1.5 m/s
wind angle 75°wind angle 45°
relative humidity 78%relative humidity 75%
min air temperature 11 °Cmin air temperature 22 °C
max air temperature 20 °Cmax air temperature 29 °C
Aprilwind velocity (10 m above the ground)4.4 m/sOctoberwind velocity (10 m above the ground)3.3 m/s
wind angle 125°wind angle 15°
relative humidity 75%relative humidity 74%
min air temperature 16 °Cmin air temperature 14 °C
max air temperature 24 °Cmax air temperature 22 °C
Maywind velocity (10 m off the ground)5 m/sNovemberwind velocity (10 m off the ground)3.3 m/s
wind angle 150°wind angle
relative humidity 76%relative humidity 80%
min air temperature 22 °Cmin air temperature 11 °C
max air temperature 29 °Cmax air temperature 18 °C
Junewind velocity (10 m off the ground)4.4 m/sDecemberwind velocity (10 m off the ground)1.6 m/s
wind angle 90°wind angle
relative humidity 76%relative humidity 76%
min air temperature 23 °Cmin air temperature 5 °C
max air temperature 29 °Cmax air temperature 9 °C
Table 4. Time length and proportion of each PT caused by the WWRs.
WWR PT 0.00%20.00%40.00%60.00%80.00%100.00%
Very hothour0.000.00561.691391.521901.811973.80
%0.000.006.4115.8821.8222.53
Hothour0.00430.361433.271094.83763.99721.39
%0.004.9116.3612.509.318.24
Warmhour0.002577.801578.071152.831022.05959.83
%0.0029.4318.0113.1611.7010.96
Slighthour3842.373314.502789.062522.852194.801894.65
%43.8637.8431.8428.8024.9921.63
Neutralhour4645.261471.291098.551094.881190.461361.94
%53.0316.8012.5412.5014.9915.55
Slighthour272.37933.571038.541025.681044.551083.66
%3.1110.6611.8611.7111.7212.37
Coolhour0.0032.48260.82477.40644.99764.73
%0.000.372.985.455.478.73