Exploring the Initial Impact of COVID-19 Sentiment on US Stock Market Using Big Data


School of Business, Sejong University, Seoul 05006, Korea
Sustainability 2020, 12(16), 6648; https://doi.org/10.3390/su12166648
Submission received: 3 July 2020
/
Revised: 12 August 2020
/
Accepted: 14 August 2020
/
Published: 17 August 2020
(This article belongs to the Special Issue Sustainability with Robo-Advisor and Artificial Intelligence in Finance)
Abstract
:This study explores the initial impact of COVID-19 sentiment on US stock market using big data. Using the Daily News Sentiment Index (DNSI) and Google Trends data on coronavirus-related searches, this study investigates the correlation between COVID-19 sentiment and 11 select sector indices of the Unites States (US) stock market over the period from 21st of January 2020 to 20th of May 2020. While extensive research on sentiment analysis for predicting stock market movement use tweeter data, not much has used DNSI or Google Trends data. In addition, this study examines whether changes in DNSI predict US industry returns differently by estimating the time series regression model with excess returns of industry as the dependent variable. The excess returns are obtained from the Fama-French three factor model. The results of this study offer a comprehensive view of the initial impact of COVID-19 sentiment on the US stock market by industry and furthermore suggests the strategic investment planning considering the time lag perspectives by visualizing changes in the correlation level by time lag differences.
1. Introduction
The COVID-19 pandemic is one of the most economically costly pandemics in recent history. The current COVID-19 pandemic appears to differ fundamentally from past epidemics such as SARS in 2003 and Ebola from 2014 to 2016. The coronavirus leads much faster global transmission due to closer international integration and possibility of transmission through carriers without symptoms. As the COVID-19 outbreak rapidly spreads around the world, many people are becoming more sensitive to the news and more often doing Google searches for coronavirus. News as well as Google searches for coronavirus play a key role in staying people informed about the current state of the crisis, influencing investors to make decisions in the stock market. As such, news and Google searches for coronavirus may have an impact on stock market sentiment and asset prices. It is expected that the COVID-19 pandemic will force new ways of asset management and drive preference for short-term agile investment decision unless it ends.
It is widely acknowledged that stock market investors need high-quality data to make informed decisions. Particularly, in times of market crisis, investors need technology to obtain timely and accurate data. Using the high-quality data, investors are able to do fast analysis and decision making in the asset management process and then react quickly to a volatile market condition. Any positive or negative sentiment of public related to stock market crisis can have a ripple effect on decision making by investors in stock markets. The combination of available information at stock markets and real-time big data from non-traditional sources like news sentiment data or Google Trends data could further enhance investors’ understanding of the heterogeneous impact of Covid-19 shock and their ability to develop adequate responses. The real-time big data could also help overcome limitations in official data, such as low-quality, limited coverage, or reporting lags that in some cases could be substantial.
To sustain a competitive advantage during market crisis periods, stock market investors require not only understanding the nature of market crisis such as timing, strength, and variability, but also a strategic investment decision that can realize positive returns or minimize the loss due to a shock. Once a shock has substantially affected stock markets, investors analyze data from the past few months to find out potential lessons from the market crisis and develop an indicator to respond faster and smarter to market volatility. Then investors can better protect their portfolios from market shocks when such a shock occurs again. A number of previous studies use sentiment analysis for predicting stock market movement using big data such as tweeter data or other social media data [1,2,3,4,5,6,7,8,9,10,11,12,13,14,15,16,17,18,19,20,21].
This research aims to explore the initial impact of COVID-19 sentiment on the US stock market by industry using big data. Although the outbreak of COVID-19 is impacting almost all industries and sectors worldwide, it is apparent that consumer spending in sectors like leisure and hospitality is falling dramatically due to shelter-in-place and other social distancing measures being imposed across the country. As such, it is expected that the degree of COVID-19 sentiment impact would vary by industry. Therefore, we investigate the correlation of COVID-19 sentiment with 11 select sector indices of the US stock market. The COVID-19 sentiment is measured by Daily News Sentiment Index (DNSI) and Google Trends big data on coronavirus-related searches. The DNSI is a high frequency measure of economic sentiment based on lexical analysis of economics-related news articles from 16 major US newspapers. Specifically, this study examines DNSI and Google searches for five terms related to coronavirus and economy in the US as well as worldwide over the period from 21st of January 2020 to 20th of May 2020. Five terms related to coronavirus and economy include “coronavirus”, “laid off”, “unemployment”, “recession”, and “vaccine”. Then this study examines the significance of relationship between COVID-19 sentiment and 11 select sector indices of the US stock market for offering a comprehensive view of the initial impact of COVID-19 sentiment on the US stock market by industry and furthermore suggests the strategic investment planning considering the time lag perspectives by visualizing changes in the correlation level by time lag differences. In addition, this study investigates whether changes in DNSI predict US industry returns differently by estimating the time series regression model with excess returns of industry as the dependent variable. The excess returns are obtained from Fama-French three factor model.
This study is at the forefront of research on relationship between COVID-19 sentiment and the US stock market. As the ongoing COVID-19 pandemic was confirmed to have reached the US in January 2020, there is little research on the impact of COVID-19 on the US stock market. While extensive research on sentiment analysis for predicting stock market movement use tweeter data, not much has used DNSI or Google Trends data. To our best knowledge, this study is the first to use DNSI or Google Trends data to explore the initial impact of COVID-19 sentiment on US stock market by industry.
2. Related Studies
Sentiment analysis has been widely used in many applications such as product recommendations, healthcare, politics, and in surveillance [22]. People’s sentiment that relates to feelings, attitudes, emotions, and opinions expressed in a large amount of social media data is found to play a key role in gauging the opinions of investors [13]. Tetlock [19] systematically explored the interaction between media content and stock market activity using daily content from The Wall Street Journal column from 1984 to 1999. They showed that news media content predicts movements in market prices and trading volume. Providing further support for Tetlock’s [19] evidence, Garcia [8] found that the predictability of stock returns using news’ content is concentrated in recessions. They used the fraction of positive and negative words in two columns of financial news from The New York Times as a proxy for public sentiment.
In addition to the studies using news media contents from popular newspapers, a number of studies have used social media data for sentiment analysis to predict stock market movement. The most well-known study in this area is by Bollen et al. [3]. Using Twitter data, they investigated whether the collective mood states of public are correlated to the Dow Jones Industrial Index. They used a fuzzy neural network for their prediction and showed significant correlation between public mood states in twitter and the Dow Jones Industrial Index. Followed by this study, Mittal and Goel [13] mainly used the profile of mood states (POMS) questionnaire to capture public mood and predicted the Dow Jones Industrial Average trend via fuzzy neural network. Their results showed a prediction accuracy rate of 87%. Zhang [18] examined correlation between stock price and significant keywords in tweets. They showed a strong negative correlation between mood states like hope, fear and worry in tweets with the Dow Jones Average Index. Lima et al. [12] improved on the accuracy of predicting stock trends using support vector machine (SVM) by considering an overall public sentiment attribute. They showed that a day on which the number of positive tweets exceeded the number of negative tweets is indicative of an overall positive public mood regarding the stock. Using tweeter data Pagolu et al. [15] also showed a strong correlation between public opinion and the Dow Jones Industrial Index. Kordonis et al. [10] employed simple metrics such as rate of change in opening and closing prices along with sentiment scores. They used an SVM model to predict stock market movement and found a significant effect of the changes in public sentiment on the market prices. Bharathi and Geetha [2] combined SENSEX points of the Indian stock market and really simple syndication (RSS) feeds for effective prediction of stock market. Their results showed that the sentiment analysis of RSS news feeds has an impact on stock market values. Pasupulety et al. [16] employed sentiment analysis to evaluate the effectiveness of considering the public opinion of a company. They used a trained Word2Vec model and classified company specific hash-tagged posts from Twitter as positive or negative. Their ensemble model is found to perform better than the constituent models and to depend highly on the nature and size of the training.
3. Data and Methodology
3.1. Data and Summary Statistics
This study uses 11 select sector indices provided by S&P Global over the period from 21st of January 2020 to 20th of May 2020 (The index data is available at https://us.spindices.com/index-finder/). The sample period coincides with increasing news coverage of the COVID-19 and Google searches for terms related to coronavirus. The big data used in this study includes the Daily News Sentiment Index (DNSI) and Google Trends data on coronavirus search. The DNSI is a high frequency measure of economic sentiment based on lexical analysis of economics-related news articles from 16 major US newspapers compiled by the news aggregator service LexisNexis. Refer to Buckman et al. [23] and Shapiro et al. [24] for detailed process of constructing the DNSI. The DNSI is developed in such a way that higher values of index indicate more positive sentiment. The DNSI is found to move downward with key historical events that have a significant impact on economic outcomes and financial markets, such as the start of the first Gulf War in August 1990, the Russian financial crisis in August 1999, the terrorist attacks of September 11, 2001, the Lehman Brothers bankruptcy in September 2008, and federal government shutdown in October 2013.
Using Google Trends big data, we first search terms that are related to the coronavirus and from those terms, we select five terms that are most relevant to the economy. We then obtain information on the relative frequency of Google searches for five terms related to coronavirus and economy in the US as well as worldwide: “coronavirus”, “laid off”, “unemployment”, “recession”, and “vaccine”. words in Google Trends. In this sense, these search terms capture peoples’ general interest in the coronavirus as well as its potential impact on the economy. Panel A of Table 1 shows the sample distribution of the 11 select sector indices including communication services, consumer discretionary, consumer staples, energy, financial, healthcare, industrial, information technology, materials, real estate, and utilities. The sample distribution of DNSI is shown in Panel B of Table 1. Table 1 also reports the sample statistic for four months prior to the sample period (time of NO COVID-19 from 21st of September 2019 to 20th of January 2020) to compare them with those in the sample period (time of COVID-19).
As expected, the descriptive statistics of sector indices in Table 1 reveal that mean value of the S&P 500 index as well as the most select sector indices except for health care and information technology have fallen as the coronavirus has begun spreading to the US. It is interesting to note that health care and information technology select sector indices have increased in the time of COVID-19. It is apparent that consumer spending in some sectors has been falling dramatically due to social distancing measures being imposed across the country. On the contrary, consumer spending in information technology has been more likely to increase for the same reason. In addition, the value of healthcare-related stocks has appeared to increase because the development of coronavirus vaccines and treatments has been urgently needed. All sector indices show a significant increase in volatility, which indicates that every sector in the US stock market has been subject to more variation due to the emergence of coronavirus. The descriptive statistics of DNSI in Panel B of Table 1 show a decrease in mean value and an increase in volatility with the emergence of coronavirus. This result implies that coronavirus has brought about a sharp decline in news sentiment. In this sense, the DNSI over the sample period indicates peoples′ coronavirus sentiment [23].
Figure 1 shows relative frequency of Google searches for five terms related to coronavirus and economy over the period from 21st of January 2020 to 20th of May 2020. The relative frequency of US and worldwide Google searches for five terms are found to have a sharp increase in March and similar distributions. The relative frequencies of Google searches for “coronavirus”, “laid off”, and “recession” have declined significantly in May while those for “unemployment” and “vaccine” have not decreased that much.
3.2. Methodology
This study conducts a one-sided t-test to examine the significance of the relationship between COVID-19 sentiment and US stock markets by industry. Buckman et al. [23] showed that news articles mentioning the coronavirus or COVID-19 began around 20st of January 2020 and then rapidly increased to reach an astounding 95% of economics-related news articles by late March. This figure clearly shows that the decline in DNSI through mid-March coincided with the increased coverage of COVID-19. As such the DNSI can be used to assess the COVID-19 sentiment like the Google searches for terms related to coronavirus and economy over the sample period.
The links between the COVID-19 sentiment and stock market aspect by industry are examined to identify how the effects of public mood on the coronavirus differ by industry. For this, we establish the following hypotheses for DNSI () and Google Trends data ().
When people come across positive (negative) economic news, investors are more (less) likely to invest in US stock market.
Or when the DNSI increases (decreases), the US stock market tends to increase (decreases).
When people search terms related to coronavirus more (less) frequently, investors are less (more) likely to invest in US stock market.
Or when the frequency of Google searches for coronavirus increases (decreases), the US stock market tends to decrease (increase).
Using the correlations between DNSI and 11 select sector indices (), the following null and alternative hypotheses are investigated to test the hypothesis .
On the contrary, using the correlations between Google Trends data and 11 select sector indices, the following null and alternative hypotheses are investigated to test the hypothesis .
This study repeats the test using values of big data with lag 0, lag 1, lag 2, and lag 3 to investigate if the effects of the COVID-19 sentiment occur with a time difference. This additional analysis addresses a distinct feature that can benefit a time-sensitive strategic investment decision.
We also examine whether changes in DNSI predicts US industry returns differently. For this, we estimate the time series regression model with excess returns of industry as the dependent variable, which is motivated by Garcia [8] and Bannigidadmath [25]. We generate the excess returns of industry using Fama-French three factor model (The Fama-French three factors are obtained from the online data library of Kenneth French, http://mba.tuck.dartmouth.edu/pages/faculty/ken.french/data_library.html.) [26] and control serial correlation and volatility of the returns by estimating the following model:
where is the excess returns for the 11 select sector indices and represents changes in DNSI. The coefficient specifies the effect of increase in on an increase in and is the error. A Newey-West [27] procedure with 12 lags is used to correct standard errors for autocorrelation and heteroskedasticity.
4. Empirical Results
4.1. Significance of DNSI on US Stock Market by Industry
Table 2 shows test results for DNSI and 11 select sector indices with correlations and t-statistics for lag 0, lag1, lag2, and lag 3 DNSI by industry. Test results in Table 2 show that the DNSI is significantly positively related to all select sector indices at the 1% significant level, regardless of time lag. The positive correlation indicates that investors are more (less) likely to invest in US stock market when people come across positive (negative) economic news. Financial sector index shows the highest correlation over 0.95, and energy and industrial select sector indices exhibit high correlation over 0.9 with lag 0, lag1, lag2, and lag 3 DNSI. These results imply that US stock investors in financial, energy, and industrial sectors tend to be more sensitive to daily economic news. On the other hand, health care select sector index shows the lowest correlation below 0.6 regardless of time lag of DNSI. Consumer discretionary and information technology select sector indices are found to have correlation of about 0.7 while communication services, consumer staples, materials, real estate, and utility select sector indices show correlation of about 0.8 with DNSI. Figure 2 shows changes in the relationship level between DNSI and select sector indices with mean values of correlations by time lag difference. It is interesting to note from Figure 2 that the significance level of correlation decreases as the time lag of DNSI increases for most select sector indices except for financial, real estate and utility sectors, implying that COVID-19 sentiment seems to have an immediate impact on the day’s investment.
4.2. Significance of COVI-19 Related Google Searches on US Stock Market by Industry
Table A1, Table A2, Table A3, Table A4 and Table A5 in Appendix A show test results with relative frequencies of Google searches for five terms related to coronavirus and economy for 11 select sector indices. Tables report correlations and t-statistics for lag 0, lag1, lag2, and lag 3 relative frequencies of Google searches by industry. Figure 3 presents changes in the magnitude of negative correlation between US Google searches for five terms and select sector indices with mean values of correlations by time lag difference.
Test results in Table A1, Table A2, Table A3, Table A4 and Table A5 show that US and worldwide Google searches for five terms are significantly negatively related to all select sector indices at the 1% significant level regardless of time lag except for health care index. The test results for US (worldwide) lag 2 (lag 1) Google searches of “unemployment” show significant relationship with health care select sector index at the 5% significance level, but the health care index is found to have no significant relationship with US (worldwide) lag 3 (lag 2 and lag 3) Google searches. The negative correlation indicates that investors are less (more) likely to invest in US stock market when people search terms related to coronavirus more (less) frequently.
The significance of the relationship between Google searches of “coronavirus” and 11 select sector indices is shown in Table A1. The negative correlation level between “coronavirus” Google searches and 11 select sector indices ranges from 0.65 to 0.95, which is the highest range of the correlations among Google searches of five terms under consideration in this paper. Communication services, consumer discretionary, and information technology sectors show a high level of correlation while financial and utility sectors show a low level of correlation with “coronavirus” Google searches across the time lags. The “coronavirus” plot in Figure 3 illustrates that while most select sector indices show stable relationship across the time lags, information technology and health care (real estate and utility) sectors experienced decreases (increases) in the relationship at lag 3. This result implies that the frequency of Google searches of “coronavirus” on a day has higher impact on investment in information technology and health care sectors on the same day than a few days later.
The significance of the relationship between Google searches of “laid off” and 11 select sector indices is shown in Table A2. The negative correlation level between “laid off” Google searches and 11 select sector indices ranges from 0.45 to 0.90. Communication services and consumer discretionary sectors show a high level of correlation while financial and utility sectors show a low level of correlation with “laid off” Google searches across the time lags. The “laid off” plot in Figure 3 illustrates that the significance level of correlation decreases as the time lag increases for all select sector indices. Particularly, health care sector experiences noticeable decreases at lag 3. These results indicate that the level of peoples’ interest in “laid off” on a day has higher impact on investment in most sectors on the same day than a few days later.
The significance of the relationship between Google searches of “unemployment” and 11 select sector indices is shown in Table A3. The negative correlation level between “unemployment” Google searches and 11 select sector indices ranges from 0.30 to 0.80. Financial and industrials sectors show a high level of correlation while health care and information technology sectors show a low level of correlation with “unemployment” Google searches across the time lags. It is interesting to note from Panel A and B in Table A3 that there is no significant relationship between the health care index and US (worldwide) lag 3 (lag 2 and lag 3) Google searches. Like the case of “laid off” Google searches, the “unemployment” plot in Figure 3 illustrates that the significance level of correlation decreases as the time lag increases for all select sector indices and the order of significance level for 11 industries is generally maintained across the time lags. These results indicate that the level of peoples’ concern in “unemployment” on a day has higher impact on investment in most sectors on the same day than a few days later.
The significance of the relationship between Google searches of “recession” and 11 select sector indices is shown in Table A4. The negative correlation level between “recession” Google searches and 11 select sector indices ranges from 0.45 to 0.85. Consumer discretionary, health care, and information technology sectors show a high level of correlation while financial and utility sectors show a low level of correlation with “recession” Google searches across the time lags. The “recession” plot in Figure 3 illustrates that a significant level of correlation increases as the time lag increases for most select sector indices. Particularly, health care, consumer staples, real estate, and utility sectors experience noticeable increases at lag 3. These results indicate that the frequency of Google searches of “recession” on a day has higher impact on investment in most sectors a few days later than on the same day. In other words, the level of peoples’ concern in “recession” shows a delayed impact on stock market rather an immediate impact.
The significance of the relationship between Google searches of “vaccine” and 11 select sector indices is shown in Table A5. The negative correlation level between “vaccine” Google searches and 11 select sector indices ranges from 0.60 to 0.90. Energy, financial, and industrial sectors show high level of correlation while health care and information technology sectors show low level of correlation with “vaccine” Google searches across the time lags. The “vaccine” plot in Figure 3 illustrates that the significance level of correlation increases as the time lag increases for most select sector indices. Particularly, health care and real estate sectors experience noticeable increases at lag 3. This result implies that the frequency of Google searches of “vaccine” on a day has higher impact on investment in health care and real estate sectors a few days later than on the same day. Like the case of “recession” Google searches, the level of peoples’ interest in “vaccine” shows a delayed impact on stock market rather an immediate impact.
4.3. Results from Time Series Regression Models
The results from time series regression model with changes in DNSI as the predictor are reported in Table 3. Table 3 reports estimated coefficients and p-values for lag 0, lag1, lag2, and lag 3 changes in DNSI from the time series regression model (3). The last column reports coefficient of determination (). We find that lag 0 and lag 1 changes in DNSI positively predict returns for energy and financial while lag 0 and lag 3 changes in DNSI positively predict returns for industrials at the 5% significance level. The industry of consumer services is found to have significantly positive coefficient of lag 0 changes in DNSI. However, there is no evidence of predictability for other industries.
4.4. Discussion
By investigating the links between 11 select sector indices and COVID-19 sentiment measured by DNSI and relative frequency of Google searches of five terms related to coronavirus and economy, this study provides a comprehensive overview of the initial impact of the COVID-19 sentiment on US stock market and how it differs by industry. Based on the empirical test results of correlation analysis, 11 industries are classified into three groups for each measure of the COVID-19 sentiment to distinguish the impact of the COVID-19 sentiment on US stock market. Table 4 summarizes industry classification from empirical results for each measure of the COVID-19 sentiment.
Among 11 industries, communication services, consumer discretionary, industrial, energy, and material sectors are found to be included in the high-or middle-level correlation group while utility sector is included in the middle-or low-level correlation group. Particularly, financial, information technology, and health care sectors are found to be included in all three groups, whereas real estate and consumer staples sectors are only included in the middle-level correlation group. The results in Table 4 reveal the distinct effects of the COVID-19 sentiment across various industries and the comparison analysis of COVID-19 sentiment by time lag difference shows its noticeable effect across various industries. In addition, results from the time series regression model show that COVID-19 sentiment measured by DNSI positively predicts industry returns including communication services, energy, financial, and industrials. On the contrary, there is no evidence of predictability for other industry returns, implying difference in industry return predictability by COVID-19 sentiment among 11 industries. The economic intuition under these results is that information diffusion is different across industries, leading to different predictability of returns across industries [28,29].
The information from the empirical results is prudent for strategic investors as their primary interests lie in identifying industry that is closely related to the COVID-19 sentiment or rarely related to it. It may help fund managers to adjust their portfolio risk exposure by trading their stocks included in industries that are significantly responsive to COVID-19 sentiment or those that are not. It also offers valuable implication to forward-looking US stock market investors in the time of COVID-19.
5. Conclusions
Exploring stock market movement has attracted many researchers in multiple disciplines including finance, economics, computer science, statistics, and operations research. Recently, many researchers have shown that online information obtained from the public domain such as news stories from the mainstream media and social media discussion such as tweets can have a significant effect on decision making by stock market investors. Particularly, in times of market crisis, any positive or negative sentiment of public related to stock market crisis can have a ripple effect on decision making by investors in stock markets.
While the COVID-19 pandemic has not ended, this study explores the initial impact of the COVID-19 sentiment on the US stock market using DNSI and Google Trends big data on coronavirus-related searches. This study offers a comprehensive view of the initial impact of COVID-19 sentiment on the US stock market by industry by investigating the correlation between COVID-19 sentiment and 11 select sector indices as well as industry return predictability by COVID-19 sentiment. The empirical results reveal the distinct effects of the COVID-19 sentiment across various industries: Communication services, consumer discretionary, industrial, energy, and material sectors are classified in the high-or middle-level correlation group while utility sector is classified in the middle-or low-level correlation group. Financial, information technology, and health care sectors are classified in all three groups, whereas real estate and consumer staples sectors are only included in the middle-level correlation group. They also suggest the strategic investment planning considering the time lag perspectives by visualizing changes in the correlation level by time lag differences. In addition, results from the time series regression model demonstrate industry return predictability by DSNI for communication services, energy, financial, and industrials.
To sustain competitive advantage in the time of the COVID-19 pandemic, stock market investors require not only understanding the nature of market crisis caused by the sudden shock, but also a strategic investment decision that can realize positive returns or minimize the loss due to the shock. When stock markets suffer from a sudden and unprecedented shock like the COVID-19 pandemic, sentiment analysis using big data from social media is particularly an excellent source of information and can provide investors with insights that determine investment strategies. Since the COVID-19 pandemic is ongoing and it is still not possible to predict extent of its impact across the world, this study has potential limitations. It may not be enough to draw a comprehensive conclusion about the impact of COVD-19 sentiment on US stock market in this paper, but it is time to diagnose the current situation and search for a solution to various changes in stock markets caused by the COVID-19 pandemic. While the COVID-19 pandemic is ongoing, this study is at the forefront of research on this issue. Using updated data for COVID-19 pandemic and stock markets, future research can be enriched by analyzing what the COVID-19 pandemic has brought in global stock markets and by developing new investment strategies for asset managers in the time of COVID-19.
Funding
This work is supported by Sejong University.
Acknowledgments
The author thanks Yong Gun Choe who offered valuable suggestions and helped in data collection.
Conflicts of Interest
Author declares no conflict of interest.
Appendix A

Table A1.
Test results for “coronavirus” Google trend.
| Lag 0 | Lag 1 | Lag 2 | Lag 3 | |||||
|---|---|---|---|---|---|---|---|---|
| Correlation | t-Statistics | Correlation | t-Statistics | Correlation | t-Statistics | Correlation | t-Statistics | |
| Panel A: Index correlation with US Google trend | ||||||||
| Communication Services | −0.9110 | −20.1232 | −0.9083 | −19.6672 | −0.9209 | −21.2619 | −0.9060 | −19.1422 |
| Consumer Discretionary | −0.9161 | −20.8185 | −0.9158 | −20.6413 | −0.9232 | −21.6209 | −0.9025 | −18.7400 |
| Consumer Staples | −0.7740 | −11.1356 | −0.7677 | −10.8484 | −0.7829 | −11.3258 | −0.7724 | −10.8775 |
| Energy | −0.8164 | −12.8774 | −0.8289 | −13.4192 | −0.8423 | −14.0621 | −0.8399 | −13.8405 |
| Financial | −0.7071 | −9.1093 | −0.7142 | −9.2395 | −0.7336 | −9.7148 | −0.7335 | −9.6526 |
| Health Care | −0.8838 | −17.2060 | −0.8671 | −15.7608 | −0.8688 | −15.7922 | −0.8392 | −13.8035 |
| Industrials | −0.7322 | −9.7953 | −0.7460 | −10.1436 | −0.7656 | −10.7110 | −0.7671 | −10.6961 |
| Information Technology | −0.9173 | −20.9862 | −0.9005 | −18.7524 | −0.9078 | −19.4858 | −0.8794 | −16.5250 |
| Materials | −0.8755 | −16.5025 | −0.8738 | −16.2689 | −0.8793 | −16.6171 | −0.8614 | −15.1719 |
| Real Estate | −0.6889 | −8.6593 | −0.7118 | −9.1765 | −0.7513 | −10.2456 | −0.7594 | −10.4401 |
| Utility | −0.6831 | −8.5223 | −0.6946 | −8.7428 | −0.7188 | −9.3066 | −0.7171 | −9.2015 |
| Panel B: Index correlation with worldwide Google trend | ||||||||
| Communication Services | −0.9393 | −24.9424 | −0.9381 | −24.5283 | −0.9458 | −26.2095 | −0.9312 | −22.8584 |
| Consumer Discretionary | −0.9376 | −24.5761 | −0.9366 | −24.2137 | −0.9399 | −24.7847 | −0.9212 | −21.1719 |
| Consumer Staples | −0.8040 | −12.3188 | −0.8040 | −12.2447 | −0.8176 | −12.7794 | −0.8091 | −12.3146 |
| Energy | −0.8567 | −15.1317 | −0.8711 | −16.0617 | −0.8825 | −16.8919 | −0.8807 | −16.6317 |
| Financial | −0.7494 | −10.3119 | −0.7606 | −10.6080 | −0.7781 | −11.1492 | −0.7814 | −11.1989 |
| Health Care | −0.8989 | −18.6948 | −0.8820 | −16.9502 | −0.8771 | −16.4361 | −0.8448 | −14.1193 |
| Industrials | −0.7742 | −11.1447 | −0.7904 | −11.6838 | −0.8081 | −12.3471 | −0.8113 | −12.4111 |
| Information Technology | −0.9379 | −24.6416 | −0.9229 | −21.7069 | −0.9242 | −21.7772 | −0.8966 | −18.1114 |
| Materials | −0.9035 | −19.2099 | −0.9045 | −19.2013 | −0.9082 | −19.5311 | −0.8940 | −17.8412 |
| Real Estate | −0.7210 | −9.4787 | −0.7471 | −10.1791 | −0.7824 | −11.3073 | −0.7936 | −11.6649 |
| Utility | −0.7148 | −9.3116 | −0.7304 | −9.6834 | −0.7547 | −10.3543 | −0.7576 | −10.3829 |
Note: All test results are significant at the 1% significant level.
Table A2.
Test results for “laid off” Google trend.
| Lag 0 | Lag 1 | Lag 2 | Lag 3 | |||||
|---|---|---|---|---|---|---|---|---|
| Correlation | t-Statistics | Correlation | t-Statistics | Correlation | t-Statistics | Correlation | t-Statistics | |
| Panel A: Index correlation with US Google trend | ||||||||
| Communication Services | −0.6821 | −8.4988 | −0.6565 | −7.8804 | −0.6258 | −7.2213 | −0.5810 | −6.3848 |
| Consumer Discretionary | −0.6955 | −8.8184 | −0.6703 | −8.1793 | −0.6341 | −7.3808 | −0.5802 | −6.3714 |
| Consumer Staples | −0.6210 | −7.2189 | −0.5900 | −6.6166 | −0.5574 | −6.0417 | −0.5032 | −5.2081 |
| Energy | −0.6165 | −7.1338 | −0.5956 | −6.7144 | −0.5660 | −6.1785 | −0.5237 | −5.4991 |
| Financial | −0.5702 | −6.3228 | −0.5635 | −6.1764 | −0.5485 | −5.9033 | −0.5172 | −5.4045 |
| Health Care | −0.6324 | −7.4379 | −0.5933 | −6.6749 | −0.5523 | −5.9621 | −0.4765 | −4.8478 |
| Industrials | −0.5826 | −6.5301 | −0.5701 | −6.2844 | −0.5527 | −5.9684 | −0.5188 | −5.4281 |
| Information Technology | −0.6482 | −7.7558 | −0.6145 | −7.0542 | −0.5768 | −6.3542 | −0.5180 | −5.4161 |
| Materials | −0.6636 | −8.0819 | −0.6428 | −7.5978 | −0.6093 | −6.9163 | −0.5548 | −5.9641 |
| Real Estate | −0.6332 | −7.4536 | −0.6265 | −7.2793 | −0.6110 | −6.9470 | −0.5593 | −6.0350 |
| Utility | −0.5869 | −6.6035 | −0.5844 | −6.5215 | −0.5744 | −6.3151 | −0.5338 | −5.6462 |
| Panel B: Index correlation with worldwide Google trend | ||||||||
| Communication Services | −0.7544 | −10.4712 | −0.7258 | −9.5530 | −0.6944 | −8.6849 | −0.6464 | −7.5777 |
| Consumer Discretionary | −0.8852 | −17.3314 | −0.8469 | −14.4246 | −0.8116 | −12.5030 | −0.7655 | −10.6407 |
| Consumer Staples | −0.7012 | −8.9589 | −0.6738 | −8.2563 | −0.6467 | −7.6308 | −0.5938 | −6.6009 |
| Energy | −0.6857 | −8.5813 | −0.6623 | −8.0056 | −0.6308 | −7.3174 | −0.5881 | −6.5042 |
| Financial | −0.6321 | −7.4310 | −0.6208 | −7.1711 | −0.6030 | −6.8037 | −0.5697 | −6.2002 |
| Health Care | −0.7257 | −9.6092 | −0.6847 | −8.5065 | −0.6418 | −7.5312 | −0.5638 | −6.1057 |
| Industrials | −0.6512 | −7.8164 | −0.6348 | −7.4399 | −0.6139 | −6.9992 | −0.5767 | −6.3147 |
| Information Technology | −0.7271 | −9.6479 | −0.6874 | −8.5716 | −0.6470 | −7.6371 | −0.5837 | −6.4303 |
| Materials | −0.7401 | −10.0250 | −0.7137 | −9.2269 | −0.6778 | −8.2978 | −0.6215 | −7.0962 |
| Real Estate | −0.7095 | −9.1730 | −0.6995 | −8.8635 | −0.6813 | −8.3775 | −0.6284 | −7.2248 |
| Utility | −0.6626 | −8.0604 | −0.6565 | −7.8805 | −0.6442 | −7.5801 | −0.6022 | −6.7465 |
Note: All test results are significant at the 1% significant level.
Table A3.
Test results for “unemployment” Google Trend.
| Lag 0 | Lag 1 | Lag 2 | Lag 3 | |||||
|---|---|---|---|---|---|---|---|---|
| Correlation | t-Statistics | Correlation | t-Statistics | Correlation | t-Statistics | Correlation | t-Statistics | |
| Panel A: Index correlation with US Google trend | ||||||||
| Communication Services | −0.6255 | −7.3039 | −0.5771 | −6.3983 | −0.5222 | −5.5108 | −0.4734 | −4.8064 |
| Consumer Discretionary | −0.5967 | −6.7751 | −0.5454 | −5.8931 | −0.4907 | −5.0690 | −0.4379 | −4.3565 |
| Consumer Staples | −0.6269 | −7.3304 | −0.5807 | −6.4593 | −0.5366 | −5.7235 | −0.4885 | −5.0080 |
| Energy | −0.7367 | −9.9249 | −0.6999 | −8.8741 | −0.6589 | −7.8839 | −0.6173 | −7.0180 |
| Financial | −0.7779 | −11.2798 | −0.7530 | −10.3616 | −0.7221 | −9.3950 | −0.6877 | −8.4731 |
| Health Care | −0.3479 | −3.3812 | −0.2859 | −2.7013 | −0.2174 | −2.0047 ** | −0.1492 | −1.3493 * |
| Industrials | −0.7755 | −11.1915 | −0.7459 | −10.1403 | −0.7125 | −9.1399 | −0.6771 | −8.2308 |
| Information Technology | −0.4994 | −5.2510 | −0.4477 | −4.5334 | −0.3900 | −3.8114 | −0.3405 | −3.2389 |
| Materials | −0.6490 | −7.7723 | −0.6037 | −6.8567 | −0.5566 | −6.0302 | −0.5078 | −5.2722 |
| Real Estate | −0.7585 | −10.6043 | −0.7259 | −9.5560 | −0.6873 | −8.5164 | −0.6441 | −7.5322 |
| Utility | −0.7320 | −9.7881 | −0.7009 | −8.8980 | −0.6706 | −8.1351 | −0.6343 | −7.3380 |
| Panel B: Index correlation with worldwide Google trend | ||||||||
| Communication Services | −0.6215 | −7.2280 | −0.5721 | −6.3160 | −0.5179 | −5.4481 | −0.4692 | −4.7528 |
| Consumer Discretionary | −0.5925 | −6.7007 | −0.5399 | −5.8086 | −0.4856 | −4.9989 | −0.4329 | −4.2959 |
| Consumer Staples | −0.6246 | −7.2863 | −0.5774 | −6.4032 | −0.5334 | −5.6748 | −0.4855 | −4.9671 |
| Energy | −0.7358 | −9.8990 | −0.6987 | −8.8434 | −0.6579 | −7.8617 | −0.6169 | −7.0106 |
| Financial | −0.7785 | −11.2988 | −0.7531 | −10.3659 | −0.7228 | −9.4127 | −0.6885 | −8.4908 |
| Health Care | −0.3415 | −3.3099 | −0.2776 | −2.6166 ** | −0.2099 | −1.9322* | −0.1420 | −1.2829 * |
| Industrials | −0.7762 | −11.2159 | −0.7460 | −10.1439 | −0.7128 | −9.1461 | −0.6775 | −8.2396 |
| Information Technology | −0.4948 | −5.1872 | −0.4413 | −4.4528 | −0.3848 | −3.7518 | −0.3353 | −3.1836 |
| Materials | −0.6460 | −7.7093 | −0.6001 | −6.7925 | −0.5535 | −5.9808 | −0.5052 | −5.2361 |
| Real Estate | −0.7574 | −10.5692 | −0.7244 | −9.5164 | −0.6869 | −8.5075 | −0.6436 | −7.5219 |
| Utility | −0.7321 | −9.7902 | −0.7000 | −8.8766 | −0.6699 | −8.1202 | −0.6334 | −7.3218 |
Note: All test results are significant at the 1% significant level except for **(significant at the 5% significant level) and * (No significant relationship).
Table A4.
Test results for “recession” Google trend.
| Lag 0 | Lag 1 | Lag 2 | Lag 3 | |||||
|---|---|---|---|---|---|---|---|---|
| Correlation | t-Statistics | Correlation | t-Statistics | Correlation | t-Statistics | Correlation | t-Statistics | |
| Panel A: Index correlation with US Google trend | ||||||||
| Communication Services | −0.6983 | −8.8870 | −0.6930 | −8.7052 | −0.7230 | −9.4195 | −0.7311 | −9.5843 |
| Consumer Discretionary | −0.7307 | −9.7518 | −0.7343 | −9.7960 | −0.7606 | −10.5442 | −0.7532 | −10.2423 |
| Consumer Staples | −0.5783 | −6.4580 | −0.5751 | −6.3658 | −0.6595 | −7.8959 | −0.7203 | −9.2869 |
| Energy | −0.6119 | −7.0490 | −0.6293 | −7.3326 | −0.6485 | −7.6668 | −0.6430 | −7.5090 |
| Financial | −0.5137 | −5.4548 | −0.5233 | −5.5616 | −0.5573 | −6.0405 | −0.5622 | −6.0796 |
| Health Care | −0.7307 | −9.7518 | −0.7300 | −9.6720 | −0.7900 | −11.5966 | −0.8133 | −12.5015 |
| Industrials | −0.5380 | −5.8147 | −0.5563 | −6.0615 | −0.5953 | −6.6688 | −0.6067 | −6.8261 |
| Information Technology | −0.7390 | −9.9943 | −0.7196 | −9.3831 | −0.7566 | −10.4132 | −0.7582 | −10.4006 |
| Materials | −0.6816 | −8.4857 | −0.6862 | −8.5421 | −0.7152 | −9.2096 | −0.7146 | −9.1368 |
| Real Estate | −0.5215 | −5.5676 | −0.5491 | −5.9498 | −0.6189 | −7.0914 | −0.6455 | −7.5599 |
| Utility | −0.5066 | −5.3537 | −0.5228 | −5.5535 | −0.5973 | −6.7024 | −0.6409 | −7.4679 |
| Panel B: Index correlation with worldwide Google trend | ||||||||
| Communication Services | −0.8040 | −12.3192 | −0.7937 | −11.8152 | −0.8223 | −13.0075 | −0.8172 | −12.6797 |
| Consumer Discretionary | −0.8307 | −13.5935 | −0.8285 | −13.3993 | −0.8526 | −14.6867 | −0.8330 | −13.4666 |
| Consumer Staples | −0.6878 | −8.6334 | −0.6749 | −8.2825 | −0.7414 | −9.9441 | −0.7719 | −10.8598 |
| Energy | −0.7330 | −9.8163 | −0.7408 | −9.9872 | −0.7569 | −10.4246 | −0.7503 | −10.1500 |
| Financial | −0.6355 | −7.4977 | −0.6373 | −7.4888 | −0.6719 | −8.1646 | −0.6704 | −8.0806 |
| Health Care | −0.8056 | −12.3889 | −0.7924 | −11.7635 | −0.8388 | −13.8640 | −0.8378 | −13.7267 |
| Industrials | −0.6577 | −7.9551 | −0.6698 | −8.1687 | −0.7070 | −8.9963 | −0.7089 | −8.9897 |
| Information Technology | −0.8227 | −13.1849 | −0.7998 | −12.0637 | −0.8330 | −13.5517 | −0.8166 | −12.6529 |
| Materials | −0.7849 | −11.5423 | −0.7805 | −11.3055 | −0.8098 | −12.4210 | −0.8010 | −11.9673 |
| Real Estate | −0.6316 | −7.4212 | −0.6516 | −7.7786 | −0.7150 | −9.2045 | −0.7280 | −9.4973 |
| Utility | −0.6166 | −7.1344 | −0.6250 | −7.2503 | −0.6922 | −8.6330 | −0.7152 | −9.1522 |
Note: All test results are significant at the 1% significant level.
Table A5.
Test results for “vaccine” Google trend.
| Lag 0 | Lag 1 | Lag 2 | Lag 3 | |||||
|---|---|---|---|---|---|---|---|---|
| Correlation | t-Statistics | Correlation | t-Statistics | Correlation | t-Statistics | Correlation | t-Statistics | |
| Panel A: Index correlation with US Google trend | ||||||||
| Communication Services | −0.7511 | −10.3665 | −0.7456 | −10.1304 | −0.7595 | −10.5094 | −0.7887 | −11.4742 |
| Consumer Discretionary | −0.7705 | −11.0117 | −0.7756 | −11.1260 | −0.7936 | −11.7369 | −0.8099 | −12.3485 |
| Consumer Staples | −0.7602 | −10.6601 | −0.7620 | −10.6546 | −0.7846 | −11.3876 | −0.8170 | −12.6731 |
| Energy | −0.8126 | −12.7031 | −0.8161 | −12.7875 | −0.8293 | −13.3571 | −0.8404 | −13.8704 |
| Financial | −0.8110 | −12.6296 | −0.8176 | −12.8570 | −0.8315 | −13.4700 | −0.8410 | −13.9016 |
| Health Care | −0.6340 | −7.4691 | −0.6415 | −7.5724 | −0.6703 | −8.1298 | −0.7003 | −8.7754 |
| Industrials | −0.8161 | −12.8642 | −0.8258 | −13.2617 | −0.8442 | −14.1720 | −0.8599 | −15.0702 |
| Information Technology | −0.7140 | −9.2907 | −0.7055 | −9.0156 | −0.7247 | −9.4660 | −0.7499 | −10.1391 |
| Materials | −0.8015 | −12.2102 | −0.7998 | −12.0643 | −0.8119 | −12.5154 | −0.8245 | −13.0335 |
| Real Estate | −0.7664 | −10.8683 | −0.7971 | −11.9531 | −0.8363 | −13.7290 | −0.8591 | −15.0132 |
| Utility | −0.7797 | −11.3432 | −0.7990 | −12.0309 | −0.8239 | −13.0820 | −0.8449 | −14.1250 |
| Panel B: Index correlation with worldwide Google trend | ||||||||
| Communication Services | −0.7971 | −12.0268 | −0.7656 | −10.7779 | −0.7619 | −10.5862 | −0.7529 | −10.2322 |
| Consumer Discretionary | −0.8086 | −12.5197 | −0.7803 | −11.2988 | −0.7725 | −10.9493 | −0.7572 | −10.3673 |
| Consumer Staples | −0.8656 | −15.7463 | −0.8375 | −13.8784 | −0.8262 | −13.1966 | −0.8129 | −12.4863 |
| Energy | −0.8791 | −16.8046 | −0.8603 | −15.2806 | −0.8529 | −14.7002 | −0.8433 | −14.0363 |
| Financial | −0.9010 | −18.9253 | −0.8825 | −16.9933 | −0.8752 | −16.2826 | −0.8640 | −15.3474 |
| Health Care | −0.6654 | −8.1206 | −0.6320 | −7.3848 | −0.6239 | −7.1846 | −0.6007 | −6.7200 |
| Industrials | −0.9075 | −19.6815 | −0.8878 | −17.4706 | −0.8801 | −16.6810 | −0.8720 | −15.9299 |
| Information Technology | −0.7320 | −9.7878 | −0.6887 | −8.6005 | −0.6847 | −8.4546 | −0.6683 | −8.0358 |
| Materials | −0.8599 | −15.3455 | −0.8261 | −13.2727 | −0.8119 | −12.5172 | −0.7971 | −11.8060 |
| Real Estate | −0.8886 | −17.6530 | −0.8878 | −17.4682 | −0.8903 | −17.5923 | −0.8814 | −16.6928 |
| Utility | −0.9018 | −19.0148 | −0.8873 | −17.4205 | −0.8784 | −16.5432 | −0.8631 | −15.2859 |
Note: All test results are significant at the 1% significant level.
References
- Bhardwaj, A.; Narayan, Y.; Dutta, M. Sentiment analysis for Indian stock market prediction using sensex and nifty. Procedia Comput. Sci. 2015, 70, 85–91. [Google Scholar] [CrossRef] [Green Version]
- Bharathi, S.; Geetha, A. Sentiment analysis for effective stock market prediction. Int. J. Intell. Eng. Syst. 2017, 10, 146–154. [Google Scholar] [CrossRef]
- Bollen, J.; Mao, H.; Zeng, X. Twitter mood predicts the stock market. J. Comput. Sci. 2011, 2, 1–8. [Google Scholar] [CrossRef] [Green Version]
- Bollen, J.; Mao, H. Twitter mood as a stock market predictor. Computer 2011, 44, 91–94. [Google Scholar] [CrossRef]
- Bing, L.; Chan, K.C.; Ou, C. Public sentiment analysis in Twitter data for prediction of a company’s stock price movements. In Proceedings of the IEEE 11th International Conference on e-Business Engineering (ICEBE), Guangzhou, China, 5–7 November 2014; pp. 232–239. [Google Scholar]
- Bordino, I.; Battiston, S.; Caldarelli, G.; Cristelli, M.; Ukkonen, A.; Weber, I. Web search queries can predict stock market volumes. PLoS ONE 2011, 7, e40014. [Google Scholar] [CrossRef] [PubMed] [Green Version]
- Chen, R.; Lazer, M. Sentiment Analysis of Twitter Feeds for the Prediction of Stock Market Movement; Stanford edu Retrieved January, 25:2013, 2013. CS 229; Stanford University: Stanford, CA, USA, 2013; p. 15. [Google Scholar]
- Garica, D. Sentiment during recessions. J. Financ. 2013, 68, 1267–1300. [Google Scholar] [CrossRef]
- Gilbert, E.; Karahalios, K. Widespread worry and the stock market. In Proceedings of the Fourth International AAAI Conference on Weblogs and Social Media, Washington, DC, USA, 23–26 May 2010; pp. 58–65. [Google Scholar]
- Kordonis, J.; Symeonidis, S.; Arampatzis, A. Stock price forecasting via sentiment analysis on twitter. In Proceedings of the 20th Panhellenic Conference on Informatics (PCI ’16), Patras, Greece, 10–12 November 2016. [Google Scholar]
- Li, Q.; Shah, S. Learning stock market sentiment lexicon and sentiment-oriented word vector from stocktwits. In Proceedings of the 21st Conference on Computational Natural Language Learning (CoNLL), Vancouver, BC, Canada, 3–4 August 2017; pp. 301–310. [Google Scholar]
- Lima, M.L.; Nascimento, T.P.; Labidi, S.; Timbo, N.S.; Batista, M.V.L.; Neto, G.N.; Costa, E.A.M.; Sousa, S.R.S. Using sentiment analysis for stock exchange prediction. Int. J. Artif. Intell. Appl. 2016, 7, 59–67. [Google Scholar]
- Mittal, A.; Goel, A. Stock Prediction Using Twitter Sentiment Analysis; CS229; Stanford University: Stanford, CA, USA, 2012; p. 15. [Google Scholar]
- Nguyen, T.H.; Shirai, K.; Velcin, J. Sentiment analysis on social media for stock movement prediction. Expert Syst. Appl. 2015, 42, 9603–9611. [Google Scholar] [CrossRef]
- Pagolu, V.S.; Reddy, K.N.; Panda, G.; Majhi, B. Sentiment analysis of twitter data for predicting stock market movements. In Proceedings of the International Conference on Signal Processing, Communication, Power and Embedded System (SCOPES), Paralakhemundi, India, 3–5 October 2016; pp. 1345–1350. [Google Scholar]
- Pasupulety, U.; Anees, A.; Anmol, S.; Mohan, B. Predicting stock prices using ensemble learning and sentiment analysis. In Proceedings of the IEEE Second International Conference on Artificial Intelligence and Knowledge Engineering (AIKE), Cagliari, Italy, 5–7 June 2019. [Google Scholar]
- Shah, D.; Isah, H.; Zulkernine, F. Predicting the effects of news sentimentss omn the stock market. In Proceedings of the IEEE International Conference on Big Data, Seattle, WA, USA, 10–13 December 2018. [Google Scholar]
- Sprenger, T.O.; Tumasjan, A.; Sandner, P.G.; Welpe, I.M. Tweets and trades: The information content of stock microblogs. Eur. Financ. Manag. 2014, 20, 926–957. [Google Scholar] [CrossRef]
- Tetlock, P. Giving content to investor sentiment: The role of media in the stock market. J. Financ. 2007, 62, 1139–1168. [Google Scholar] [CrossRef]
- Zhang, L. Sentiment Analysis on Twitter with Stock Price and Significant Keyword Correlation. Ph.D. Thesis, The University of Texas at Austin, Austin, TX, USA, 2013. [Google Scholar]
- Zhang, J.; Cui, S.; Xu, Y.; Li, Q.; Li, T. A novel data-driven stock price trend prediction system. Expert Syst. Appl. 2018, 97, 60–69. [Google Scholar] [CrossRef]
- Isah, H. Social Data Mining for Crime Intelligence: Contributions to Social Data Quality Assessment and Prediction Methods. Ph.D. Thesis, University of Bradford, Bradford, UK, 2017. [Google Scholar]
- Buckman, S.; Shapiro, A.; Sudof, M.; Wilson, D. News sentiment in the time of COVID-19. In FRBSF Economic Letter; Federal Reserve Bank of San Francisco: San Francisco, CA, USA, 2020; p. 8. [Google Scholar]
- Shapiro, A.; Sudhof, M.; Wilson, D. Measuring News Sentiment; FRBSF Working Paper; Federal Reserve Bank of San Francisco: San Francisco, CA, USA, 2017; p. 7. [Google Scholar]
- Bannigidadmath, D. Consumer sentiment and Indonesia’s stock returns. Bull. Monet. Econ. Bank. 2020, 23. [Google Scholar] [CrossRef] [Green Version]
- Fama, E.; French, K. Business conditions and expected return on stocks and bonds. J. Financ. Econ. 1989, 25, 23–49. [Google Scholar] [CrossRef]
- Newey, W.; West, K. A Simple, positive semi-fefinite, heteroskedastic and autocorrelation consistent covariance matrix. Econometrica 1987, 55, 703–708. [Google Scholar] [CrossRef]
- Hong, H.; Stein, J.C. A Unified Theory of Underreaction, Momentum Trading, and Overreaction in Asset Markets. J. Financ. 1999, 54, 2143–2184. [Google Scholar] [CrossRef] [Green Version]
- Hou, K. Industry Information Diffusion and The Lead-Lag Effect in Stock Returns. Rev. Financ. Stud. 2007, 20, 1113–1138. [Google Scholar] [CrossRef]
Figure 1.
Relative frequencies of Google searches for five terms related to coronavirus over the period from 21st of January 2020 to 20th of May 2020. (a) “Coronavirus” Google Trends, (b) “Laid off” Google Trends, (c) “Unemployment” Google Trends, (d) “Recession” Google Trends, (e) “Vaccine” Google Trends
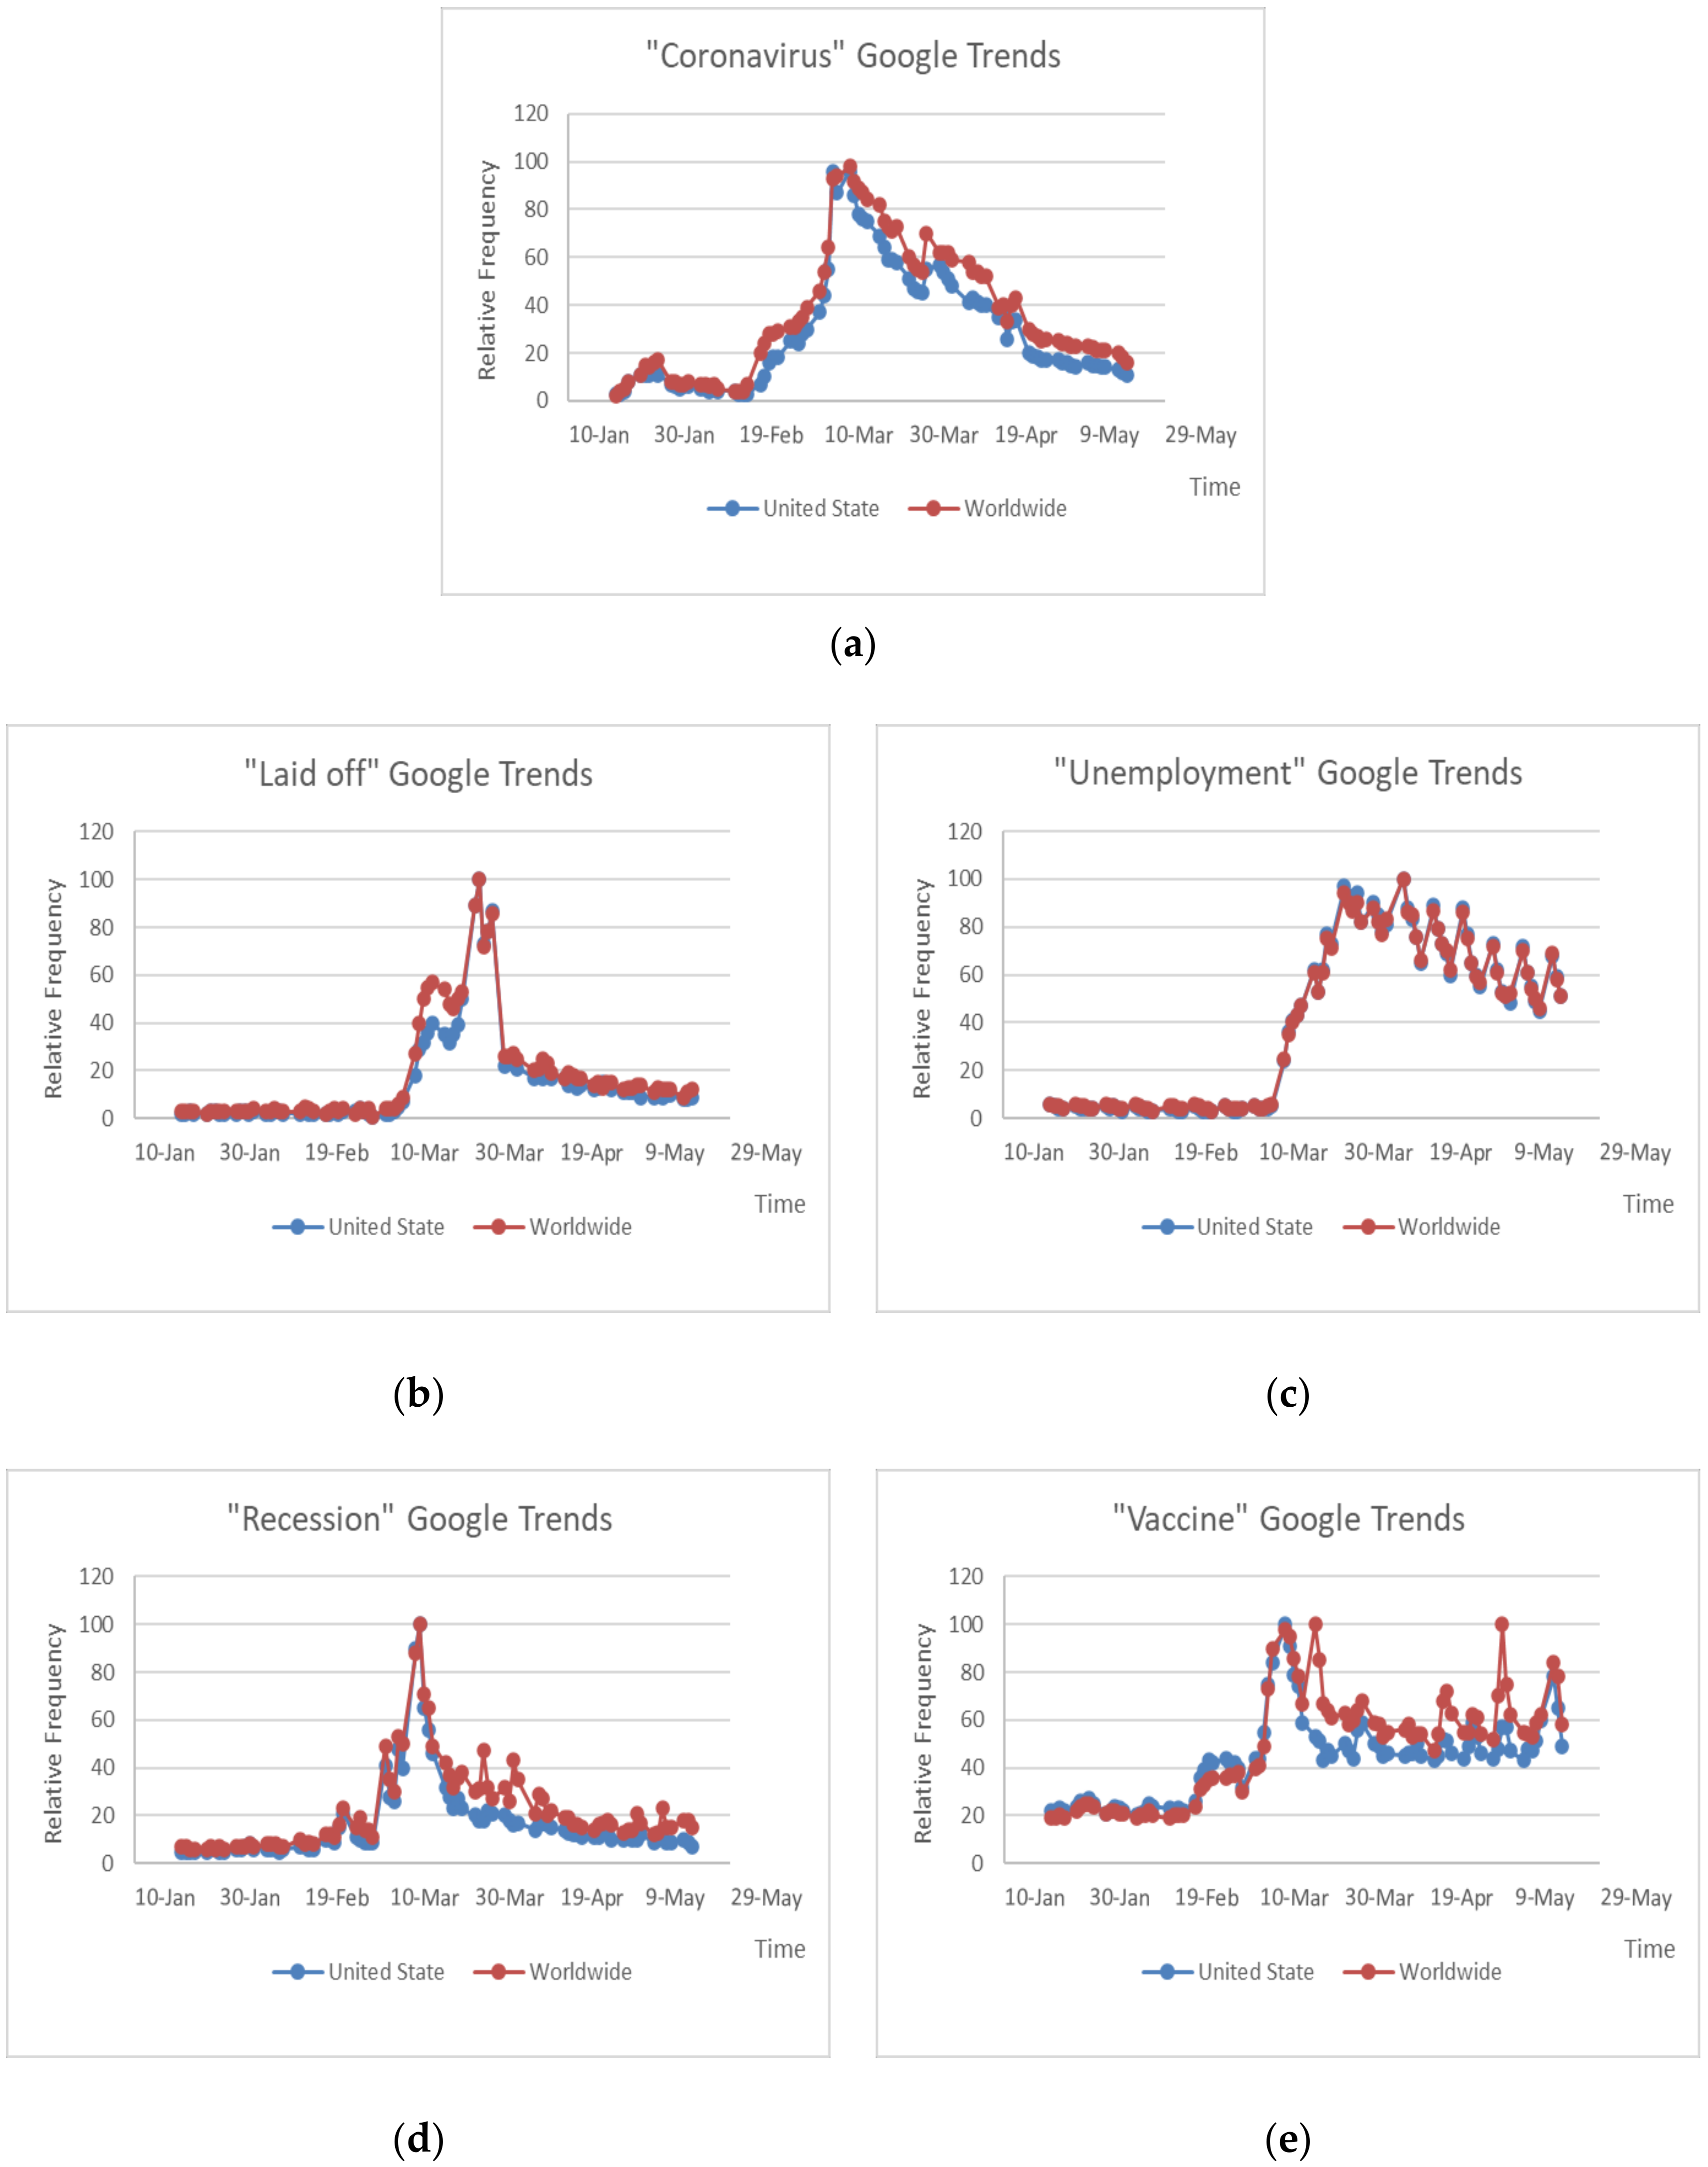
Figure 2.
Changes in the relationship level between Daily News Sentiment Index (DNSI) and 11 select sector indices by time lag difference.
Figure 2.
Changes in the relationship level between Daily News Sentiment Index (DNSI) and 11 select sector indices by time lag difference.
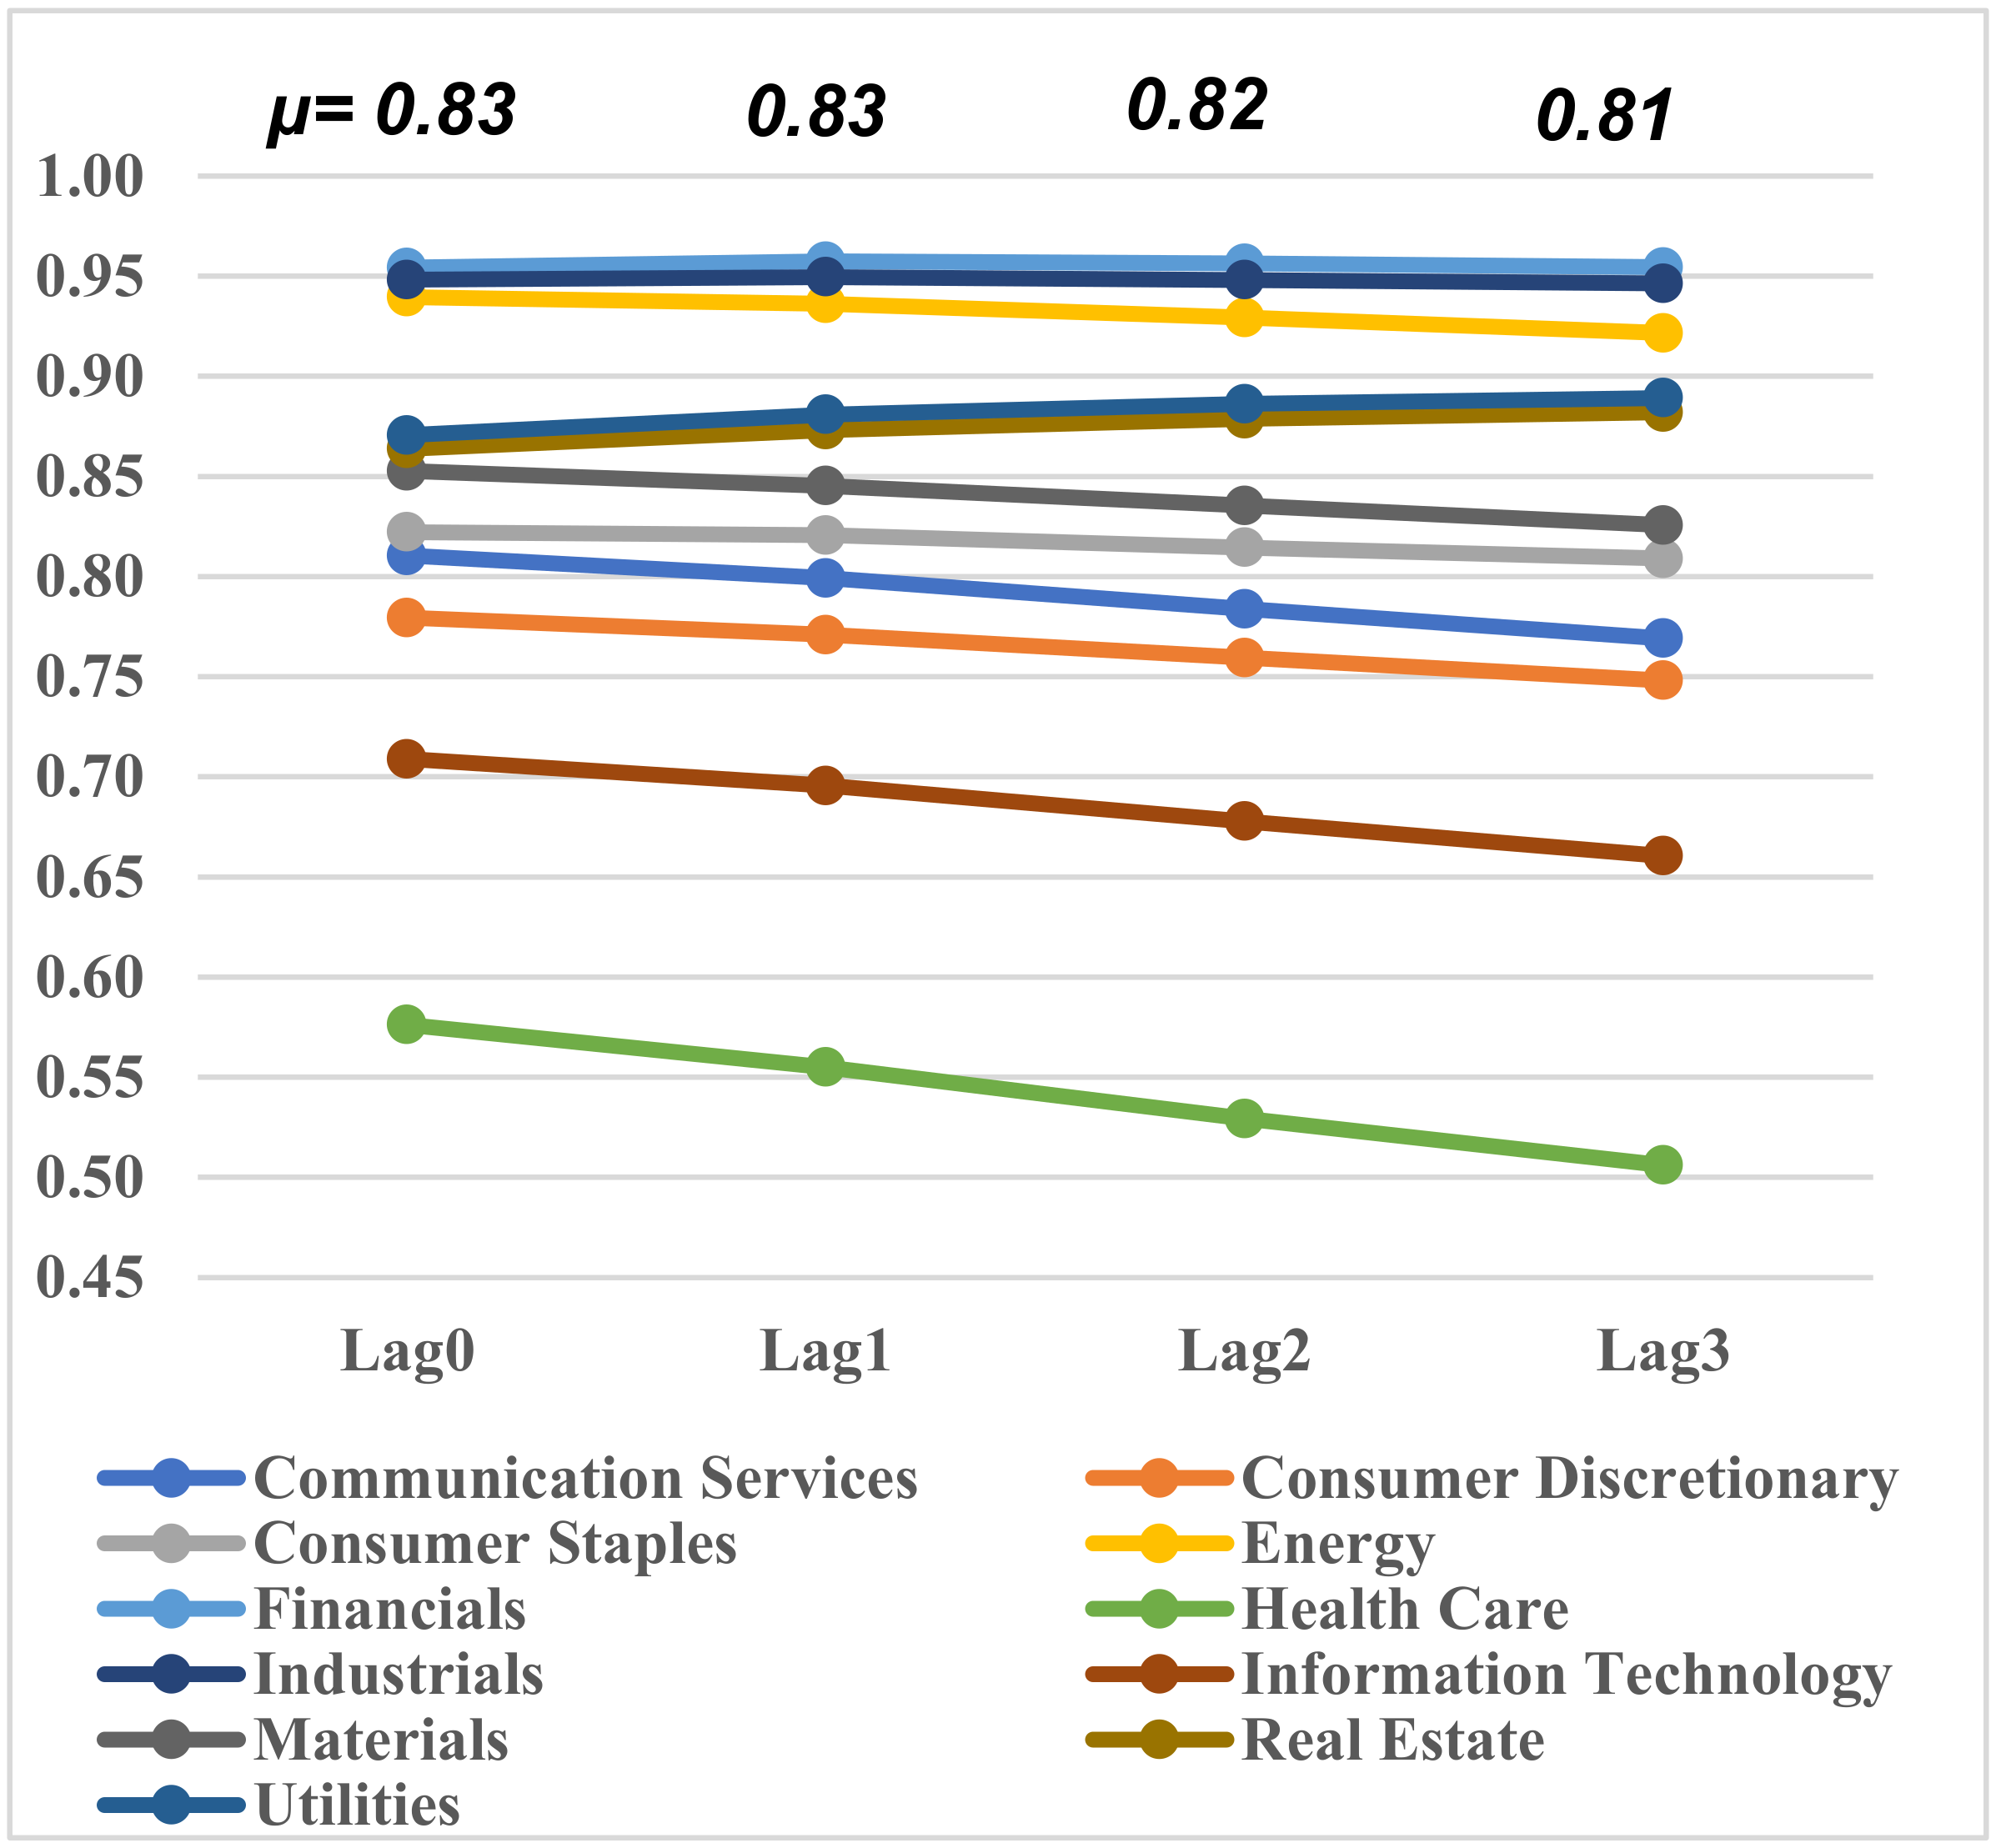
Figure 3.
Changes in the magnitude of negative correlations between US Google searches for five terms and 11 select sector indices by time lag difference. (a) “Coronavirus”, (b) “Laid off, (c) “Unemployment”, (d) “Recession”, (e) “Vaccine”.
Figure 3.
Changes in the magnitude of negative correlations between US Google searches for five terms and 11 select sector indices by time lag difference. (a) “Coronavirus”, (b) “Laid off, (c) “Unemployment”, (d) “Recession”, (e) “Vaccine”.

Table 1.
Sample distribution of 11 select sector indices and Daily News Sentiment Index.
| 21st Jan 2020–20th May 2020 (Time of COVID-19) | 21st Sep 2019–20th Jan 2020 (Time of NO COVID-19) | |||||||
|---|---|---|---|---|---|---|---|---|
| Mean | Standard Deviation | Maximum | Minimum | Mean | Standard Deviation | Maximum | Minimum | |
| Panel A: Select Sector Index from S&P Dow Jones Indices | ||||||||
| Communication Services | 261.20 | 25.73 | 301.01 | 210.25 | 271.37 | 10.31 | 296.38 | 252.49 |
| Consumer Discretionary | 1148.84 | 126.86 | 1335.26 | 879.32 | 1233.77 | 25.18 | 1292.61 | 1185.98 |
| Consumer Staples | 595.59 | 39.98 | 652.44 | 489.80 | 620.53 | 9.94 | 643.76 | 604.52 |
| Energy | 420.56 | 107.33 | 603.65 | 244.44 | 603.06 | 16.92 | 633.69 | 564.38 |
| Financial | 303.23 | 53.01 | 382.62 | 217.59 | 361.78 | 15.21 | 382.63 | 329.46 |
| Health Care | 973.29 | 71.56 | 1057.54 | 755.22 | 968.82 | 51.82 | 1055.84 | 882.37 |
| Industrials | 687.88 | 108.19 | 855.87 | 491.04 | 804.05 | 25.72 | 848.29 | 744.21 |
| Information Technology | 903.17 | 82.89 | 1031.55 | 709.63 | 866.74 | 49.64 | 976.66 | 786.49 |
| Materials | 551.09 | 65.65 | 646.46 | 406.81 | 625.43 | 16.14 | 651.03 | 583.85 |
| Real Estate | 170.80 | 20.92 | 203.05 | 124.01 | 187.51 | 3.28 | 194.48 | 180.42 |
| Utility | 615.56 | 66.61 | 715.85 | 454.10 | 644.09 | 10.24 | 675.89 | 619.78 |
| S&P 500 | 2924.42 | 307.47 | 3386.15 | 2237.40 | 3099.27 | 112.62 | 3329.62 | 2887.61 |
| Panel B: Daily News Sentiment Index | ||||||||
| Daily News Sentiment Index | −0.28 | 0.23 | 0.15 | −0.49 | 0.02 | 0.13 | 0.26 | −0.23 |
Table 2.
Test Results for Daily News Sentiment Index.
| Lag 0 | Lag 1 | Lag 2 | Lag 3 | |||||
|---|---|---|---|---|---|---|---|---|
| Correlation | t-Statistics | Correlation | t-Statistics | Correlation | t-Statistics | Correlation | t-Statistics | |
| Communication Services | 0.8105 | 12.6048 | 0.7992 | 12.0398 | 0.7838 | 11.3581 | 0.7691 | 10.7629 |
| Consumer Discretionary | 0.7794 | 11.3332 | 0.7709 | 10.9600 | 0.7594 | 10.5059 | 0.7481 | 10.0830 |
| Consumer Staples | 0.8222 | 13.1590 | 0.8207 | 13.0053 | 0.8144 | 12.6328 | 0.8089 | 12.3071 |
| Energy | 0.9395 | 24.9940 | 0.9362 | 24.1262 | 0.9293 | 22.6388 | 0.9216 | 21.2333 |
| Financial | 0.9543 | 29.0779 | 0.9573 | 29.9874 | 0.9563 | 29.4378 | 0.9545 | 28.6152 |
| Health Care | 0.5762 | 6.4231 | 0.5550 | 6.0416 | 0.5292 | 5.6135 | 0.5061 | 5.2479 |
| Industrials | 0.9482 | 27.1922 | 0.9495 | 27.4079 | 0.9481 | 26.8230 | 0.9463 | 26.1878 |
| Information Technology | 0.7089 | 9.1556 | 0.6955 | 8.7660 | 0.6778 | 8.2963 | 0.6605 | 7.8687 |
| Materials | 0.8526 | 14.8659 | 0.8453 | 14.3241 | 0.8354 | 13.6773 | 0.8256 | 13.0874 |
| Real Estate | 0.8638 | 15.6178 | 0.8732 | 16.2221 | 0.8787 | 16.5676 | 0.8820 | 16.7414 |
| Utility | 0.8706 | 16.1210 | 0.8809 | 16.8500 | 0.8862 | 17.2177 | 0.8892 | 17.3865 |
Note: All test results are significant at the 1% significant level.
Table 3.
Results from time series regression model (3).
| Lag 0 | Lag 1 | Lag 2 | Lag 3 | R2 | |||||
|---|---|---|---|---|---|---|---|---|---|
| (Standard Error) ** | p-Value | (Standard Error) | p-Value | (Standard Error) | p-Value | (Standard Error) | p-Value | ||
| Communication Services | 0.1329 (0.0758) | 0.0420 * | −0.1730 (0.1722) | 0.1591 | 0.0668 (0.1605) | 0.3393 | −0.0125 (0.0536) | 0.4082 | 0.1832 |
| Consumer Discretionary | 0.0570 (0.0667) | 0.1978 | −0.2224 (0.1541) | 0.0767 | 0.1792 (0.1462) | 0.1121 | −0.0498 (0.0494) | 0.1584 | 0.1982 |
| Consumer Staples | 0.0453 (0.0905) | 0.3089 | −0.1385 (0.2173) | 0.2630 | 0.0978 (0.2058) | 0.3180 | −0.0244 (0.0693) | 0.3628 | 0.1921 |
| Energy | 0.4797 (0.0265) | 0.0115 * | 0.3322 (0.0966) | 0.0424 * | 0.3690 (0.4593) | 0.2122 | −0.0583 (0.1521) | 0.3512 | 0.1111 |
| Financial | 0.0941 (0.0526) | 0.0390 * | 0.0179 (0.0317) | 0.0412* | 0.1057 (0.1246) | 0.1995 | −0.0030 (0.0414) | 0.4708 | 0.1197 |
| Health Care | 0.0264 (0.0711) | 0.3560 | 0.0934 (0.1709) | 0.2933 | −0.0523 (0.1631) | 0.3746 | 0.0006 (0.0546) | 0.4955 | 0.1167 |
| Industrials | 0.1124 (0.0727) | 0.0433 * | −0.1413 (0.1720) | 0.2072 | 0.2460 (0.1628) | 0.0677 | −0.1005 (0.0542) | 0.0339 * | 0.1835 |
| Information Technology | −0.0081 (0.0501) | 0.4359 | −0.0303 (0.1232) | 0.4032 | −0.0281 (0.1177) | 0.4062 | 0.0216 (0.0396) | 0.2936 | 0.1683 |
| Materials | 0.0538 (0.0703) | 0.2233 | −0.0478 (0.1685) | 0.3889 | 0.0446 (0.1591) | 0.3901 | 0.0101 (0.0541) | 0.4260 | 0.1275 |
| Real Estate | 0.0573 (0.1172) | 0.3130 | 0.2176 (0.2850) | 0.2239 | −0.2972 (0.2708) | 0.1381 | 0.1467 (0.0930) | 0.0596 | 0.1058 |
| Utility | 0.0547 (0.1461) | 0.3546 | 0.1374 (0.3526) | 0.3489 | −0.2030 (0.3349) | 0.2732 | 0.1079 (0.1137) | 0.1730 | 0.2159 |
Note: ** The standard errors are obtained by the Newey-West [27] procedure. * indicates significant coefficient at the 5% significance level.
Table 4.
Industry classification based on the empirical results.
| Measures of COVID-19 Sentiment | Correlation Level | |||
|---|---|---|---|---|
| High (Correlation Range) | Middle (Correlation Range) | Low (Correlation Range) | ||
| DNSI | Fin., Enr., Ind. | CS., CD., CSt., IT., Mat., RE., Utl. | HC. | |
| US Google Searches | “coronavirus” | CS., CD., IT. () | CSt., Eng., HC., Ind., Mat., RE. () | Fin., Utl. () |
| “laid off” | CS., CD. () | CSt., Eng., HC., Ind., IT., Mat., RE. () | Fin., Utl. () | |
| “unemployment” | Fin., Ind. () | CS., CD., CSt., Eng., Mat., RE., Utl. () | HC. IT. () | |
| “recession” | CD., HC., IT. () | CS., CSt., Eng., Ind., Mat., RE. () | Fin., Utl. () | |
| “vaccine” | Eng., Fin., Ind., Mat. () | CS., CD., CSt., RE., Utl. () | HC., IT. () | |
Note: CS.: Communication Service; CD.: Consumer Discretionary; CSt.: Consumer Staples; Eng.: Energy; Fin.: Financial; HC.: Health Care; Ind.: Industrials; IT.: Information Technology; Mat.: Materials; RE.: Real Estate; Utl.: Utilities.
© 2020 by the author. Licensee MDPI, Basel, Switzerland. This article is an open access article distributed under the terms and conditions of the Creative Commons Attribution (CC BY) license (http://creativecommons.org/licenses/by/4.0/).
Share and Cite
MDPI and ACS Style
Lee, H.S. Exploring the Initial Impact of COVID-19 Sentiment on US Stock Market Using Big Data. Sustainability 2020, 12, 6648. https://doi.org/10.3390/su12166648
AMA Style
Lee HS. Exploring the Initial Impact of COVID-19 Sentiment on US Stock Market Using Big Data. Sustainability. 2020; 12(16):6648. https://doi.org/10.3390/su12166648
Chicago/Turabian StyleLee, Hee Soo. 2020. "Exploring the Initial Impact of COVID-19 Sentiment on US Stock Market Using Big Data" Sustainability 12, no. 16: 6648. https://doi.org/10.3390/su12166648
Note that from the first issue of 2016, this journal uses article numbers instead of page numbers. See further details here.