Article

Seeing Impacts of Park Design Strategies on Local Economy through Big Data: A Case Study of Gyeongui Line Forest Park in Seoul

Urban Research Division, Korea Research Institute for Human Settlements, 5 Gukchaegyeonguwon-ro, Sejong-si 30149, Korea
Sustainability 2020, 12(17), 6722; https://doi.org/10.3390/su12176722
Submission received: 13 July 2020 / Revised: 12 August 2020 / Accepted: 13 August 2020 / Published: 19 August 2020
(This article belongs to the Section Sustainable Urban and Rural Development)

Abstract

:
Although big data has emerged as a crucial data source in urban studies, urban park-related studies still rarely use data such as that from card transactions. This study fills the gap between big data and park studies by using card transaction data within 400 m of the Gyeongui Line Forest Park in terms of economic benefits on local business. The authors divided the linear park into five sections according to each section’s design strategy to examine the relationship between the design features and card transaction behaviors. With the data, the authors analyzed the average ages of card users to understand average users’ age in each section. Results show the average ages increased from 2015 to 2017 in Sections 3–5 by years. Sections 1 and 2 describe decreasing of user ages by year, which means young generations visited Sections 1 and 2 For Section 1, amounts of average card transaction also increased from 2015 to 2017 continuously. Compared to other sections, only Section 1, as an open space within a commercialized area, contributed to local business positively. Other sections, such as 2–5, represented the negative impacts on local business from 2016 to 2017.

1. Introduction

There are many studies for identifying the impacts of building a park on property values of adjacent areas. Some studies coined the term “the growth machine” to describe this trend and accentuate the role of a park, especially an urban park, in economic growth [1]. Researchers have used a hedonic pricing model to estimate the premium values of adjacent areas near an urban park [2,3,4]. Additionally, researchers have estimated the value of a park by calculating the price of vegetation and elements in an urban park [5]. Though these studies have proven the economic benefits of a park, researchers rarely study the economic benefits of a park on the local business scale because of the difficulties of collecting data.
One of the reasons why the economic benefits of parks were difficult to estimate locally was because of the data scale. Data in the big data era have the potential to make this possible. For example, in the case of card sales data, variables such as the number of times a person consumes, the amount of consumption, and the time of consumption are shown in units of “place”. This has the potential to newly measure the economic benefits of parks.
Card transaction data has been used to identify consumer behavior [6] and compare the differences between race, gender, and age [7]. Card transaction data has been cumulated spontaneously and its impacts on economic activity has been analyzed by the diffusion of innovation theory (DOI). Roger introduced the DOI concept in 1961 and it explains an innovative interpersonal networks [8]. Focusing on the differences between races, Medina and Chau explored the differences between Anglos and Mexican Americans in their card usage behavior [7]. Among the studies related to card transaction data, there are a few studies which configured the relationship between places and card usage behavior.
This study attempts to understand the impact of Gyeongui Line Forest Park on the surrounding economy by using previously available card transaction data. In particular, by dividing the linear park into five units taking into account the time of opening and design features, and comparing the economic impacts of the same time period, the impact of the park design strategy on the local economy will be examined separately. The purpose of this study is to: (1) know how parks affect the local economy, (2) know how park design affects the local economy, and (3) know how to use card sales data. This study is organized in the following order. A theoretical reviews and studies on parks’ benefits include economic benefits. The methodology divides the park into five sections and analyzes each design. The card sales data will be analyzed and compared by section.

2. Literature Review

2.1. Benefits of Urban Parks

On the topic of the benefits of urban parks, many studies have been conducted to verify their functions and roles in cities. Basically, the benefits of urban parks can be divided into several categories. Some studies divided the benefits into direct and indirect benefits [9,10]; other studies used on-site and off-site benefits depending on the causes of the benefits [11,12]; and many other studies divided the benefits into three aspects [13,14]: (1) economic, (2) social, and (3) environmental benefits. Since environmental benefits from urban parks are already verified in various studies, this literature review will be focused on economic and social benefits instead of environmental benefits and their evaluation models.

2.1.1. Economic Benefits

The economic benefits from urban parks can be considered in two ways: one is the economic value of an urban park itself, and the other is the value that is generated by urban parks. For the first one, on-site value, researchers have studied its evaluation by using hedonic pricing, contingent models, and travel costs. These models were developed to evaluate the non-market value (Figure 1).
Economists use travel costs and contingent valuation. As an economic value of the benefits, travel cost assumes an equal cost of travel and measures traveled distances to visit parks. Travel cost estimates prices of urban parks on the basis of the amount of money necessary to travel to them. This method is used when market prices are not available. The important feature of the travel cost model is that the costs of travel to a site are a metric for the monetary value of the site [11].
Contingent valuation asks park users how much money they are willing to pay (WTP) for specified benefits from an urban park. Willingness to pay is a way to measure the economic cost a user is willing and able to pay for goods or services [11].
Further, Stevens and Allen explain methods that can be used to evaluate urban parks’ value, and evaluate four parks by using a hedonic pricing model [12]. They divide the benefits of urban parks into two classes based on the source of the benefits: on-site and off-site benefits, and assert the advantages of a hedonic model. According to their study, a hedonic model has two advantages: (1) it captures the value of external benefits and costs, (2) it is based on actual transaction data [12]. On-site benefits are generated directly by using the park, and off-site benefits accrue to people outside the park. The hedonic pricing model infers the park’s benefits from a non-market resource from the prices of associated goods that are traded in the market.
How can we then evaluate the success of the redevelopment of transportation infrastructure into urban parks? The success of redevelopment projects can be measured by using cost-benefit analysis. Cost-benefit analysis (CBA) estimates the monetary value of the benefits and costs to conclude whether the project is worthwhile [15] and can be a useful way to evaluate non-market goods such as ecosystems [16]. To conduct CBA for evaluation of redevelopment projects, verification of benefits is also important. Benefits can be divided into three categories: economic [17,18,19], environmental [20,21], and social [22,23].
Many studies have tried to verify economic benefits from redevelopment of transportation infrastructure into urban parks, and most studies have used the hedonic pricing model which was invented to evaluate environmental metrics on property values [12,24]. For example, Tajima estimates the economic benefits of the Big Dig in Boston through hedonic pricing methods [25]. The Big Dig was a mega-scale redevelopment project that turned an elevated highway into an underground expressway and opened a park on the surface. As a result, he finds a negative relationship between parks and property prices and a positive coefficient between the distance from the highway and property prices [25].
Levere, an economist from UC San Diego, who assessed the High Line’s impact on house prices using home sales and property valuations, estimates that, in 2010 alone, the city gained $100 million in property tax increases as a result of the High Line [26]. Kang and Cervero investigated changes in land values for properties resulting from the Cheonggyecheon restoration project, which replaced old overpass with an urban park and verified the increase in land values compared to before the construction [27]. They used property address, land use, assessed land value, and property shape, slope and level of road access, and conducted multilevel hedonic models to estimate the impact of the project on the urban environment. Property values increased and the value added depended on the distance from the park [27]. This study shows that an urban park which was redeveloped on a highway can be a trigger to increase property values.

2.1.2. Social Benefits

Many studies have researched the role of urban parks as an important space to increase the quality of daily life of urbanized society. Empirical evidence supports that urban parks, green ways, and urban forests in urban contexts improve the quality of life in many ways. Further, in addition to environmental benefits such as reducing pollution, urban parks contribute to improve health, enhance social interactions, and provide peacefulness. Ulrich, for example, compares psychophysiological reactions toward three landscapes: vegetation, water, and urban [27,28,29,30,31]. By using metrics which represent physiological and psychological measures, he found that vegetation and water landscapes had more beneficial influences on people’s psychological stages in feeling positive effects [30].
Chiesura states that urban parks provide social and psychological benefits and enrich our lives with meaning and emotions. She verifies the experience of nature is a source of positive feelings by investigating how people’s emotions are involved in urban green spaces [29]. Coley, Sullivan, and Kuo verify that urban parks encourage social interactions among residents and contribute to social integrations [32]. Their findings offer that natural elements increase opportunities for social interactions, using outdoor places to promote communication within neighborhoods [32].
Natural environments can also help people relax, and they also promote social interactions [33]. Kuo et al. show that the presence of urban nature in the inner city generated positive responses from residents. The density of urban nature also increases the sense of safety [33]. Peters, Elands, and Buijs assert that urban parks can be a trigger to generate social interactions by stimulating social cohesion [34]. They use a survey, observations, and interviews to carry out social interaction research in five urban parks in the Netherlands. According to this study, urban parks can promote mingling of different ethnic groups and promote interactions among visitors. These results reinforce that the social benefits of urban parks include social interactions.

2.2. Big Data Analytics in Urban Studies

Based on the attributes of social media data, researchers use it in detecting landscape and land uses, supporting public engagement, and identifying the relationship between people and place. Big data analytics allow us to detect hidden use of urban areas, green spaces, and protected areas. Tu et al. discovered urban functions by using big data [35]. From the data, the authors extracted behaviors of users and identified the time of postings. By doing so, they revealed the use of urban areas by functions such as work and time [35]. Similarly, Chen et al. depicted urban functions by using hot spot analysis with social media data. The authors identified the urban functions and places that emerge as central places [36]. Silva et al. demonstrated using social media data allows us to detect characteristics of each urban area [37]. In urban planning, many studies use social media to find functional areas. Studies in landscape architecture also use social media to detect the ecosystem. Oteros-Rozas et al. examined over a thousand photos from Flickr and Panoramio to identify the relationship between landscape diversity and ecosystem services [38]. Landscape diversity is an important aspect to assess the quality of landscape and cultural ecosystem services refer to benefits of green spaces to people. The authors find a weak and positive relationship between two factors [38]. Social media data provides opportunity to detect soft factors such as the labor market. Batty et al. assert the importance of social media data for understanding the labor and housing market [39].

3. Methods

3.1. Study Site

The Gyeongui Line Forest is a park built on the Gyeongui railroad, which was originally built in 1906 to connect Seoul (South Korea) and Sinuiju (North Korea). In 2005, the city rerouted the railroad underground and announced that they would redevelop the vacant area atop into a park. The project has been completed in three phases: Phases 1 and 2 were opened in 2012 and 2015; Phase 3 was opened in 2016. The Gyeongui Line Forest Road is a park that brings the vitality of the city and the vitality of nature to the useless land left by undergrounding the Gyeongui Line (Yongsan Line). The Gyeongui Line double track railway passes 10–20 m below the park and the airport railway passes 30–40 m below. This road was a traffic route that carried many people and supplies before and after the Gyeongui Line was laid in 1906, so villages and warehouses naturally flourished around the road.
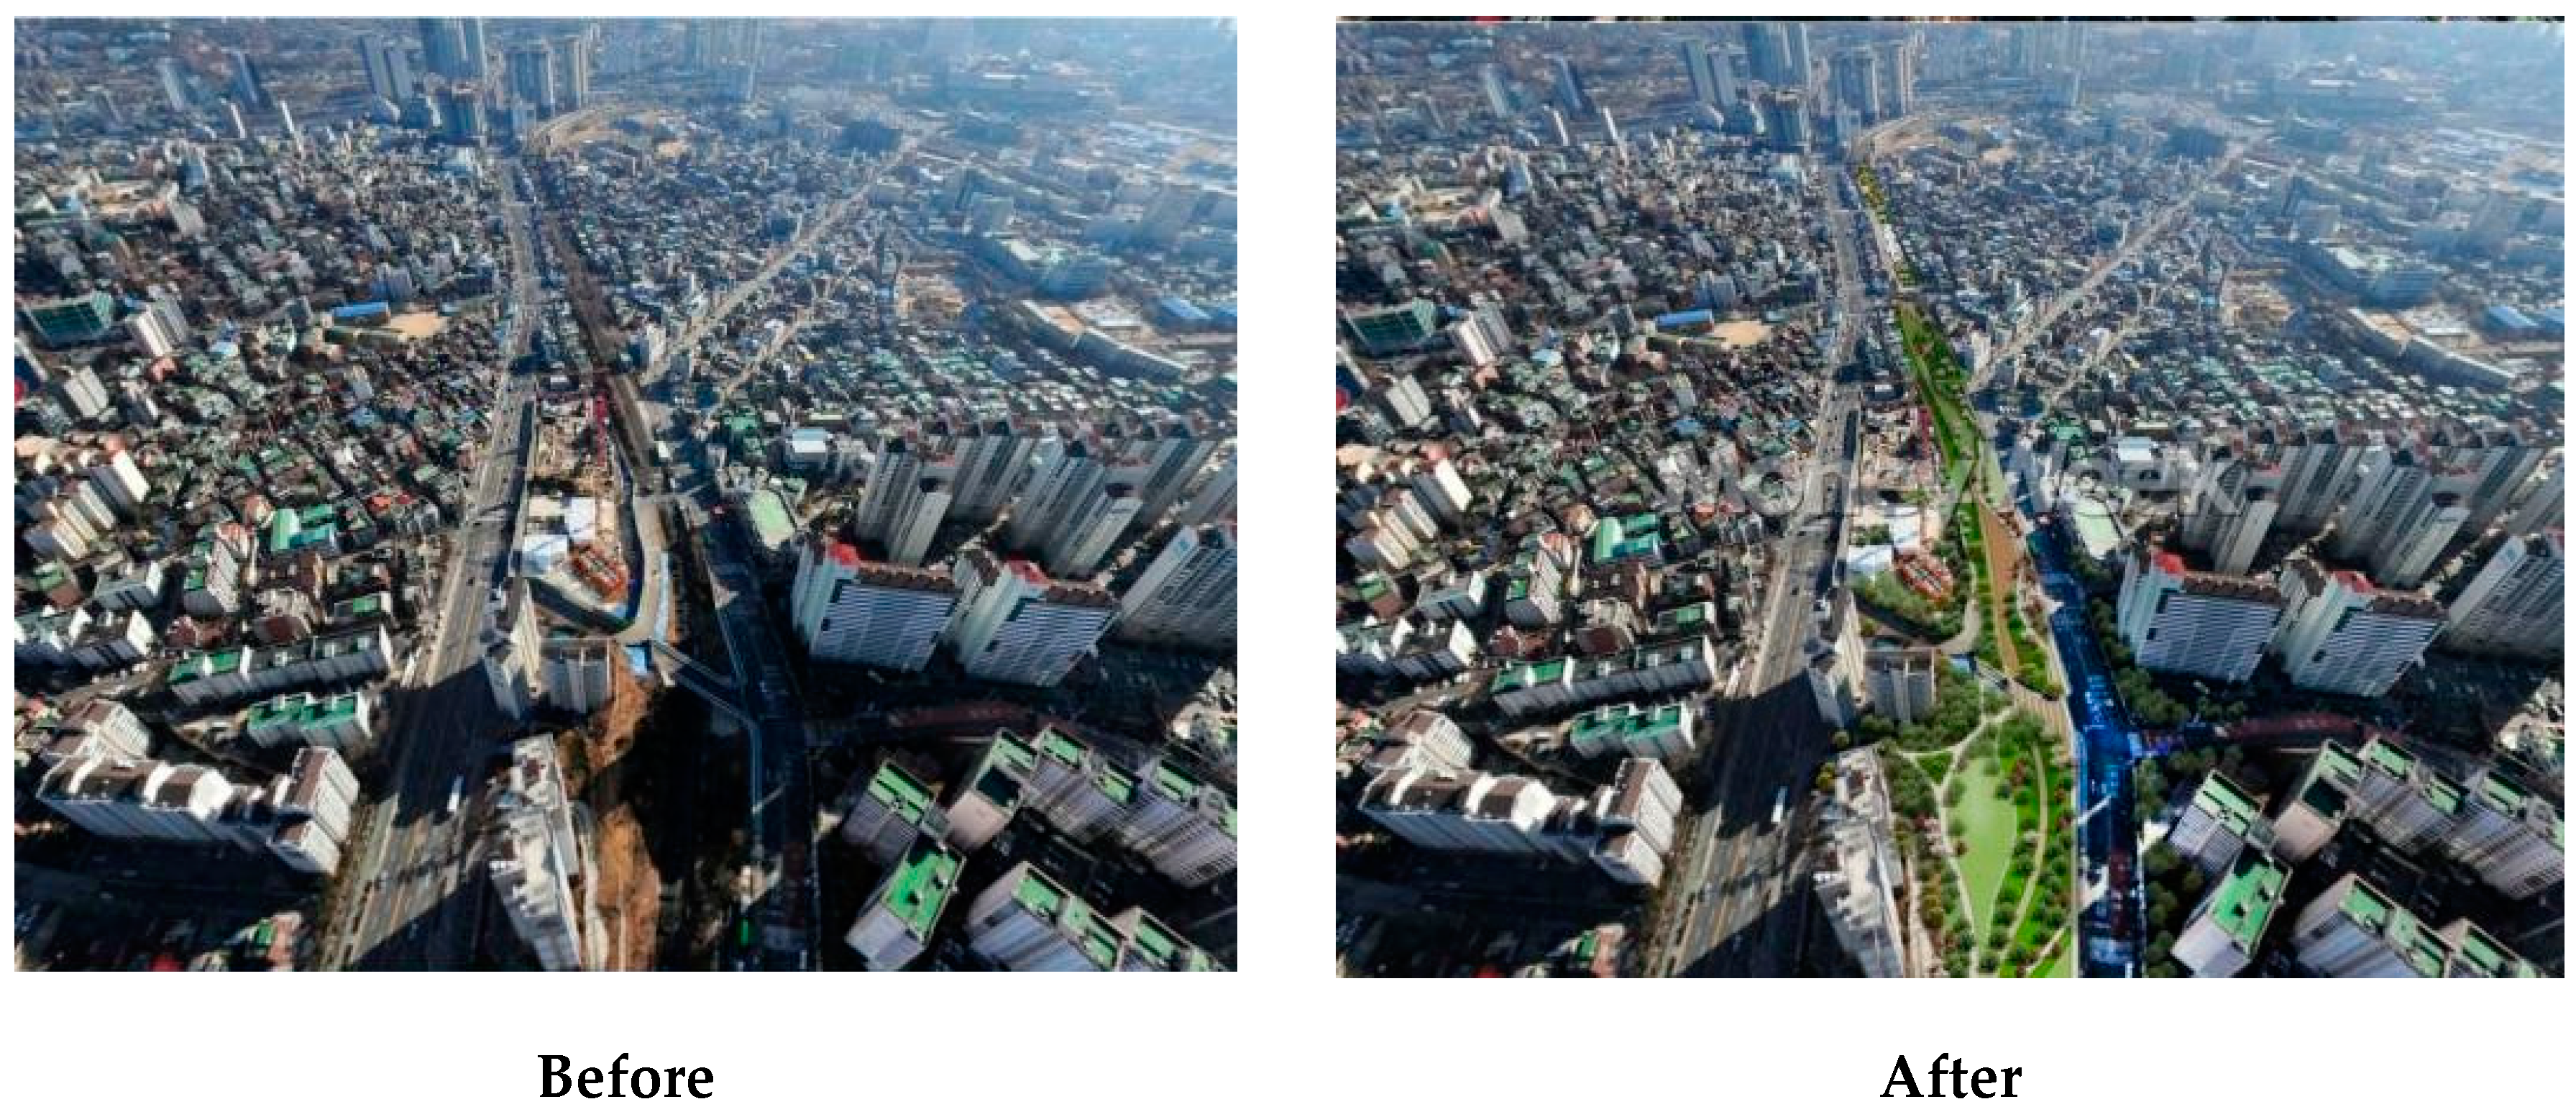
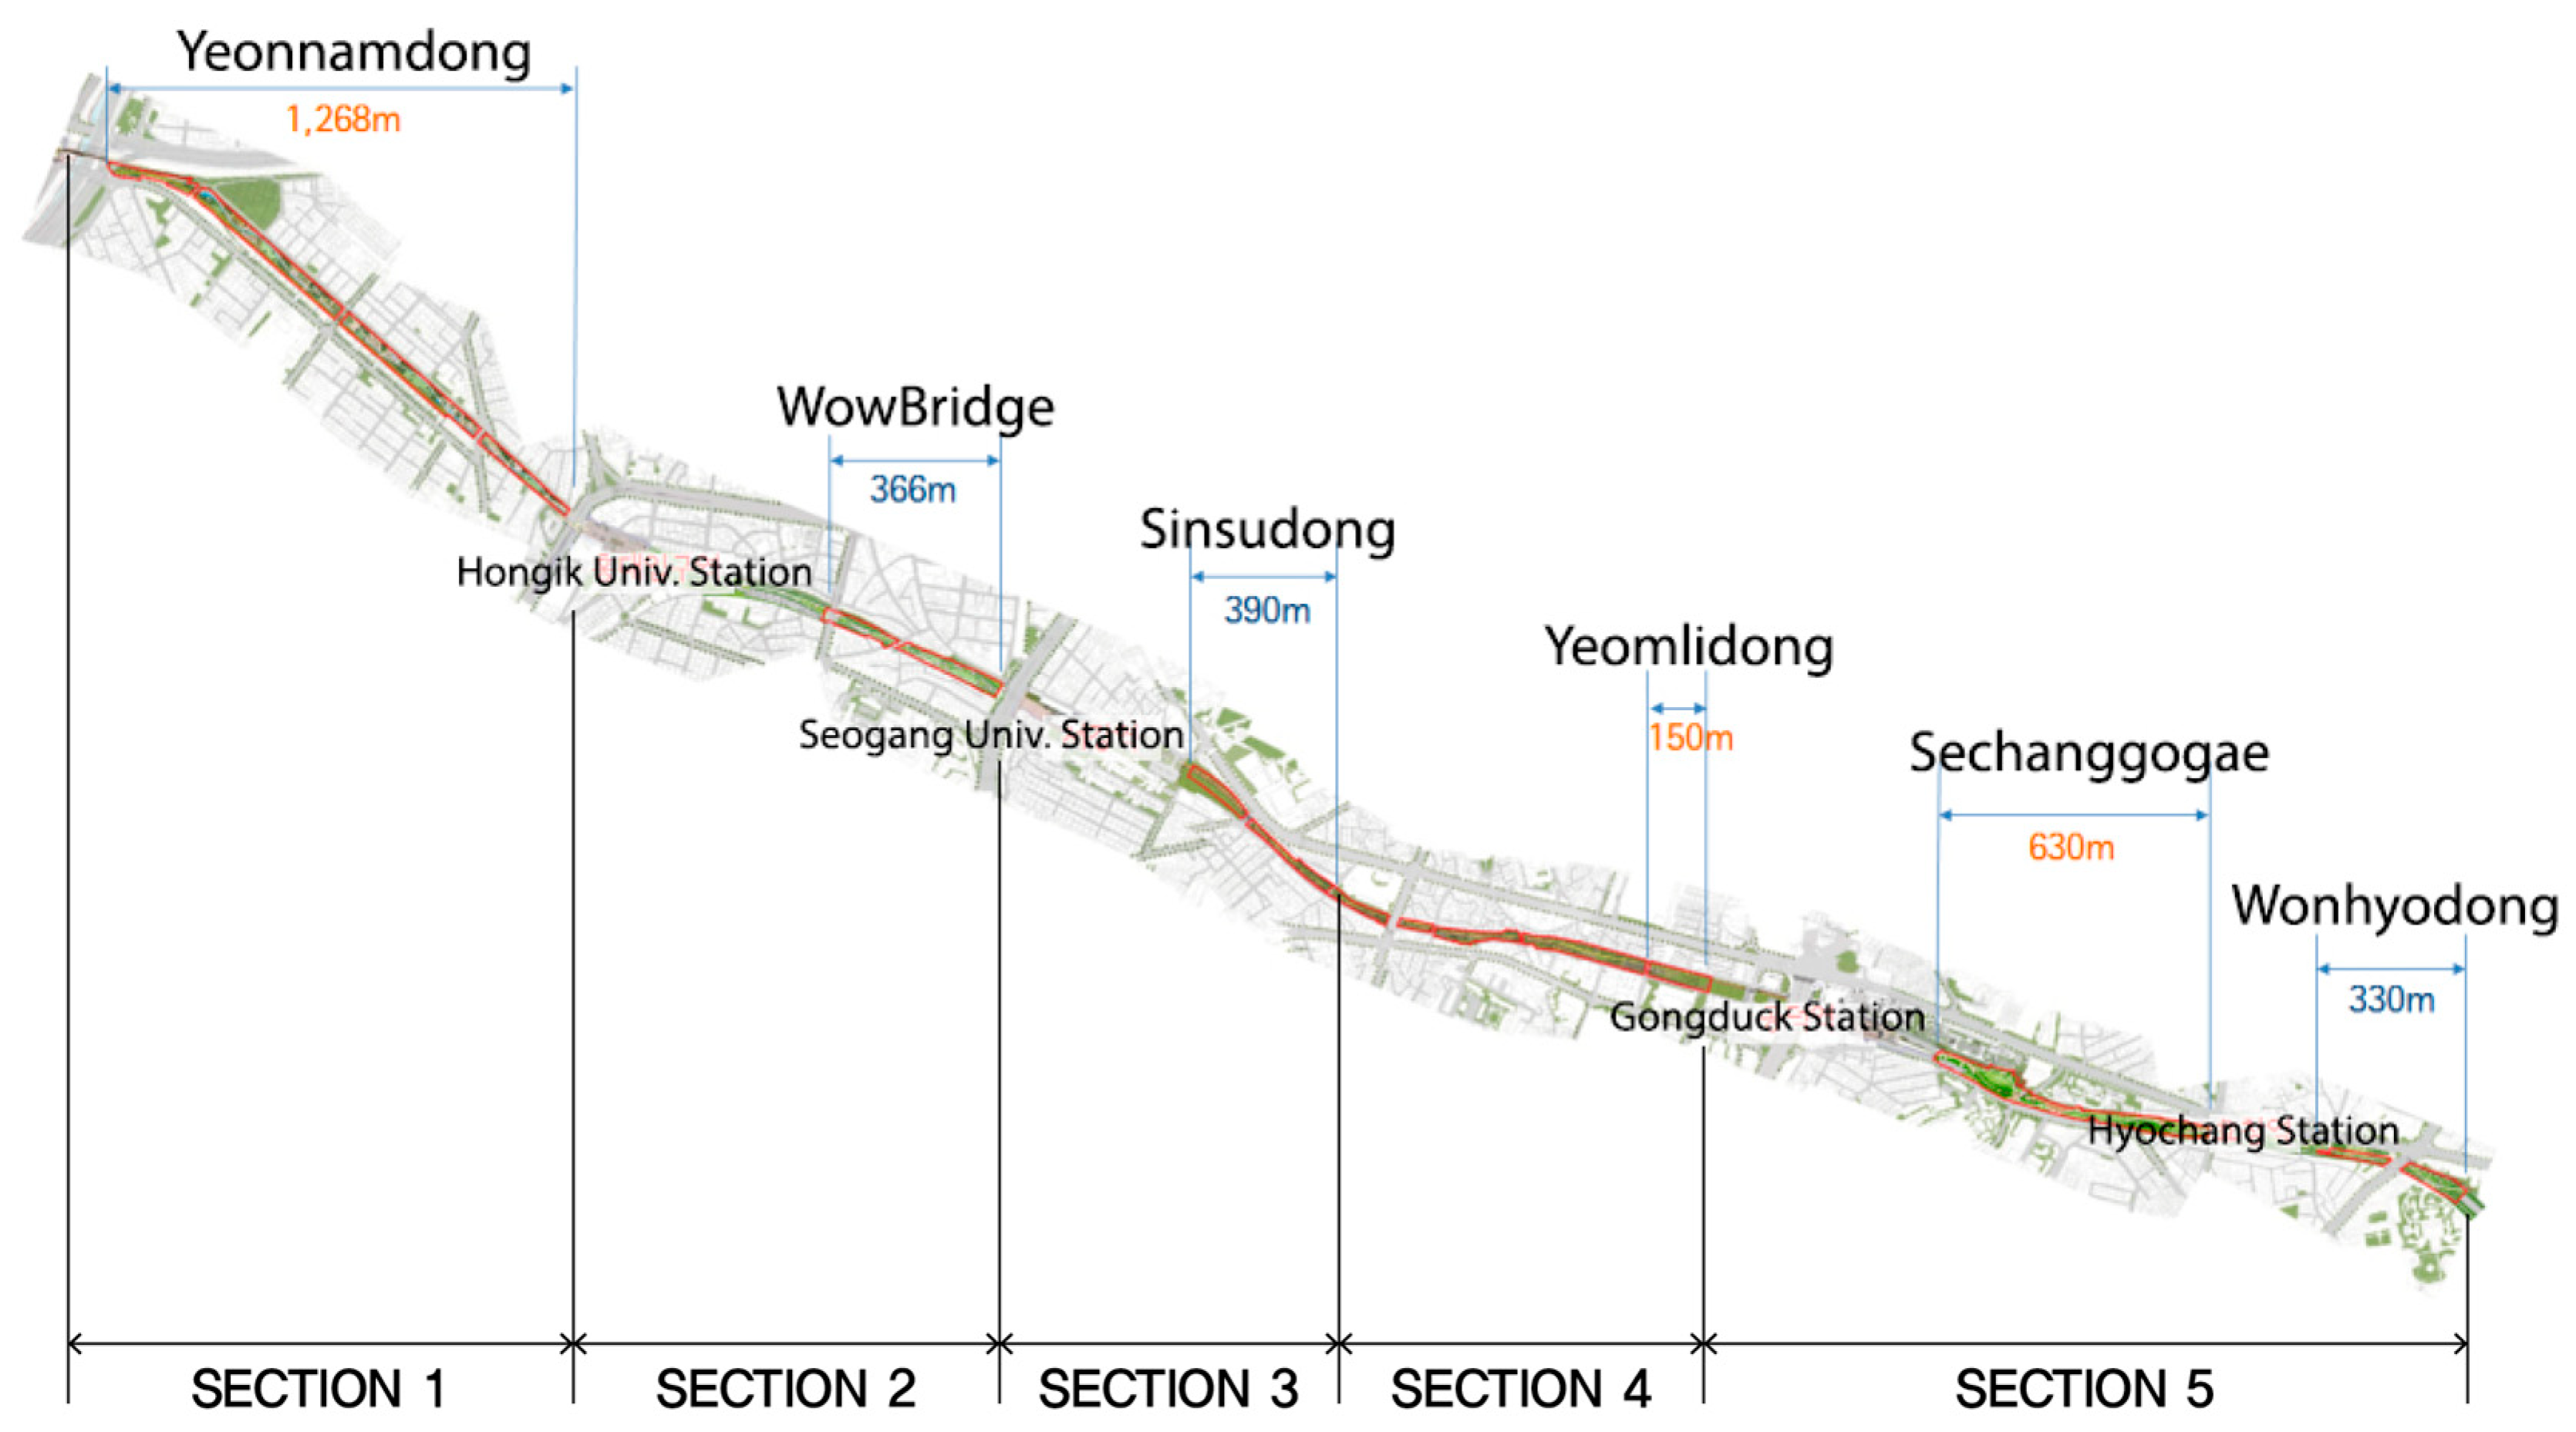
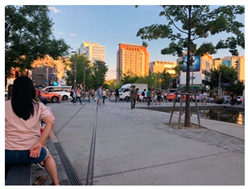
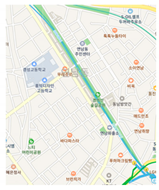
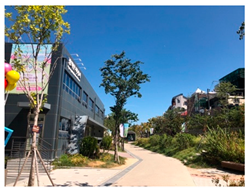
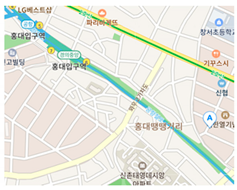
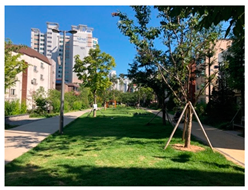
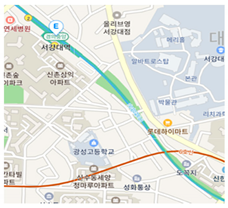
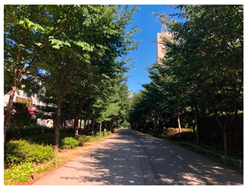
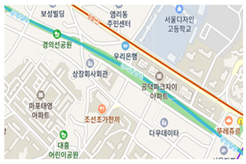
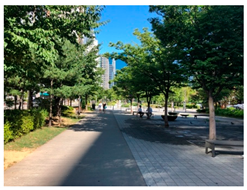
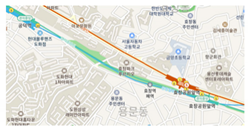
Gyeongui Line Forest Park (Figure 2) can be divided into three phases according to the completed years. In this study, the authors divided three phases into five sections reflecting design features of each section. If explained in order, they are as follows. Section 1 is the Yeonnam-dong section, which was opened in the second phase of Gyeongui Line Forest Park. The hallmark of this section is the city’s open space where you can enjoy picnics and small shops. Section 2 is a book-themed park as part of the Phase 3 plan. There are bookstores in the park that display and sell books. Visitors can walk along the street to view books or buy their own. Section 3 is part of Phase 3 and has been created as a walkway for residents. The promenade, which is characteristic of general linear parks, is the main use. The 4th section is the first phase on Gyeongui Line Forest Park. The design characteristics are similar to those of the 3rd section, but the facility has deteriorated after a long time since its opening. Section 3 and Section 4 cross the residential area. Section 5 takes the form of a small park as part of Phase 3. Located in an office-dense area, this park is a small resting place for office workers (Figure 3).

3.2. Data Collection

The authors collected data about Shin Han Card transaction from Seoul Big Data Campus. The Seoul Big Data Campus provides many kinds of big data such as card transaction data from Shin Han Card, telecommunication data from Korea Telecom, and from Shin Han Card, the number one card in Korea, provides the largest amount of card sales data in Korea. Among the data, the card user’s age, payment amount, number of payments, and payment location were collected from 2015 to 2017. The authors collected the latest three years from 2015 to 2017. The park opened to the public in 2012, 2015, and 2016. When the authors considered the phases of the park, the latest three years were an appropriate period for the study. In terms of the study area, this study included office blocks within 400 m from the park since 400 m is considered as walkable in 5 min [40].

3.3. Data Analytics

This study statistically verified whether design characteristics were drawn by section and card sales data were compared to show significant differences by using R. The factors used in the study are shown in the table. Age was divided into 6 scales from teenagers to 60-year-olds (score 1: 10 s, 2: 20 s, 3: 30 s, 4: 40 s, 5: 50 s). The average payment amount is the average payment amount per person, and it can be seen how much is spent here. The number of payments is divided by the total number of payments, and you can see how many payments are made per average store. Statistical significance was judged by statistically comparing age, average payment amount, and number of payments for each year. The author also visualized the result by using ArcGIS.

4. Results

4.1. Design Features of Each Section

Because of its long length, there are various places and scenery attached to the Gyeongui Line Forest Park (Table 1). Section 1 is the busiest part of the Gyeongui Line Forest Road, the Yeonnam-dong section. This section, which has a large floating population and easy access due to the commercial area in Hongdae, became the best “hot-spot” in Seoul right after its opening, replacing Yeonnam-dong and Yeonhui-dong. As well as on both sides of the park, restaurants, cafes, and pubs flourished in all the surrounding alleys, creating the nickname “Yeontral Park”. Another characteristic of the Yeonnam-dong section is the waterway. In summer, the waterways and ponds turn into outdoor water playgrounds that are hard to see in Seoul. The westernmost section of the Gyeongui Line Forest Road, which passes through Yeontral Park, near the bustling Hongdae Station, and leads to Gajwa Station, is full of gingko trees grown to cool the tall apartments.
In Section 2, scenery of the village next to the train track, lined with shabby and low buildings, unfolds in the section of Wow Bridge that reproduces the crossing scene called Ding Ding Street. In this section with a long “book street”, there are bookstores run by various publishers. There is no place like a small bookstore to thaw frozen feet away from the cold winter wind. A few steps away from Ding Ding, which is also the birthplace of Hongdae’s indie music, design museums, libraries, and small theaters in the Hongdae area invite tired walkers.
Section 3, Daeheung-dong, the first of the Gyeongui Line Forest roads, has a rougher design than the rest of the sections, but in spring, it transforms into an “Insta”-worthy place full of colorful cherry blossoms. Unlike other sections, there are separate bicycle lanes, so there are many cyclers pedaling through Yoshino Cherry and Wild Cherry Forests. In the section of Sinsu-dong in front of Sogang University, there is a sculpture that crosses the railroad tracks and recalls memories of playing on the tracks. In this section, there was a tunnel-shaped artificial stream, Seontongmulcheon, which was created to prevent the flooding of Mapo during the Japanese colonial period. If visitors walk leisurely in this section, which is rare, it is highly likely that they will gravitate to the restaurant of Mapo’s famous charcoal-grilled ribs.
The Section 4, Yeomni-dong section, features the history of an old salt-making village. When visitors leave the Gyeongui Line Forest Road, visitors can see “Sageum-gil” and “Sageum-naru” that make use of the old salt warehouse and market buildings. Office buildings are adjacent to Yeomni-dong, so the park is used as a short but quiet lunch break for office workers. An alternative cultural marketplace called Jeongjang, where performances, exhibitions, and flea markets are frequently held, is immediately attached to this section.
Section 5, where there was a new warehouse in the Joseon Dynasty, Seonhyecheong, had a steeper slope than other sections. This is the place that corresponds to the dragon’s waist in the name Yongsan (Dragon mountain in English). In this wide field of view, you can see the old terrain of Seoul flowing down the Han River. When visitors go up to Baekbeom Bridge, visitors can look down on the scenery behind Seoul just like any observatory. On the eastern end of Wonhyo-ro, which was completed last, there are many traces of the old railroad tracks, and there is a community facility with a small truck and a “small hutch near the train” still exists. If you walk a little further, you will reach Hyochang Park, where Hyochang Stadium and the tombs of Kim Gu, Lee Bong Chang, and Yun Bong Gil are together.

4.2. Age of the Card Users Near the Park

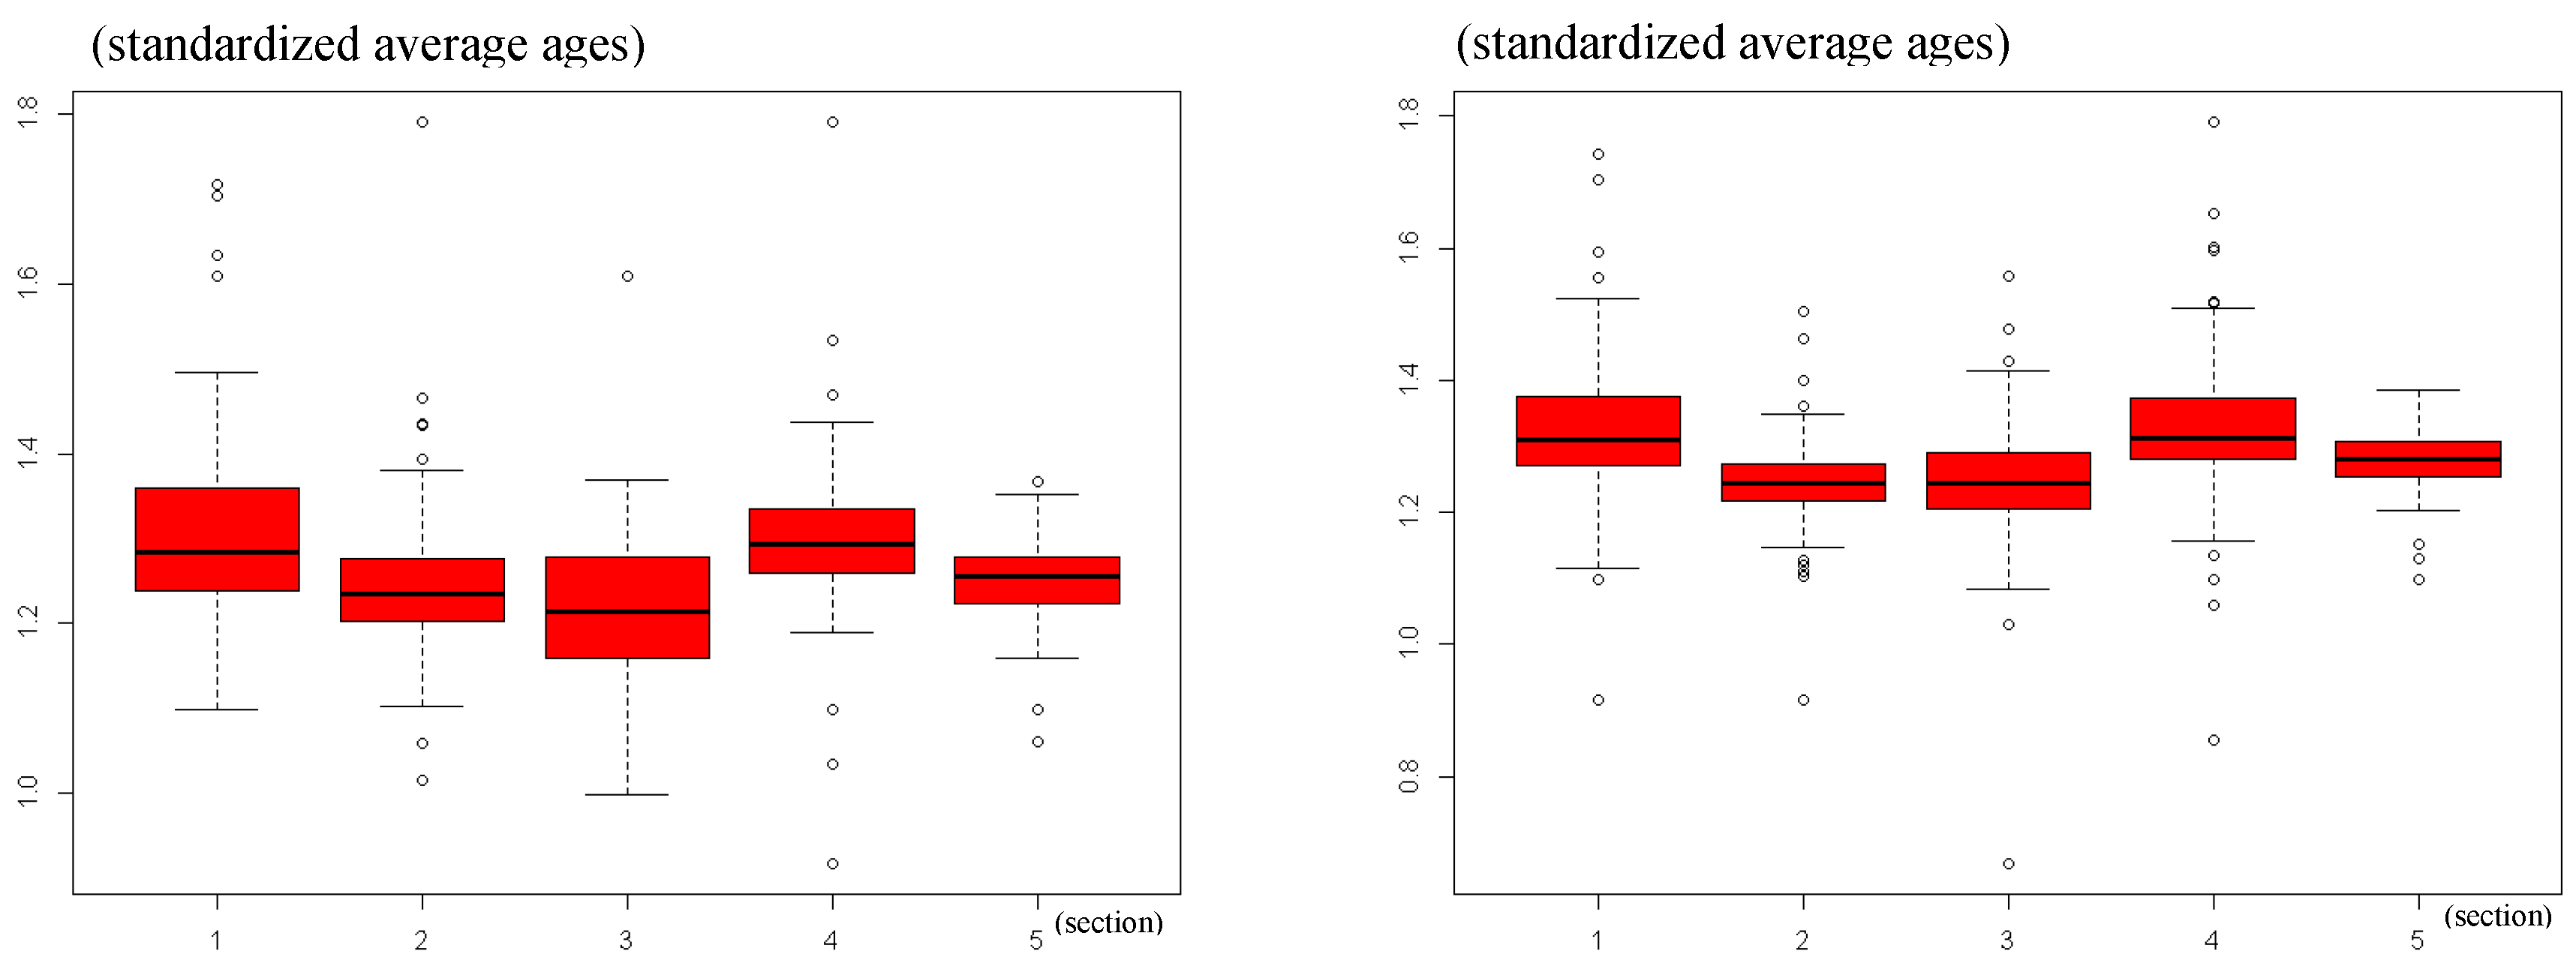
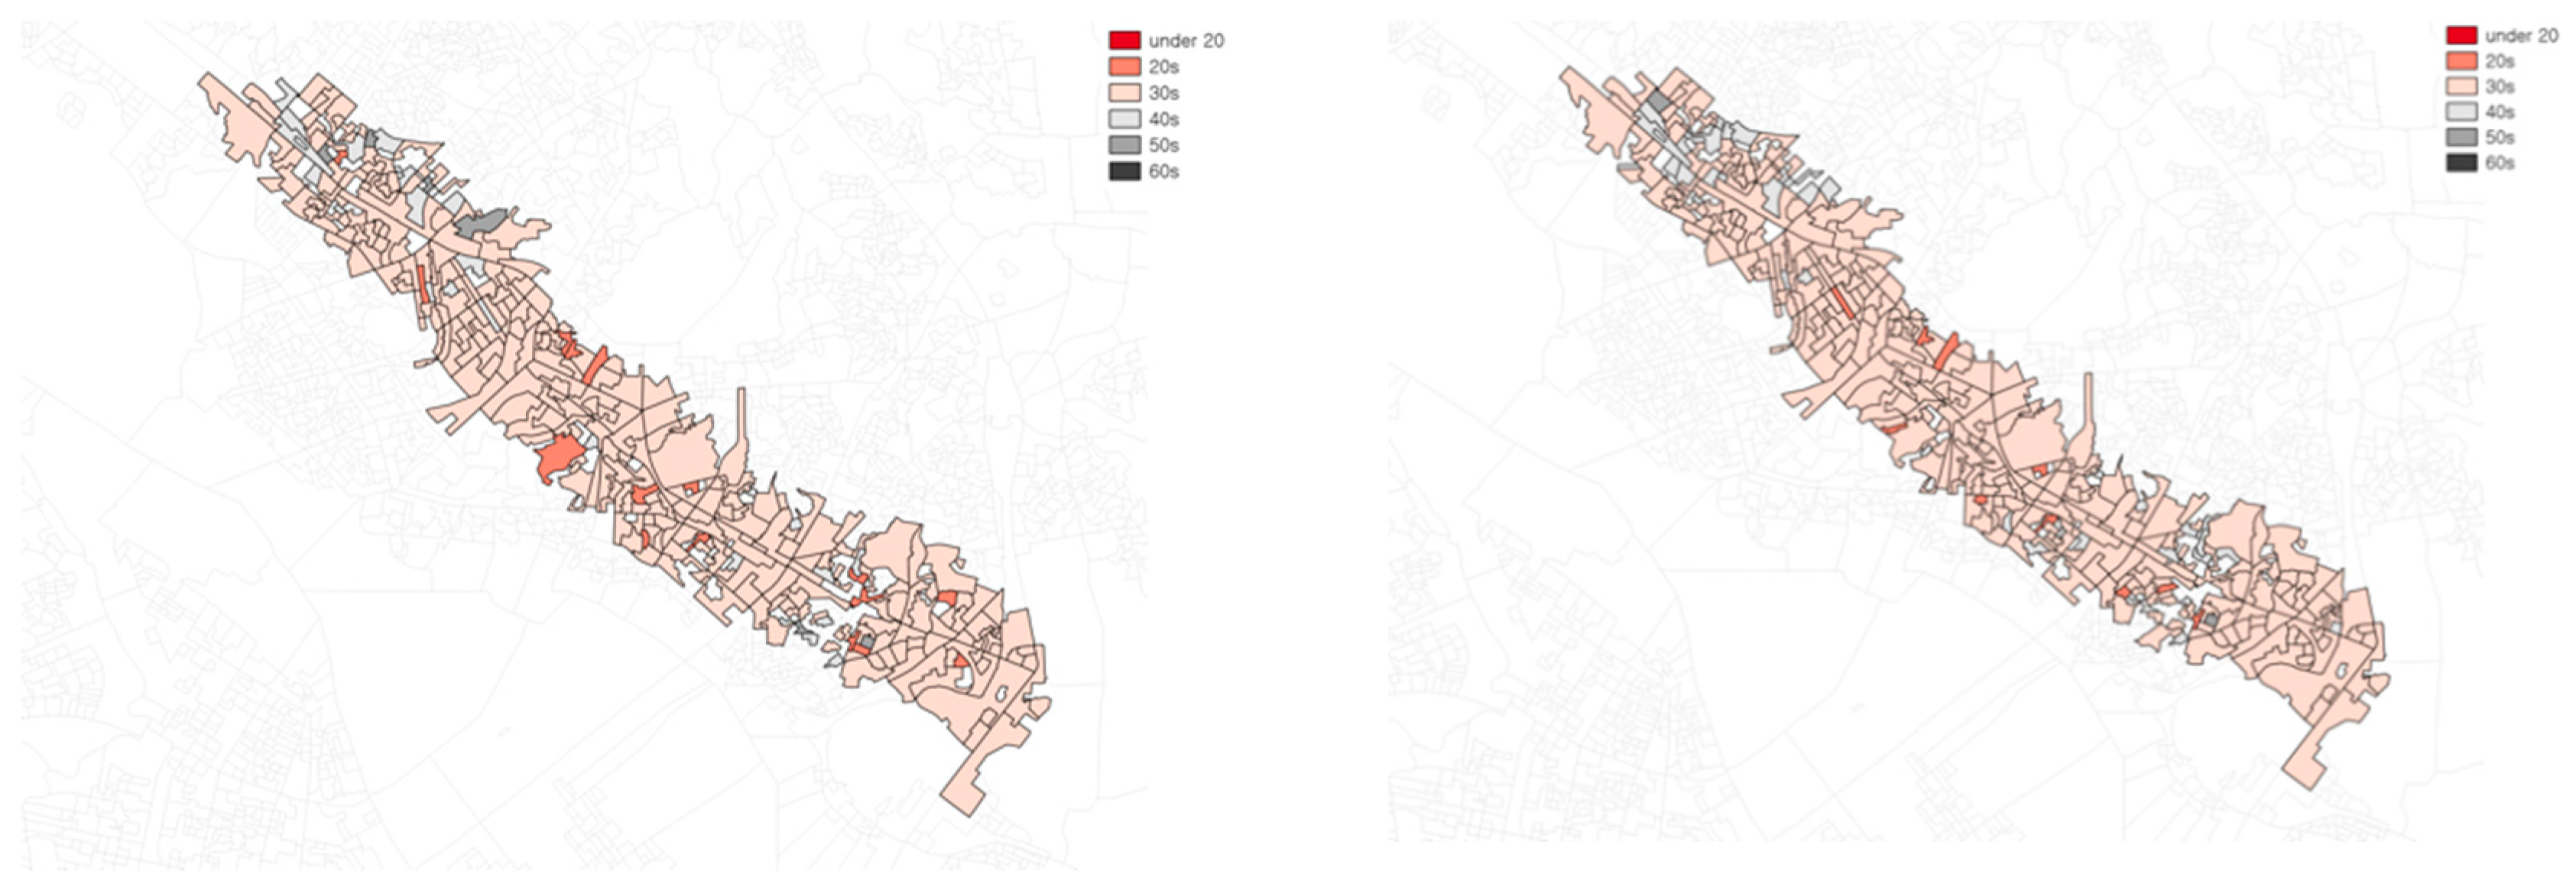
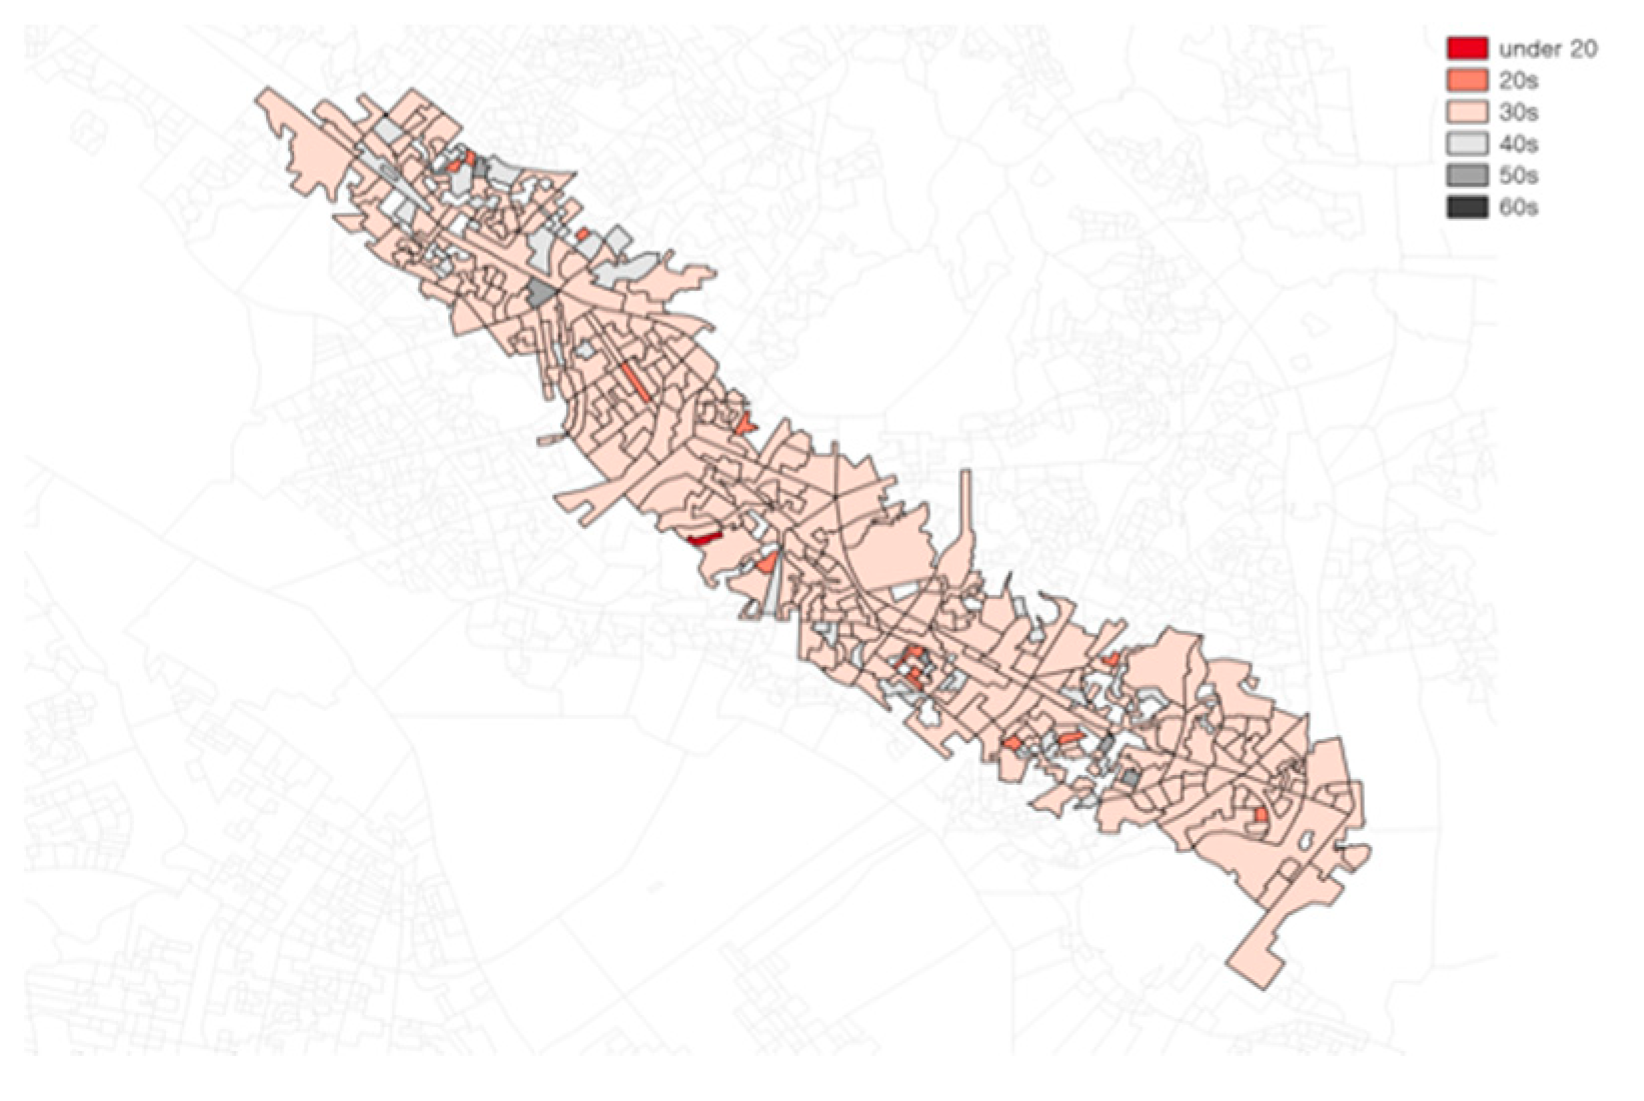
The authors examined the average age of card users from Section 1, Section 2, Section 3, Section 4 and Section 5 from 2015 to 2017 to provide implications about the generations using each section. The authors divided age generations from 20 to 60 into 6 scales from 1 to 6. For instance, 1 means under 20, 2 means ages 20–29 and 6 means over 60 years of age. Table 2 represents the results of age analysis. For Section 1, average age scale is 3.74 in 2015, 3.85 in 2016, and 3.80 in 2017. If the same users continue to regularly use the park, the average age scales have to increase a little bit by years. For instance, the average age of Section 3 increases from 2015 to 2017 (3.40 in 2015, 3.44 in 2016, and 3.49 in 2017). Section 4 and Section 5 also show increased average ages from 2015 to 2017 (Section 4: 3.69 in 2015, 3.72 in 2016, and 3.79 in 2017, Section 5: 3.48 in 2015, 3.54 in 2016, and 3.58 in 2017). However, Section 1 shows a different result from the other sections. In the case of Section 1, the average age scale from 2016 to 2017 shows a decreased age scale from 3.85 to 3.80. It can be considered that the younger generation visited Section 1 more frequently in 2017 than 2016 and it can be also deduced that Section 1 has greater potential to welcome younger generation than other sections. In Section 2, the average age in 2015 was 3.49 and it continuously decreased to 3.46 in 2016. Figure 4 visualizes the differences between average ages of each section by using statistical analysis. Figure 5 and Figure 6 show the differences between ages by each section by using ArcGIS.

4.3. Impacts of the Park on Local Economy

This study uses card transaction data to find out the impact of the park’s design strategy on local business through the average payment amount and the number of payments. As a result of the study, in Section 1, the average payment amount increased yearly and the number of payments increased as well. Section 2 showed that the average payment amount gradually decreased, and the number of payments increased from 2015 to 2016, but decreased from 2016 to 2017. Section 3 and Section 4 show a similar trend. Section 3 and Section 4 can be judged to have a positive impact on the economy as the average payment amount increased from 2015 to 2016 and the number of payments increased. However, from 2016 to 2017, the average payment amount decreased and the number of payments decreased. In Section 5, the average payment amount continued to rise. However, the number of payments decreased from 2016 to 2017.
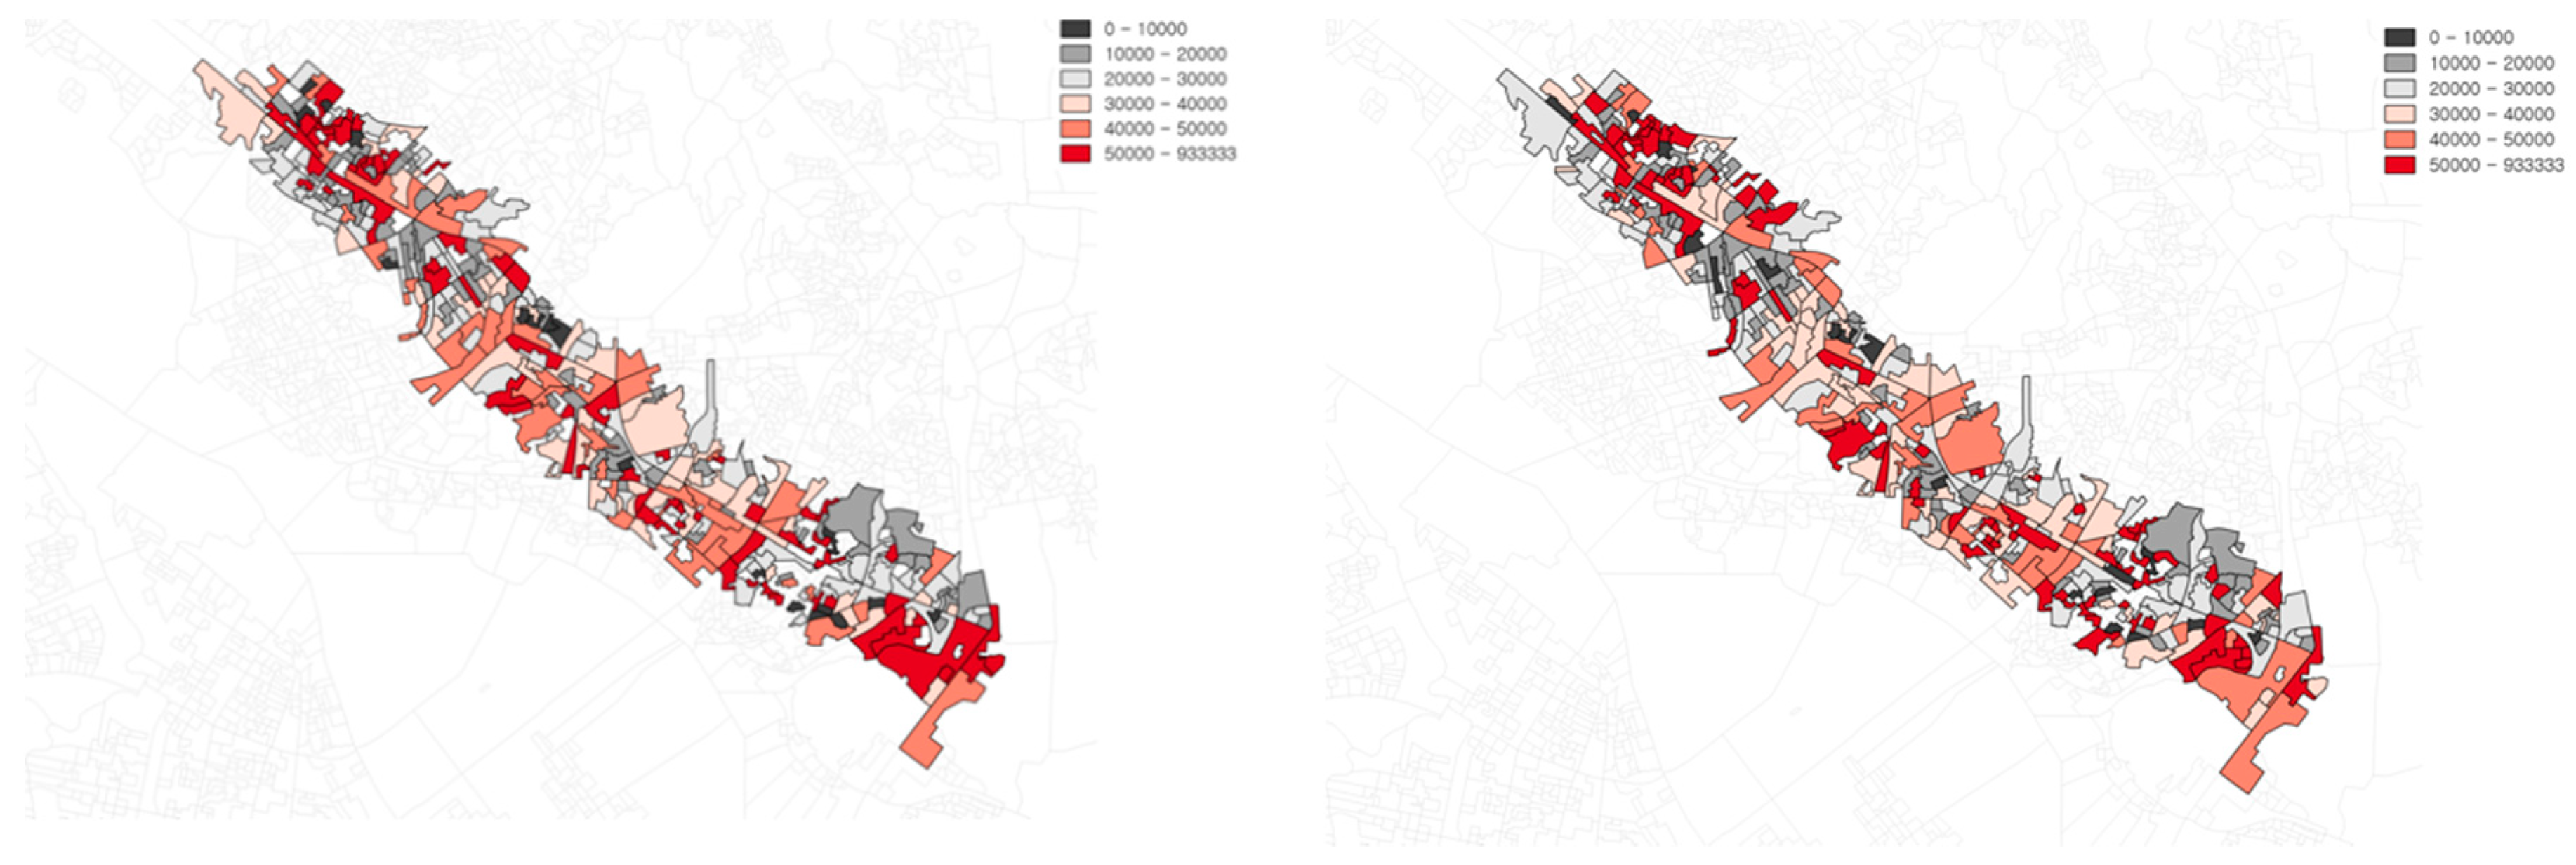
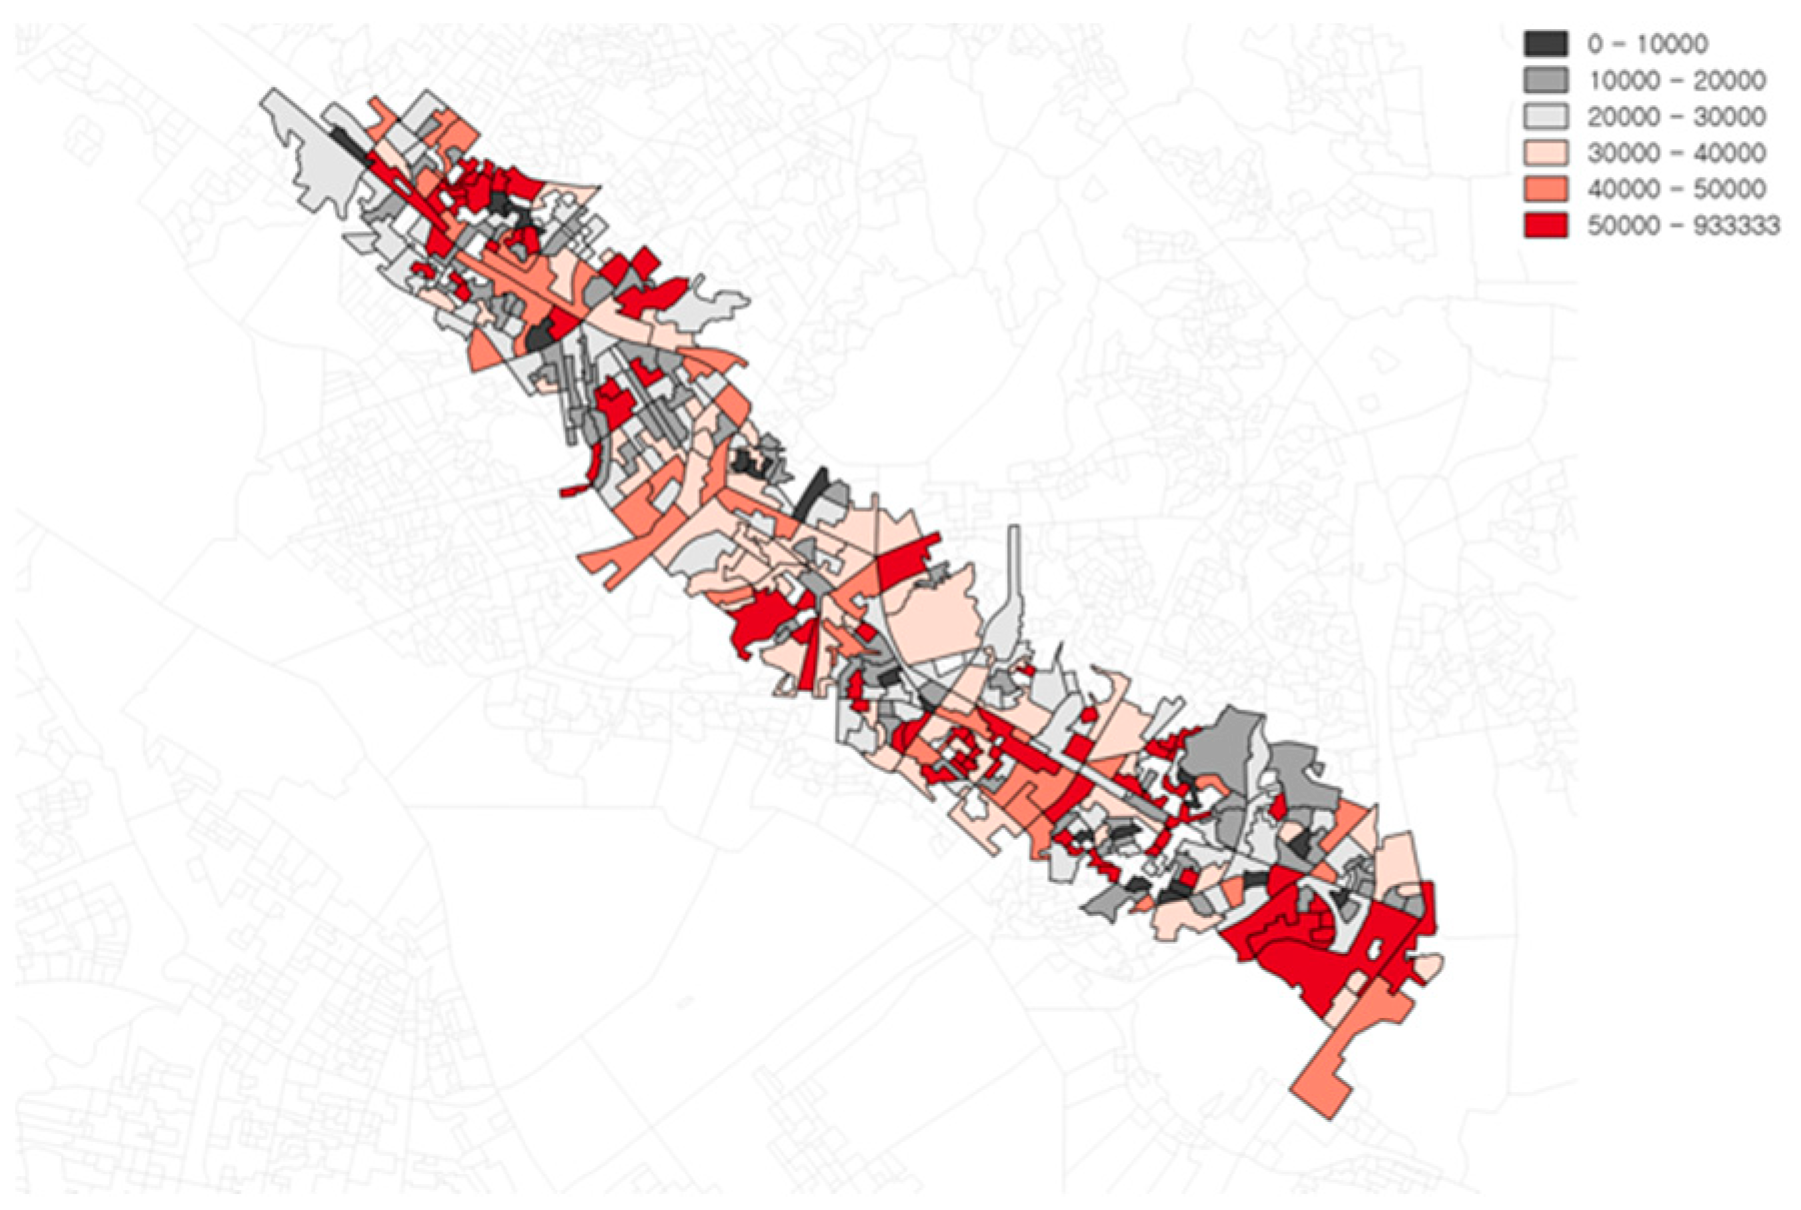
Table 3 represents the changes of the average amount of card transactions from 2015 to 2017 by each section. According to the results, only Section 1 and Section 5 increased the average amount of transactions since 2015. Section 2, Section 3 and Section 4 showed that transactions decreased from 2015 to 2017 in the case of Section 2, or increased from 2015 to 2016 and decreased from 2016 to 2017 in the case of Section 3 and Section 4. It can be considered that open spaces like Section 1 and Section 5 contributed to increase the amount of transaction money exchanged from 2015 to 2017. Compared to enclosed design spaces, card users tended to pay more money near the open spaces. Figure 7 and Figure 8 visualized the transaction changes by using ArcGIS. These figures clearly describe the differences between the sections by years.
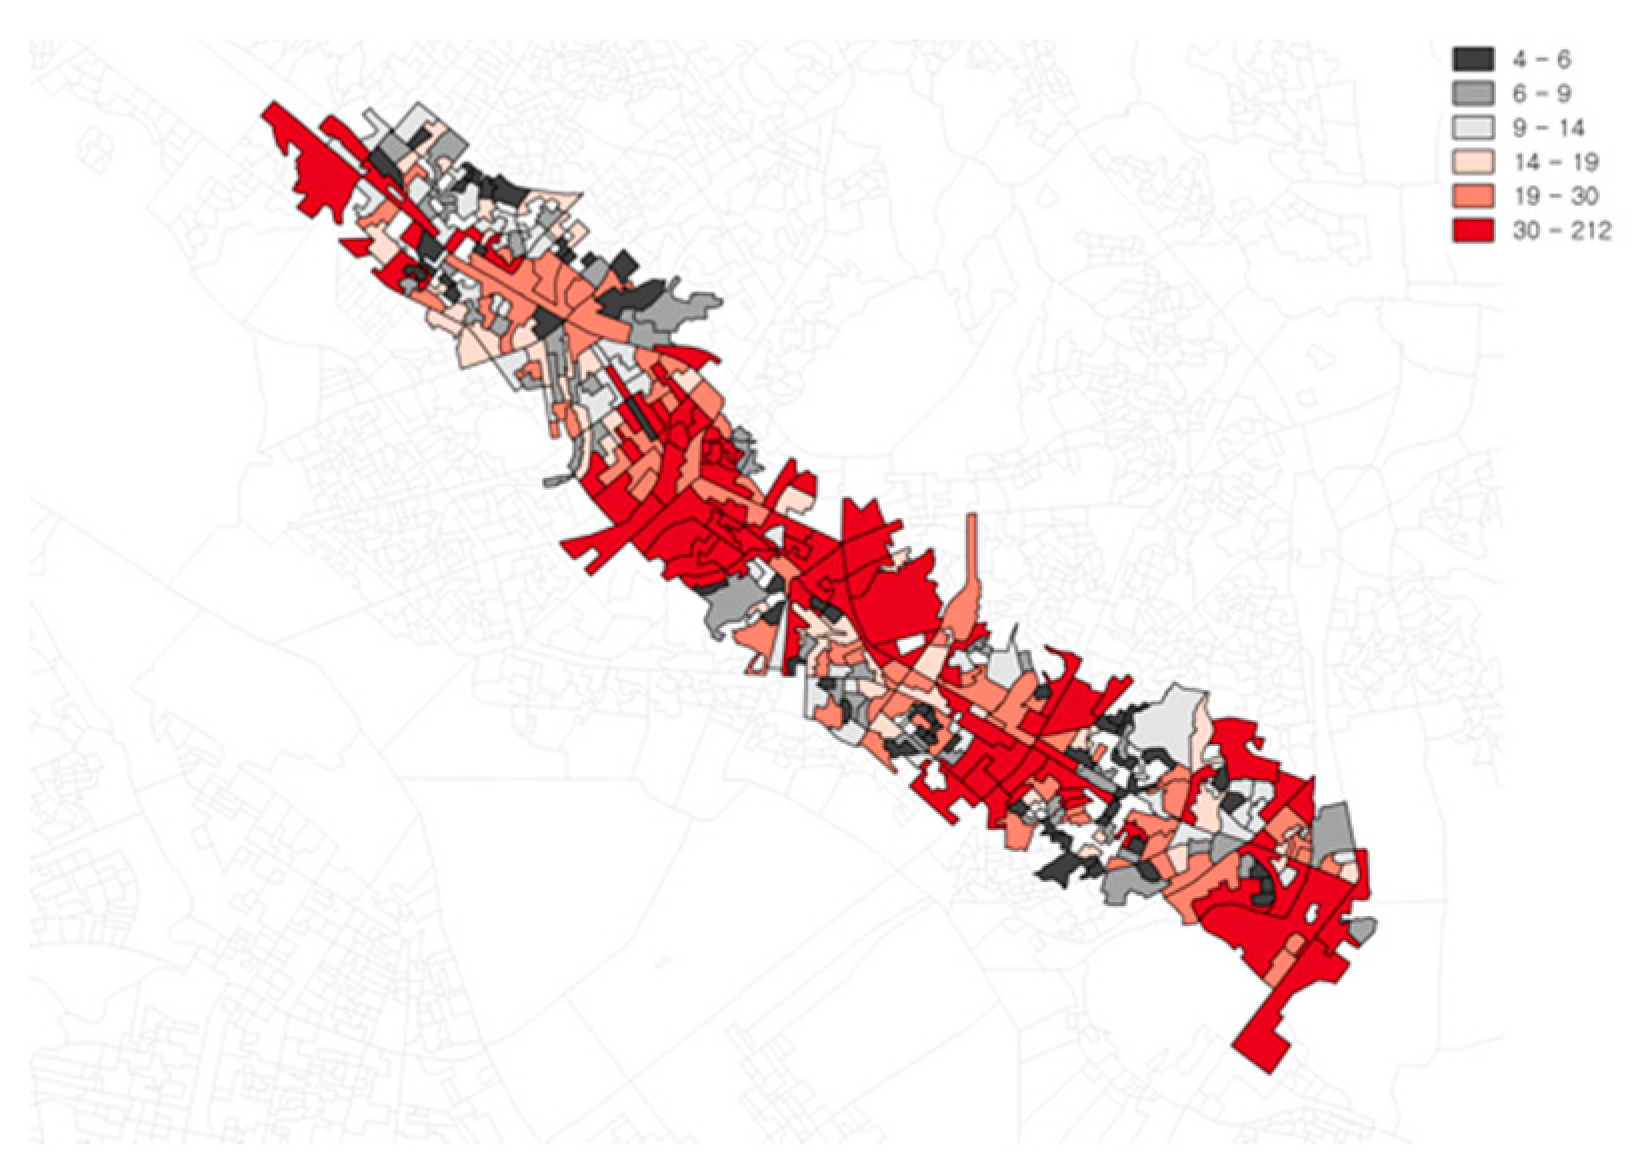
Table 4 represents an interesting implication like Table 3. The authors analyzed the average number of transactions to trace how frequently people use local businesses and estimate how many card users contribute to the local economy. Section 2, Section 3, Section 4 and Section 5 showed a trend that increased from 2015 to 2016 and decreased from 2016 to 2017. However, only Section 1, which has been designed as an open space, increased from 2015 to 2017 continuously (Figure 9 and Figure 10). It can be considered that the open-space design features may contribute to fostering the local economy compared to enclosed design features such as those in Section 2, Section 3 and Section 4.

5. Conclusions

This study examines card transaction data as big data to identify the impacts of a linear park on local business. Many studies have analyzed the economic benefits of a park, especially a linear park, in various ways. For example, Kang and Cervero showed that Cheonggyechon impacts on adjacent property values to support the economic benefits of a park [27]. Curtis measured the economic value of urban green spaces [41]. Compared to other studies, this study uses card transaction behavior to trace the changes in local business from 2015 to 2017. The authors divided the linear park into five sections based on their design features and opening date. Then, they compared each sections’ data by years to identify the relationship between design features and the impacts of the linear park on the adjacent local economy.
The results strongly support that open spaces design contributes to increase average transaction amounts and numbers. Section 1 and Section 5 are open spaces like parks. Other sections decreased the average amount and number of transactions from 2015 to 2017; only Section 1 and Section 5 showed an increase. It can be considered that open spaces allow card users to contribute to the local business compared to enclosed design spaces like Section 2, Section 3 and Section 4.
This study is helpful to landscape architects and urban designers who design green spaces in urban settings by providing design features which can increase the economic benefits of a park. These results also can be used to monitor economic benefits as a new way of using big data analytics. In terms of limitations, this study used average transaction amounts and numbers instead of tracing individual transaction behavior. A future study may include individual card transaction activity instead of the average data to trim the results precisely.

Funding

This research received no external funding.

Conflicts of Interest

The author declares no conflict of interest.

References

  1. Loughran, K. Parks for profit: The high line, growth machines, and the uneven development of urban public spaces. City Community 2014, 13, 49–68. [Google Scholar] [CrossRef]
  2. Brander, L.M.; Koetse, M.J. The value of urban open space: Meta-analyses of contingent valuation and hedonic pricing results. J. Environ. Manag. 2011, 92, 2763–2773. [Google Scholar] [CrossRef] [PubMed]
  3. Freeman, A.M. The hedonic price approach to measuring demand for neighborhood characteristics. In The Economics of Neighborhood; Elsevier: Amsterdam, The Netherlands, 1979; pp. 191–217. [Google Scholar]
  4. Morancho, A.B. A hedonic valuation of urban green areas. Landsc. Urban Plan. 2003, 66, 35–41. [Google Scholar] [CrossRef]
  5. Ovington, J.D.; Groves, K.W.; Stevens, P.R.; Tanton, M.T. Changing Scenic Values and Tourist Carrying Capacity of National Parks. An Australian Example. Landsc. Plan. 1974, 1, 35–50. [Google Scholar] [CrossRef]
  6. Rysman, M. An Empirical Analysis of Payment Card Usage*. J. Ind. Econ. 2007, 55, 1–36. [Google Scholar] [CrossRef]
  7. Medina, J.F.; Chau, C.-T. Credit Card Usage Behavior between Anglos and Hispanics. Hisp. J. Behav. Sci. 1998, 20, 429–447. [Google Scholar] [CrossRef]
  8. Rogers, E.M. Diffusion of Innovations; Simon and Schuster: New York, NY, USA, 2010. [Google Scholar]
  9. Akbari, H.; Pomerantz, M.; Taha, H. Cool surfaces and shade trees to reduce energy use and improve air quality in urban areas. Sol. Energy 2001, 70, 295–310. [Google Scholar] [CrossRef]
  10. Tempesta, T. Benefits and Costs of Urban Parks: A Review; Aestimum: Florence, Italy, 2015; pp. 127–143. [Google Scholar] [CrossRef]
  11. Lockwood, M.; Tracy, K. Nonmarket Economic Valuation of an Urban Recreation Park. J. Leis. Res. 1995, 27, 155–167. [Google Scholar] [CrossRef]
  12. More, T.A.; Stevens, T.; Allen, P.G. Valuation of urban parks. Landsc. Urban Plan. 1988, 15, 139–152. [Google Scholar] [CrossRef]
  13. Stringer, L.C.; Dougill, A.J.; Fraser, E.; Hubacek, K.; Prell, C.; Reed, M.S. Unpacking “participation” in the adaptive management of social–ecological systems: A critical review. Ecol. Soc. 2006, 11. [Google Scholar] [CrossRef] [Green Version]
  14. Wolch, J.R.; Byrne, J.; Newell, J.P. Urban green space, public health, and environmental justice: The challenge of making cities ‘just green enough’. Landsc. Urban Plan. 2014, 125, 234–244. [Google Scholar] [CrossRef] [Green Version]
  15. Boardman, A.E.; Greenberg, D.H.; Vining, A.R.; Weimer, D.L. Cost-Benefit Analysis: Concepts and Practice; Cambridge University Press: Cambridge, UK, 2017. [Google Scholar]
  16. Turner, R.K.; Morse-Jones, S.; Fisher, B. Ecosystem valuation. Ann. N. Y. Acad. Sci. 2010, 1185, 79–101. [Google Scholar] [CrossRef] [PubMed]
  17. Adger, N.; Whitby, M. Accounting for the impact of agriculture and forestry on environmental quality. Eur. Econ. Rev. 1991, 35, 629–641. [Google Scholar] [CrossRef]
  18. Allen, P.G.; Stevens, T.H.; More, T.A. Measuring the economic value of urban parks: A caution. Leis. Sci. 1985, 7, 467–477. [Google Scholar] [CrossRef]
  19. Spangler, M.B. A critique of methods in the quantification of risks, costs and benefits in the societal choice of energy options. Ann. Nucl. Energy 1983, 10, 119–151. [Google Scholar] [CrossRef]
  20. Acar, C.; Acar, H.; Eroğlu, E. Evaluation of ornamental plant resources to urban biodiversity and cultural changing: A case study of residential landscapes in Trabzon city (Turkey). Build. Environ. 2007, 42, 218–229. [Google Scholar] [CrossRef]
  21. Cervinka, R.; Röderer, K.; Hämmerle, I. Evaluation of Hospital Gardens and Implications for Design: Benefits from Environmental Psychology for Architecture and Landscape Planning. J. Archit. Plan. Res. 2014, 31, 43–56. [Google Scholar]
  22. Cranshaw, J.; Schwartz, R.; Hong, J.; Sadeh, N. The livehoods project: Utilizing social media to understand the dynamics of a city. In Proceedings of the Sixth International AAAI Conference on Weblogs and Social Media, Dublin, Ireland, 1 June 2012. [Google Scholar]
  23. Hossini, S.B.; Azemati, S.; Elyasi, N.; Mozaffar, F. The Effect of the Vitality Level of University Campuses on Increasing Social Interactions and Makin. Procedia Soc. Behav. Sci. 2015, 170, 225–233. [Google Scholar] [CrossRef] [Green Version]
  24. Dwyer, J.F.; Kelly, J.R.; Bowes, M.D. Improved Procedures for Valuation of the Contribution of Recreation to National Economic Development; University of Illinois at Urbana-Champaign: Champaign, IL, USA, 1977. [Google Scholar]
  25. Tajima, K. New estimates of the demand for urban green space: Implications for valuing the environmental benefits of Boston’s big dig project. J. Urban Aff. 2003, 25, 641–655. [Google Scholar] [CrossRef]
  26. Levere, M. The Highline Park and Timing of Capitalization of Public Goods. Working Paper. 2014. Available online: https://www.semanticscholar.org/paper/The-High-Line-Park-and-Timing-of-Capitalization-of-Levere/cfaf23350cd0c3eeca0b4d5a3425268e70e87c02#citing-papers (accessed on 18 August 2020).
  27. Kang, C.D.; Cervero, R. From elevated freeway to urban greenway: Land value impacts of the CGC project in Seoul, Korea. Urban Stud. 2009, 46, 2771–2794. [Google Scholar] [CrossRef]
  28. Barbosa, O.; Tratalos, J.A.; Armsworth, P.R.; Davies, R.G.; Fuller, R.A.; Johnson, P.; Gaston, K.J. Who benefits from access to green space? A case study from Sheffield, UK. Landsc. Urban Plan. 2007, 83, 187–195. [Google Scholar] [CrossRef]
  29. Chiesura, A. The role of urban parks for the sustainable city. Landsc. Urban Plan. 2004, 68, 129–138. [Google Scholar] [CrossRef]
  30. Ulrich, R.S. Natural Versus Urban Scenes: “Some Psychophysiological Effects”. Environ. Behav. 1981, 13, 523. [Google Scholar] [CrossRef]
  31. Ulrich, R.S.; Simons, R.F.; Losito, B.D.; Fiorito, E.; Miles, M.A.; Zelson, M. Stress recovery during exposure to natural and urban environments. J. Environ. Psychol. 1991, 11, 201–230. [Google Scholar] [CrossRef]
  32. Coley, R.L.; Sullivan, W.C.; Kuo, F.E. Where Does Community Grow?: The Social Context Created by Nature in Urban Public Housing. Environ. Behav. 1997, 29, 468–494. [Google Scholar] [CrossRef]
  33. Kuo, F.E.; Bacaicoa, M.; Sullivan, W.C. Transforming Inner-City Landscapes: Trees, Sense of Safety, and Preference. Environ. Behav. 1998, 30, 28–59. [Google Scholar] [CrossRef]
  34. Peters, K.; Elands, B.; Buijs, A. Social interactions in urban parks: Stimulating social cohesion? Urban For. Urban Green. 2010, 9, 93–100. [Google Scholar] [CrossRef] [Green Version]
  35. Tu, W.; Cao, J.; Yue, Y.; Shaw, S.-L.; Zhou, M.; Wang, Z.; Chang, X.; Xu, Y.; Li, Q. Coupling mobile phone and social media data: A new approach to understanding urban functions and diurnal patterns. Int. J. Geogr. Inf. Sci. 2017, 31, 2331–2358. [Google Scholar] [CrossRef]
  36. Chen, W.Y.; Li, X. Cumulative impacts of polluted urban streams on property values: A 3-D spatial hedonic model at the micro-neighborhood level. Landsc. Urban Plan. 2017, 162, 1–12. [Google Scholar] [CrossRef]
  37. e Silva, M.D.F.M.; Calijuri, M.L.; de Sales, F.J.F.; de Souza, M.H.B.; Lopes, L.S. Integration of technologies and alternative sources of water and energy to promote the sustainability of urban landscapes. Resour. Conserv. Recycl. 2014, 91, 71–81. [Google Scholar] [CrossRef]
  38. Oteros-Rozas, E.; Martín-López, B.; Fagerholm, N.; Bieling, C.; Plieninger, T. Using social media photos to explore the relation between cultural ecosystem services and landscape features across five European sites. Ecol. Indic. 2018, 94, 74–86. [Google Scholar] [CrossRef]
  39. Batty, M.; Axhausen, K.W.; Giannotti, F.; Pozdnoukhov, A.; Bazzani, A.; Wachowicz, M.; Ouzounis, G.; Portugali, Y. Smart cities of the future. Eur. Phys. J. Spec. Top. 2012, 214, 481–518. [Google Scholar] [CrossRef] [Green Version]
  40. Kwate, N.O.A.; Cueva, S.; Campbell, A. Methodological issues in measuring neighborhood-level exposures. In Proceedings of the Annals of Behavioral Medicine; Springer: New York, NY, USA, 2010; Volume 39, p. 178. [Google Scholar]
  41. Curtis, I.A. Valuing ecosystem goods and services: A new approach using a surrogate market and the combination of a multiple criteria analysis and a Delphi panel to assign weights to the attributes. Ecol. Econ. 2004, 50, 163–194. [Google Scholar] [CrossRef]
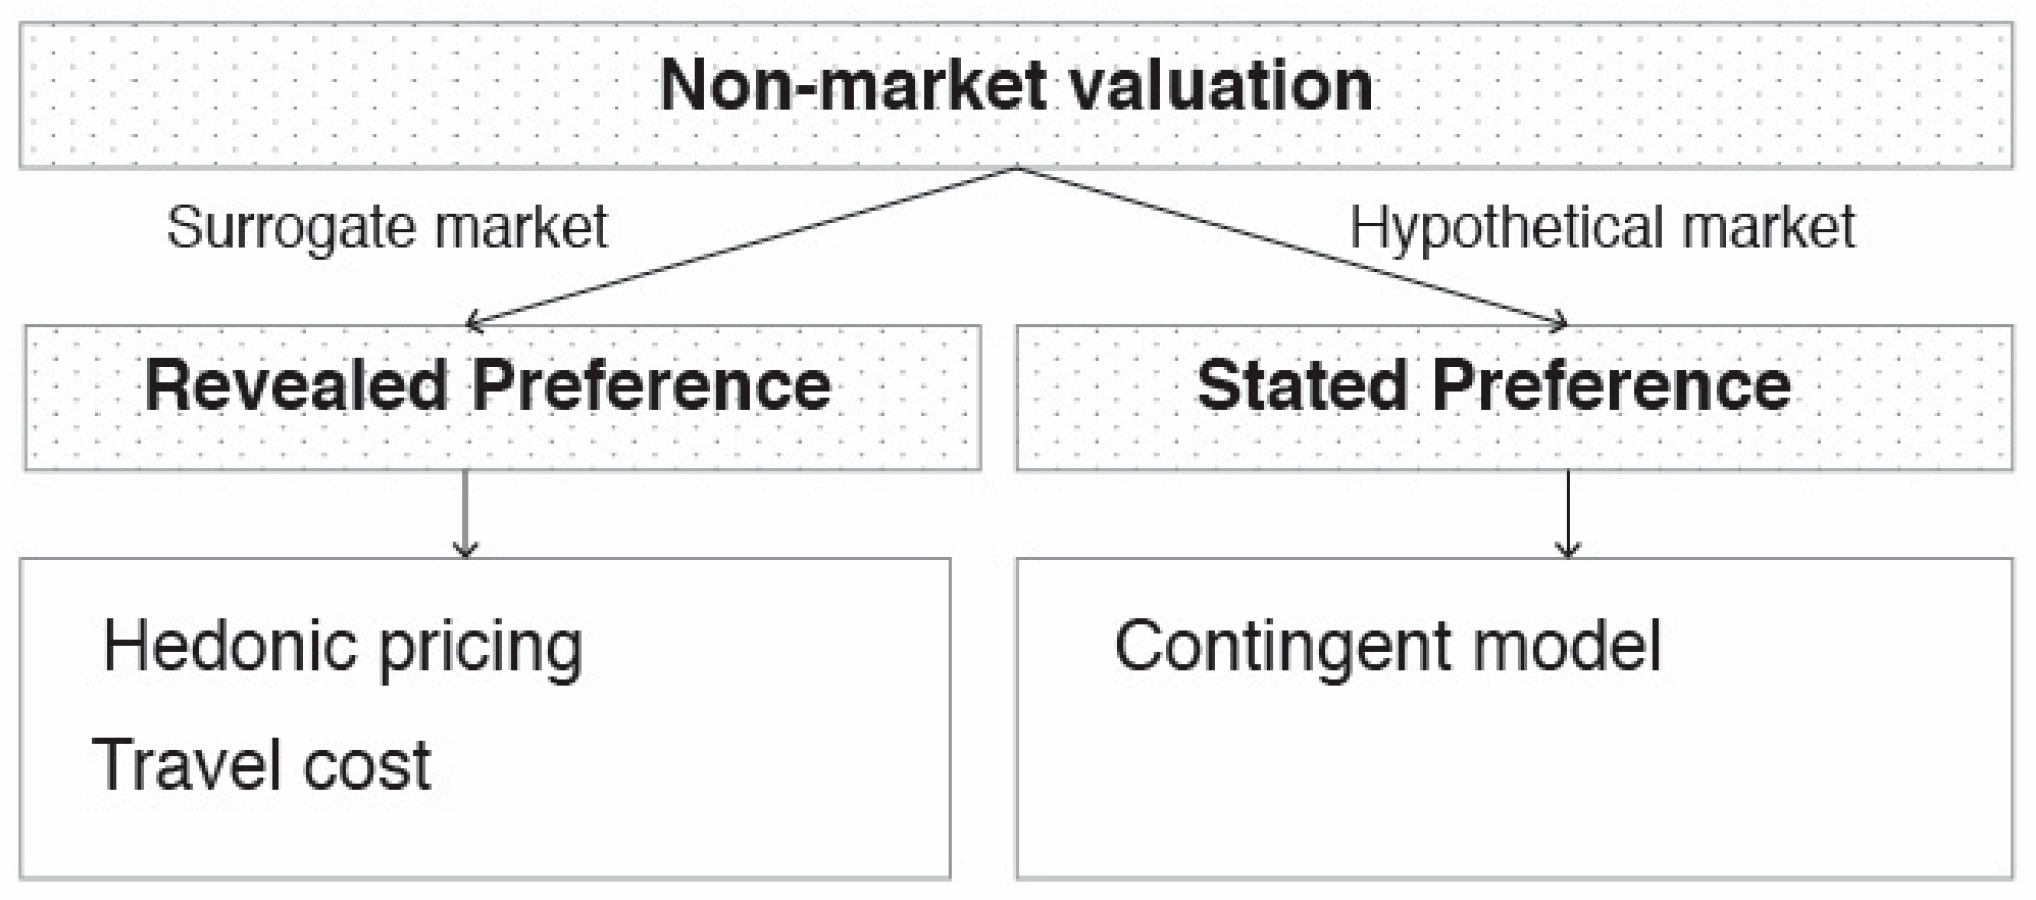
Figure 1. Framework of non-market valuation.
Sustainability 12 06722 g001
Figure 2. Gyeongui Line Forest scene.
Sustainability 12 06722 g002
Figure 3. Five sections of the study.
Sustainability 12 06722 g003
Figure 4. Average ages using five sections in 2015 (left) and 2017 (right).
Sustainability 12 06722 g004
Figure 5. Average age of five sections in 2015 (left) and 2016 (right).
Sustainability 12 06722 g005
Figure 6. Average age in 2017.
Sustainability 12 06722 g006
Figure 7. Average transaction amounts of five sections in 2015 (left) and 2016 (right).
Sustainability 12 06722 g007
Figure 8. Average transaction amounts in 2017.
Sustainability 12 06722 g008
Figure 9. Average card transaction of five sections in 2015 (left) and 2016 (right).
Sustainability 12 06722 g009
Figure 10. Average card transaction amounts in 2017.
Sustainability 12 06722 g010
Table 1. Five sections of the study in detail.
No.PhotoContextIn-Out
1 Sustainability 12 06722 i001 Sustainability 12 06722 i002openness
2 Sustainability 12 06722 i003 Sustainability 12 06722 i004Semi openness
3 Sustainability 12 06722 i005 Sustainability 12 06722 i006enclosed
4 Sustainability 12 06722 i007 Sustainability 12 06722 i008enclosed
5 Sustainability 12 06722 i009 Sustainability 12 06722 i010Semi openness
Table 2. Average age scales from 2015 to 2017.
Section201520162017
13.743.853.80
23.493.463.47
33.403.443.49
43.693.723.79
53.483.543.58
Table 3. Average amount of transaction from 2015 to 2017 (unit: won).
Section201520162017
168,39387,54094,470
242,39632,76132,559
338,58646,53642,284
479,93991,58978,183
549,10356,50461,748
Table 4. Average number of transactions from 2015 to 2017.
Section 201520162017
1349.0413.6424.8
2605.0746.3731.0
3942.01068.71038.3
4621.0655.2619.9
5701.0788.1739.6