Eco-Efficient Analysis of a Refurbishment Proposal for a Social Housing


Abstract
:1. Introduction
2. Materials and Methods
2.1. Methodology
- Analysis of the environmental performance of the original stage.
- Energy demand analysis.
- Provided measurements.
- Provided energy rating results.
- Energy simulation using EnergyPlus.
- Daylighting and solar access analyses.
- Integral analysis of the original intervention.
- Energy demand analysis.
- Provided measurements.
- Provided energy rating results.
- Energy simulation using EnergyPlus.
- Daylighting and solar access analysis.
- Life cycle analysis.
- Proposal and integral analysis of an alternative intervention.
- Definition of the proposal based on the eco-efficient aspects not fulfilled previously.
- Analysis of the eco-efficient aspects rectified.
2.1.1. Building Monitoring Campaign
2.1.2. Energy Certification Model of the Building
2.1.3. Building Information Modelling Software and Plugins
Energy Demand Analysis
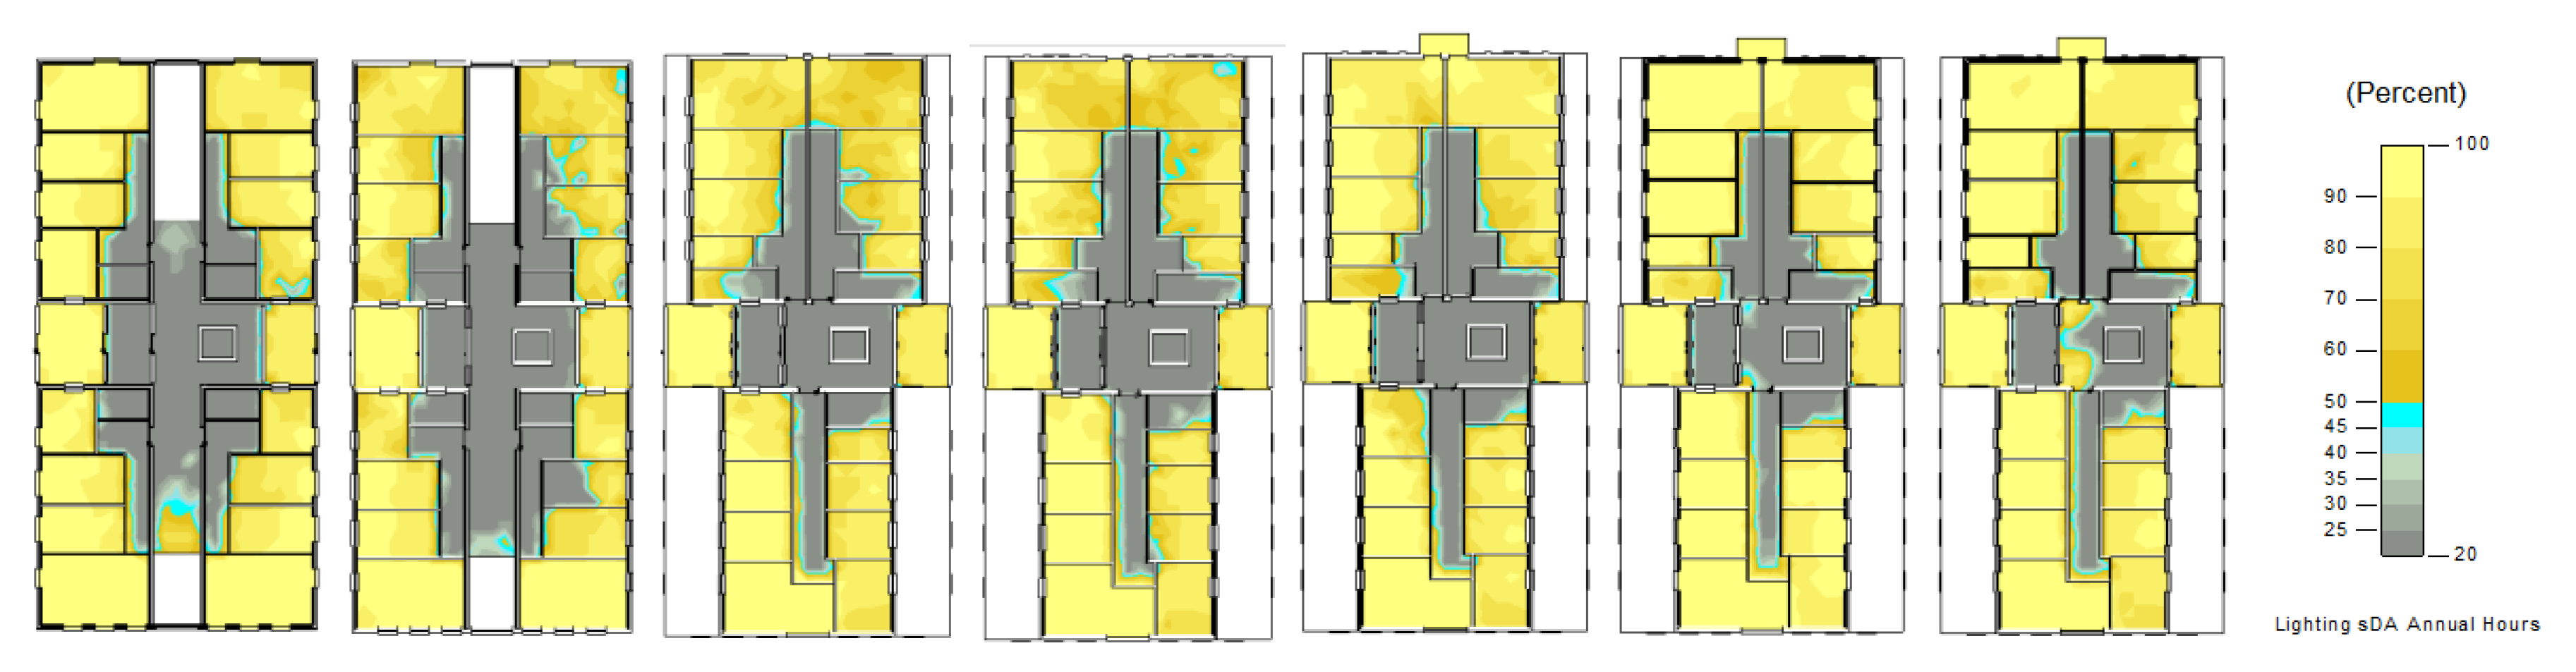
Daylighting
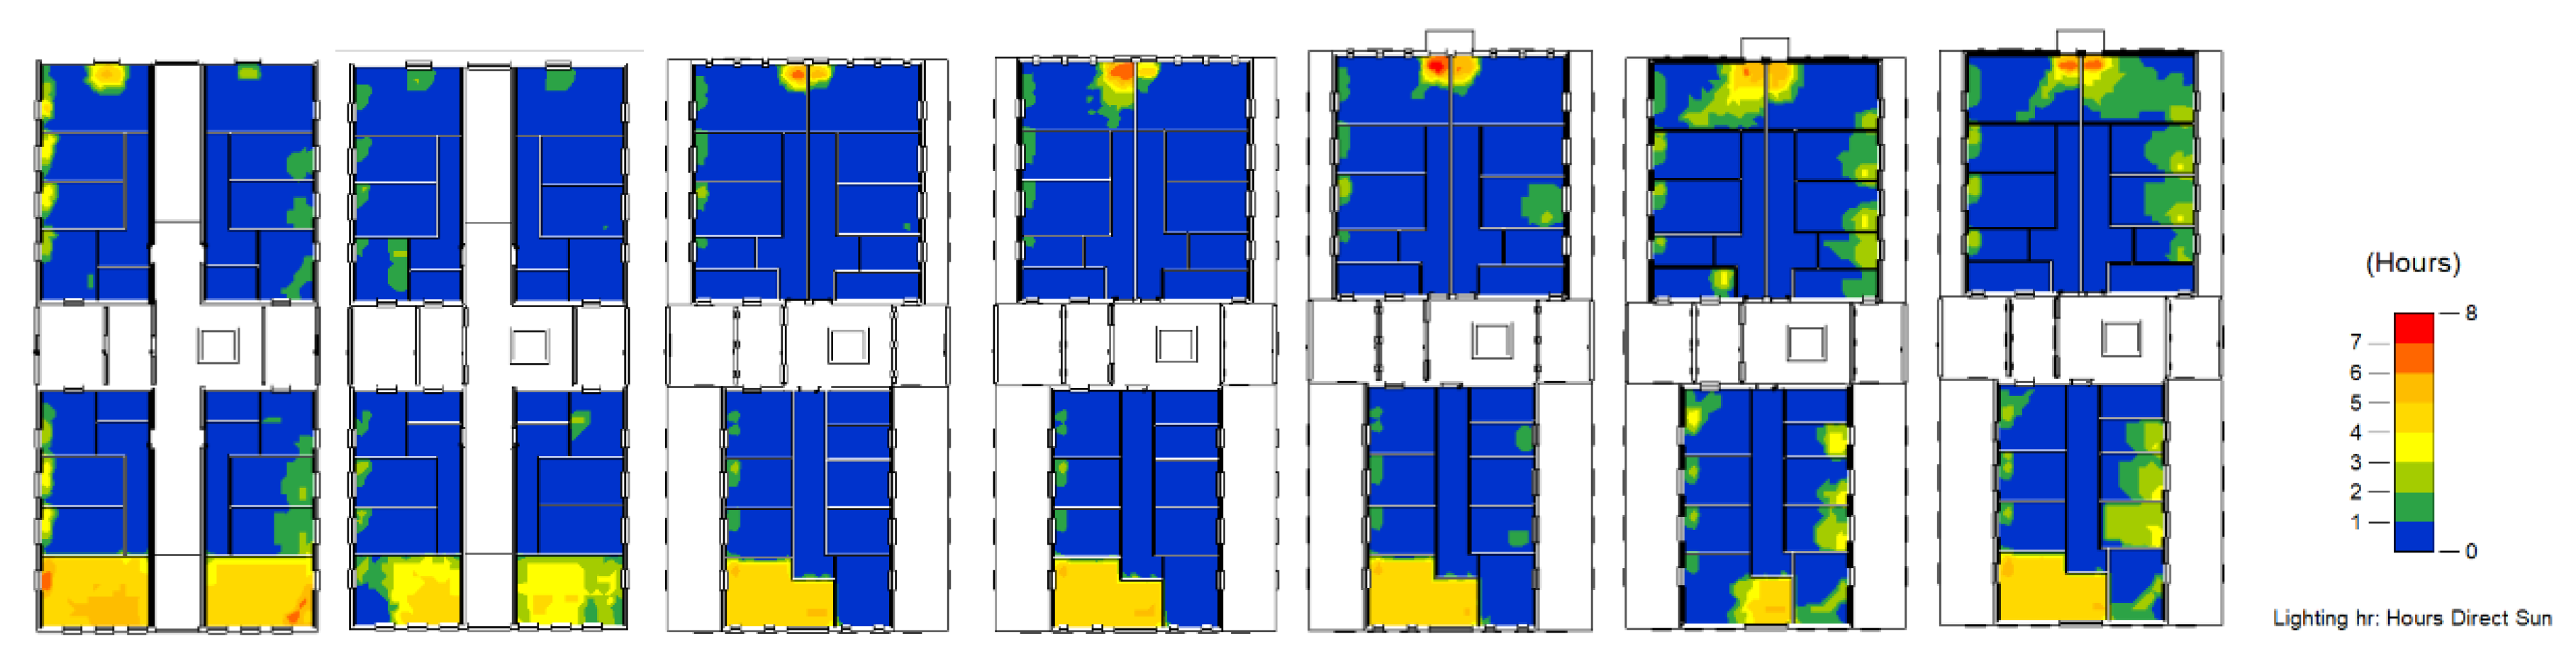
Solar Access
Life Cycle Analysis
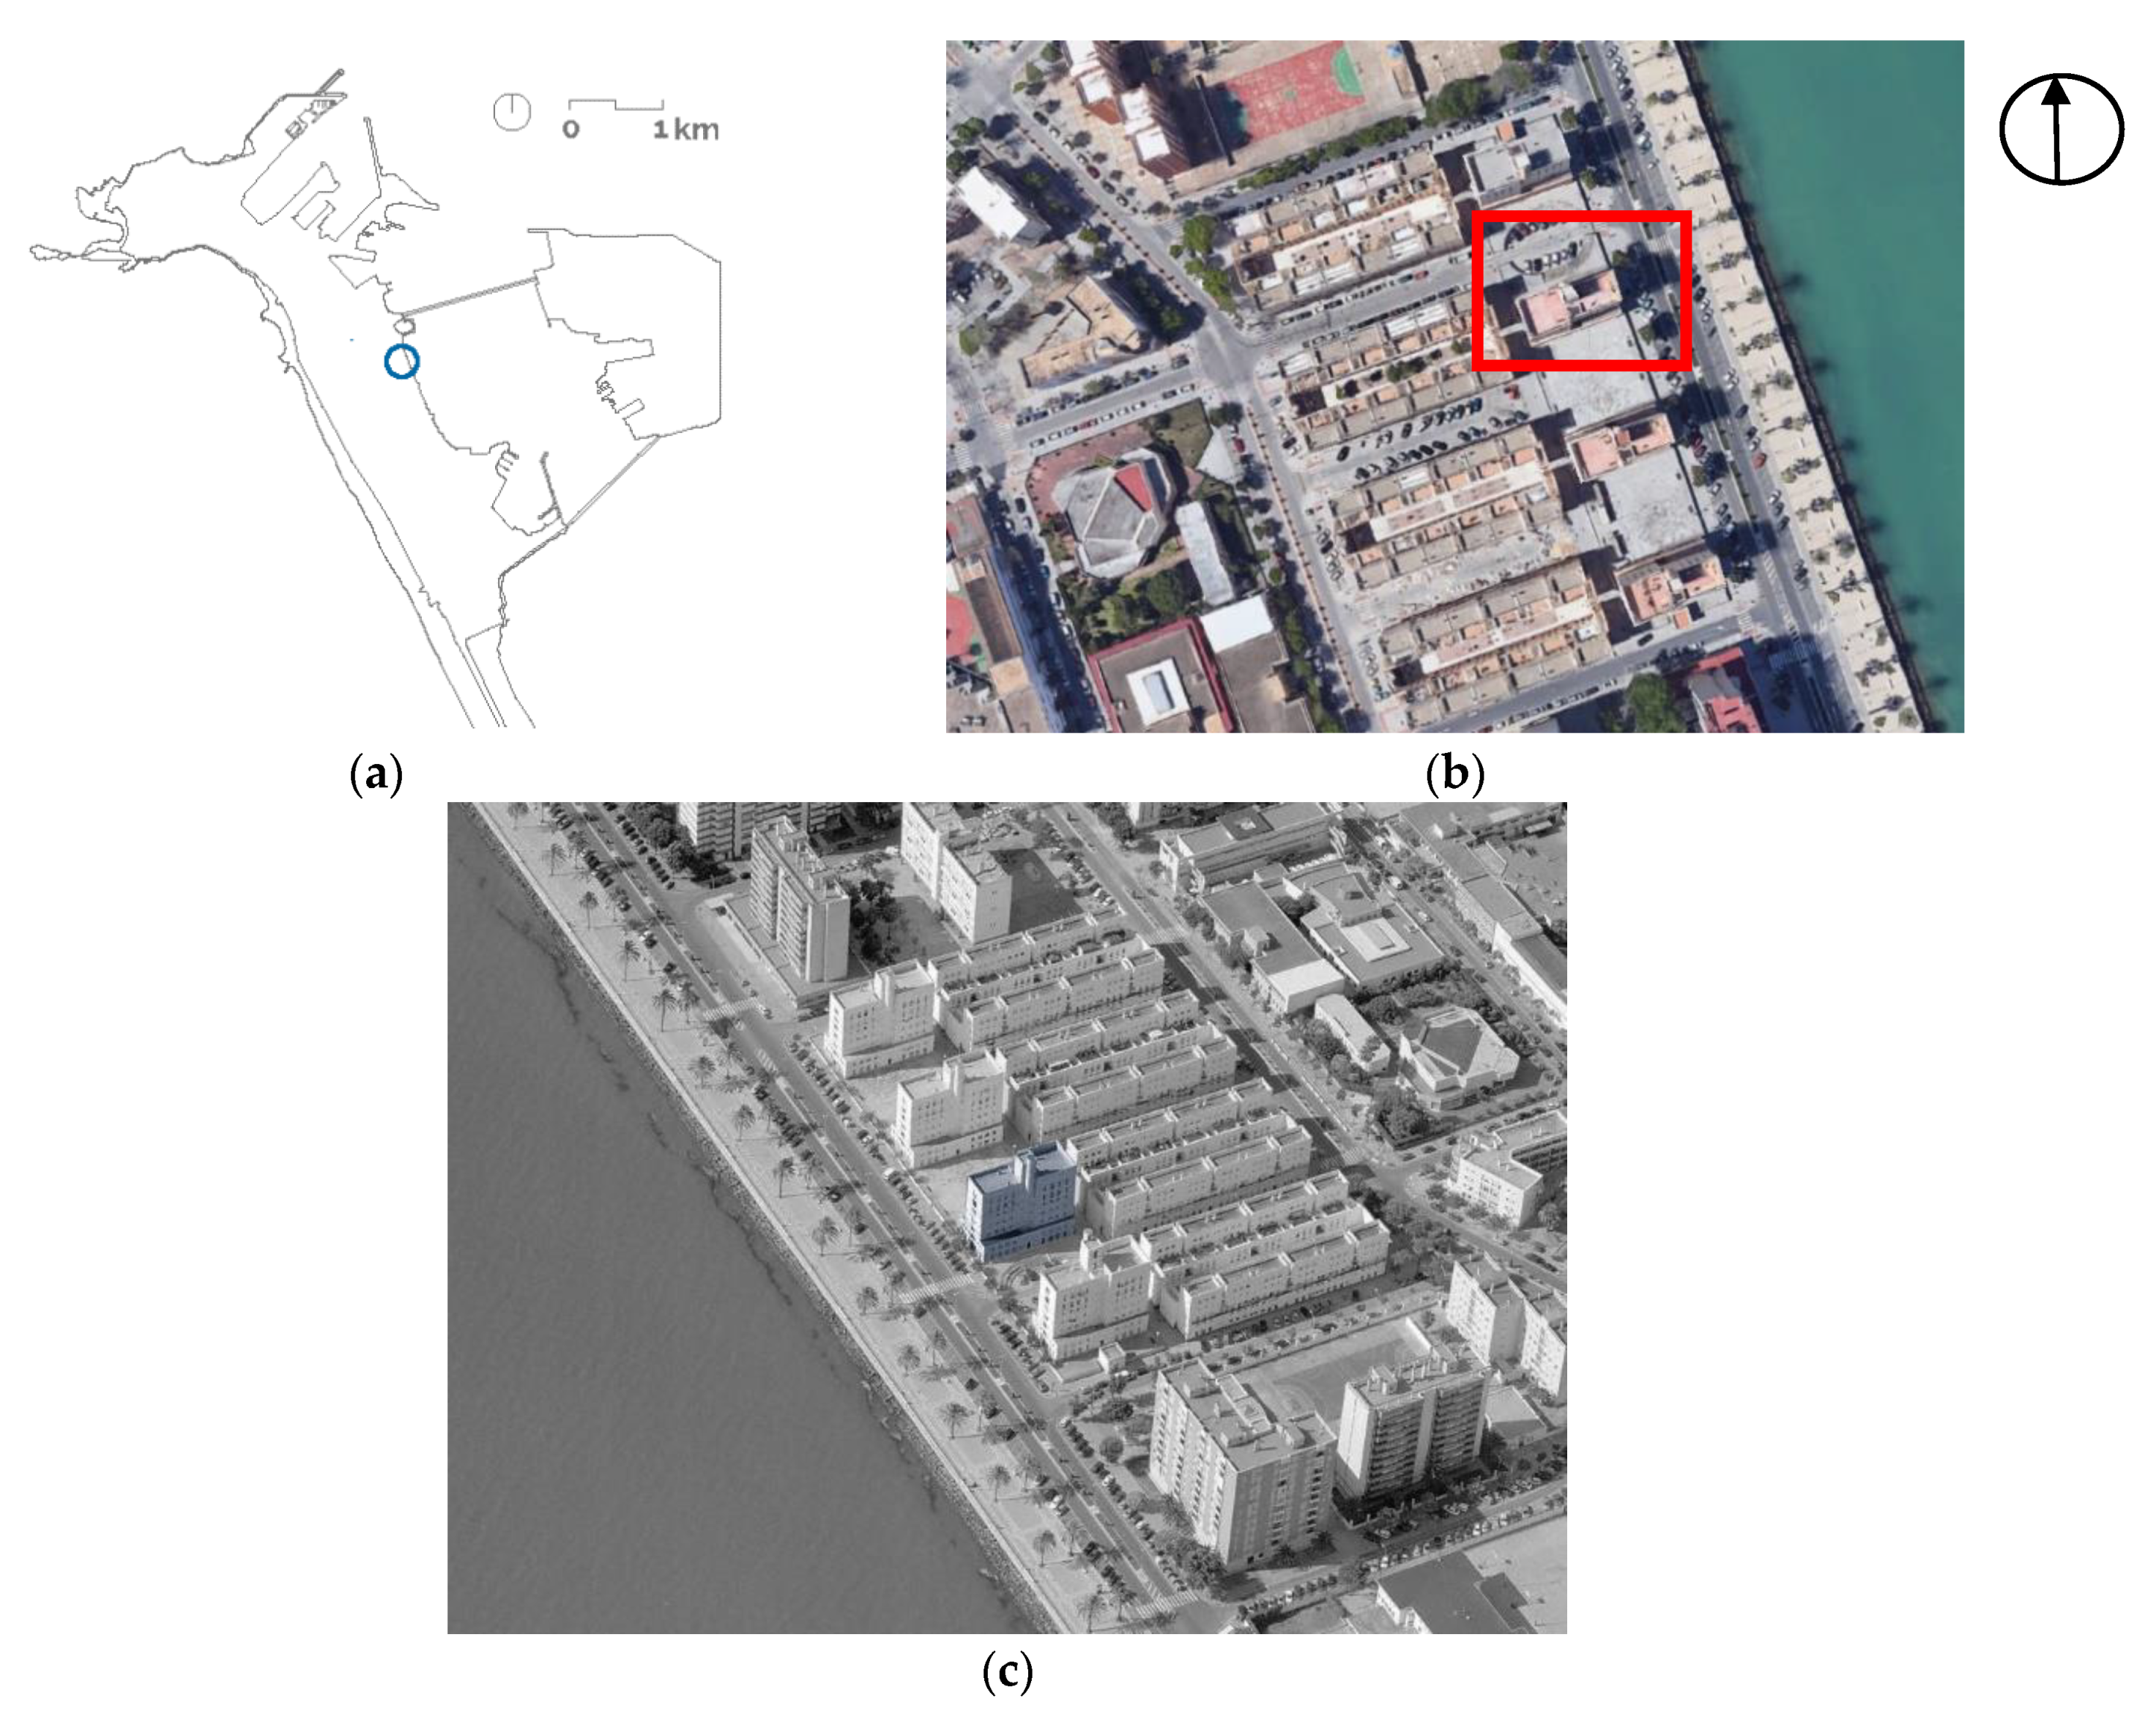
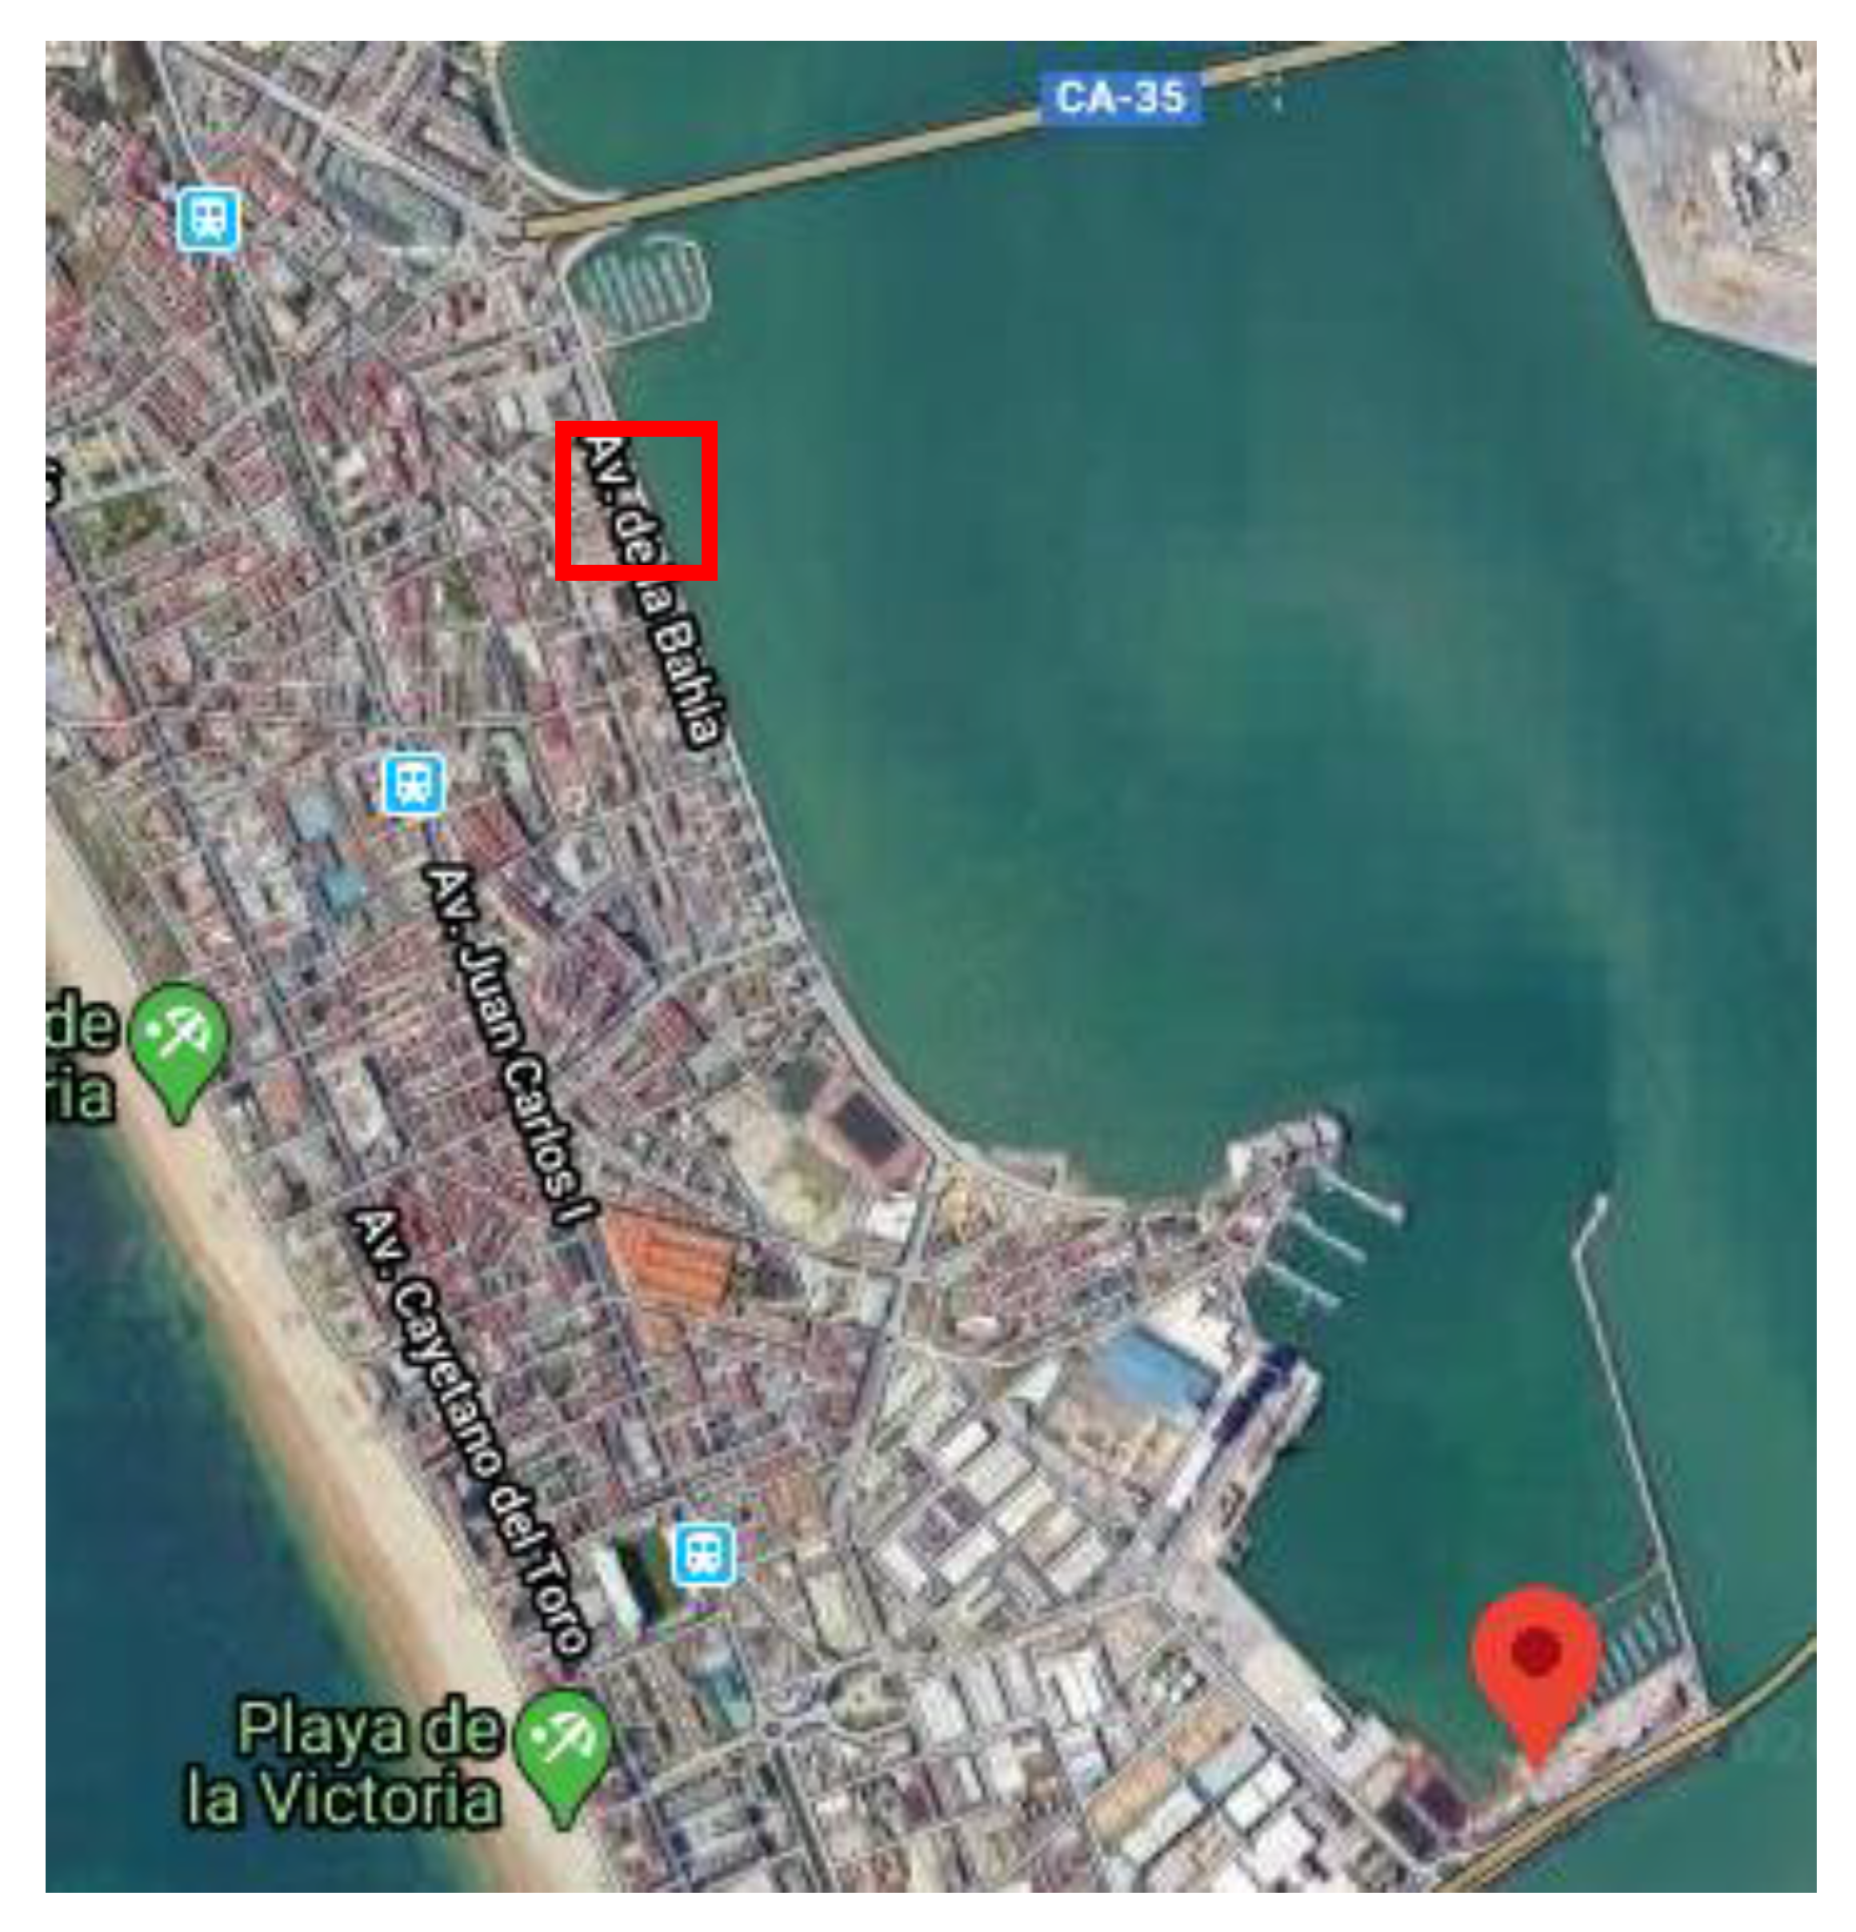
2.2. Case Study
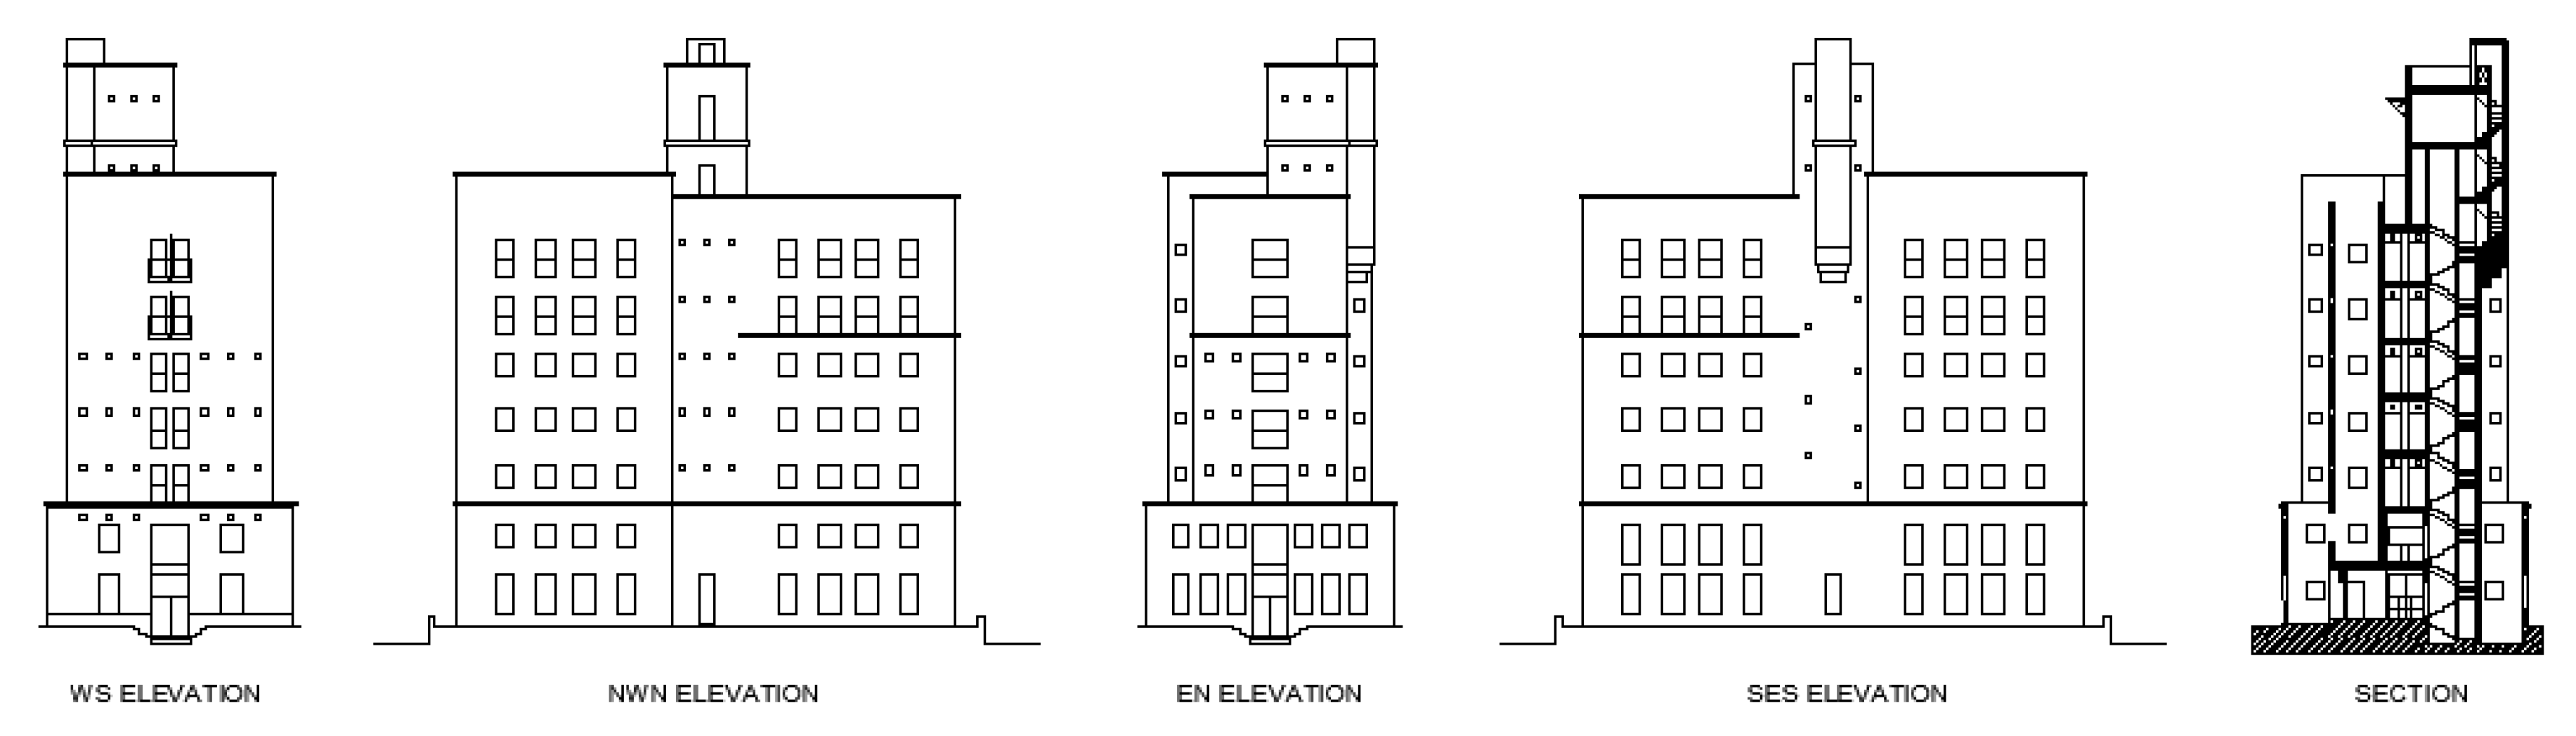
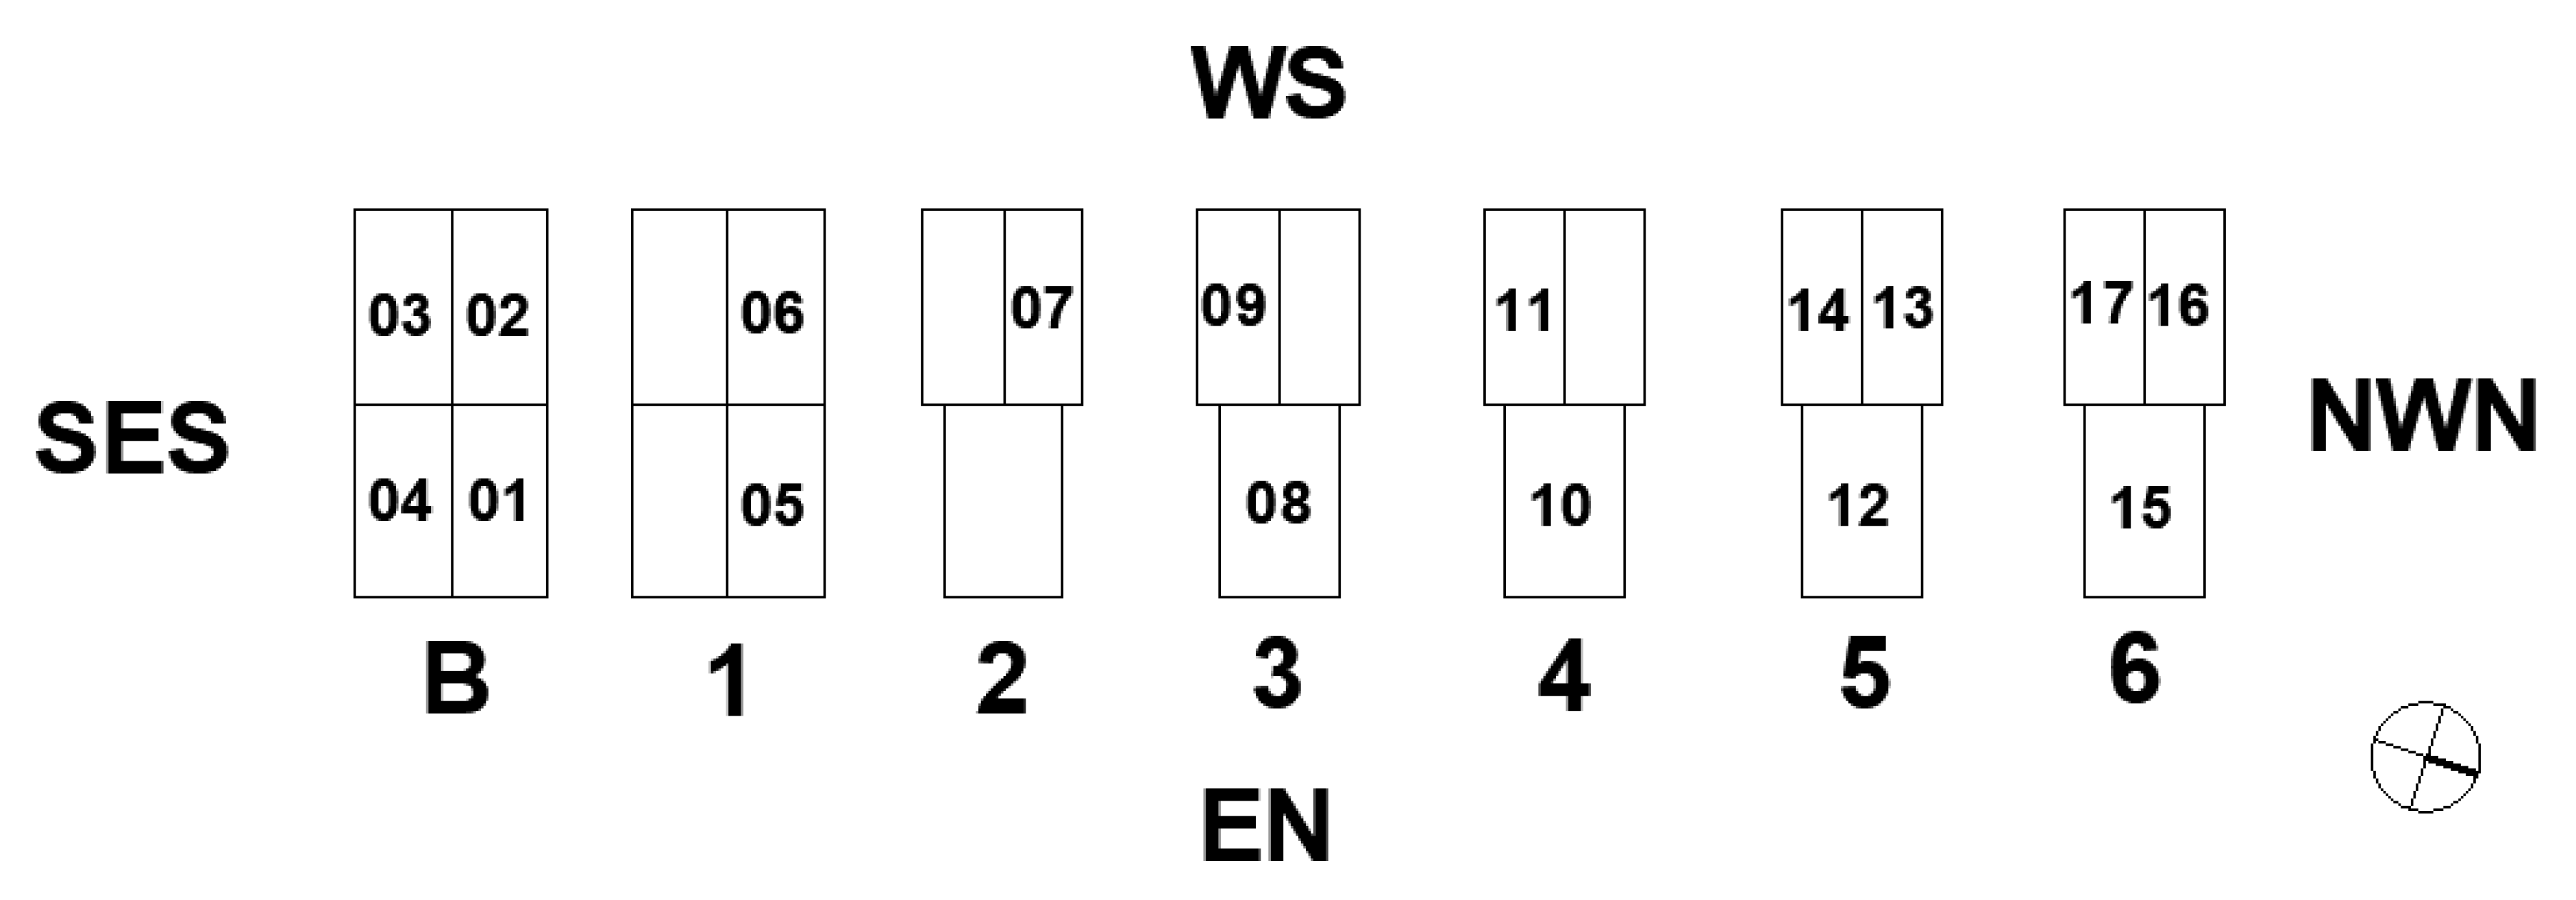
2.2.1. Constructive Characteristics and Pre-Refurbishment Condition
2.2.2. Climate Data
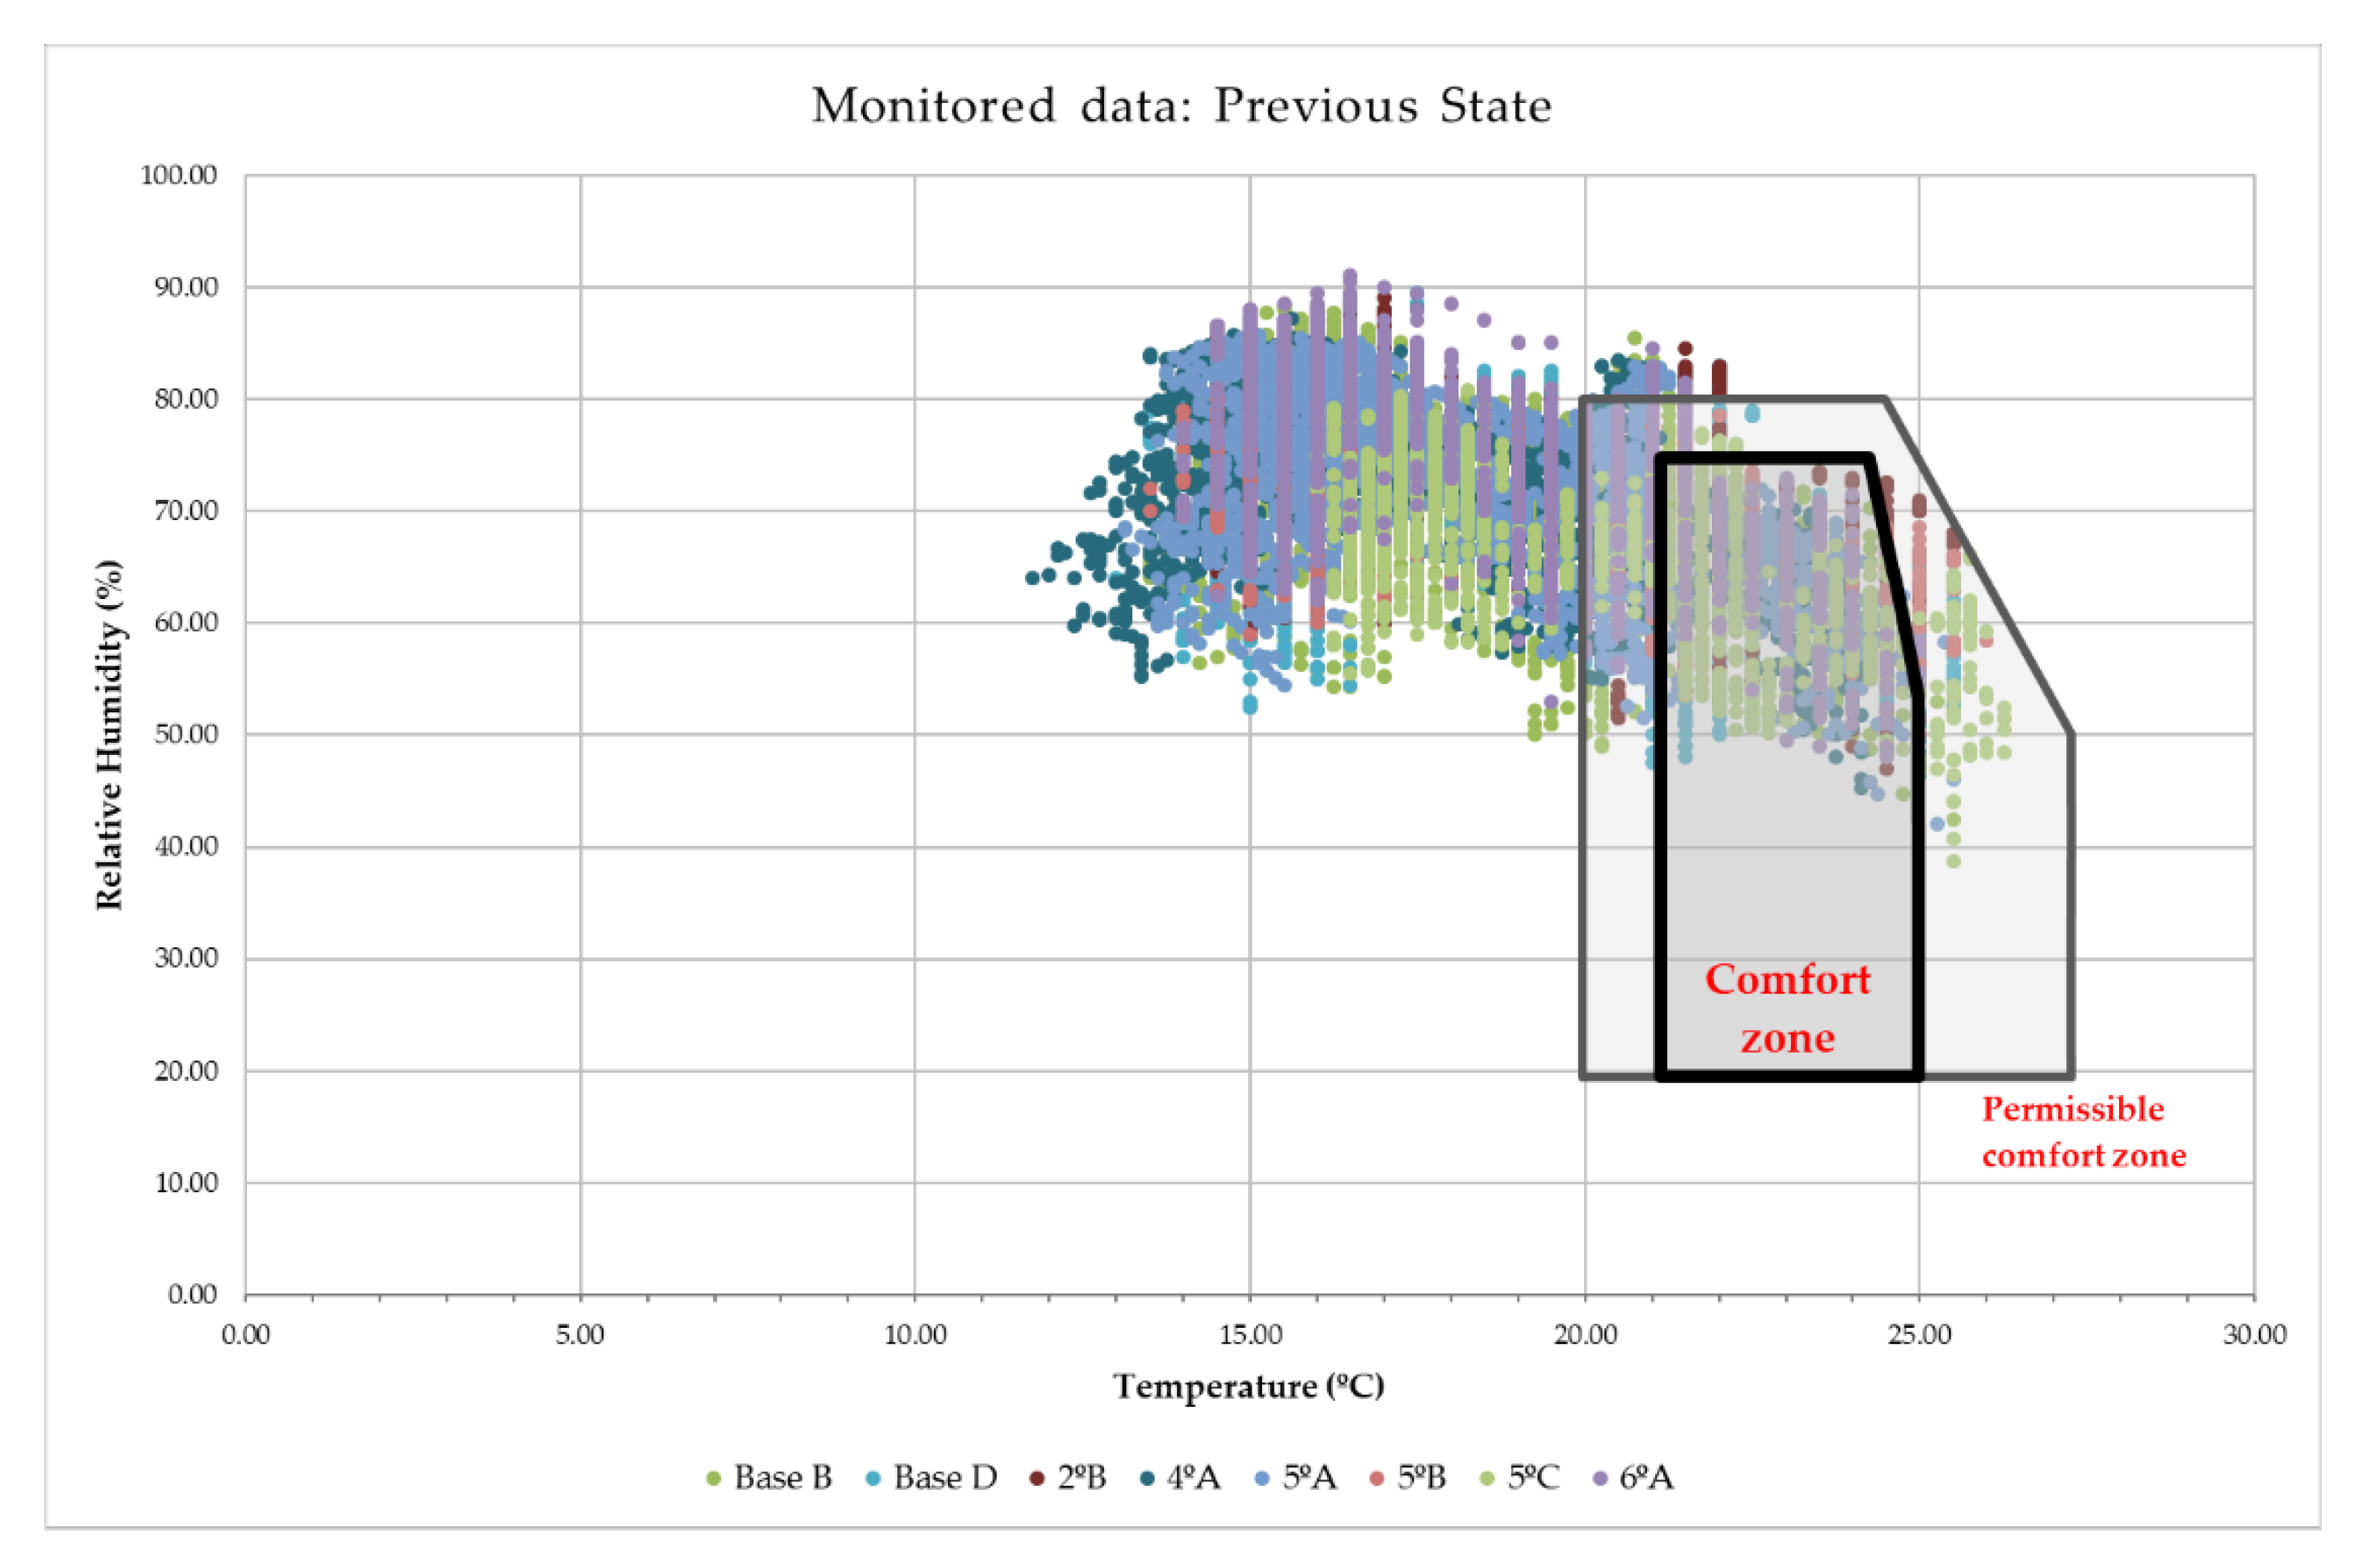
2.2.3. Building Monitoring Campaign
2.2.4. Energy Demand Analysis Parameters
- Building Type: Multi-familiar.
- Location: Cádiz, Andalusia, Spain.
- Ground Plane—Surfaces below this level are considered to be underground: Zero.
- Building Construction—specifies the default type of construction for each element of the envelope, defined by its U-value and its solar heat gain coefficient for windows. The following constructions’ elements are selected in order to be the most similar to the defined ones in the project:
- Roof: U = 0.5363 W/m2·K.
- Exterior walls: U = 0.5601 W/m2·K.
- Interior walls: U = 1.6896 W/m2·K.
- Ceilings: U = 1.3683 W/m2·K.
- Floors: U = 2.9582 W/m2·K.
- Exterior windows: U = 5.9050 W/m2·K, SHGC = 0.86.
- Building Infiltration Class—specifies an estimate of outdoor air that enters the building through leaks in the building envelope. The infiltration class has been defined as Medium, which represents an air infiltration of 0.19 L/s m2.
- Space properties:
- Condition Type: Determines how heating and cooling loads are calculated. When set to Unconditioned, no loads are calculated. As when set to Heated, only heating loads are calculated. All the spaces are defined as Heated and Cooled in order to get the heating and cooling energy demand.
- Space Type: Determines the internal loads associated to a certain activity. These values are defined according to the default operational conditions for private residential buildings defined for the Spanish Energy Rating Scheme [56].
- Occupancy.
- People (nº): Data taken from monitoring data for each dwelling.
- People Sensible Heat Gain (W/person): 73.27.
- People Latent Heat Gain (W/person): 45.43.
- Occupancy Schedule: Residential (100% from 0:00 h, 25% from 7:00 h, 50% from 15:00 h, and 100% from 23:00 h).
- Lighting.
- Lighting Load Density (W/m2): 4.40.
- Lighting Schedule: Residential Lighting All Day (10% from 0:00 h, 30% from 7:00 h, 50% from 18:00 h, 100% from 19:00 h and 50% from 23:00 h).
- Power equipment.
- Power Load Density (W/m2): 4.40.
- Power Schedule: Residential Power All Day (10% from 0:00 h, 30% from 7:00 h, 50% from 18:00 h, 100% from 19:00 h and 50% from 23:00 h).
- Outdoor air.
- Infiltration Flow (L/s m2): 0.19.
- Outdoor air method: Defines the calculation method for outdoor air demand in a space. It is defined as by ACH.
- Air change per hour (ach/h): 0.63.
- Zone.
- Building Service—specifies the type of heating and cooling system: Radiant heater or split system with natural ventilation according to monitoring information.
- Cooling settings.
- Cooling Set Point. Temperature at which the system will maintain the cooling in all spaces in the zone: 25 °C according to the Spanish Energy Rating Scheme.
- Cooling Air Temperature. Supply air temperature used to cool all spaces in the zone: 12 °C.
- Heating settings.
- Heating Set Point. Temperature at which the system will maintain the cooling in all spaces in the zone: 20 °C according to the Spanish Energy Rating Scheme.
- Heating Air Temperature. Supply air temperature used to cool all spaces in the zone: 32 °C.
2.2.5. Daylighting Parameters
- Surrounding buildings: Defined by conceptual masses with perimetral opaque surfaces.
- Window transparency or visible transmittance: 0.90.
- Indoor surface reflectance: Floor = 0.50; walls = 0.80; ceiling = 0.95.
2.2.6. Solar Access Parameters
3. Results
3.1. Original State
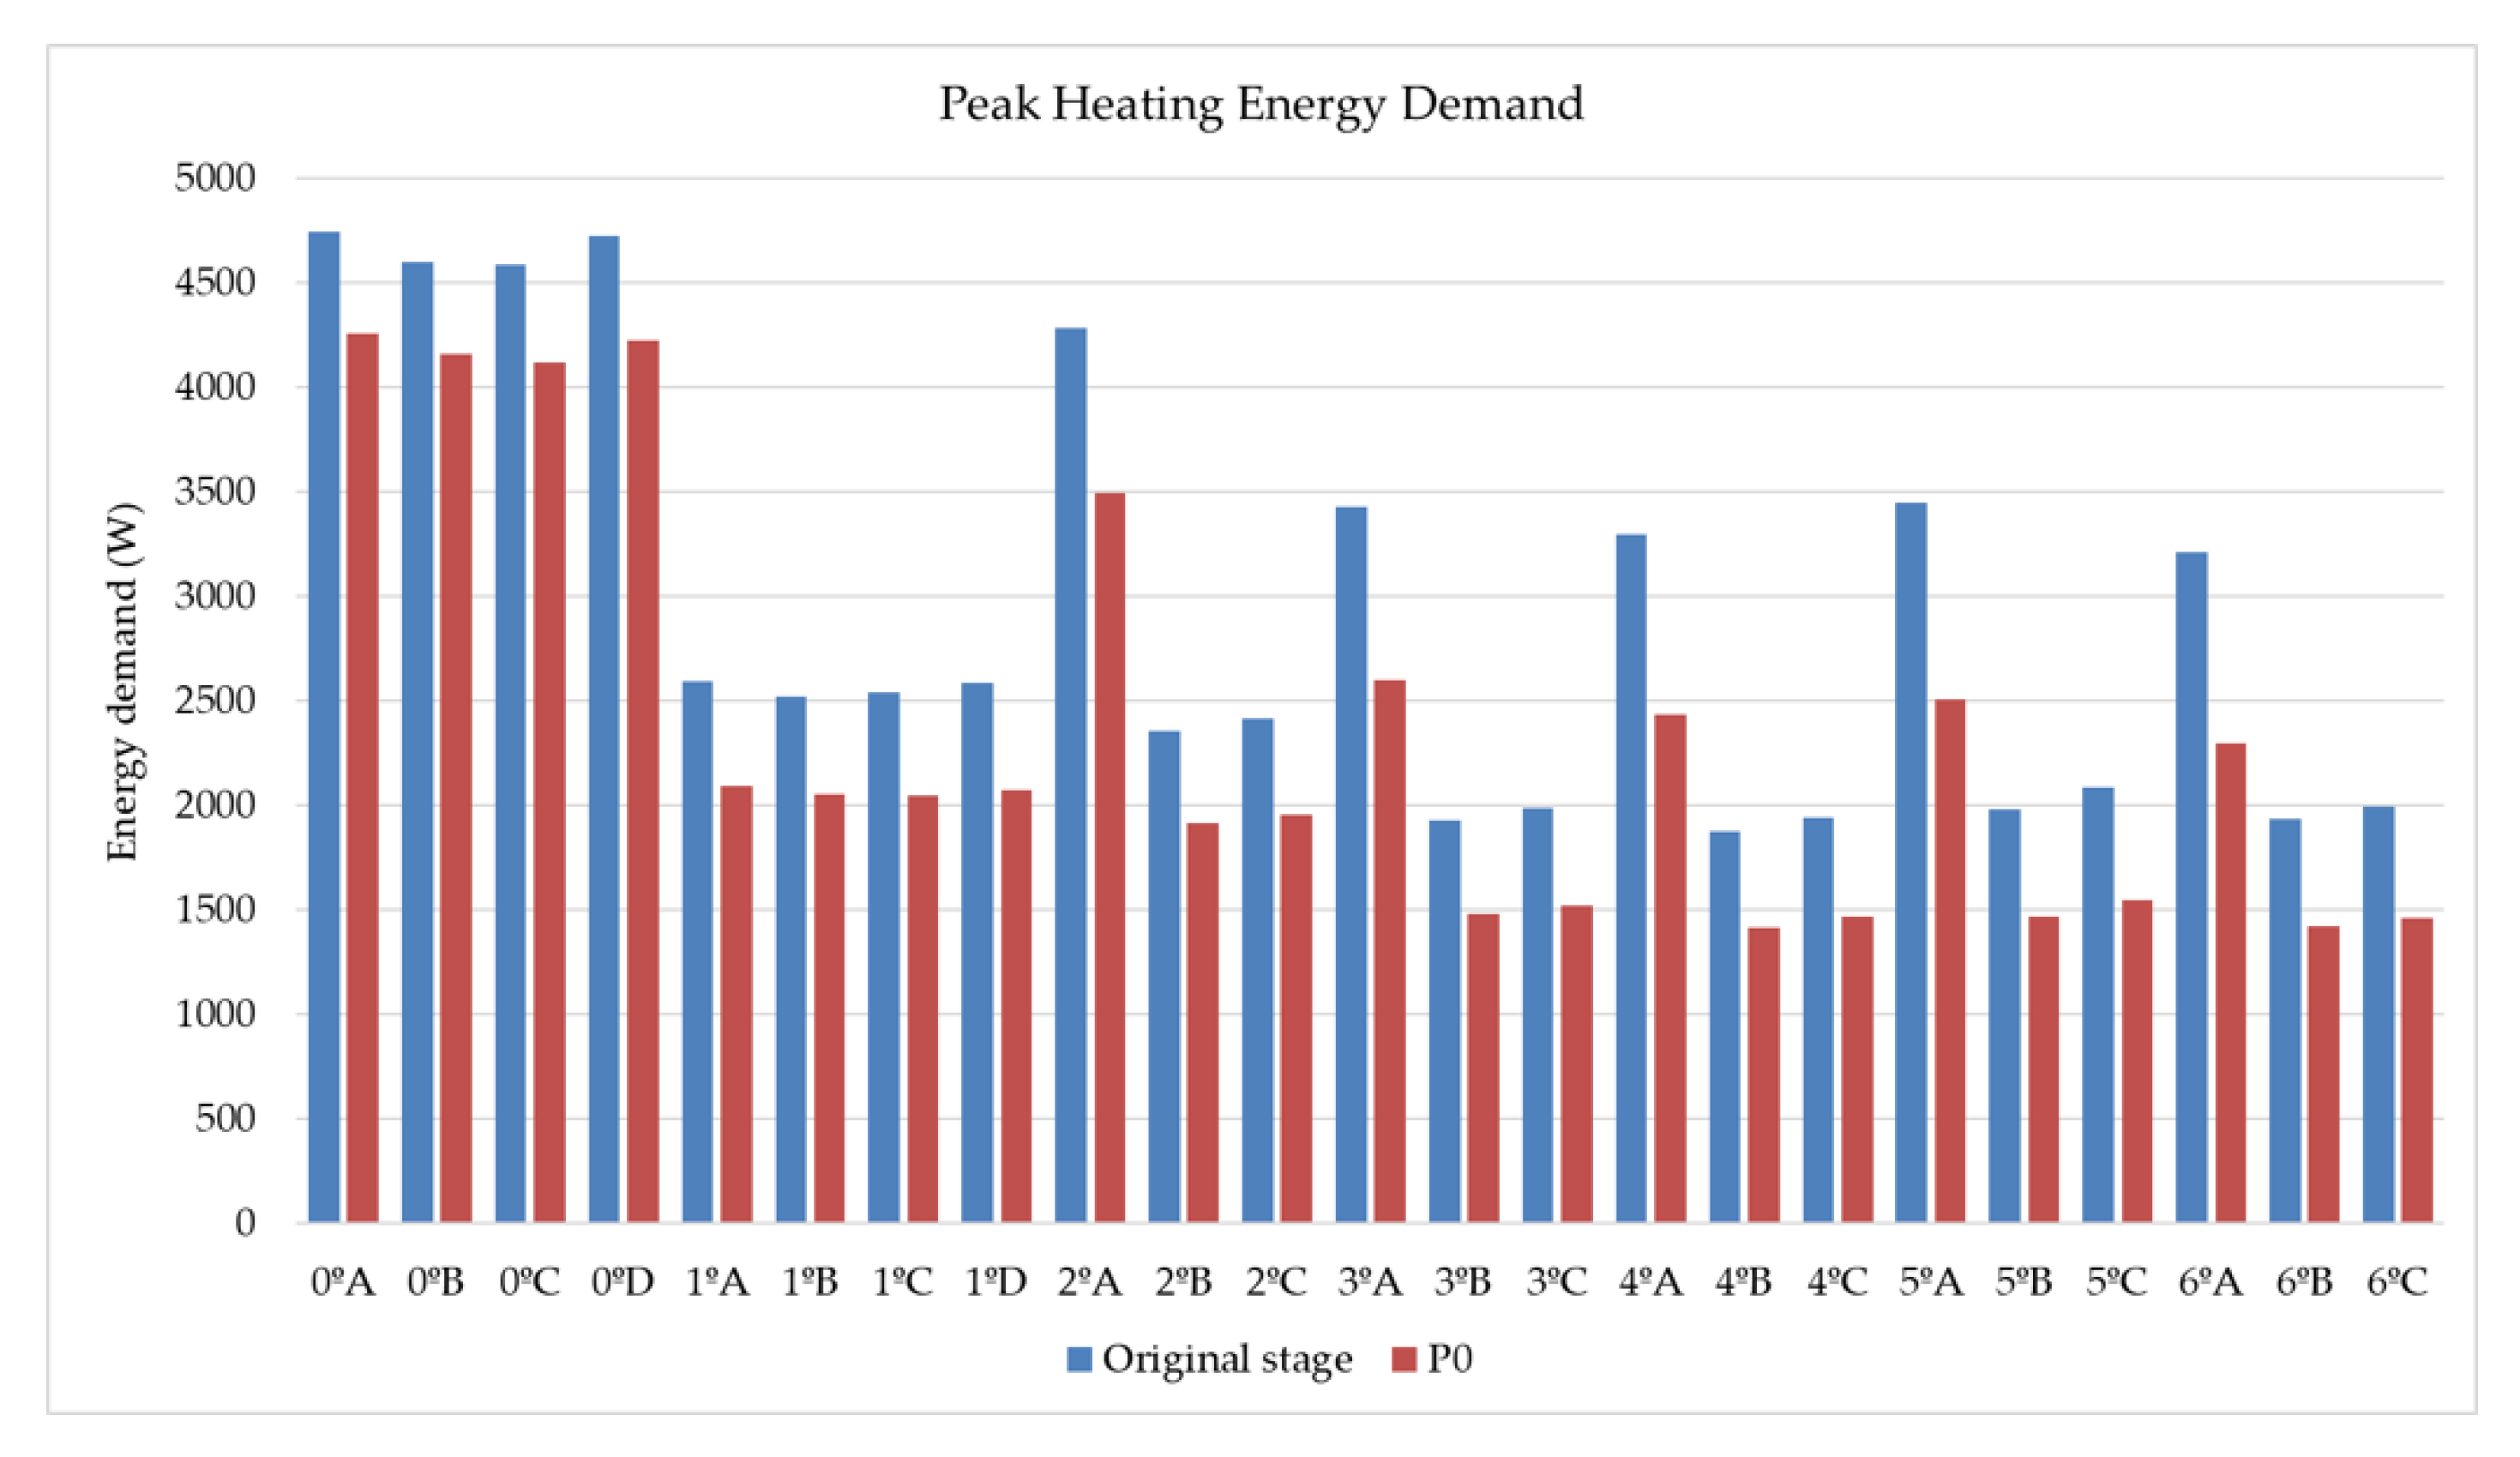
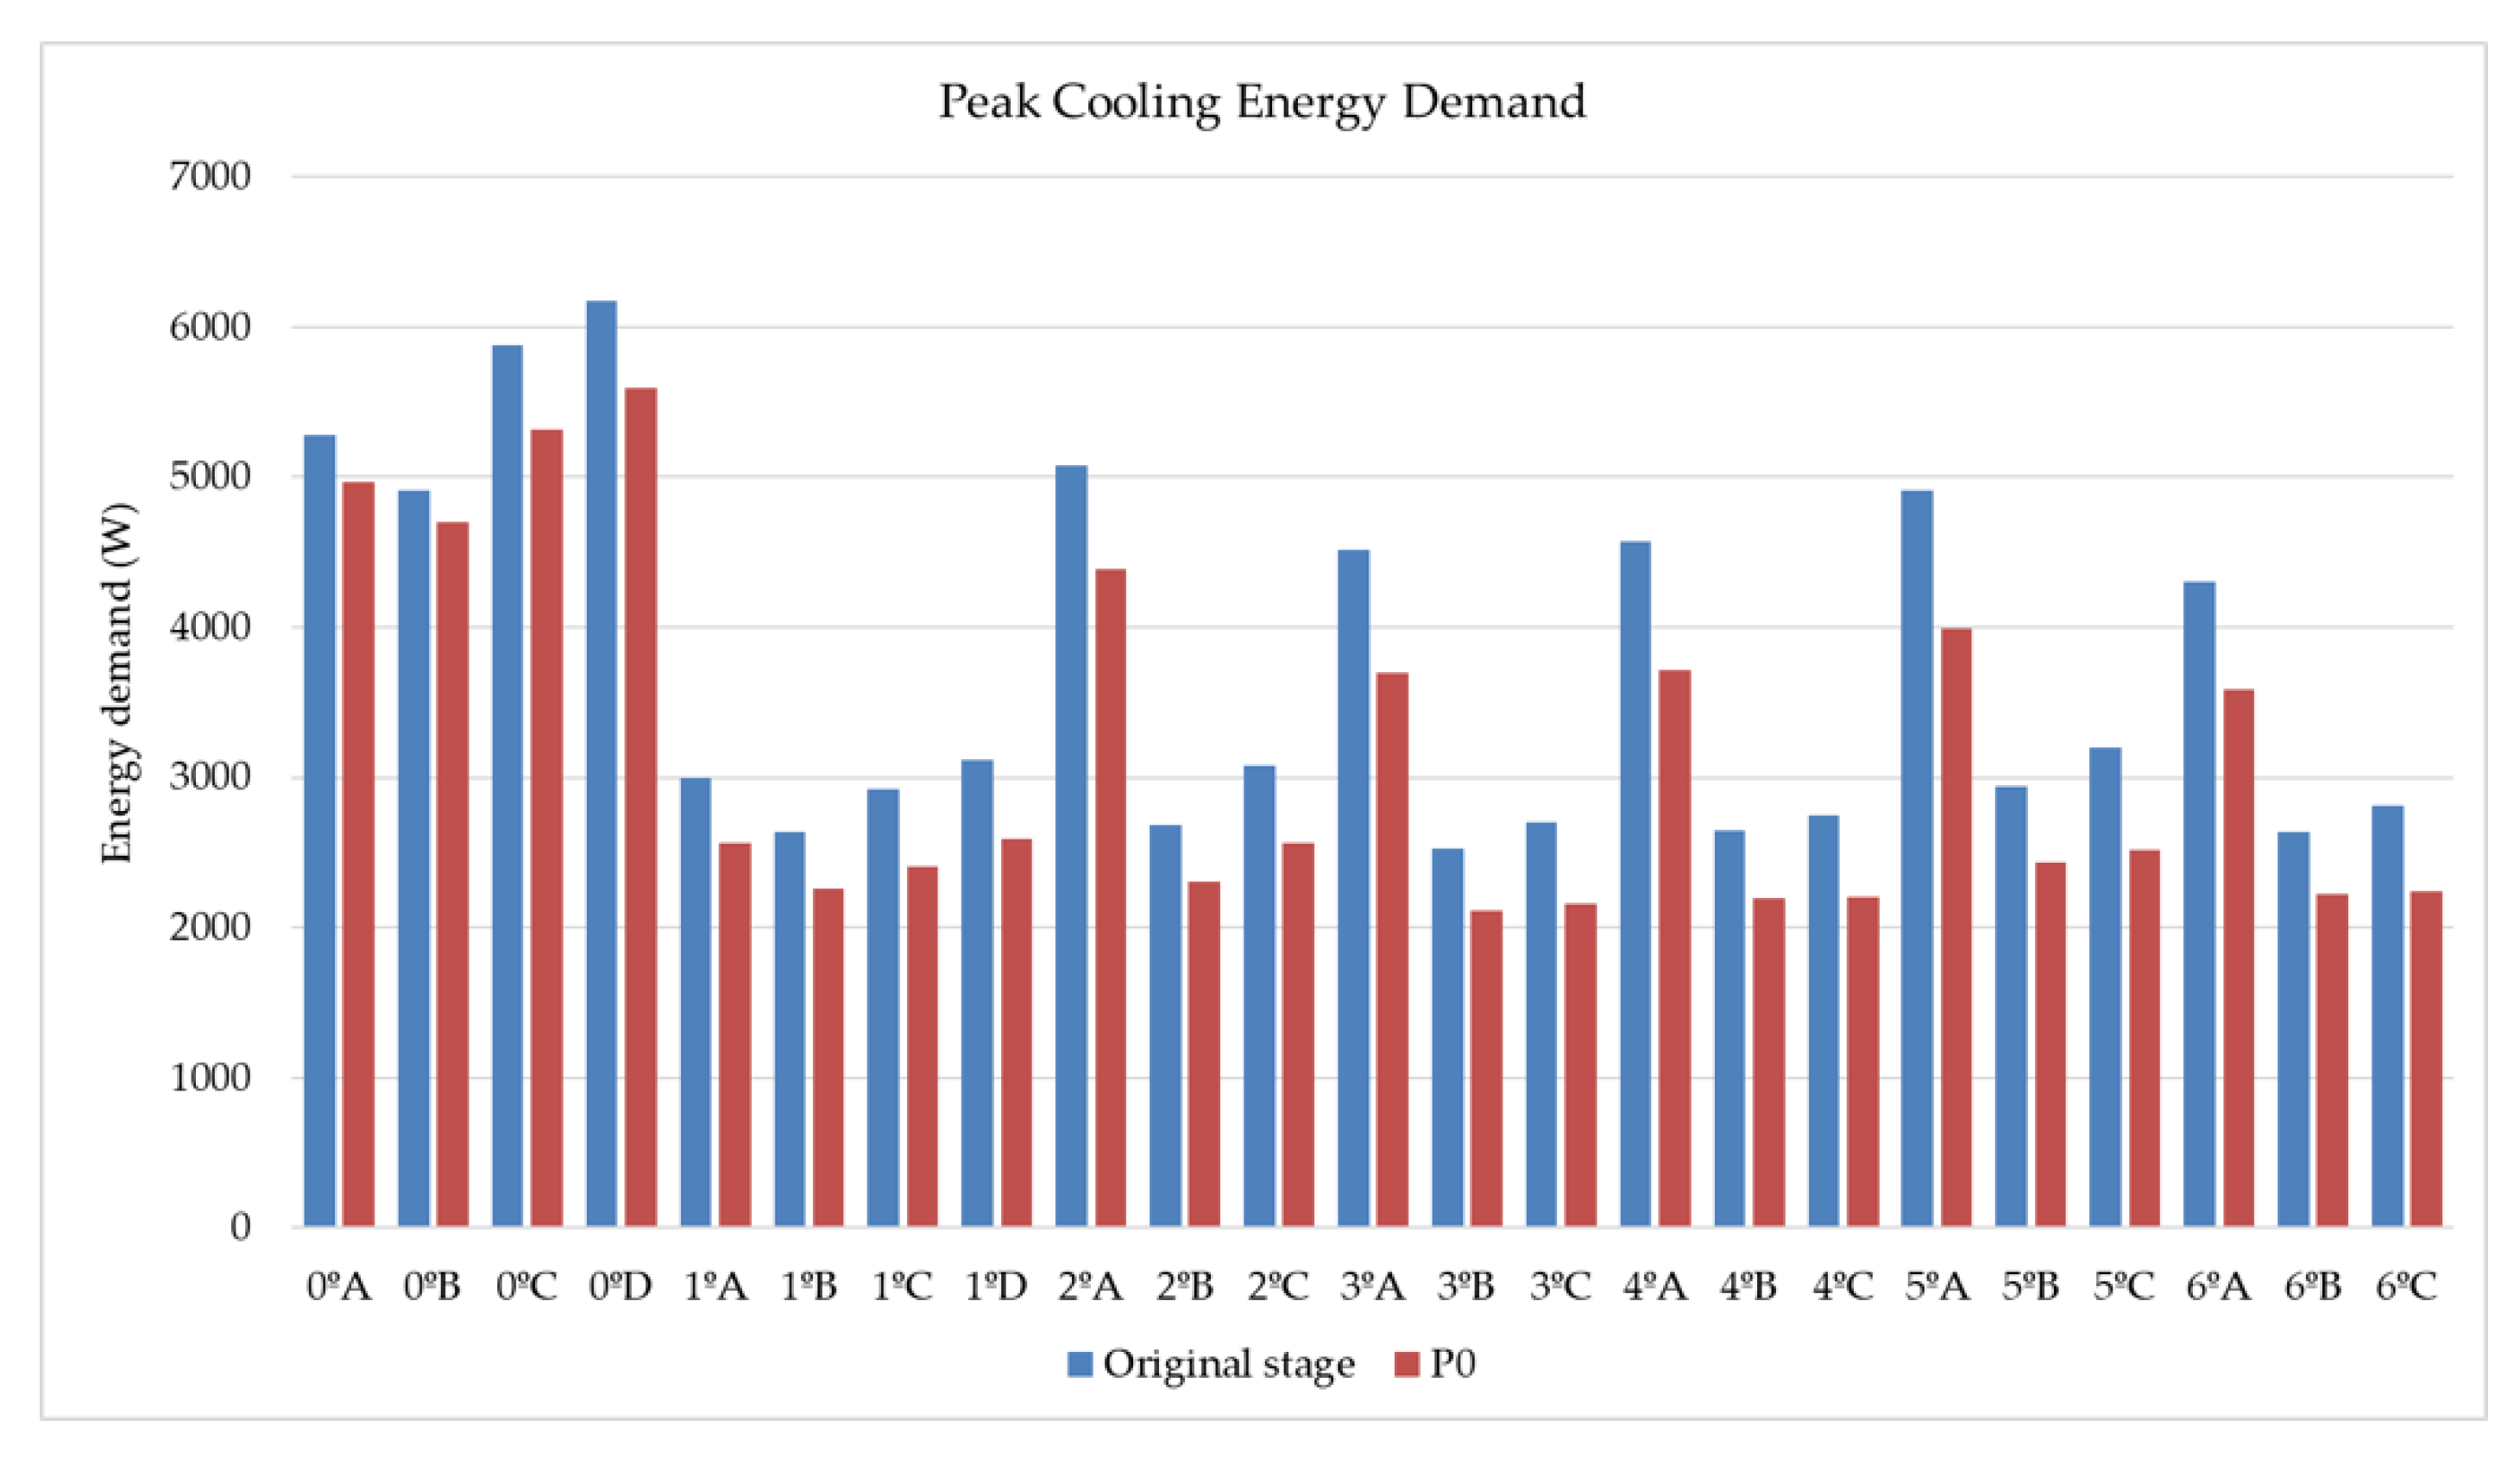
3.1.1. Energy Demand Analysis
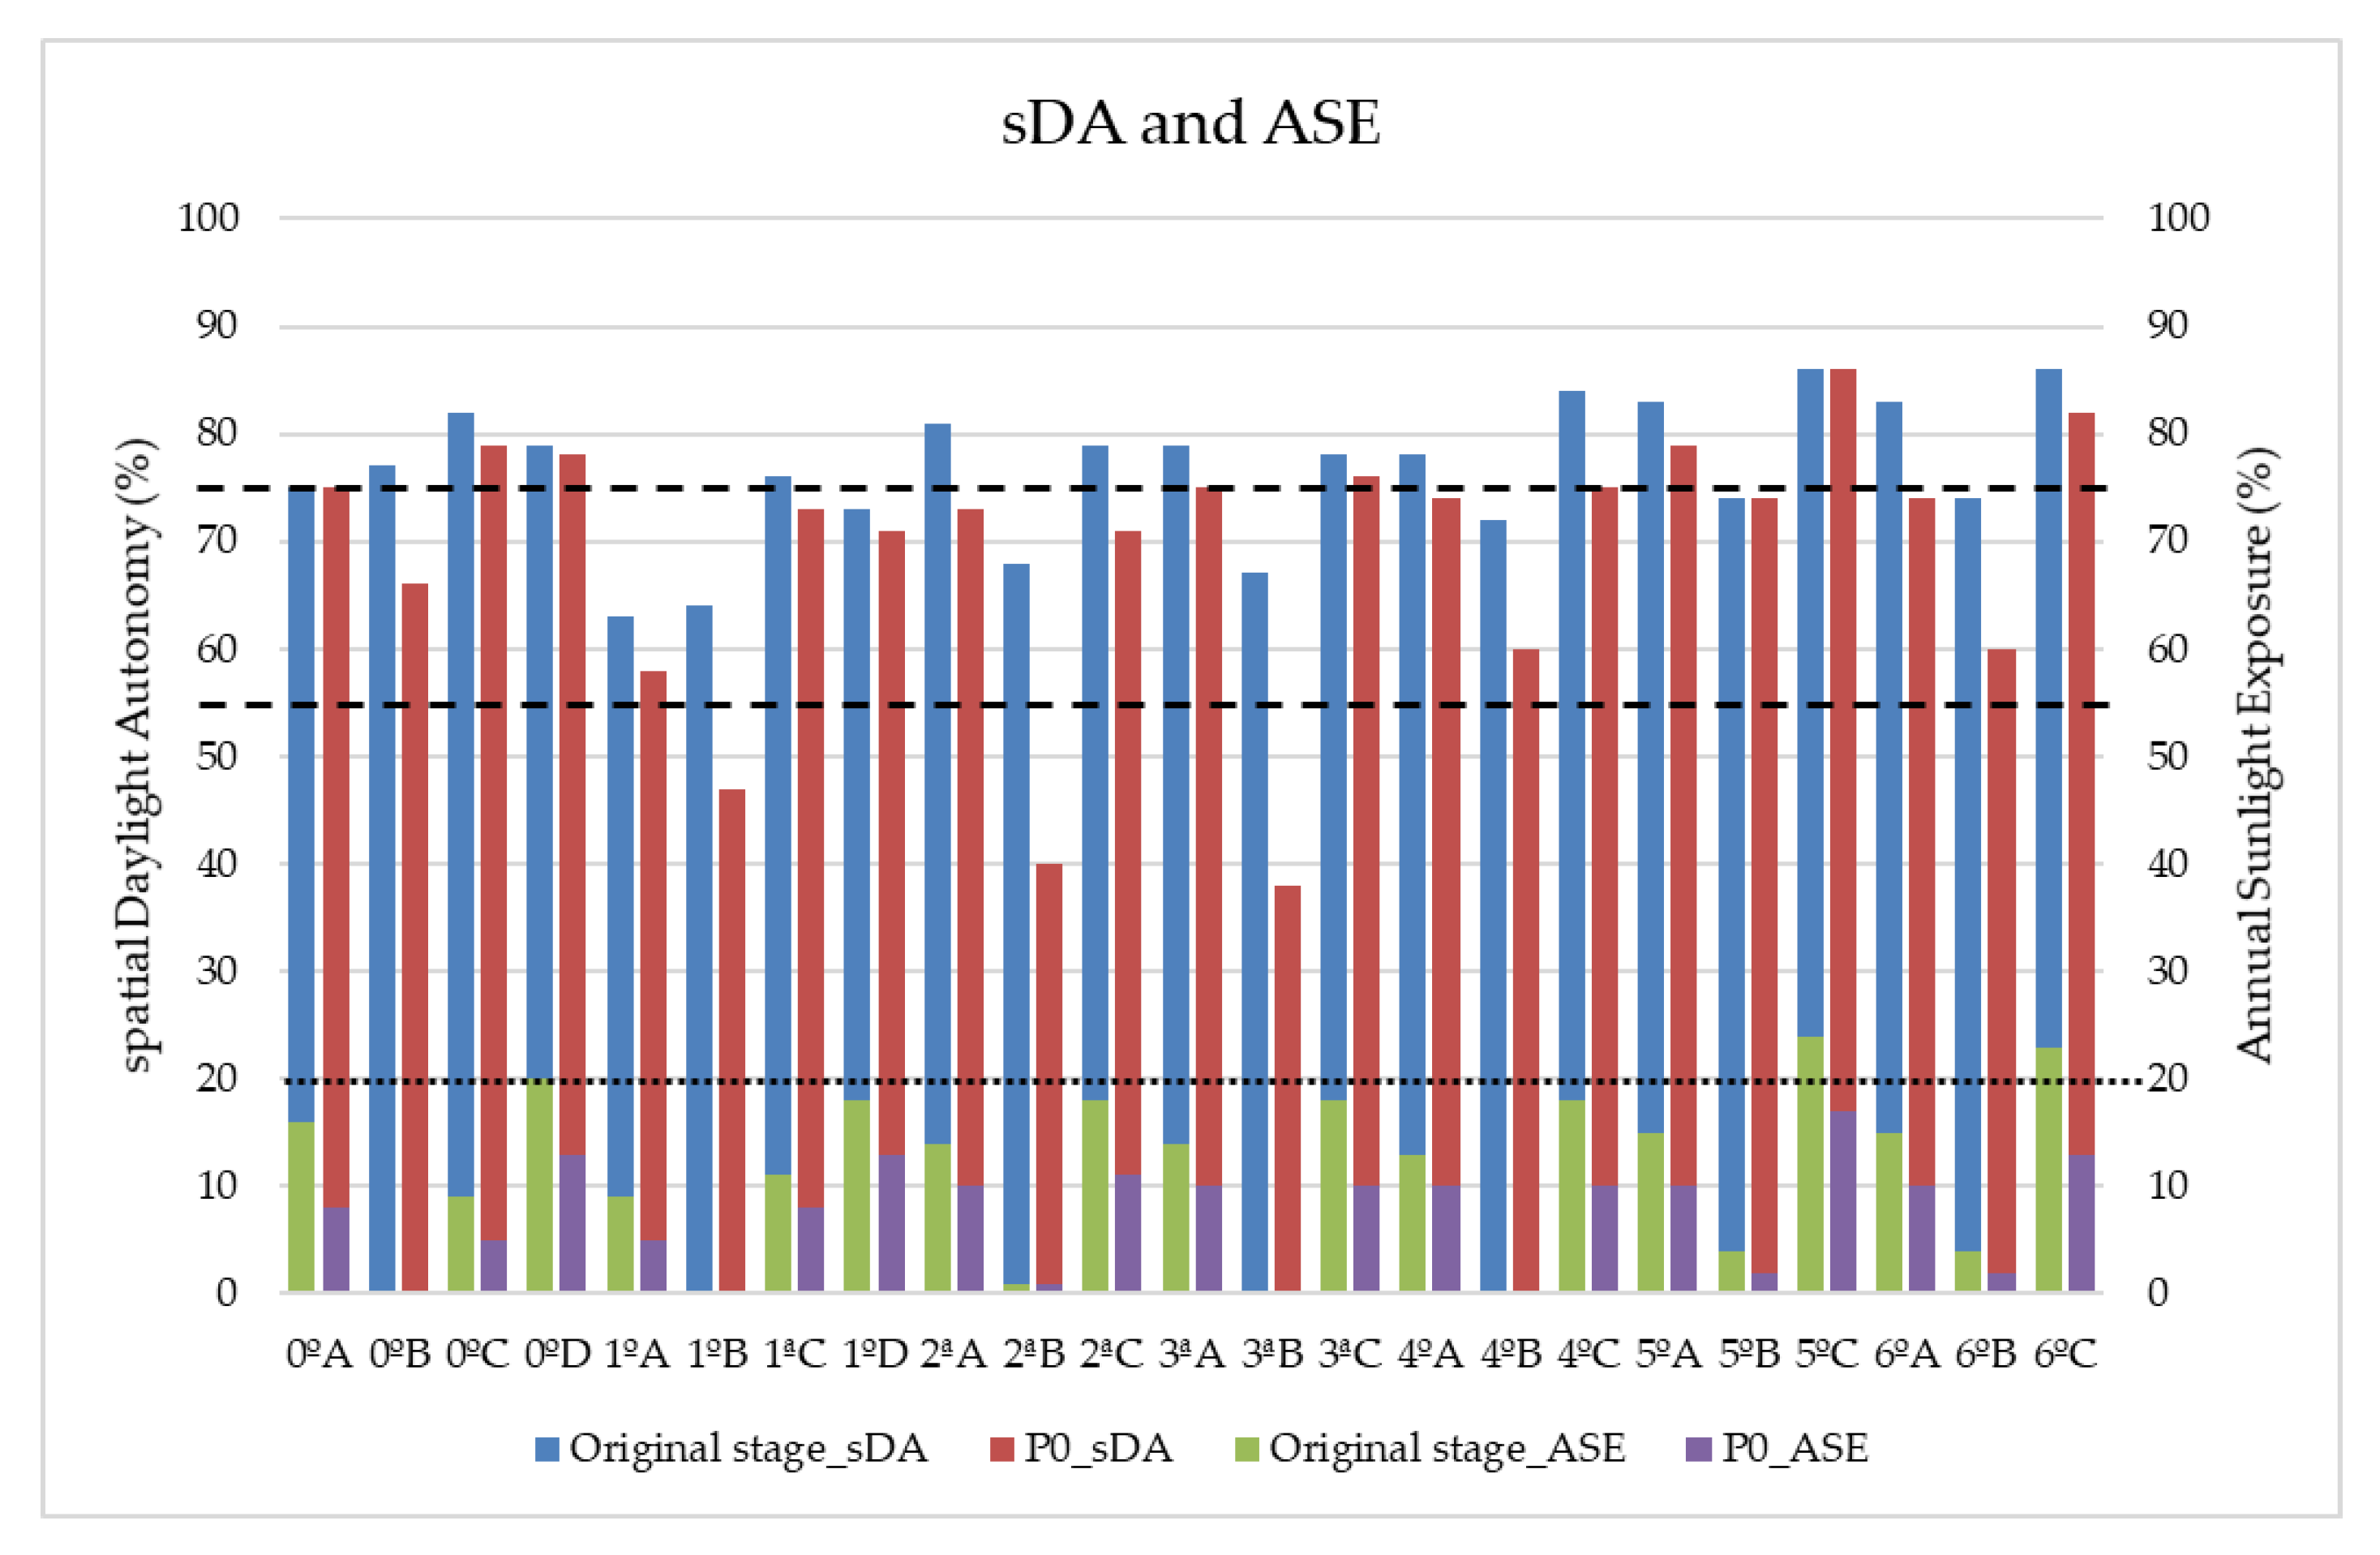
3.1.2. Daylighting and Solar Exposure Analysis
3.2. Refurbishment Proposals
3.2.1. Original Proposal (P0)
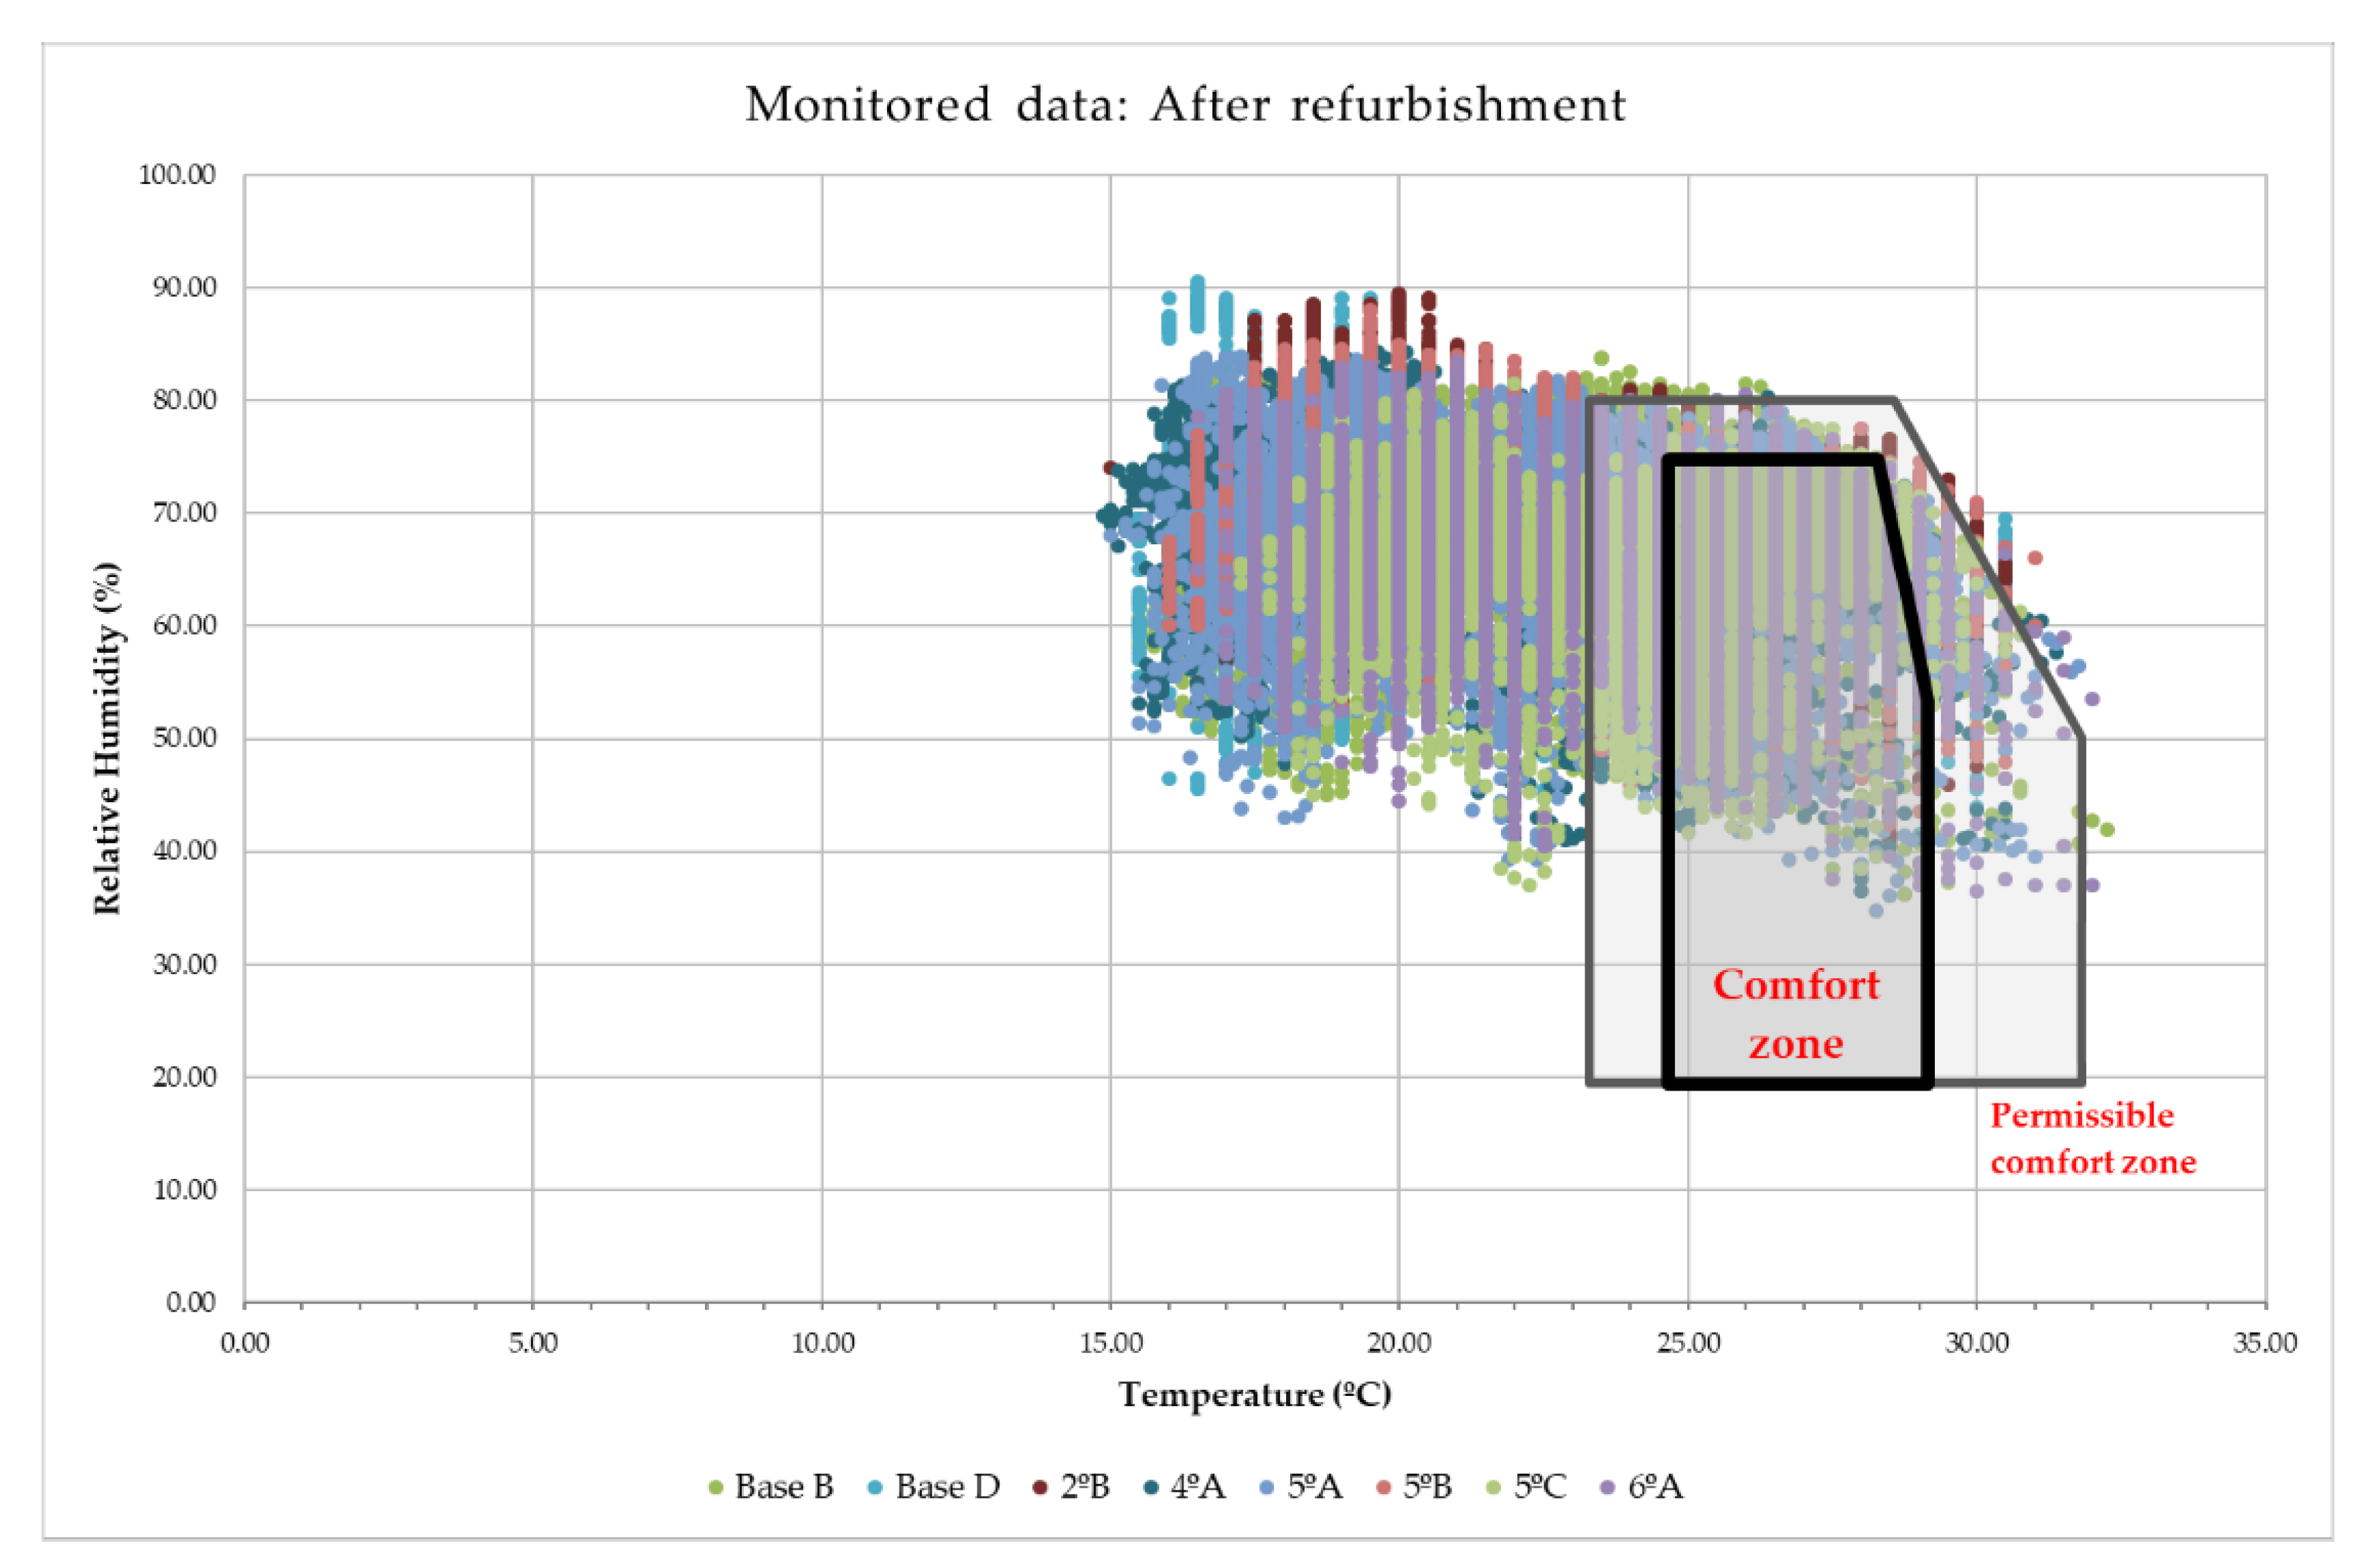
Monitored Data
Energy Demand Analysis
Daylighting and Solar Exposure Analysis
Life Cycle Analysis
- Roof P0 (282.17 m2).
- Lightweight structural concrete, 2501–3000 psi, 0–19% fly ash (80,669 kg, durability: Building life).
- Self-adhering sheet waterproofing, modified bituminous sheet (1539 kg, durability: Building life).
- Extruded polystyrene (XPS) (656.4 kg, durability: 50 years).
- Cement mortar (8766 kg, durability: 60 years).
- Ceramic tile (2863 kg, durability: 60 years).
- Walls P0 (1092.82 m2).
- Expanded polystyrene (EPS) (1834 kg, durability: 50 years).
- Cement mortar (86910 kg, durability: 60 years).
- Windows P0 (287.36 m2).
- Glazing, double pane IGU (6464.95 kg, durability: 40 years).
- Window frame, aluminum, operable, thermal break (1578.40 kg, durability: 45 years, with an adequate disassembly the aluminum can be recycled).
3.2.2. Alternative Proposal (P1)
- Roof P1 (282.17 m2).
- Lightweight structural concrete, 2501–3000 psi, >50% slag (0.21 W/m K, 80,473 kg, durability: Building life).
- P0 modified bituminous sheet (not modified).
- Woodfibre insulation board 220 kg/m3 (0.047 W/m K, 5748.80 kg, durability: 30 years, it can be used as renewable energy at the end of its life).
- Cement mortar 7.01 kgCO2eq/m2 (0.55 W/m K, 8774 kg, durability: 60 years).
- P0 Ceramic tile (not modified).
- Walls P1 (1092.82 m2).
- Cork panels (0.040 W/m K, 34,406 kg, durability: 25 years).
- Cement mortar 3.61 kgCO2eq/m2 (0.33 W/m K, 86,910 kg, durability: Building life).
- Windows P1: 122 kgCO2eq/m2 (maintained U-values, SHGC and transparency, 287.36 m2).
- Glazing, double pane IGU (not modified).
- Window frame, PVC, operable, thermal break (2702.51 kg, durability: 30 years).
4. Discussion
5. Conclusions
Author Contributions
Funding
Acknowledgments
Conflicts of Interest
References
- European Commission. A Clean Planet for All. A European Strategic Long-Term Vision for a Prosperous, Modern, Competitive and Climate Neutral Economy; Communication from the Commission COM (2018) 773 Final; European Commission: Brussels, Belgium, 2018. [Google Scholar]
- European Commission. The European Green Deal; Communication from the Commission COM (2019) 640 Final; European Commission: Brussels, Belgium, 2019. [Google Scholar]
- European Commission. Clean Energy for All Europeans; Communication from the Commission COM (2019) 640 Final; European Commission: Brussels, Belgium, 2016. [Google Scholar]
- European Commission. Sustainable Products in a Circular Economy—Towards an EU Product Policy Framework Contributing to the Circular Economy; Commission Staff Working Document SWD (2019) 91 Final; European Commission: Brussels, Belgium, 2019. [Google Scholar]
- European Commission. A New Circular Economy Action Plan: For a Cleaner and More Competitive Europe; COM (2020) 98 Final; European Commission: Brussels, Belgium, 2020. [Google Scholar]
- Márton, H. Resource Efficiency in the Building Sector; DG Environment FEA91117; Ecorys: Rotterdam, The Netherland, 2014. [Google Scholar]
- Francesco, P.; Alice, M. Circular economy for the built environment: A research framework. J. Clean. Prod. 2017, 143, 710–718. [Google Scholar]
- Ellen MacArthur Foundation. Circular Economy Reports & Publications From The Ellen MacArthur Foundation. Available online: https://www.ellenmacarthurfoundation.org (accessed on 15 July 2015).
- European Commission. Closing the Loop—An EU Action Plan for the Circular Economy; Communication from the Commission to the European Parliament, the Council, the European Economic and Social Committee and the Committee of the Regions COM(2015) 614 Final; European Commission: Brussels, Belgium, 2015. [Google Scholar]
- Faculty of Architecture and the Built Environment|Delft University of Technology. Circular Built Environment. Available online: https://www.tudelft.nl/en/architecture-and-the-built-environment/research/research-themes/circular-built-environment/ (accessed on 10 June 2020).
- Geissdoerfer, M.; Savaget, P.; Bocken, N.M.P.; Hultink, E.J. The Circular Economy—A new sustainability paradigm? J. Clean. Prod. 2017, 143, 757–768. [Google Scholar] [CrossRef] [Green Version]
- Anastasiades, K.; Blom, J.; Audenaert, A. Translating the circular economy to bridge construction: Lessons learnt from a critical literature review. Renew. Sustain. Energy Rev. 2020, 117, 109522. [Google Scholar] [CrossRef]
- European Commission. Renovation wave|Energy. Available online: https://ec.europa.eu/energy/topics/energy-efficiency/energy-efficient-buildings/renovation-wave_en (accessed on 8 June 2020).
- European Commission. Commission Recommendation (EU) 2019/1019 of 7 June 2019 on building modernisation. Off. J. Eur. Union 2019, 165, 70–128. [Google Scholar]
- European Commission. An EU Strategy on Heating and Cooling; Communication from the European Commission COM (2016) 51 Final; European Commission: Brussels, Belgium, 2016. [Google Scholar]
- RHC-ETIP. European Technology and Innovation Platform on Renewable Heating and Cooling. 2050 Vision for 100% Renewable Heating & Cooling in Europe. Available online: https://www.buildup.eu/en/practices/publications/2050-vision-100-renewable-heating-cooling-europe (accessed on 21 January 2020).
- The European Parliament and the Council of the European Union. Directive 2010/31/EU on the Energy Performance of Buildings. Off. J. Eur. Union 2010, 153, 13–35. [Google Scholar]
- The European Parliament and the Council of the European Union. Directive 2012/27/EU on the energy efficiency, amending Directives 2009/125/EC and 2010/30/EU and repealing Directives 2004/8/EC and 2006/32/EC. Off. J. Eur. Union. 2012, 315, 1–56. [Google Scholar]
- The European Parliament and the Council of the European Union. Directive (EU) 2018/844 amending Directive 2010/31/EU on the energy performance of buildings and Directive 2012/27/EU on energy efficiency. Off. J. Eur. Union 2018, 156, 75–91. [Google Scholar]
- Kephalopoulos, S.; Geiss, O.; Barrero-Moreno, J.; D’Agostino, D.; Paci, D. Promoting Healthy and Highly Energy Performing Buildings in the European Union: National Implementation of Related Requirements of the Energy Performance Buildings Directive (2010/31/EU); Science for Policy report 978-92-79-70594-6; Joint Research Centre: Luxemburg, 2017. [Google Scholar]
- European Commission. Impact Assessment Accompanying the Document Proposal for a Directive of the European Parliament and of the Council; Commission Staff Working Document SWD (2016) 414 Final; European Commission: Brussels, Belgium, 2016. [Google Scholar]
- Aranda, J.; Zabalza, I.; Conserva, A.; Millán, G. Analysis of Energy Efficiency Measures and Retrofitting Solutions for Social Housing Buildings in Spain as a Way to Mitigate Energy Poverty. Sustainability 2017, 9, 1869. [Google Scholar] [CrossRef]
- European Commission. Resource Efficiency Opportunities in the Building Sector; Communication from the Commission COM (2014) 445 Final; European Commission: Brussels, Belgium, 2014. [Google Scholar]
- European Commission. Guidelines for the Waste Audits before Demolition and Renovation Works of Buildings; European Commission: Brussels, Belgium, 2018. [Google Scholar]
- European Union. Level (s)—A Common EU Framework of Core Sustainability Indicators for Office and Residential Buildings. Parts 1 and 2: Introduction to Level(s) and How it Works; JCR Technical Reports; Publications Office of the European Union: Luxembourg, 2017. [Google Scholar]
- European Commission. Circular Economy Principles for Buildings Design; European Commission: Brussels, Belgium, 2020. [Google Scholar]
- Hertwich, E.; Lifset, R.; Pauliuk, S.; Heeren, N. Resource Efficiency and Climate Change: Material Efficiency Strategies for a Low-Carbon Future; Report of the International Resource Panel 978-92-807-3771-4; United Nations Environment Programme: Nairobi, Kenya, 2020. [Google Scholar]
- Kunkel, S.; Kontonasiou, E.; Arcipowska, A.; Mariottini, F.; Atanasiu, B. Indoor Air Quality, Thermal Comfort and Daylight. Analysis of Residential Building Regulations in Eight EU Members; Buildings Performance Institute Europe: Brussells, Belgium, 2015. [Google Scholar]
- Kepleis, N.E. The National Human Activity Pattern Survey (NHAPS): A Resource for Assessing Exposure to Environmental Pollutants; Lawrence Berkeley National Laboratory: Berkeley, CA, USA, 2001.
- Dorizas, P.V.; De Groote, M.; Volt, J. The Inner Value of a Building: Linking Indoor Environmental Quality and Energy Performance in Building Regulation; Buildings Performance Institute Europe: Brussells, Belgium, 2018. [Google Scholar]
- European Committee for Standardization. Energy Performance of Buildings—Ventilation for Buildings—Part 1: Indoor Environmental Input Parameters for Design and Assessment of Energy Performance of Buildings Addressing Indoor Air Quality, Thermal Environment, Lighting and Acoustics—Module M1-6; Norma Española EN 16798-1:2019; AENOR: Madrid, Spain, 2019. [Google Scholar]
- European Environment Agency. Environment and Human Health; Joint EEA-JRC Report 1725-9177; European Environment Agency: Bruselas, Belgium, 2013. [Google Scholar]
- World Green Building Council. A Sustainable Built Environment at the Heart of Europe’s Future; WorldGBC: Toronto, ON, USA, 2019. [Google Scholar]
- De Transportes, M.; Urbana, M.Y.A.; De España, G. Boletín Estadístico Online—Información Estadística. Available online: https://apps.fomento.gob.es/BoletinOnline2/ (accessed on 8 June 2020).
- Gobierno de España. Ministerio de Transición Ecológica y el Reto Demográfico. Available online: https://energia.gob.es/desarrollo/EficienciaEnergetica/CertificacionEnergetica/DocumentosReconocidos/Paginas/procedimientos-certificacion-proyecto-terminados.aspx (accessed on 2 February 2020).
- Autodesk. Revit|BIM Software|Autodesk Official Store. Available online: https://www.autodesk.com/products/revit/overview (accessed on 18 September 2019).
- Autodesk. Autodesk Revit 2020|Help. Available online: https://help.autodesk.com/view/RVT/2020/ENU/ (accessed on 9 January 2020).
- U.S. Department of Energy. EnergyPlus. Available online: https://energyplus.net (accessed on 18 September 2019).
- Autodesk. Insight—High Performance and Sustainable Building Design Analysis. Available online: https://insight.autodesk.com/oneenergy (accessed on 9 January 2020).
- Walter, B.; Arbree, A.; Bala, K.; Greenberg, D.P. Multidimensional Lightcuts; International Conference on Computer Graphics and Interactive Techniques: New York, NY, USA, 2006; pp. 1081–1088. [Google Scholar]
- IESNA. Spatial Daylight Autonomy (sDA) and Annual Sunlight Exposure (ASE); LM-83-12; Illuminating Engineering Society of North America: New York, NY, USA, 2012. [Google Scholar]
- KT Innovations. Tally. Available online: https://choosetally.com (accessed on 9 January 2020).
- ISO/TC 207/SC 5. Life cycle assessment. In Environmental Management—Life Cycle Assessment—Principles and Framework; ISO 14040:2006; International Organization for Standardization: Geneva, Switzerland, 2006. [Google Scholar]
- ISO/TC 207/SC 5. Life cycle assessment. In Environmental Management—Life Cycle Assessment—Requirements and Guidelines; ISO 14044:2006; International Organization for Standardization: Geneva, Switzerland, 2006. [Google Scholar]
- ISO/TC 59/SC 17. Sustainability in buildings and civil engineering works. In Sustainability in Buildings and Civil Engineering Works—Core Rules for Environmental Product Declarations of Construction Products and Services; ISO 21930:2017; International Organization for Standardization: Geneva, Switzerland, 2017. [Google Scholar]
- ISO/TC 59/SC 17. Sustainability in buildings and civil engineering works. In Sustainability in Building Construction—Framework for Methods of Assessment of the Environmental Performance of Construction Works—Part 1: Buildings; ISO 21931-1:2010; International Organization for Standardization: Geneva, Switzerland, 2010. [Google Scholar]
- CEN/TC 350. Sustainability of construction works. In Sustainability of Construction Works—Environmental Product Declarations—Core Rules for the Product Category of Construction Products; EN 15804:2012+A2:2019; European Committee for Standardization: Brussels, Belgium, 2019. [Google Scholar]
- CEN/TC 350. Sustainability of construction works. In Sustainability of Construction Works—Assessment of Environmental Performance of Buildings—Calculation Method; EN 15978:2011; European Committee for Standardization: Brussels, Belgium, 2011. [Google Scholar]
- Sphera. Life Cycle Assessment LCA Software. Available online: http://www.gabi-software.com/america/support/gabi/ (accessed on 15 April 2020).
- The European Parliament and the Council of the European Union. Directive 2002/91/EC of the European Parliament and of the Council of 16 December 2002 on the energy performance of buildings. Off. J. Eur. Union 2003, 1, 65–71. [Google Scholar]
- Gobierno de España. Real Decreto 2429/1979, de 6 de julio, por el que se aprueba la norma básica de edificación NBE-CT-79, sobre condiciones térmicas en los edificios. Bol. Of. Estado 1979, 253, 24524–24550. [Google Scholar]
- National Centers for Environmental Information. Integrated Surface Database (ISD)|National Centers for Environmental Information. Available online: https://www.ncdc.noaa.gov/isd (accessed on 20 May 2020).
- ISO/TC 163/SC 2. Calculation methods. In Hygrothermal Performance of Buildings—Calculation and Presentation of Climatic Data—Part 4: Hourly Data for Assessing the Annual Energy Use for Heating and Cooling; ISO 15927-4:2005; International Organization for Standardization: Geneva, Switzerland, 2005. [Google Scholar]
- Climate.OneBuilding.Org. Available online: http://climate.onebuilding.org (accessed on 9 January 2020).
- Ministerio de Fomento. Real Decreto 732/2019, de 20 de diciembre, por el que se modifica el Código Técnico de la Edificación, aprobado por el Real Decreto 314/2006, de 17 de marzo. Bol. Of. Estado 2019, 311, 140488–140674. [Google Scholar]
- Gobierno de España. Ministerio para la Transición Ecológica y el Reto Demográfico. Available online: https://energia.gob.es/desarrollo/EficienciaEnergetica/CertificacionEnergetica/DocumentosReconocidos/normativamodelosutilizacion/1-Condiciones_tecnicas_procedimientos_para_evaluacion_eficiencia_energetica.pdf (accessed on 2 February 2020).
- Instituto de Tecnología de la Construcción de Cataluña—ITeC. Información Ambiental de Productos y Sistemas|BEDEC. Available online: https://itec.es/metabase/productos-sostenibles/0/0/0/ (accessed on 15 April 2020).
- Green Building Council España—GBCe. Declaración Ambiental de Productos—Materiales GBCe. Available online: http://materiales.gbce.es/declaracion-ambiental-de-productos/ (accessed on 15 April 2020).
- Asif, M.; Muneer, T.; Kubie, J. Sustainability analysis of window frames. Build. Serv. Eng. Res. Technol. 2005, 26, 71–87. [Google Scholar] [CrossRef]


| Dwelling | Floor (m2) | Volume (m3) | Orientation | Surface (m2) | Glazing (m2) | Opaque (m2) |
|---|---|---|---|---|---|---|
| Base A 1st A | 56.30 | 154.26 | NWN | 30.50 | 8.82 | 21.68 |
| EN | 13.86 | 5.67 3.24 | 8.19 10.62 | |||
| WS | 6.51 | 1.00 | 5.51 | |||
| Roof 1st A | 28.21 | 0.00 | 28.21 | |||
| Base B 1st B | 56.30 | 154.26 | NWN | 30.50 | 8.82 | 21.68 |
| EN | 6.51 | 1.00 | 5.51 | |||
| WS | 13.86 | 2.52 2.07 | 11.34 11.79 | |||
| Roof 1st B | 12.23 | 0.00 | 12.23 | |||
| Base C 1st C | 56.30 | 154.26 | EN | 8.11 | 1.00 | 7.11 |
| SES | 30.50 | 8.82 | 21.68 | |||
| WS | 13.86 | 2.52 2.07 | 11.34 11.79 | |||
| Roof 1st C | 12.23 | 0.00 | 12.23 | |||
| Base D 1st D | 56.30 | 154.26 | EN | 13.86 | 5.67 3.24 | 8.19 10.62 |
| SES | 30.50 | 8.82 | 21.68 | |||
| WS | 8.11 | 1.00 | 7.11 | |||
| Roof 1st D | 28.21 | 0.00 | 28.21 | |||
| 2nd A 3rd A 4th A | 84.55 | 231.67 | NWN | 30.50 | 5.04 | 25.46 |
| EN | 21.21 | 4.41 | 16.80 | |||
| SES | 30.50 | 5.04 | 25.46 | |||
| WS | 6.93 | 1.00 | 5.93 | |||
| 2nd B 3rd B 4th B | 58.37 | 159.93 | NWN | 30.50 | 5.04 | 25.46 |
| EN | 3.56 | 0.36 | 3.20 | |||
| WS | 14.36 | 1.87 | 12.49 | |||
| 2nd C 3rd C 4th C | 58.37 | 159.93 | EN | 10.96 | 1.36 | 9.60 |
| SES | 30.50 | 5.04 | 25.46 | |||
| WS | 14.36 | 1.87 | 12.49 | |||
| 5th A 6th A | 84.55 | 231.67 | NWN | 30.50 | 8.61 | 21.89 |
| EN | 21.21 | 4.00 | 17.21 | |||
| SES | 30.50 | 8.61 | 21.89 | |||
| WS | 6.93 | 1.00 | 5.93 | |||
| Roof 6th A | 84.55 | 0.00 | 84.55 | |||
| 5th B 6th B | 58.37 | 159.93 | NWN | 30.50 | 8.61 | 21.89 |
| EN | 3.56 | 0.36 | 3.20 | |||
| WS | 14.36 | 1.60 | 12.76 | |||
| Roof 6th B | 58.37 | 0.00 | 58.37 | |||
| 5th C 6th C | 58.37 | 159.93 | EN | 10.96 | 1.36 | 9.60 |
| SES | 30.50 | 8.61 | 21.89 | |||
| WS | 14.36 | 1.60 | 12.76 | |||
| Roof 6th C | 58.37 | 0.00 | 58.37 | |||
| 23 dwellings | 1456.85 | 3391.77 | NWN | 426.95 | 99.96 | 326.99 |
| EN | 284.55 | 55.64 | 228.92 | |||
| SES | 426.95 | 99.96 | 326.99 | |||
| WS | 262.94 | 35.80 | 227.14 | |||
| Walls | 1380.18 | 287.36 | 1092.82 | |||
| Roof | 282.17 | 0.00 | 282.17 | |||
| Total | 1662.35 | 287.36 | 1374.99 |
| Adjacency | Envelope Component | Maximum U-Value (W/m2K) | Case U-Value (W/m2K) |
|---|---|---|---|
| External | Roof | 1.40 | 0.53 |
| Walls (≤200 kg/m2) | 1.20 | 0.56 | |
| No heated spaces | Floors | No value | 1.06 |
| Interior walls | 2.00 | 0.56 |
| Envelope Component | Initial U-Value (W/m2K) | P0 U-Value (W/m2K) | % Improve | min U-Value Requirement (W/m2K) |
|---|---|---|---|---|
| Roof | 0.53 | 0.39 | 25.85% | 0.50 |
| Walls | 0.56 | 0.34 | 38.43% | 0.70 |
| Windows | 5.80 | 3.20 | 44.83% | 2.70 |
| Environmental Impacts/Area | Product Stage [A1–A3] | Construction Stage [A4] | Use Stage [B2–B5] | End of Life Stage [C2–C4] |
|---|---|---|---|---|
| GWP (kgCO2eq/m2) | 69.30 | 1.265 | 25.90 | 4.256 |
| AP (kgSO2eq/m2) | 0.2248 | 0.00586 | 0.1293 | 0.0207 |
| EP (kgNeq/m2) | 0.011 | 4.771x10⁻⁴ | 0.006702 | 0.001542 |
| SFP (kgO3eq/m2) | 3.253 | 0.1936 | 1.815 | 0.3937 |
| ODP (kgCFC-11eq/m2) | 9.879 × 10⁻⁹ | 4.331 × 10⁻¹⁴ | 1.034 × 10⁻⁹ | 6.392 × 10⁻¹² |
| PED (MJ/m2) | 840.5 | 18.39 | 485.1 | 72.74 |
| NRED (MJ/m2) | 765.1 | 17.95 | 435.8 | 68.04 |
| RED (MJ/m2) | 76.00 | 0.4447 | 49.65 | 4.769 |
| Concrete | Thermal and Moisture Protection | Openings and Glazing | Finishes | Total General | |
|---|---|---|---|---|---|
| GWP (kgCO2eq) | 23,074.53 | 17,343.54 | 42,402.30 | 63,650.03 | 146,470.40 |
| AP (kg SO2eq) | 96.82 | 37.23 | 247.39 | 284.59 | 666.03 |
| EP (kg Neq) | 4.46 | 3.55 | 12.72 | 11.47 | 32.20 |
| ODP (CFC-11eq) | 5.54 × 10⁻⁹ | 6.02 × 10⁻⁷ | 2.17 × 10⁻⁶ | 1.34 × 10⁻⁴ | 1.37 × 10⁻⁴ |
| SFP (kgO3eq) | 1390.41 | 858.95 | 3048.84 | 4687.00 | 9985.19 |
| PED (MJ) | 289,903.34 | 515,964.91 | 629,336.58 | 726,795.01 | 2,161,999.84 |
| NRED (MJ) | 258,614.11 | 505,580.22 | 571,342.73 | 669,662.07 | 2,005,199.13 |
| RED (MJ) | 31,398.96 | 10,388.69 | 59,432.54 | 57,028.73 | 158,248.91 |
| Mass (kg) | 80,404.84 | 6519.31 | 16,045.01 | 101,878.64 | 204,847.81 |
| GWP (%) | AP (%) | EP (%) | ODP (%) | SFP (%) | PED (%) | NRED (%) | RED (%) | Mass (%) | |
|---|---|---|---|---|---|---|---|---|---|
| Roofs | 23.12 | 24.98 | 28.57 | 9.69 | 24.26 | 26.81 | 26.54 | 30.26 | 46.65 |
| Ceramic tile | 0.33 | 0.40 | 0.65 | 0.00 | 0.47 | 0.76 | 0.78 | 0.60 | 1.40 |
| Cement grout | 0.25 | 0.19 | 0.26 | 0.69 | 0.25 | 0.18 | 0.17 | 0.29 | 0.27 |
| Cement mortar | 3.39 | 2.53 | 3.31 | 8.91 | 3.45 | 2.38 | 2.38 | 2.39 | 4.27 |
| XPS | 1.06 | 2.54 | 2.34 | 0.00 | 1.39 | 5.08 | 5.23 | 3.29 | 0.64 |
| bitumen | 0.71 | 0.94 | 0.84 | 0.08 | 0.76 | 2.24 | 2.34 | 0.89 | 0.75 |
| concrete | 17.38 | 18.37 | 21.18 | 0.01 | 17.94 | 16.17 | 15.65 | 22.80 | 39.33 |
| Walls | 40.97 | 37.59 | 44.35 | 88.73 | 46.63 | 45.00 | 45.87 | 33.57 | 45.52 |
| Paint acrylic | 3.70 | 5.52 | 3.63 | 0.00 | 6.36 | 5.63 | 5.46 | 7.70 | 1.36 |
| Cement mortar | 33.62 | 25.11 | 32.81 | 88.36 | 34.22 | 23.59 | 23.56 | 23.73 | 42.37 |
| EPS | 3.64 | 6.96 | 7.91 | 0.36 | 6.05 | 15.78 | 16.85 | 2.14 | 1.79 |
| Windows | 35.91 | 37.43 | 27.09 | 1.59 | 29.11 | 28.18 | 27.59 | 36.17 | 7.82 |
| Glazing | 20.91 | 18.33 | 11.86 | 0.01 | 17.52 | 11.99 | 12.32 | 8.13 | 6.30 |
| Hardware alum | 0.29 | 0.16 | 0.32 | 0.02 | 0.19 | 0.36 | 0.32 | 0.87 | 0.10 |
| Frame alum | 14.70 | 18.94 | 14.91 | 1.56 | 11.40 | 15.83 | 14.95 | 27.18 | 1.42 |
| GWP | AP | EP | ODP | SFP | PED | NRED | RED | M | |
|---|---|---|---|---|---|---|---|---|---|
| Original proposal P0 | |||||||||
| Roofs | 44,719.13 | 159.31 | 8.49 | 1.33 × 10⁻⁵ | 2540.94 | 598,800.46 | 549,556.57 | 49,725.19 | 95,693.00 |
| Cement mortar | 5181.68 | 23.37 | 0.86 | 1.22 × 10⁻⁵ | 361.52 | 53,131.74 | 49,200.12 | 3932.50 | 8766.17 |
| XPS | 3656.26 | 7.29 | 0.86 | 1.67 × 10⁻⁹ | 145.58 | 113,544.42 | 108,196.19 | 5402.00 | 1312.87 |
| concrete | 33153.1 | 119.72 | 6.24 | 7.36 × 10⁻⁹ | 1878.98 | 361,035.69 | 323,997.06 | 37471.4 | 80,668.53 |
| Walls | 69,427.54 | 282.23 | 12.77 | 1.21 × 10⁻⁴ | 4883.99 | 1,004,995.15 | 949,682.78 | 55,163.63 | 93,373.48 |
| Cement mortar | 51,370.96 | 231.65 | 8.53 | 1.21 × 10⁻⁴ | 3584.06 | 526,745.71 | 487,767.75 | 38,986.66 | 86,907.39 |
| EPS | 12,378.94 | 25.07 | 2.36 | 4.92 × 10⁻⁷ | 633.41 | 352,432.97 | 348,861.60 | 3523.55 | 3667.91 |
| Windows | 42,402.30 | 247.39 | 12.72 | 2.17 × 10⁻⁶ | 3048.84 | 629,336.58 | 571,342.73 | 59,432.54 | 16,045.01 |
| Alum frame | 23,345.56 | 101.30 | 6.44 | 2.13 × 10⁻⁶ | 1194.42 | 353,545.69 | 309,474.77 | 44,655.52 | 2914.78 |
| Total general | 156,548.97 | 688.93 | 33.97 | 1.37 × 10⁻⁴ | 10,473.76 | 2,233,132.20 | 2,070,582.08 | 164,321.36 | 205,111.50 |
| Proposal 1: Materials substitution | |||||||||
| Roofs | 23,669.94 | 141.48 | 6.84 | −4.63 × 10⁻⁴ | 2072.21 | 781,144.61 | 569,819.87 | 152,392.25 | 139241.18 |
| Cement mortar | 1978.01 | 8.92 | 0.33 | 4.65 × 10⁻⁶ | 138.00 | 20,282.07 | 18,781.24 | 1501.16 | 8766.17 |
| Woodfibre | −9725.84 | 1.58 | 0.59 | −4.82 × 10⁻⁴ | 0.08 | 342,339.93 | 171,169.97 | 112,132.52 | 35,735.27 |
| concrete | 23,094.07 | 96.90 | 4.47 | 5.54 × 10⁻⁹ | 1391.59 | 290,148.80 | 258,833.09 | 31,425.54 | 80,472.92 |
| Walls | −89,837.66 | 1105.66 | 230.42 | 9.31 × 10⁻⁶ | 16,073.59 | 806,211.93 | 393,269.26 | 412,329.34 | 192,922.27 |
| Cement mortar | 3945.08 | 17.79 | 0.66 | 9.29 × 10⁻⁶ | 275.24 | 40,451.92 | 37,458.57 | 2994.02 | 86,907.39 |
| Cork | −99,460.39 | 1062.36 | 227.88 | 1.82 × 10⁻⁸ | 15,131.83 | 639,943.54 | 242,757.26 | 396,681.89 | 103,216.70 |
| Windows | 34,367.10 | 186.00 | 10.76 | 4.69 × 10⁻⁷ | 2468.35 | 554,928.09 | 515,488.35 | 40,354.22 | 18,733.34 |
| PVC frame | 15,310.36 | 39.91 | 4.48 | 4.34 × 10⁻⁷ | 613.93 | 279,137.20 | 253,620.39 | 25,577.19 | 5603.11 |
| Total general | −31,800.62 | 1433.14 | 248.02 | −4.53 × 10⁻⁴ | 20,614.15 | 2,142,284.63 | 1,478,577.48 | 605,075.80 | 350,896.79 |
© 2020 by the authors. Licensee MDPI, Basel, Switzerland. This article is an open access article distributed under the terms and conditions of the Creative Commons Attribution (CC BY) license (http://creativecommons.org/licenses/by/4.0/).
Share and Cite
Mercader-Moyano, P.; Esquivias, P.M.; Muntean, R. Eco-Efficient Analysis of a Refurbishment Proposal for a Social Housing. Sustainability 2020, 12, 6725. https://doi.org/10.3390/su12176725
Mercader-Moyano P, Esquivias PM, Muntean R. Eco-Efficient Analysis of a Refurbishment Proposal for a Social Housing. Sustainability. 2020; 12(17):6725. https://doi.org/10.3390/su12176725
Chicago/Turabian StyleMercader-Moyano, Pilar, Paula M. Esquivias, and Radu Muntean. 2020. "Eco-Efficient Analysis of a Refurbishment Proposal for a Social Housing" Sustainability 12, no. 17: 6725. https://doi.org/10.3390/su12176725