Article

Multi-Scale Analysis of Green Space for Human Settlement Sustainability in Urban Areas of the Inner Mongolia Plateau, China

1
College of resources and Environmental Economics, Inner Mongolia University of Finance and Economics, Inner Mongolia, Hohhot 010070, China
2
Resource Utilization and Environmental Protection Coordinated Development Academician Expert Workstation in the North of China, Inner Mongolia University of Finance and Economics, Inner Mongolia, Hohhot 010070, China
3
College of Geography and Tourism, Qufu Normal University, Shandong, Rizhao 276826, China
4
Department of Geography, Ghent University, 9000 Ghent, Belgium
5
Land Research Center of Qufu Normal University, Shandong, Rizhao 276826, China
*
Author to whom correspondence should be addressed.
Sustainability 2020, 12(17), 6783; https://doi.org/10.3390/su12176783
Submission received: 19 July 2020 / Revised: 9 August 2020 / Accepted: 18 August 2020 / Published: 21 August 2020
(This article belongs to the Section Sustainable Urban and Rural Development)

Abstract

:
Green space in intra-urban regions plays a significant role in improving the human habitat environment and regulating the ecosystem service in the Inner Mongolian Plateau of China, the environmental barrier region of North China. However, a lack of multi-scale studies on intra-urban green space limits our knowledge of human settlement environments in this region. In this study, a synergistic methodology, including the main process of linear spectral decomposition, vegetation-soil-impervious surface area model, and artificial digital technology, was established to generate a multi-scale of green space (i.e., 15-m resolution intra-urban green components and 0.5-m resolution park region) and investigate multi-scale green space characteristics as well as its ecological service in 12 central cities of the Inner Mongolian Plateau. Results showed that: (1) Total urban areas and urban green space across the studied cities were 1249.87 km2 and 295.40 km2, indicating that the average proportion of green space to urban areas was 24.03%. (2) The proportion of green space to urban areas ranged from 17.09% to 32.17%, and the proportion of parks’ green space to green space ranged from 5.55% to 50.20%, indicating a wide range of quantitative discrepancies. (3) In different climate regions, there were higher proportions of urban/park green space in arid/semi-arid areas to reduce the impacts of dry climate on human settlements; by contrast, lower green space in humid areas mainly displayed a scattered pattern because of the relatively lower influence of climate pressure. (4) Green coverage was an essential indicator of the “Beautiful China” project, and its ratio within 500-m ecological service zones from parks across all cities was 46.14%, which indicated that the ratio of residential land and green space was close to 1:1. Overall, urban/park green space patterns in urban areas adapted to the different climate features in the Inner Mongolian Plateau. For better human settlement sustainability across all studied cities, more greening patches and ecological corridors should be designed in the lower green space regions of the Inner Mongolian Plateau.

1. Introduction

Green space becomes more significant in enhancing human quality and regulating ecosystem service under a fast urbanization process. Climate warming and the aggregated urban impervious surface area deteriorate the issues of urban heat island, environmental pollution, and floods in the fields of land use changes and environments [1]. Thus, the construction of a “healthy city” and “livable city” became one of the focuses of the United Nations Sustainable Development Goals 2030 (i.e., SDGs 2030). The concept of these urban constructions emphasizes sustainable human settlements, which are safe, resilient to disasters, and aesthetic. Intra-urban green space is a significant indicator for these constructions [2,3]. Besides, the “Future Earth” program focuses on the urban human-land relationship and sustainable development within the global development process [4]. Meanwhile, in China, according to the goal of the urban development 2035 and 2050 project, the visions of “Beautiful China”, “Homeland Beauty”, and “City Beauty” will be achieved through improving urban ecological resilience and climate adaptability [5]. As a core constituent of urban aesthetics and urban environment, green space is critical to achieving the above goal [6].
Green space plays a critical role in improving urban ecological health and promoting human living environment [7]. Green space in intra-urban regions usually comprises parks, residential areas, production areas, protective areas, and other green spaces [8]. The measures of effective urban layout planning, scientific control of urban development boundaries, and the coordination of urban life-production-ecology interactions facilitate a healthy urban development [9]. Furthermore, the regulating proportion of green space within densely impervious surface areas will alleviate urban heat island effect and improve human comfort [10]. Also, the maintaining a sound ratio between urban impervious surface area and green space will help relieve urban flash flood issue [11]. Urban green/park space is significant to increase the regulation of the urban environments. However, due to the influence factors of geographical features, socio-economic development, human activities, and urban development planning, the intra-urban land structure in different regions exhibit high spatial heterogeneity [12]. As an important branch of this heterogeneity, accurate characterization of green space information is useful to provide the reference for human livability [13].
Furthermore, in order to explore the green surface, the access to green areas, and the general benefits for city dwellers resulting from green areas, related studies have also been carried out. A comprehensive analysis of the spatial distribution, influence, and quality of urban green space was applied to the Polish city of Tczew, Europe. The assessed urban green space occupies over 19% of Tczew’s territory, with an equivalent of 70.6 m2 per resident. The managed green space is unevenly distributed, with more than half of these areas observed in the Stare Miasto (Old Town) district of Tczew [14]. Meanwhile, a spatial interaction model was applied to assess the accessibility of district parks in Hong Kong, Asia, using the population in catchment zones lying within a walking distance of 400 m, considering the population that the parks serve, the distance between residential areas and parks, the park area, and the facilities and current condition of green space in the parks [15]. Further, a subgroup of the dataset from the Brazilian longitudinal study of Adult Health ELSA-BRASIL (n = 3418) was used to identify the correlation between the medical diagnosis of hypertension and green space in São Paulo, Brazil, and found positive impacts of green spaces on human health [16].
Urban green space exerts different physical and social functions depending on its vegetation types [17,18]. It is a significant indicator of human settlement environment and future urban development [19]. Currently, there is still the challenge to identify green space in intra-urban regions from remotely sensed products. One of these challenges is how to accurately identify different urban green types. Previous literature has shown that the linear spectral mixture analysis (LSMA), combined with the V-I-S model, can produce a typical urban impervious surface and green space fractions [20,21]; Meanwhile, combining highly accurate road information and POI point data can effectively improve the accuracy of identifying urban green space [22]. Although high spatial resolution images show a better spatial resolution compared to other terrestrial-based satellite sensors, there is still difficulty in the automatic extraction of target objects with high accuracy, since the same object may have different spectral signatures, and similar spectral signatures can correspond to different objects. Data with moderate spatial resolution, such as those from Landsat, have been widely used in mapping land cover, as they freely available, relatively easy to process, and have good spectral properties. In this study, we mainly use Landsat images to extract intra-urban green space. For the park area within the urban region, we use high-resolution images and artificial digital techniques to obtain this information [23,24].
From the above information, we know that urban green space is very significant. At present, the spatial heterogeneity and hierarchical scale of intra-urban green space information in the Inner Mongolia Plateau of China are lacking. To generate a multi-scale of green space and investigate green space characteristics, as well as the ecological service in the Inner Mongolian Plateau, the goals of the study are the following: (1) to establish a multi-scale green space (i.e., intra-urban green space component scale and park green space scale) methodology using Landsat and high-resolution images processed with multiple synergistic techniques; (2) to analyze the changes in areas, rates, and spatial differences in green space, particularly the differences in intra-urban green space distribution under dry and humid climatic zones; and (3) to quantify green service characteristics from the perspective of the “Beautiful China” project.

2. Materials and Methods

2.1. Study Area

The Inner Mongolia Plateau is located in North China (37°24′–53°23′ N, 97°12′–126°04′ E) and covers an area of 1.18 million km2 [25]. This region occupies about 12.30% of Chinese terrestrial land and plays an important role as the environmental barrier region of North China. The Inner Mongolia Plateau is mainly dominated by temperate continental climate. The Inner Mongolia Plateau stretches from northeast to southwest in a narrow and elongated shape. It has a straight-line distance of 2400 km from the east to the west. Due to the long span of the study area from the west to the east, crossing different climatic zones, there are large differences in precipitation between the east (mean annual precipitation 400–600 mm) and the west (mean annual precipitation 100–200 mm). The precipitation difference leads to complex ecosystems, which include the composite ecosystem comprising forest, grassland, and agricultural land in the east, the grassland ecosystem in the middle, and the desert ecosystem in the west. The inner Mongolia Plateau includes 12 administrative cities [25], i.e., Hohhot, Baotou, Ordos, Tongliao, Chifeng, Hulunbuir, Ulanqab, Bayannur, Wuhai, Hinggan League, Xilin Gol League, and Alxa League (Figure 1). In this study, we focus on all cities, as these cities have become the regional centers of politics, economy, culture, and transportation. The identification of green space in these cities would help to effectively characterize the spatial distribution of intra-urban green space across the whole Inner Mongolia Plateau region.

2.2. Data Source

In this study, the data were used to characterize the spatial distribution of urban green space, and these datasets consisted of Landsat images, China’s land use/cover dataset, auxiliary data, and high-resolution imagery. Among these datasets, China’s land use/cover data (available from http://www.resdc.cn/) were used to obtain the boundaries of the studied cities [26,27]. Then, within the boundary of each city, Landsat OLI images (downloaded from https://earthexplorer.usgs.gov) were used as the main dataset to identify the spatial distribution of green space. Simultaneously, auxiliary datasets included administrative divisions, city roads (i.e., primary roads, secondary roads, and branch roads), POI information point, building footprints, and population sizes, were applied to assist in obtain urban green space. Information on administrative divisions was downloaded from the National Geomatics Center of China (http://www.ngcc.cn/ngcc/), roads and POI datasets were obtained from OpenStreetMap (OSM), and population data were provided by the statistical yearbook of the Inner Mongolia autonomous region. Finally, to validate the extracted green space, we applied Google imagery, which was downloaded from the authorized professional software. The downloaded Google imagery focused on summer, with a spatial resolution of 0.5-m. Table 1 provides the detailed information of the datasets used in this study.

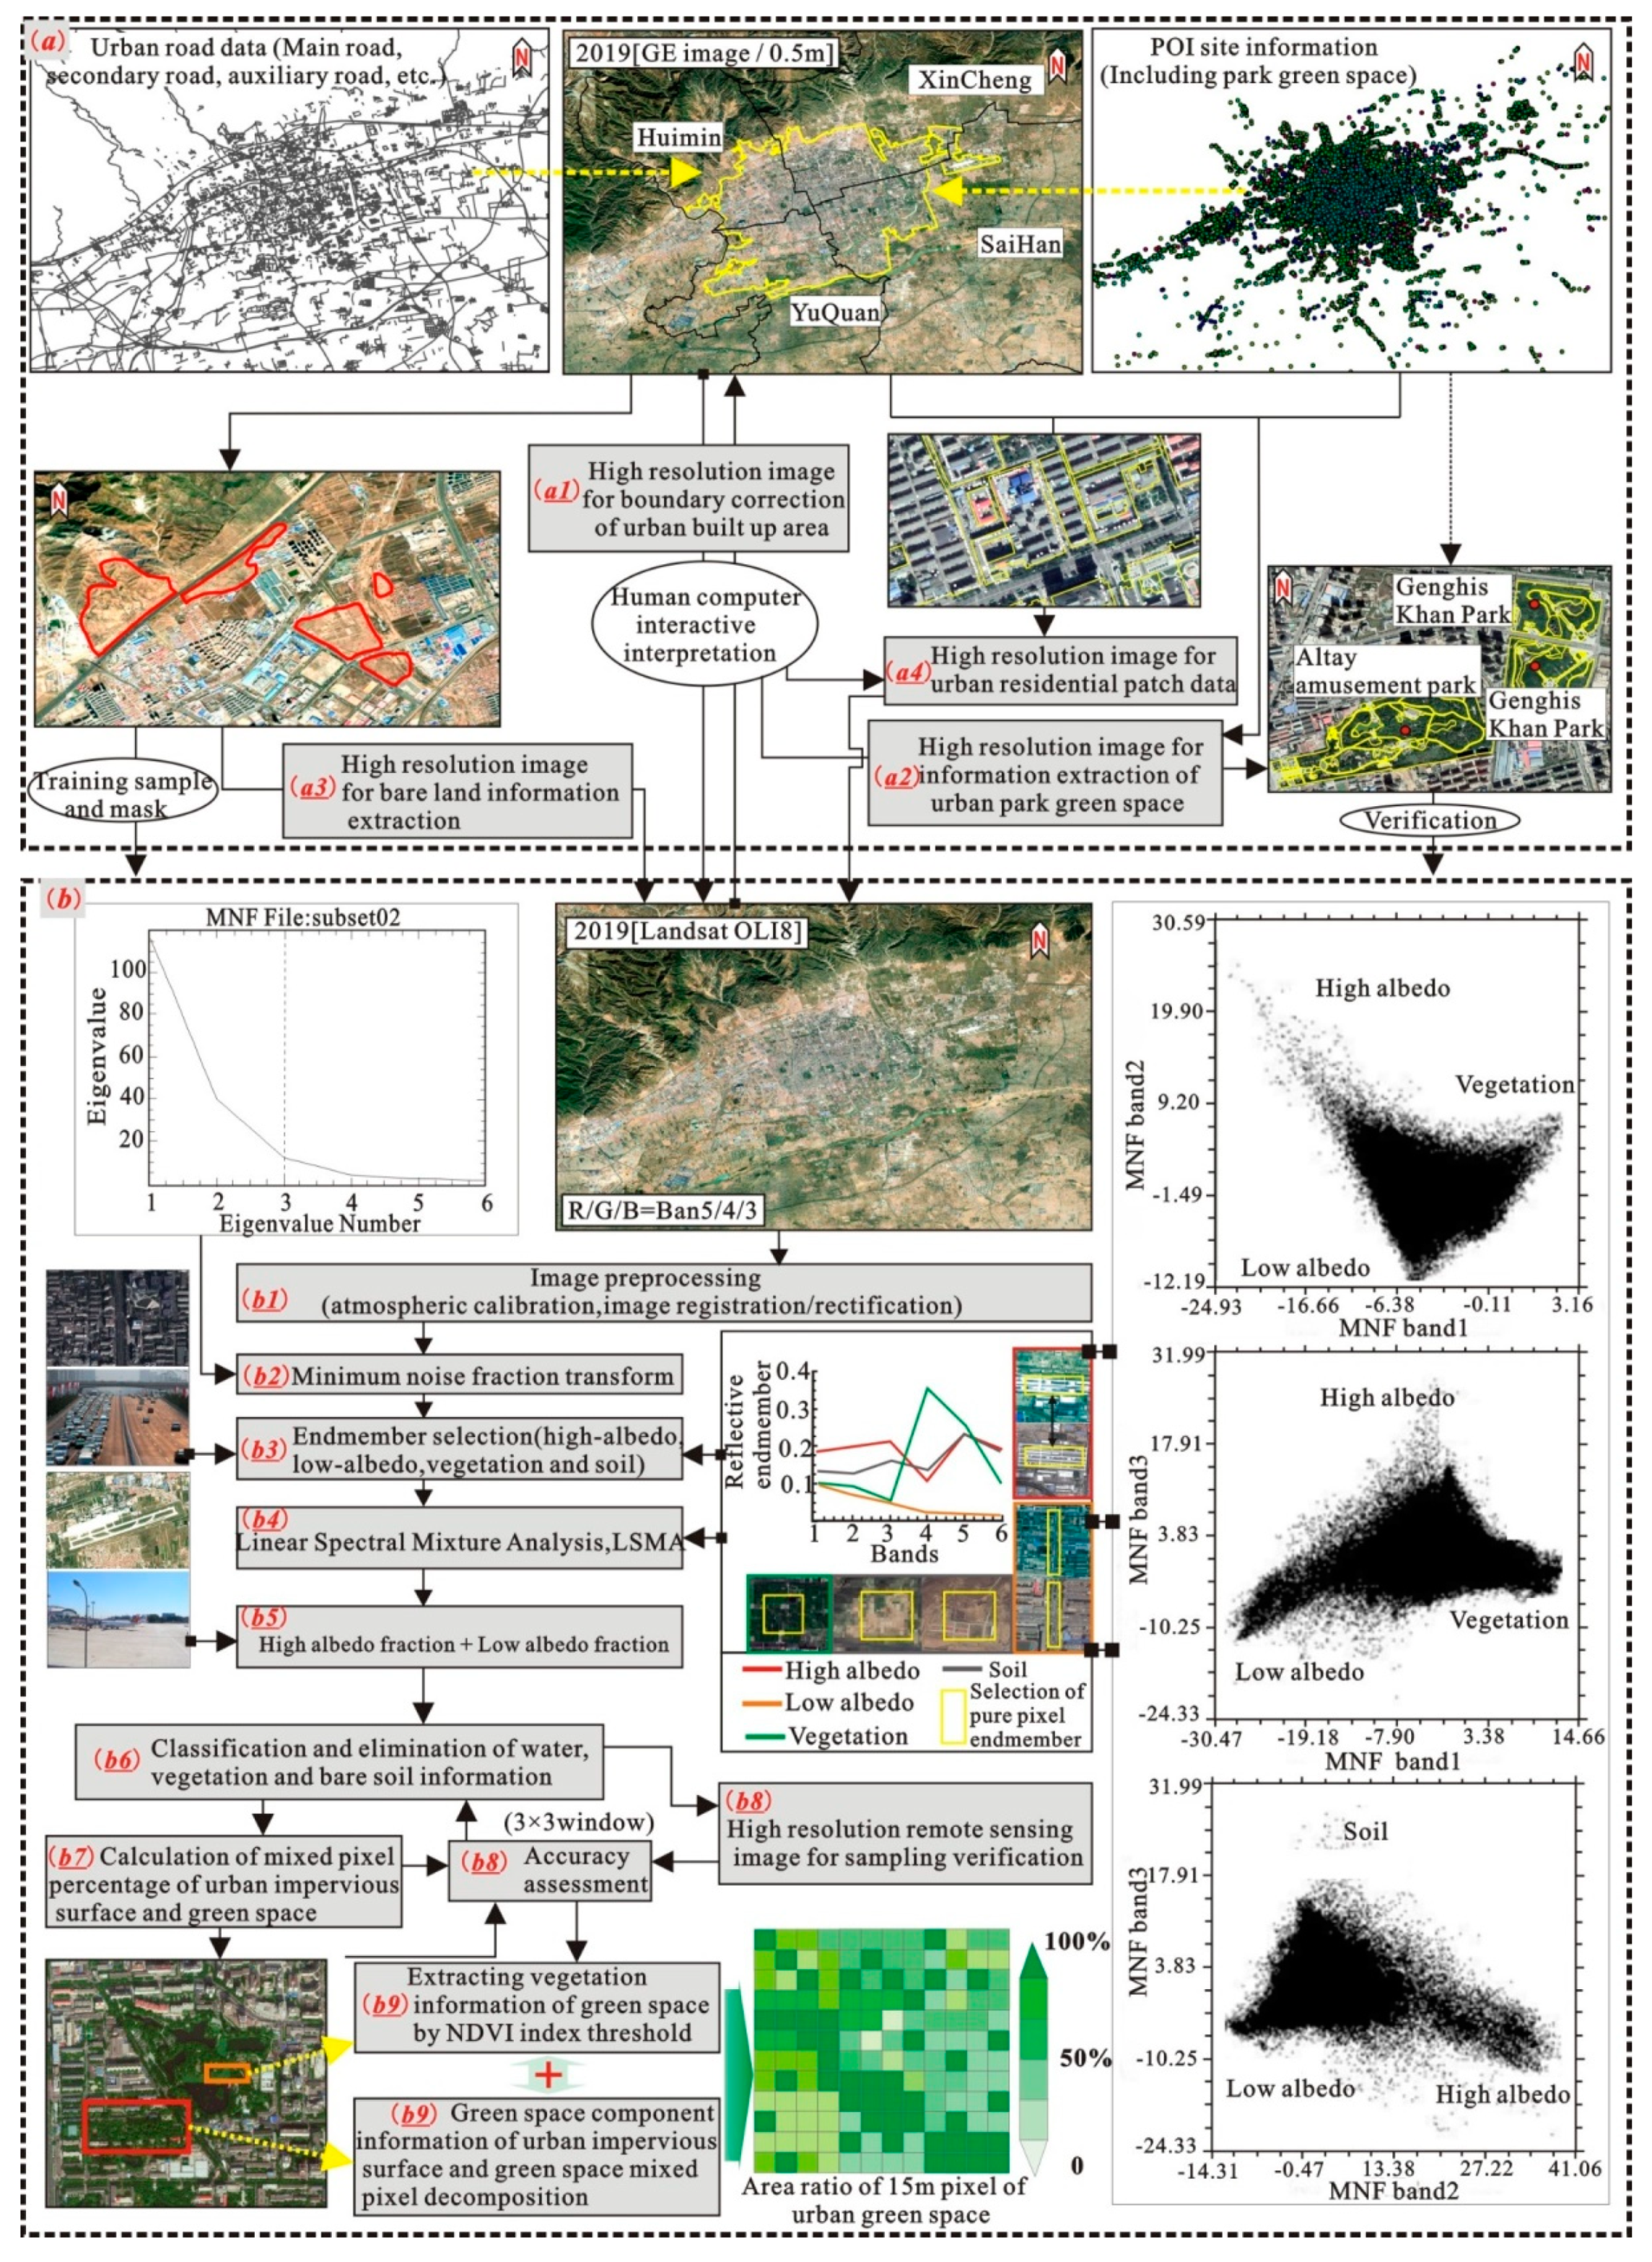
2.3. Extraction of Differential Characteristics of Intra-Urban Green Space

The extraction of intra-urban green space for all the studied cities mainly consisted of three steps, namely, data acquisition and processing, extraction of green space (i.e., the extraction of parks’ green space and intra-urban green space fractions), and accuracy assessment. The overall workflow is displayed in Figure 2, and the details of each step in Section 2.3.1, Section 2.3.2 and Section 2.3.3. In this study, according to the urban hierarchical theory [28], we constructed a hierarchical approach for the extraction of 15-m resolution intra-urban green space fractions and 0.5-m resolution parks’ green space to identify multi-scale spatial characteristics and distributions of green space. Further, with the 500-m park ecological service radius, we also analyzed the circular green space coverage ratio across all the studied cities, to explore the human livability as described by the “Beautiful China” project.

2.3.1. Boundary Inspection and Quality Cor Rection

The boundaries of all cities in this study were derived from the 1:100,000 city boundary data, which was provided by the Institute of Geographic Sciences and Natural Resources Research, Chinese Academy of Sciences [26,27]. Although this dataset claimed to exhibit an overall accuracy of 95% in delineating the boundaries of urban built-up areas at the national scale, it did not show the specific accuracy of urban boundaries in the Inner Mongolia Plateau. In order to provide an accurate urban boundary, we performed quality checking for all cities. The urban boundary was overlaid onto 0.5-m resolution Google imagery to check the quality. We corrected inaccurate boundary information and obtained high-quality urban boundary maps for the studied cities in the Inner Mongolia Plateau.

2.3.2. Extraction of Urban/Park Green Space

In this study, we conducted a synergistic methodology to extract intra-urban green space and park green space in the Inner Mongolia Plateau. The extracted steps are described below.

Remote Sensing Image Download and Pre-Processing

Landsat-8 OLI images that covered all the studied cities were downloaded from (United States Geological Survey, USGS). Due to the impacts of the 16-day revisit cycle and equivocal image quality (i.e., clouds, shadows, and bad strips), we visually searched for all usable Landsat images. The captured images during the summer were downloaded to ensure a better delineation of urban green space. All the downloaded images were processed with radiometric calibration and atmospheric correction. To facilitate green areal calculation, the projection system of images was set to the Albers equal-area conic projection (Figure 2b1). Landsat 8 OLI had a spatial resolution of 30-m spectral bands, and it also contained a 15-m resolution pan band. Thus, we used the widely adopted fusion algorithm (i.e., Gram–Schmidt Spectral Sharpening) to fuse Landsat 8 OLI multispectral bands with pan band, to obtain a new 15-m resolution Landsat dataset. This processing enabled the subsequent extraction of intra-urban green space fractions at a 15-m scale rather than 30-m, which displayed a better map of intra-urban green space.

Extraction of Green Space Fractions

Spectral mixture analysis was applied to Landsat 8 OLI images to produce intra-urban green space fractions (Figure 2b2–b5). Fully constrained least square spectral unmixing (FCLS) was a widely used technique for spectral mixture analysis. Its advantage was that it limited the changing values for each endmember within 0–1. Thus, we applied this technique to obtain intra-urban green space. The extraction accuracy of this technique was directly influenced by land surface spectral endmembers. To obtain the best endmembers for each land fraction, we applied the minimum noise fraction approach [29,30] on the ENVI software to rescale the surface spectral characteristics into the first three spectral bands. The “vegetation-impervious surface-bare soils” model was then used to obtain typical land surface spectra of vegetation, high-albedo, low-albedo, and bare soils [9,31]. To further get the optimized spectral endmember for each land surface type among these typical spectra endmembers, we manually digitized high-resolution imagery to acquire the buildings’ roofs, plazas, parks’ green space, water bodies, and other auxiliary datasets including urban roads (primary, secondary, and branch roads) (Figure 2). These visualized data were used to generate sample points for different land surface types, which were then employed to filter typical spectra to obtain pure spectra of vegetation, high-albedo, low-albedo, and bare soils. Through inputs of the filtered pure spectra of each endmember, the FCLS model generated the fractional images for each land surface type. We only examined the green space fractions. According to the corrected urban boundary maps (as shown in 2.3.1), we used them to mask green space fraction images within urban areas. Finally, we obtained the spatial distributions of intra-urban green space data across all the studied cities.

Extraction of Park Green Space

In addition to the intra-urban green space fraction, this study also extracted parks’ green space, which is displayed in Figure 2a2. First, we loaded the 0.5-m resolution Google images into ArcGIS software. We established a shapefile polygon (vector format) that had both a 1984 geographic coordinate system and an Albers projection system, and overlaid the shapefile polygon on the corresponding Google images. With the help of POI point information such as parks’ location and general distribution, accurate boundaries of parks’ green space for all studied cities in the Inner Mongolia Plateau were ultimately obtained using the human-computer interactive visual interpretation technique, with professional knowledge to distinguish remote sensing features of color, texture, and shape in these images.

2.3.3. Accuracy Assessment of Green Space

Due to the difference in extents and distributions of urban areas and green space, an accuracy assessment of green space fraction was performed using a stratified random sampling strategy to ensure scientific validity. This sampling strategy avoided the relative error arising from the uneven number of validation samples from different urban regions. These samples were determined by two criteria, i.e., the sizes of urban built-up areas and green space fractions [32]. Furthermore, using each sampling location as a center, we computed the area ratio of green space to the whole sampling region through the 3 by 3 pixels window (i.e., 45 m × 45 m) based on high-resolution imagery. The visually derived green space was used as reference data and compared with that extracted from satellite images using the FCLS model. An accuracy assessment was calculated using a correlation coefficient (R2) [33].

3. Results

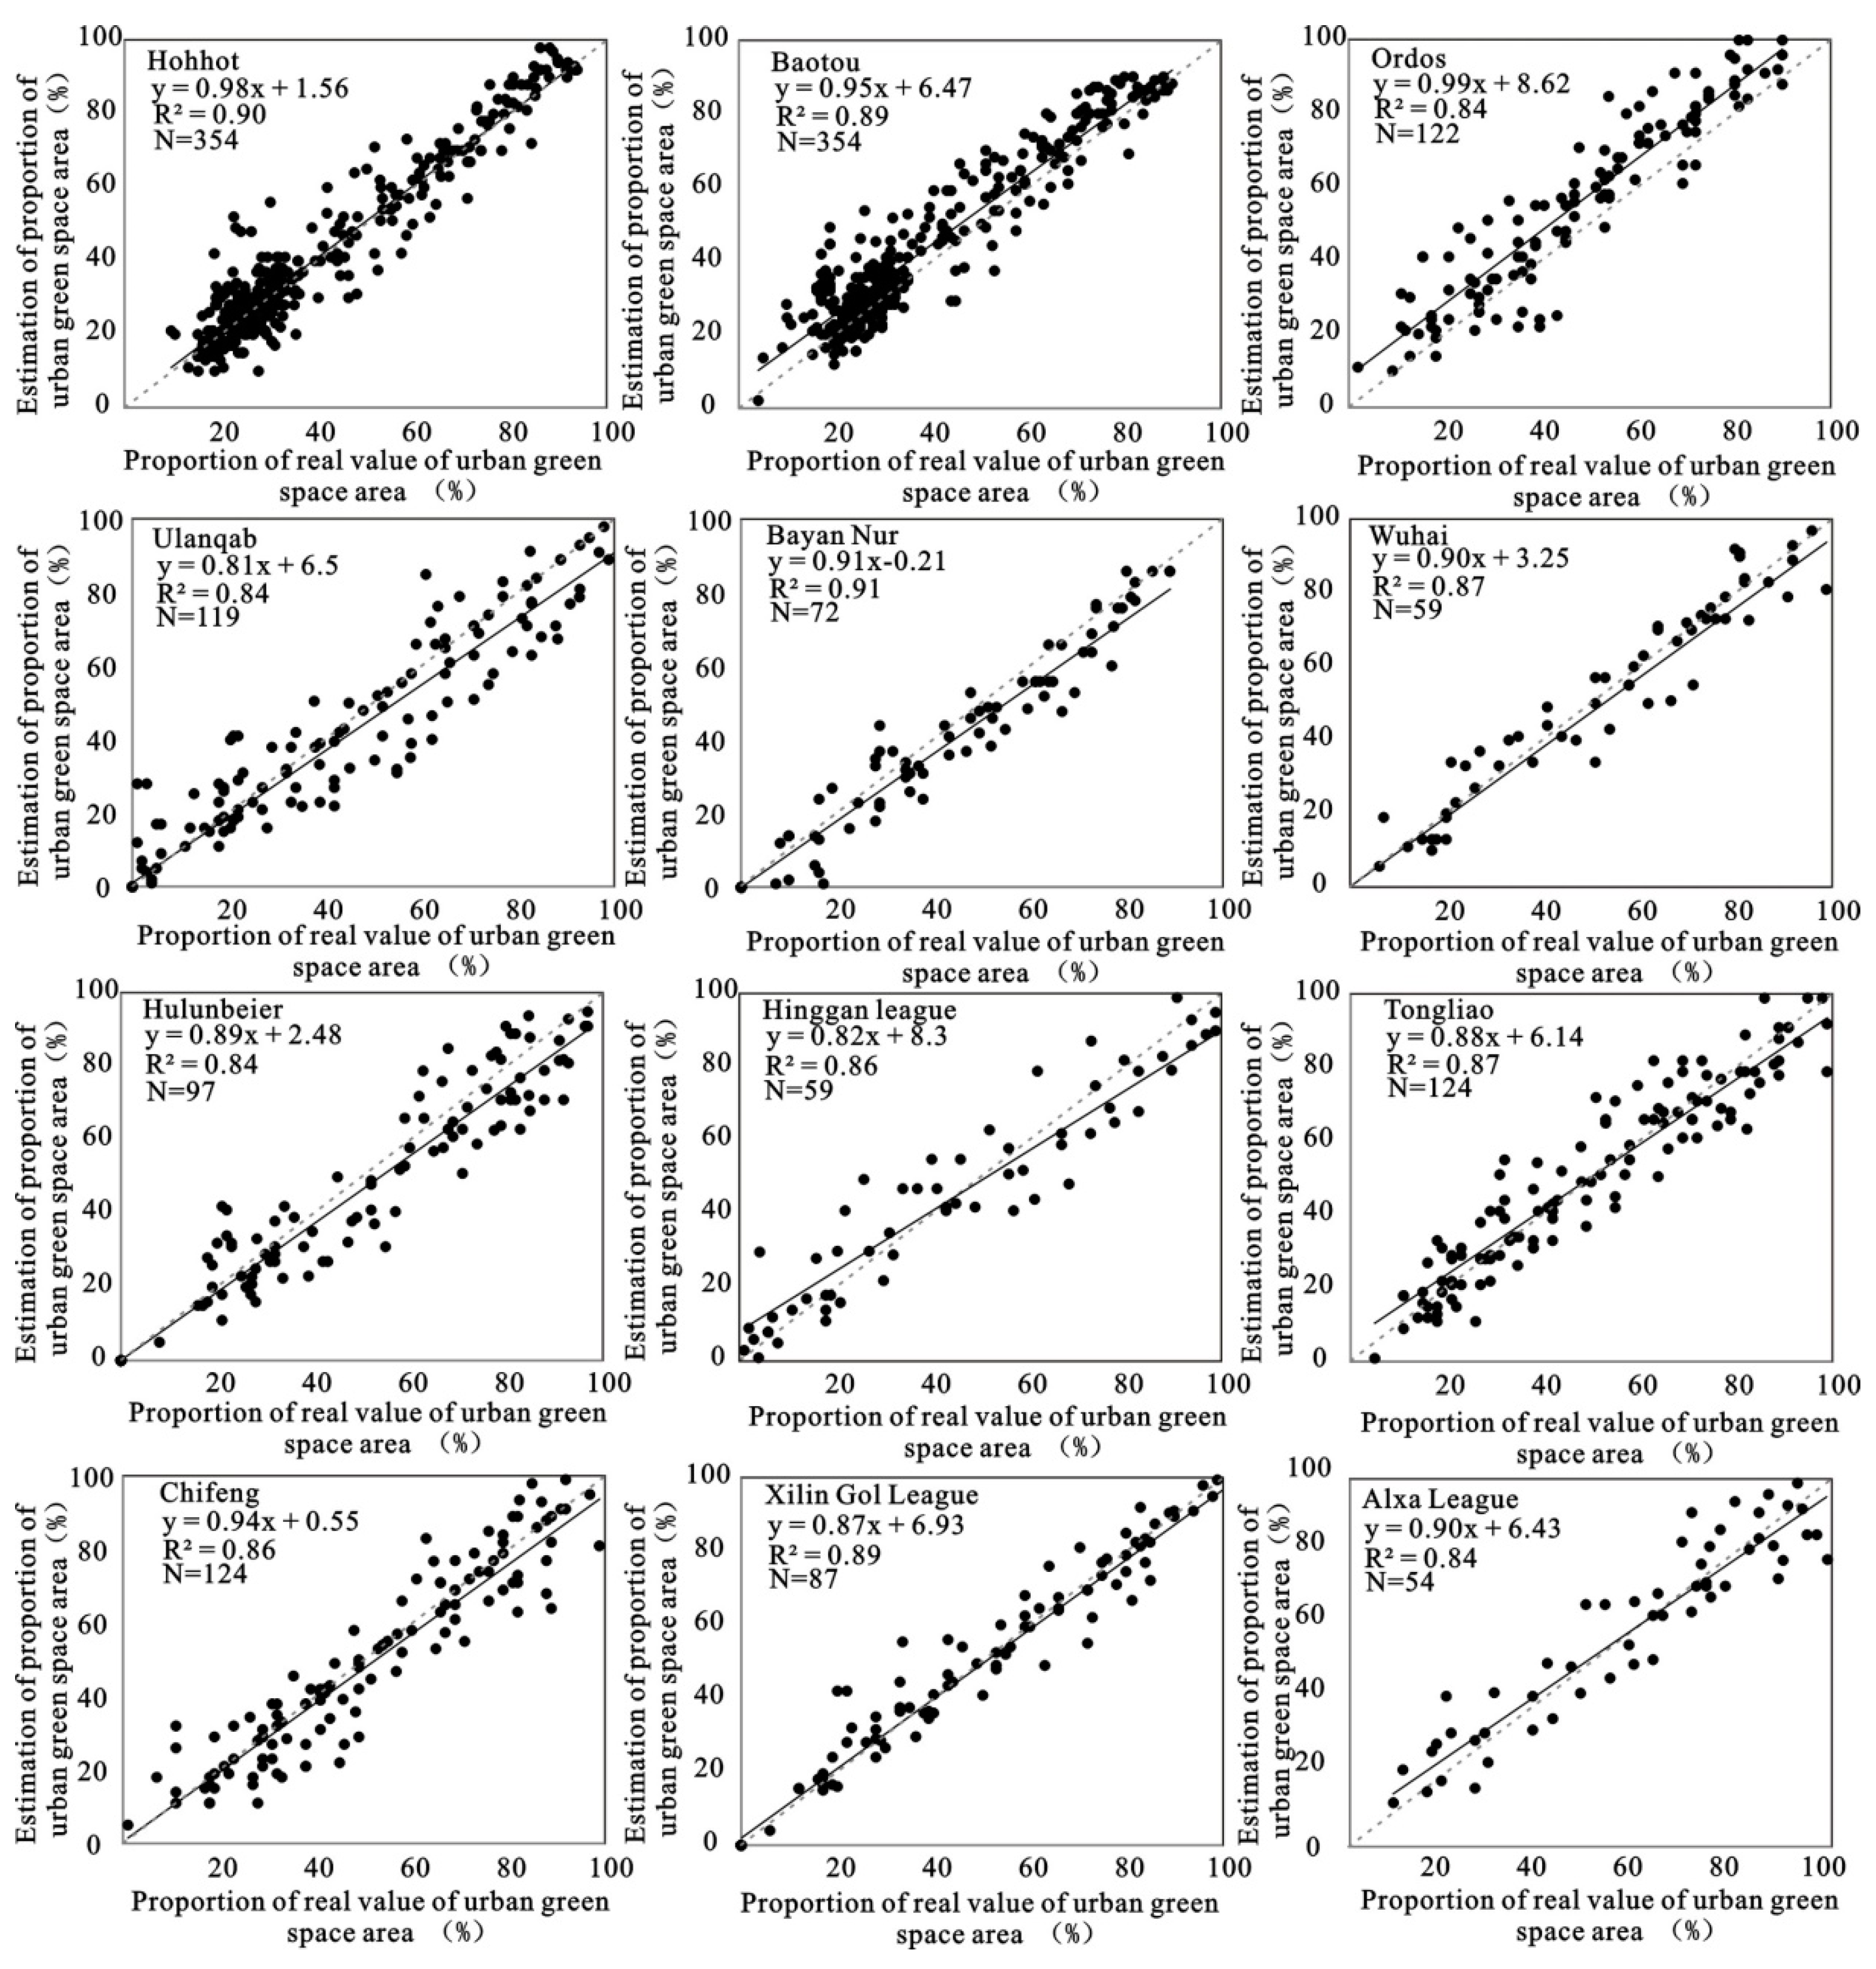
3.1. Results for Accuracy Assessment

According to the sizes of urban areas and the urban green space fraction, a total of 1625 sampling points were obtained. Specifically, in Table 2, Hohhot city (354 points), Baotou city (354 points), Ordos city (122 points), Ulanqab city (119 points), Bayannur city (72 points), Wuhai city (59 points), Hulunbuir city (97 points), Ulanhot city (59 points), Tongliao city (124 points), Chifeng city (124 points), Xilin Gol League (87 points), and Alxa League (54 points). Figure 3 shows the accuracy assessment of the urban green space fraction. The overall coefficient of determination for extracting urban green space fractions within all cities in the Inner Mongolia Plateau was 0.87, which indicated a good accuracy between the reference data and the actual data. This accuracy level satisfied the requirement for the study on urban green space. At the city level, the correlation coefficients of Alxa, Ulanqab, and Ordos were all 0.84, indicating the slightly lower accuracy compared to other cities.

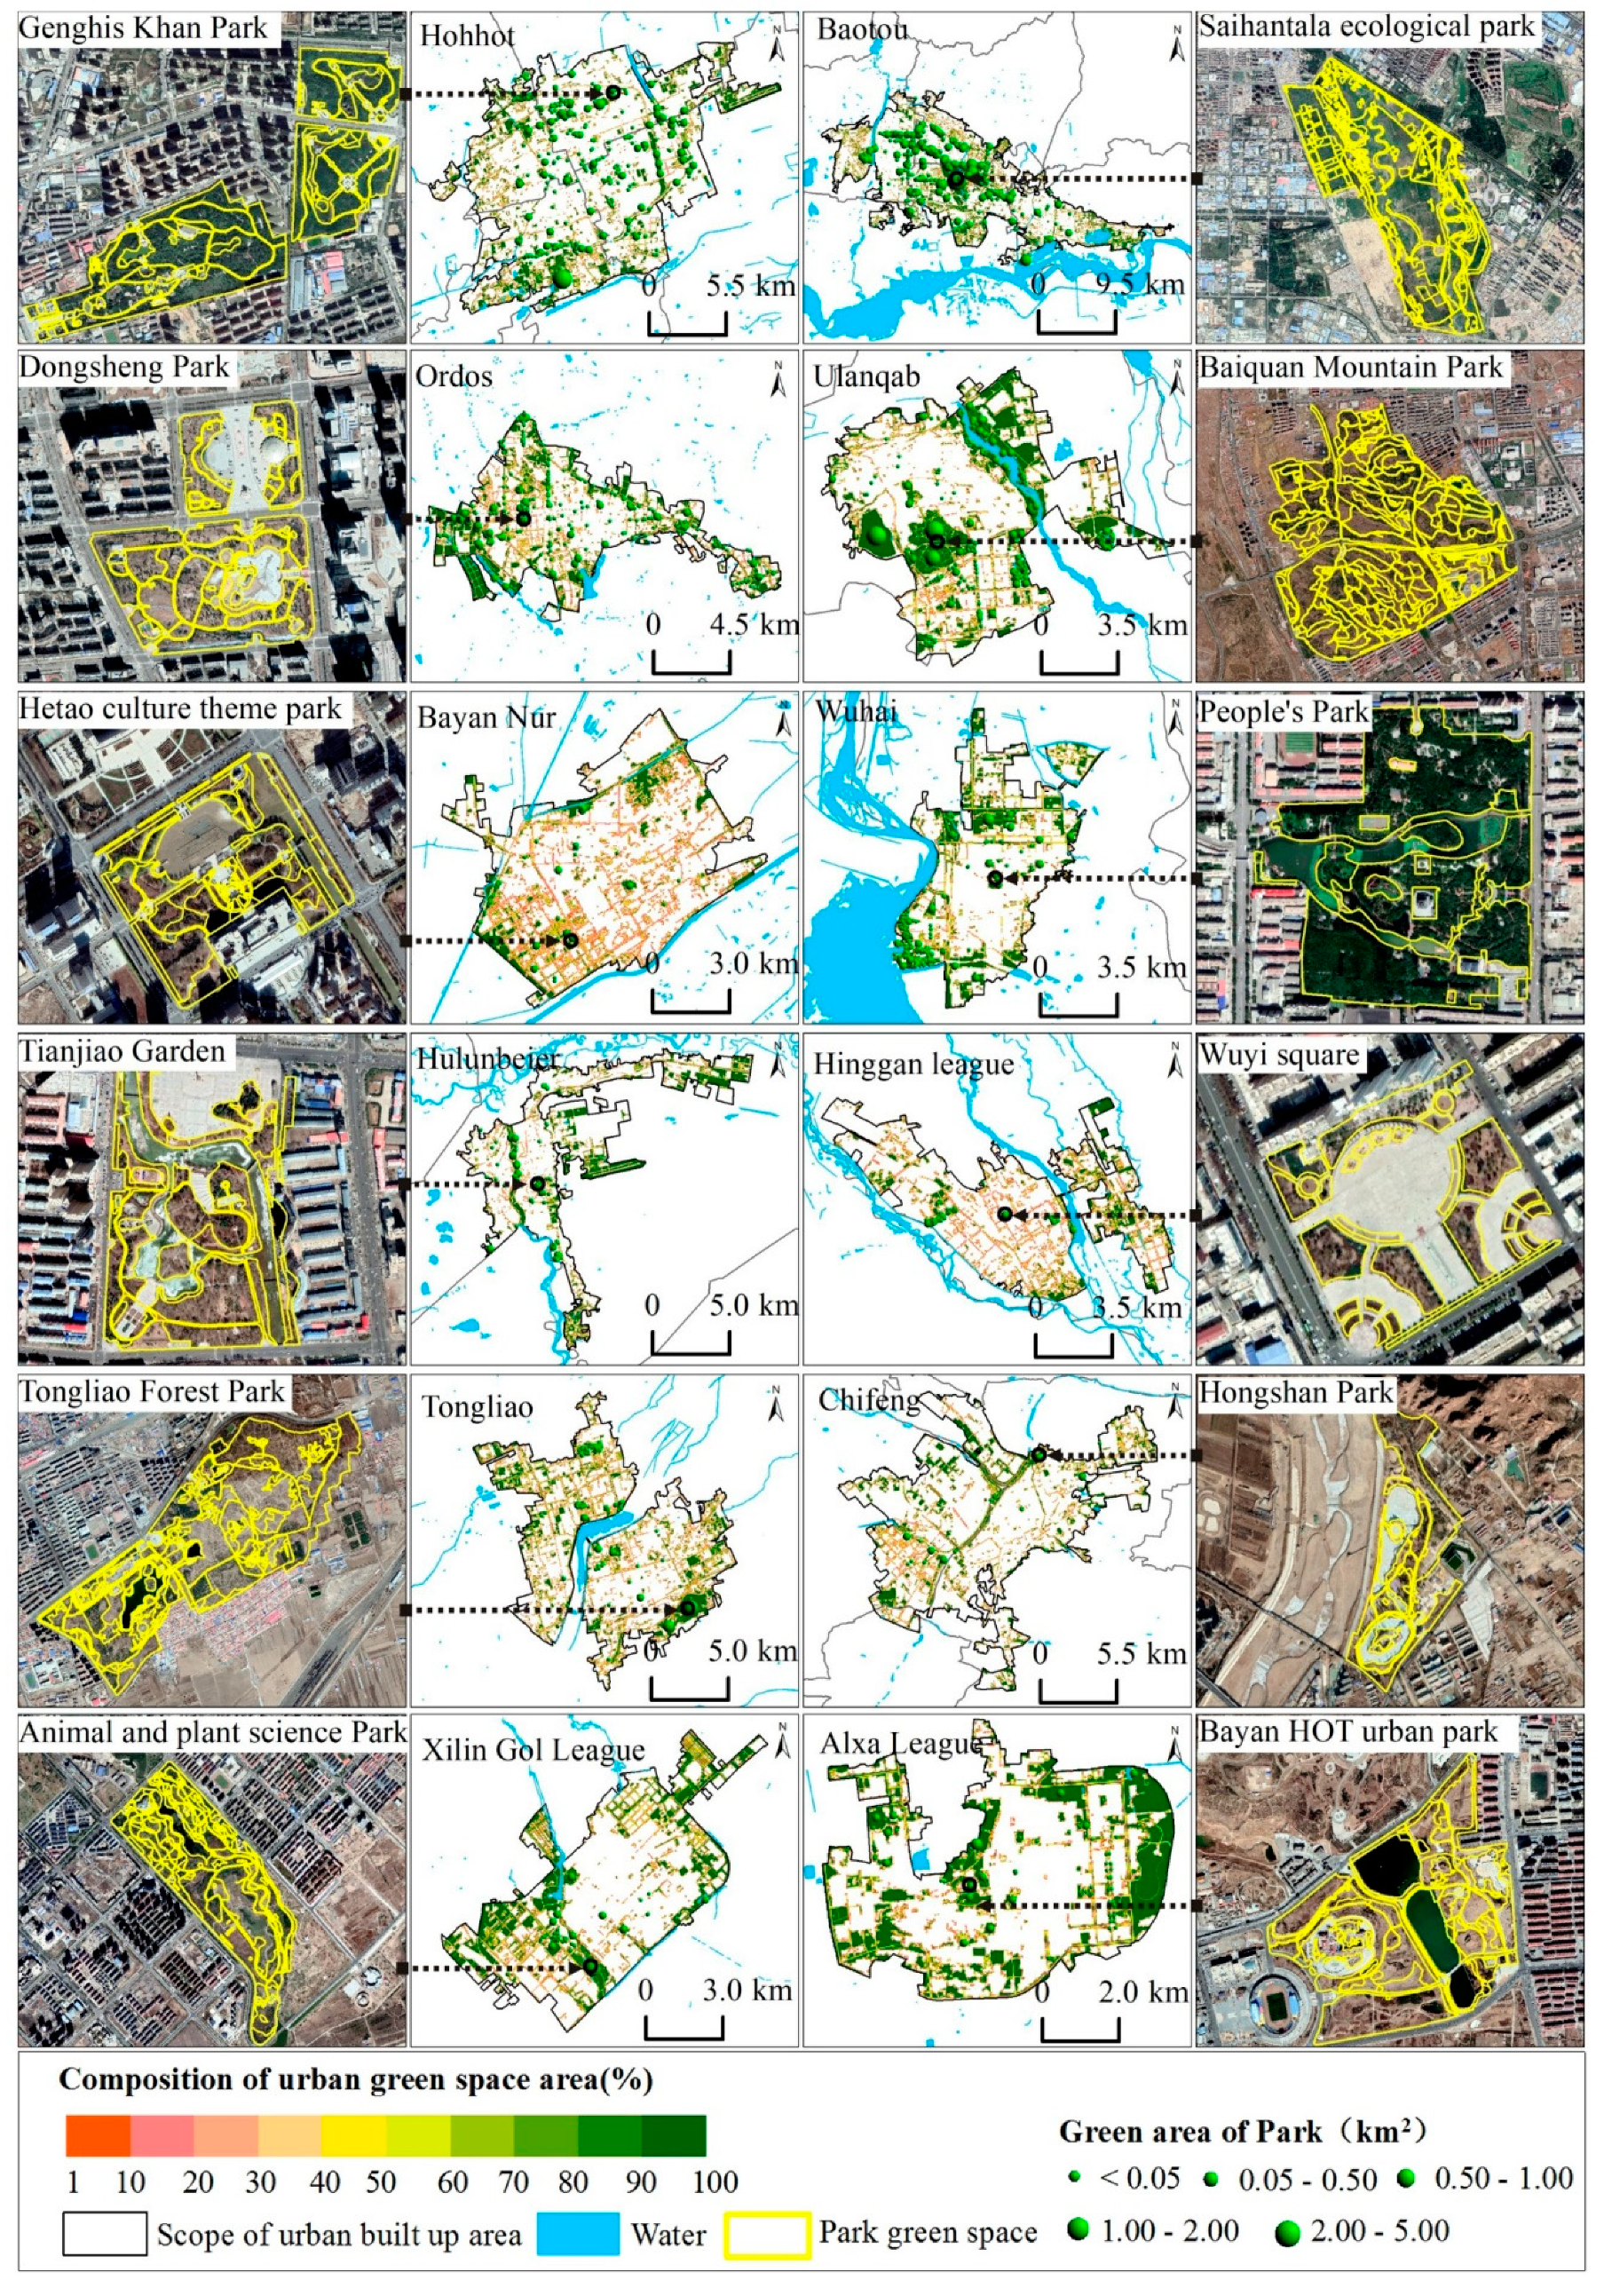
3.2. Spatial Characteristics of Urban Size and Distribution

Table 3 displayed the extents of urban built-up areas and urban green space for the studied cities within the Inner Mongolia Plateau. The total urban built-up area was 1249.87 km2, and three cities had a built-up area larger than 100 km2, i.e., Baotou city (306.11 km2), Huhhot city (240.18 km2), and Chifeng city (100.71 km2). These three cities had a built-up area of 647 km2 in total, accounting for 51.77% of the total built-up area of all the studied cities. This indicated that several major cities accounted for half of the urbanization in the Inner Mongolia Plateau. Table 3 also indicates that there were large differences in urban built-up areas among all the cities, and the largest built-up area (Baotou city, 306.11 km2) was 7.35 times larger than the smallest one (Alxa League, 41.62 km2), further confirming the uneven development of these cities. In terms of spatial patterns, the larger cities were generally distributed in the middle part of the study area, and the smaller cities were always located in the western part.

3.3. Analysis of Urban Green Space

3.3.1. Analysis of Intra-Urban Green Space Fractions

In terms of urban green space area, the total area of green space across all the cities in the Inner Mongolia Plateau was 295.40 km2, and the proportion of green space to urban areas was 24.03% (Table 3). Boutou city had the largest urban green space (79.33 km2), which was 10.04 times larger than that of the smallest one (Ulanhot, 7.90 km2). Table 3 further shows that there were two cities with an area of green space less than 10 km2, eight cities with a green space area between 10 km2 and 20 km2, and two cities with a green space area larger than 20 km2, suggesting that most of the green space areas were between 10 km2 and 20 km2. According to the boundary maps of urban areas, the ratio of green space to all urban areas ranged from 17.09% to 32.17%. Among these cities, those with a ratio less than 20% included Chifeng city (17.52%), Hinggan League (17.43%), and Bayannur city (17.09%), and those with a ratio larger than 30% only included Ulanqab city and Alxa League.
In terms of the ratio of green space to urban areas, Figure 4 shows that the green space ratio was relatively higher in semi-arid/arid regions (e.g., the Huhhot-Baotou urban cluster region, the middle-western part of the Inner Mongolia Plateau) than in humid regions (e.g., Hulunbuir city, Hingan city, and Chifeng city, the eastern part of the Inner Mongolia Plateau). Specifically, in the eastern region of the study area, urban green space consisted mainly of scattered patterns inlaid on both sides of the urban road and near the residential bureau, and there were few large green space patches. In contrast, in the middle and western regions of the study area, urban green space exhibited divergently aggregated patterns. The reason for these green space patterns was the fact that the eastern region belongs to a humid climatic zone, in which green space outside the cities can provide better ecological service background to the intra-urban human settlement environment. Thus, in the eastern region, urban green space mainly played a greening role with scattered distributions. On the contrary, in the middle and western regions of the study area, with arid/semi-arid climate background, the land type outside the cities was mainly bare soils. In order to alleviate the impact of arid climate on urban residents, the urban green space always appeared with large patches within urban areas to regulate the urban temperature and ecological service.

3.3.2. Analysis of Park Green Space

Parks’ green space have the ability to store water and regulate ecological services in cities. The size of parks’ green space has direct impacts on parks’ green space functions. The total area of parks’ green space within all cities was 74.14 km2, according to the manual digitization and POI point information. Table 2 shows that the size of parks’ green space within the study area ranged from 0.50 km2 to 20.00 km2, implying a high spatial heterogeneity in the sizes of parks’ green space. Except for the cities of Baotou (20.00 km2), Ulanqab (14.05 km2), and Huhhot (13.99 km2), which displayed relatively larger areas of parks’ green space, other cities had areas of green space less than 10.00 km2. As for the ratio of parks’ green space to urban green space, Ulanqab city had the highest ratio (50.20%), followed by the cities of Wuhai (35.70%), Huhhot (28.83), Ordos (27.48%), and Baotou (25.21%). Parks’ green space area ratio in these cities was larger than 20%. However, Hinggan League and Chifeng city had a relatively lower area ratio. In terms of spatial distributions, the parks’ green space was generally evenly distributed within the Huhhot-Baotou-Ordos urban regions, while for the other cities, the parks’ green space was mainly located at the city boundaries. An obvious example was that of Alxa, where the parks’ green space was distributed in a nearly circular shape surrounding the city, located in an arid region, where the main land types around the city are desert and bare soils. Thus, to enhance human comfort and avoid desertification’s damage to the cities, parks’ green space was distributed in a circle surrounding the dry cities.

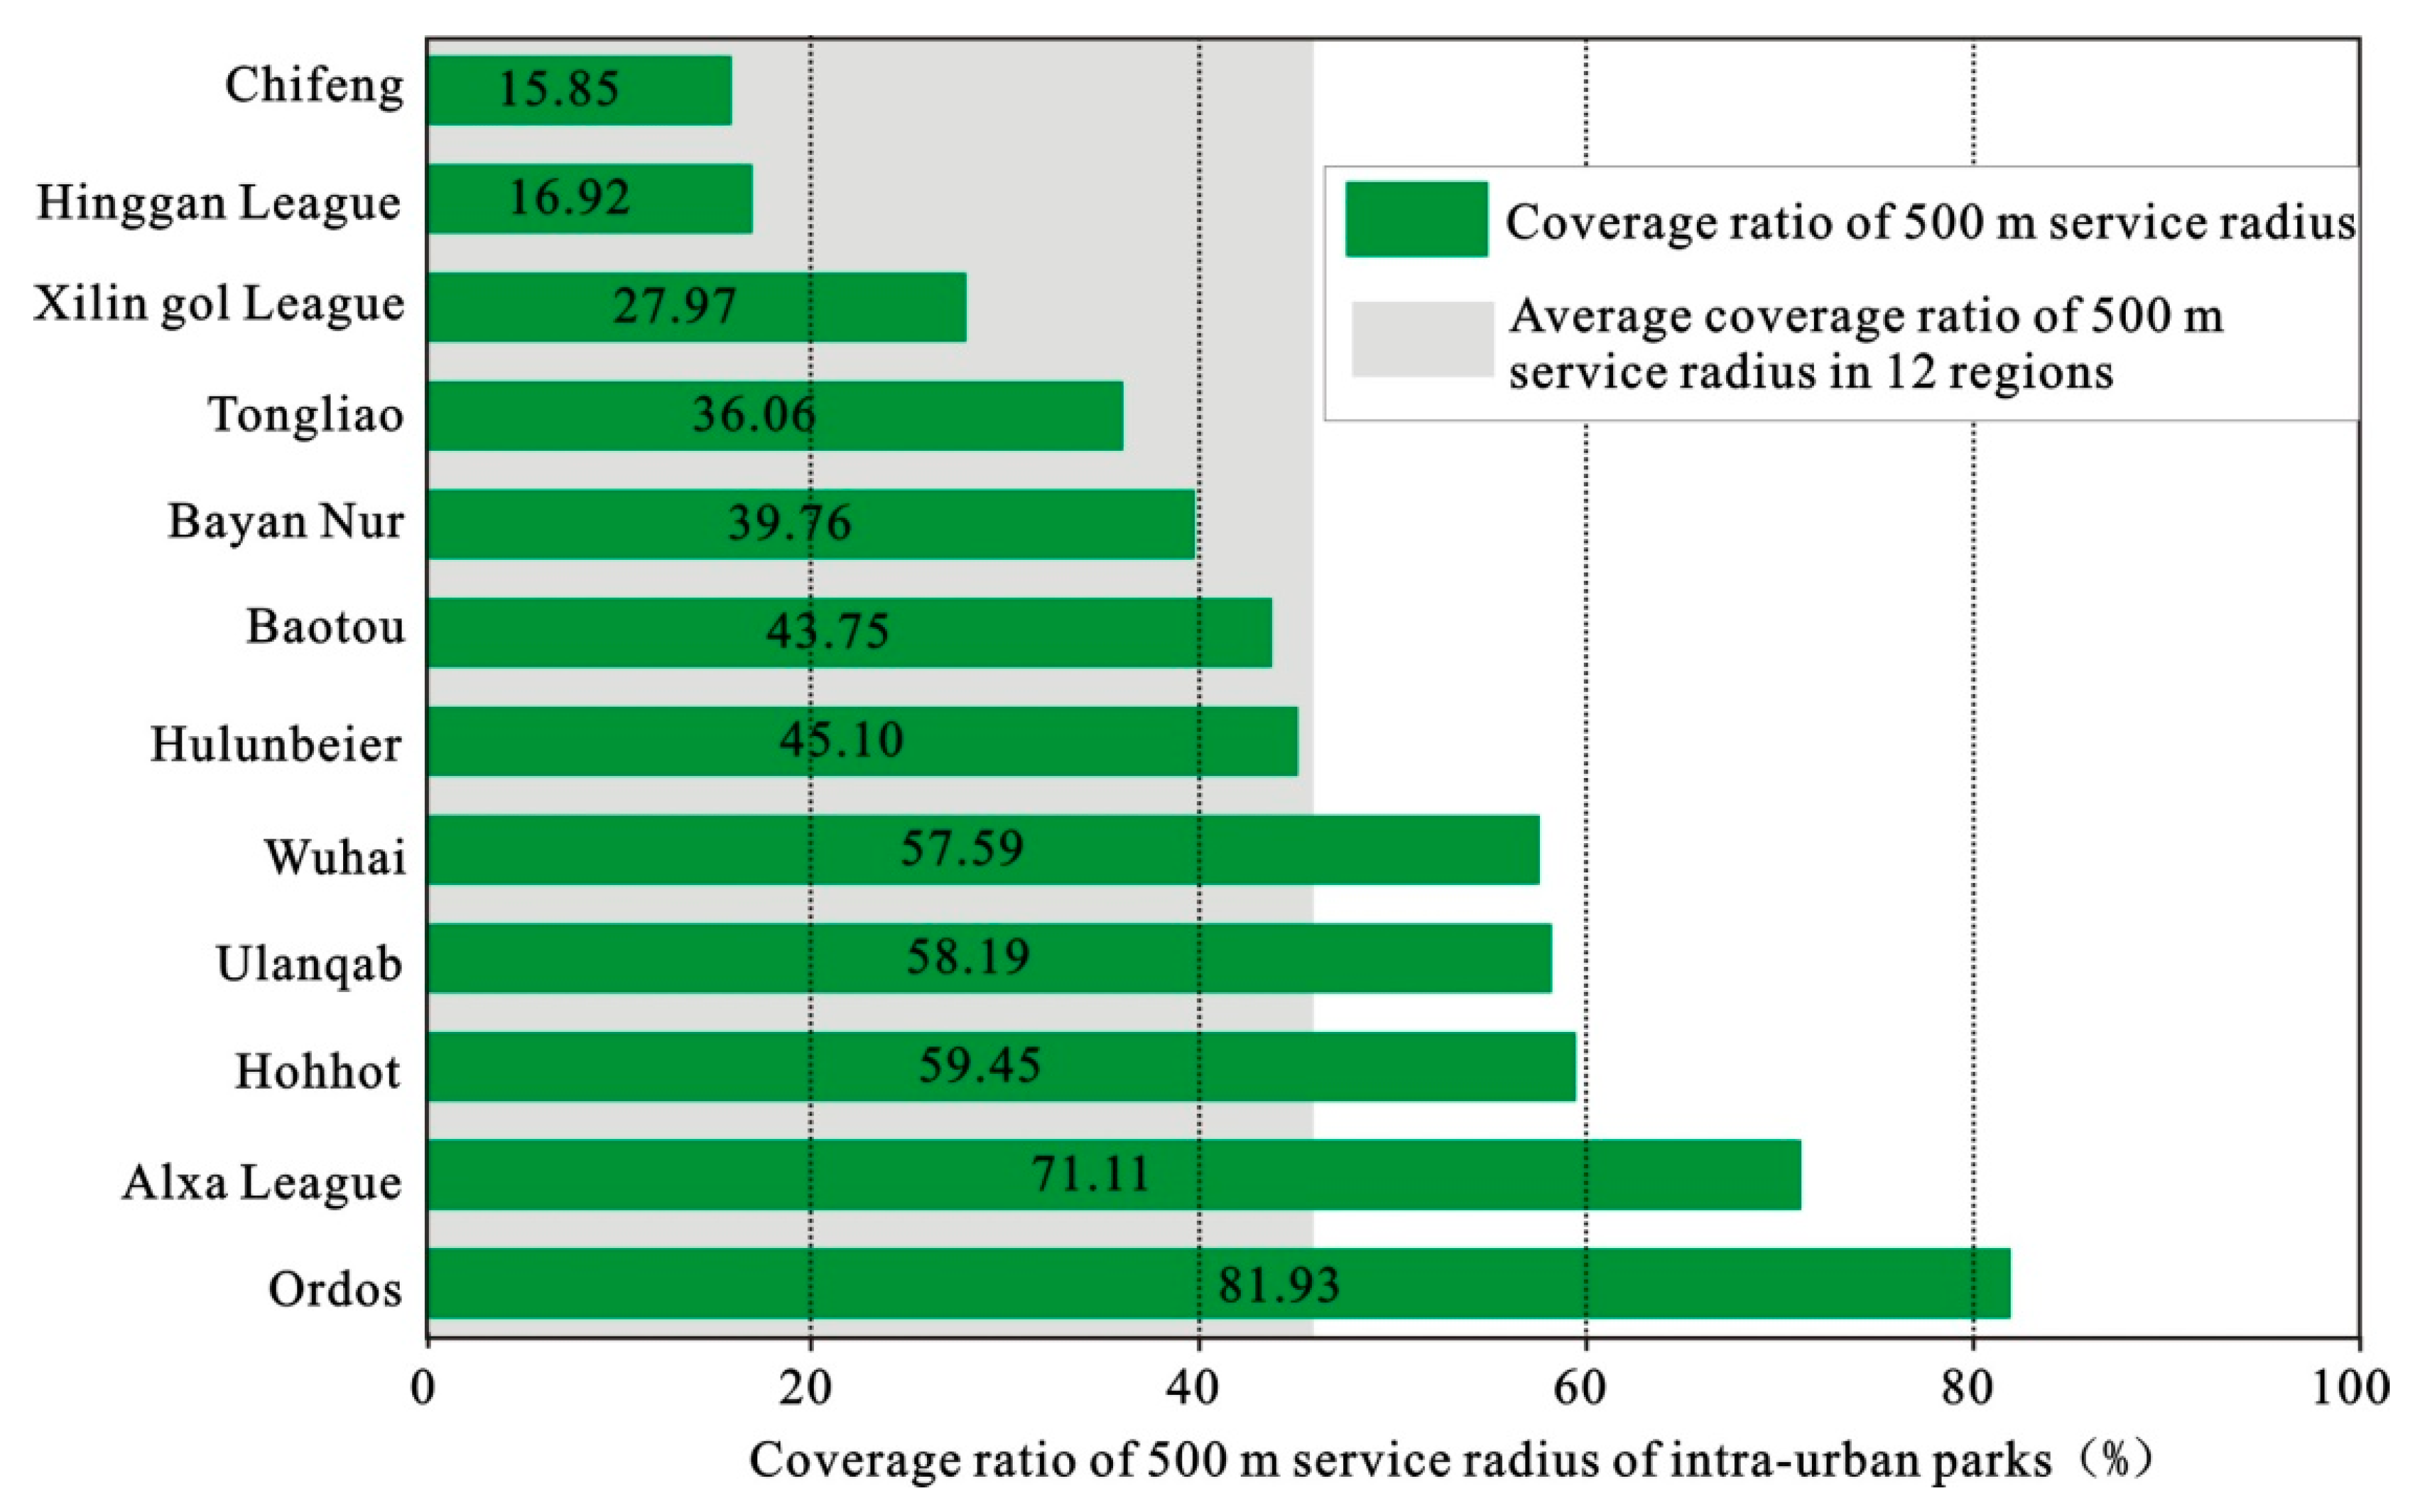
3.4. Analysis of the Ecological Service of Urban Green Space and Park Green Space

Parks’ green space was a significant factor affecting human comfort. An ongoing project called “Beautiful China” used the coverage of the certain land use (e.g., residential area and green space) within a 500-m radius from urban parks as an important indicator to evaluate the comfort of urban human settlements. In this study, based on 0.5-m resolution remotely sensed images, we applied manual digitization to interpret the patch sizes of the residential areas within a 500-m radius from the parks, and finally obtained the coverage of green space within a 500-m radius from each park (Figure 5 and Figure 6). The results suggested that the average coverage ratio of green space within the 500-m radius from parks for all the cities in the Inner Mongolia Plateau was 46.14%, indicating that the ratio of residential area to urban green space was close to 1:1. However, different cities exhibited significant spatial differences for this indicator. Figure 5 shows that the five cities had a larger value than the average coverage ratio within the circular ecological service zone (500-m radius from the parks), including the cities of Ordos, Alxa, Huhhot, Ulanqab, and Wuhai. In contrast, other cities showed a lower value than the mean ratio. Furthermore, the cities of Ordos and Alxa had the highest coverage ratio within the circular ecological service zone, with values of 81.93% and 71.11%, respectively, indicating a higher human comfort (Figure 6) due to the two cities being located in arid/semi-arid regions. A better green space ratio can alleviate the arid environment’s pressure on urban regions. In contrast, the green space coverage ratios within the ecological service radius were relatively lower for the cities of Chifeng and Hinggan, with values of 15.85% and 16.92%, indicating that a higher green space coverage was needed for a comfortable human settlement environment.

4. Discussion

4.1. Improving the Quality of Residential Green Space in the Inner Mongolia Plateau of China

Green space can regulate the urban thermal environment, improve air quality, increase the landscape aesthetics, and benefit ecological services. According to statistical data of 2008, half of the world’s population has moved to urban regions, and this number will rise to 66% by 2030. By 2030, it has also been projected that the urban land area worldwide will be three times greater than that in 2000, which indicates an increasing global urbanization. In China, the urbanization rate was 56% in 2016, and this number will be projected to 70% (2050) and 80% (2100). This implies that the urbanization in China will be much faster than in the rest of the world. As more and more Chinese people live in cities, the demand for urban green space will increase, particularly for parks and other similar open green spaces, so as to satisfy the standards for high-quality human settlement environments. Green space area per capita was considered a significant indicator of human settlement quality [34,35]. In the Inner Mongolian Plateau, due to factors such as the level of economic development and population, the green space per capita of different cities was different in different regions (Figure 7). Among all the studied cities, Alxa had the highest green space per capita (i.e., 154.02 m2 per capita), which was likely attributed to the location of the city in the arid region. More green space was established to regulate dry climate in this region. The results indicated that the high coverage of green space in the city, located in the arid region, could significantly weaken the impacts of urban heat, providing a better living environment. The green space per capita of Huhhot was the lowest, because it is a capital city located in the humid region with high population, but experiencing lower environmental stress outside the cities.
In addition to urban green space area per capita, parks’ green space area per capita was also an important indicator to measure the ecological services of green space. According to our calculations (Figure 7), the parks’ green space per capita among all cities ranged from 1.94 m2 (Hinggan League) to 49.8 m2 (Ulanqab) per capita. Compared with the parks’ green space per capita at the national level (13.50 m2) [36], the green space areas per capita in the cities of Ulanqab, Alxa, Ordos, and Xilin Gol League were much higher, suggesting that these cities had a relatively higher level of greening. However, the values in these cities of the Inner Mongolia Plateau were still lower than the 60 m2 green space area per capita for the optimal living quality set by the United Nations [37]. Thus, in order to improve ecological services and the quality of human settlements in the “Beautiful China” project, it is necessary to address the uneven distribution of urban green space and enhance the capacity to further improve urban and parks’ green spaces. Then, the Inner Mongolia Plateau will strengthen its role as the ecological environment barrier in China.

4.2. Difference in Spatial Configuration between Park Green Space and Residential Area

Parks’ green space was an important constituent of urban landscape and played a critical function in ensuring the comfort of human settlements. With reference to a 500-m ecological service radius, our results showed that the coverage ratio of urban green space within the service radius was 46.14%, suggesting that the ratio of residential area to the area of urban green space was close to 1:1. Among all the cities, Ordos had the highest ratio (i.e., 81.93%), whereas Chifeng had the lowest ratio (i.e., 15.85%), indicating that the coverage ratios of urban green space within the service zone varied among all cities. The coverage ratio of urban green space within the service zone also represented the landscape configuration of urban green space and residential areas. The reasonable adjustment of the ratios of urban green space to residential areas within the ecological service zone was useful to improve urban livability.
To provide a reference for spatial land allocation of urban green space and residential areas in the Inner Mongolia Plateau, this study used the geometric center of each city as the reference point, with a radius extending 1 km from the point to compute the coverage ratio of urban green space for each city as far as 7 km from the reference point (Figure 8). The results showed that service levels of urban green space within a 3-km radius from the geometric centers of Chifeng, Bayannur, Hinggan League, and Tongliao were generally low. Further improvement of spatial distribution of urban green space and residential areas was required. Meanwhile, parks’ green space located 3–7 km from the central regions of Huhhot, Baotou, Tongliao, and Chifeng need to increase. Figure 8 also shows that parks’ green space service level for the “Huhhot-Baotou-Ordos” urban regions was high.

4.3. Positive Effect of Green Space on Human Settlement Environment in the Inner Mongolia Plateau

The excessive development of urbanization and urban impervious surfaces were the main factors leading to urban heat island effect [38]. The Inner Mongolia Plateau is located in a plateau region where the ecological environment is fragile and the urban heat island effect is a serious issue. According to previous studies, the percentage of urban impervious surface among the cities in the Inner Mongolia Plateau is relatively high [38,39]. This percentage has increased rapidly, and seriously affected the comfort of human settlements. This was mainly manifested in extreme heat events [30]—for example, the land surface temperature reached 70 °C in June in Alxa Left Banner. Thus, green space was indispensable to regulate urban heat effect [39]. Our study showed that, under the influence of dry and warm climate in the arid/semi-arid cities in the Inner Mongolia Plateau, the relatively fragile urban ecological system in the arid region was sensitive to human interference [40]. In this process, the greening process coordinated with urbanization was important to maintain urban ecological services, improving the comfort of human settlements and reducing sand dust. In this study, results showed that the ratio of urban green space to urban area was relatively low in Inner Mongolian cities (24.03%). This ratio was lower than the global livable city construction standard. We recommend that the future planning of intra-urban green space development in the Inner Mongolia Plateau of China favor the establishment of ecological patches and ecological corridors to promote green space ecological function [41]. Moreover, the “green infrastructure” based in multi-functionality, connectivity, biodiversity protection, and the enhancement of ecosystem services in Europe (i.e., the ESPON Project GRETA on www.espon.eu), could provide the reference for intra-urban green space construction in the Inner Mongolia Plateau of China.

5. Conclusions

The research established a synergistic methodology using spectral unmixing and human-machine interactions to obtain hierarchical urban green space and park green space information in urban areas of the Inner Mongolia Plateau, which was used to investigate green space heterogeneity as well as its ecological service in this environmental barrier region of North China. Our results first revealed that the assessed urban area and urban green space area across all studied cities were 1249.87 km2 and 295.40 km2. Thus, the average ratio of urban green space to urban areas was 24.03% in these cities. However, this ratio for all cities ranged from 17.09% to 32.17%, exhibiting a high spatial heterogeneity. Then, it was found that the sizes of urban/park green space were relatively larger, so as to weaken the impact of arid climate on human settlements in the arid region. By contrast, the sizes of these spaces were smaller and presented a scattered pattern at the sides of city roads and residential areas under lower climate stress. Finally, the average coverage of green space within a 500-m ecological service radius across all studied cities was 46.14% and indicated that the distributed area of residential region was close to that of urban green space in the Inner Mongolia Plateau. The research contributed to the international literature by introducing a synergistic green space methodology. The findings and conclusions revealed the green space heterogeneity as well as its ecological service in the Inner Mongolia Plateau of China, which filled the existing research gaps and provided a reference for other countries’ plateau research.

Author Contributions

Conceptualization, W.C.; data curation, T.P. and W.C.; methodology, W.C.; visualization, J.J.; writing—original draft, W.C.; writing—review & editing, T.P., J.J., L.J., and X.B. All authors have read and agreed to the published version of the manuscript.

Funding

This research was funded by Key technology and application of ecological quality diagnosis and integrated management of “Beautiful Inner Mongolia” (2019GG010); Research Foundation of Education Bureau of Inner Mongolia, China (NJYT-19-B29); and Scientific and technological basic resources investigation project: multidisciplinary joint investigation of China–Mongolia–Russia economic corridor/sub-project: Investigation on the social and economic development of Mongolia and Inner Mongolia (2017FY101304-3).

Conflicts of Interest

The authors declare no conflict of interest.

References

  1. Grimm, N.B.; Faeth, S.H.; Golubiewski, N.E.; Redman, C.L.; Wu, J.; Bai, X.; Briggs, J.M. Global change and the ecology of cities. Science 2008, 319, 756–760. [Google Scholar] [CrossRef] [PubMed] [Green Version]
  2. Georgescu, M.; Morefield, P.E.; Bierwagen, B.G.; Weaver, C.P. Urban adaptation can roll back warming of emerging megapolitan regions. Proc. Natl. Acad. Sci. USA 2014, 111, 2909–2914. [Google Scholar] [CrossRef] [PubMed] [Green Version]
  3. Rodriguez, R.S.; Ürge-Vorsatz, D.; Barau, A.S. Sustainable development goals and climate change adaptation in cities. Nat. Clim. Change 2018, 8, 181–183. [Google Scholar] [CrossRef]
  4. Liverman, D.; Rockström, J.; Visbek, M.; Leemans, R.; Abrahamse, T.; Becker, B.; d’Sousa, R.; Jones, K.; Mooney, H.; Niang, I. Future Earth Initial Design; ICSU: Paris, France, 2013. [Google Scholar]
  5. Feng, G.; Xueyan, Z.; Xiaoyu, S.; Bao, W.; Penglong, W.; Yibo, N.; Weijun, W.; Chunlin, H. Connotation and evaluation index system of beautiful china for sdgs. Adv. Earth Sci. 2019, 34, 295–305. [Google Scholar]
  6. He, C.; Liu, Z.; Tian, J.; Ma, Q. Urban expansion dynamics and natural habitat loss in china: A multiscale landscape perspective. Glob. Change Biol. 2014, 20, 2886–2902. [Google Scholar] [CrossRef] [PubMed]
  7. M’Ikiugu, M.M.; Kinoshita, I.; Tashiro, Y. Urban green space analysis and identification of its potential expansion areas. Procedia-Soc. Behav. Sci. 2012, 35, 449–458. [Google Scholar] [CrossRef] [Green Version]
  8. Hiironen, J.; Mattila, P.; Lääti, M.; Oja, H.; Katajamäki, M.; Tanskanen, H.; Konttinen, K.; Penttilä, L. Renewing the evaluation of land consolidation effects. In Proceedings of the FIG Congress, Sydney, Australia, 11–15 April 2010. [Google Scholar]
  9. Xu, G.; Dong, T.; Cobbinah, P.B.; Jiao, L.; Sumari, N.S.; Chai, B.; Liu, Y. Urban expansion and form changes across african cities with a global outlook: Spatiotemporal analysis of urban land densities. J. Clean. Prod. 2019, 224, 802–810. [Google Scholar] [CrossRef]
  10. Li, H.; Ding, L.; Ren, M.; Li, C.; Wang, H. Sponge city construction in china: A survey of the challenges and opportunities. Water 2017, 9, 594. [Google Scholar] [CrossRef] [Green Version]
  11. Chi, W.; Shi, W.; Kuang, W. Spatio-temporal characteristics of intra-urban land cover in the cities of china and USA from 1978 to 2010. J. Geogr. Sci. 2015, 25, 3–18. [Google Scholar] [CrossRef]
  12. Chen, J.; Chen, J.; Liao, A.; Cao, X.; Chen, L.; Chen, X.; He, C.; Han, G.; Peng, S.; Lu, M. Global land cover mapping at 30 m resolution: A pok-based operational approach. ISPRS J. Photogramm. Remote Sens. 2015, 103, 7–27. [Google Scholar] [CrossRef] [Green Version]
  13. Pauleit, S.; Ennos, R.; Golding, Y. Modeling the environmental impacts of urban land use and land cover change—A study in Merseyside, UK. Landsc. Urban. Plan. 2005, 71, 295–310. [Google Scholar] [CrossRef]
  14. Senetra, A.; Krzywnicka, I.; Mielke, M. An analysis of the spatial distribution, influence and quality of urban green space—A case study of the polish city of tczew. Bull. Geogr. Socio-Econ. Ser. 2018, 42, 129–149. [Google Scholar] [CrossRef] [Green Version]
  15. Tian, Y.; Jim, C.; Liu, Y. Using a spatial interaction model to assess the accessibility of district parks in Hong Kong. Sustainability 2017, 9, 1924. [Google Scholar] [CrossRef] [Green Version]
  16. Moreira, T.C.L.; Polizel, J.L.; Santos, I.S.; Filho, D.F.S.; Bensenor, I.; Lotufo, P.A.; Mauad, T. Green spaces, land cover, street trees and hypertension in the megacity of sao paulo. Int. J. Environ. Res. Public Health 2020, 17, 725. Available online: https://www.mdpi.com/1660-4601/17/3/725# (accessed on 19 July 2020). [CrossRef] [PubMed] [Green Version]
  17. Johnson, M.P. Environmental impacts of urban sprawl: A survey of the literature and proposed research agenda. Environ. Plan. A 2001, 33, 717–735. [Google Scholar] [CrossRef] [Green Version]
  18. González, M.J.G. Planning, urban sprawl and spatial thinking. Eur. J. Geogr. 2017, 8, 32–43. [Google Scholar]
  19. Wu, C.; Murray, A.T. Estimating impervious surface distribution by spectral mixture analysis. Remote Sens. Environ. 2003, 84, 493–505. [Google Scholar] [CrossRef]
  20. Gong, W.; Yuan, L.; Fan, W.; Stott, P. Analysis and simulation of land use spatial pattern in harbin prefecture based on trajectories and cellular automata—Markov modelling. Int. J. Appl. Earth Obs. Geoinf. 2015, 34, 207–216. [Google Scholar] [CrossRef]
  21. Chen, W.; Huang, H.; Dong, J.; Zhang, Y.; Tian, Y.; Yang, Z. Social functional mapping of urban green space using remote sensing and social sensing data. ISPRS J. Photogramm. Remote Sens. 2018, 146, 436–452. [Google Scholar] [CrossRef]
  22. Zhonghua, W.; Tianming, Z. In Analysis on the market accessibility of tourism resources based on gis—A case study of Xuzhou city. In Proceedings of the 2010 Second IITA International Conference on Geoscience and Remote Sensing, Qingdao, China, 28–31 August 2010; IEEE: New York, NY, USA, 2010; pp. 80–84. [Google Scholar] [CrossRef]
  23. Weng, Q.; Lu, D. A sub-pixel analysis of urbanization effect on land surface temperature and its interplay with impervious surface and vegetation coverage in Indianapolis, United States. Int. J. Appl. Earth Obs. Geoinf. 2008, 10, 68–83. [Google Scholar] [CrossRef]
  24. Li, Z.; Wu, W.; Liu, X.; Fath, B.D.; Sun, H.; Liu, X.; Xiao, X.; Cao, J. Land use/cover change and regional climate change in an arid grassland ecosystem of inner Mongolia, China. Ecol. Model. 2017, 353, 86–94. [Google Scholar] [CrossRef]
  25. Zhang, Z.; Wang, X.; Zhao, X.; Liu, B.; Yi, L.; Zuo, L.; Wen, Q.; Liu, F.; Xu, J.; Hu, S. A 2010 update of national land use/cover database of china at 1: 100000 scale using medium spatial resolution satellite images. Remote Sens. Environ. 2014, 149, 142–154. [Google Scholar] [CrossRef]
  26. Liu, J.; Kuang, W.; Zhang, Z.; Xu, X.; Qin, Y.; Ning, J.; Zhou, W.; Zhang, S.; Li, R.; Yan, C. Spatiotemporal characteristics, patterns, and causes of land-use changes in China since the late 1980s. J. Geogr. Sci. 2014, 24, 195–210. [Google Scholar] [CrossRef]
  27. Hurni, H.; Tato, K.; Zeleke, G. The implications of changes in population, land use, and land management for surface runoff in the upper Nile basin area of Ethiopia. Mt. Res. Dev. 2005, 25, 147–154. [Google Scholar] [CrossRef] [Green Version]
  28. Lu, D.; Moran, E.; Hetrick, S. Detection of impervious surface change with multitemporal landsat images in an urban–rural frontier. ISPRS J. Photogramm. Remote Sens. 2011, 66, 298–306. [Google Scholar] [CrossRef] [PubMed] [Green Version]
  29. Tateishi, R.; Shimazaki, Y.; Gunin, P. Spectral and temporal linear mixing model for vegetation classification. Int. J. Remote Sens. 2004, 25, 4203–4218. [Google Scholar] [CrossRef]
  30. Wu, C. Normalized spectral mixture analysis for monitoring urban composition using etm+ imagery. Remote Sens. Environ. 2004, 93, 480–492. [Google Scholar] [CrossRef]
  31. Zhang, C.; Chen, Y.; Lu, D. Mapping the land-cover distribution in arid and semiarid urban landscapes with landsat thematic mapper imagery. Int. J. Remote Sens. 2015, 36, 4483–4500. [Google Scholar] [CrossRef]
  32. Wang, Y.; Huang, F.; Wei, Y. Water body extraction from landsat etm+ image using mndwi and kt transformation. In Proceedings of the 21st International Conference on Geoinformatics, Kaifeng, China, 20–22 June 2013; IEEE: New York, NY, USA, 2013; pp. 1–5. [Google Scholar] [CrossRef]
  33. Abeje, M.T.; Tsunekawa, A.; Haregeweyn, N.; Nigussie, Z.; Adgo, E.; Ayalew, Z.; Tsubo, M.; Elias, A.; Berihun, D.; Quandt, A. Communities’ livelihood vulnerability to climate variability in Ethiopia. Sustainability 2019, 11, 6302. [Google Scholar] [CrossRef] [Green Version]
  34. Del Mar Martínez-Bravo, M.; Martínez-del-Río, J.; Antolín-López, R. Trade-offs among urban sustainability, pollution and livability in European cities. J. Clean. Prod. 2019, 224, 651–660. [Google Scholar] [CrossRef]
  35. Chen, Z.; Lu, M.; Ni, P. Urbanization and rural development in the people’s republic of China. In Cities of Dragons and Elephants: Urbanization and Urban. Development in China and India; ADB Institute: Mandaluyong, Phillipines, 2019; Volume 9. [Google Scholar]
  36. Zhao, J.; Ouyang, Z.; Zheng, H.; Zhou, W.; Wang, X.; Xu, W.; Ni, Y. Plant species composition in green spaces within the built-up areas of Beijing, China. Plant. Ecol. 2010, 209, 189–204. [Google Scholar] [CrossRef]
  37. Jiang, Y.; Fu, P.; Weng, Q. Assessing the impacts of urbanization-associated land use/cover change on land surface temperature and surface moisture: A case study in the midwestern United States. Remote Sens. 2015, 7, 4880–4898. [Google Scholar] [CrossRef] [Green Version]
  38. Sang, Y.-F.; Yang, M. Urban waterlogs control in China: More effective strategies and actions are needed. Nat. Hazards 2017, 85, 1291–1294. [Google Scholar] [CrossRef]
  39. Wang, C.; Li, Y.; Myint, S.W.; Zhao, Q.; Wentz, E.A. Impacts of spatial clustering of urban land cover on land surface temperature across Köppen climate zones in the contiguous United States. Landsc. Urban Plan. 2019, 192, 103668. [Google Scholar] [CrossRef]
  40. Lazzarini, M.; Marpu, P.R.; Ghedira, H. Temperature-land cover interactions: The inversion of urban heat island phenomenon in desert city areas. Remote Sens. Environ. 2013, 130, 136–152. [Google Scholar] [CrossRef]
  41. Milego, R.; Michelet, J.F.; Arévalo, J.; Jupova, K.; Larrea, E. ESPON Fuore: Functional Urban Areas and Regions in Europe; ESPON: Luxembourg, 2019. [Google Scholar]
Figure 1. Spatial distribution of the studied cities in the Inner Mongolia Plateau of China.
Sustainability 12 06783 g001
Figure 2. Workflow for multi-scale green space within urban regions. (a) Park green space extraction; (b) Intra-urban green space component extraction.
Sustainability 12 06783 g002
Figure 3. Accuracy assessment of urban green space fractions across all the studied cities.
Sustainability 12 06783 g003
Figure 4. Intra-urban green space fractions and typical parks’ green space in each studied city of the Inner Mongolia Plateau.
Sustainability 12 06783 g004
Figure 5. Coverage ratio of green space in the ecological service zone (500-m radius from urban parks).
Sustainability 12 06783 g005
Figure 6. Maps of 500-m ecological service radius in all directions for all the studied cities.
Sustainability 12 06783 g006
Figure 7. Urban green space area per capita and parks’ green space area per capita in the Inner Mongolia Plateau.
Sustainability 12 06783 g007
Figure 8. Residential service zone not covered by the 500 m radius ecological service zone for calculation of urban green space coverage.
Sustainability 12 06783 g008
Table 1. Datasets used for extracting urban green space.
Data TypeData NameSpatial Resolution and Data TypeData Source
Data for classificationLandsat-8 OLIThe rectified 15-m imageshttp://glovis.usgs.gov/
Auxiliary dataAdministrative boundary of inner Mongolia Plateau;1:2,500,000 vector boundaryNational Geomatic Center of China
Open Street Map (OSM);1:100,000 vector boundaryhttp://www.gadm.org
Data (POI, roads, rivers, etc.);
City residential populationStatistical data from counties/cities/districtsStatistical bureau of inner Mongolia autonomous region
Validation dataGoogle imageryHigh-resolution images (download level: 18, year: 2019)http://google-earth.en.softonic.com/
Land use/cover data of China1:100,000 city boundaryInstitute of Geographic Sciences and Natural Resources Research, Chinese Academy of Sciences
Table 2. The number of sampling points across all the studied cities in the Inner Mongolia Plateau of China.
City NameThe Number of Sampling PointsCity NameThe Number of Sampling Points
Hohhot354Hulunbuir97
Baotou354Xilin Gol87
Tongliao124Bayannur72
Chifeng124Wuhai59
Ordos122Ulanhot59
Ulanqab119Alxa54
Table 3. Area and ratio of urban green space across all the studied cities in the Inner Mongolia Plateau (Unit: Area (km2), ratio (%)).
Prefecture-Level CityUrban Built-Up AreaUrban Green Space AreaParks’ Green Space AreaThe Ratio of Urban Green Space to Urban Built-Up Area
Huhhot240.1848.5213.9920.2
Baotou306.1179.332025.92
Ordos82.923.876.5628.8
Ulanqab91.1527.9914.0530.71
Bayannur55.019.41.2417.09
Wuhai45.0912.274.3827.21
Hulunbuir74.1817.171.8523.14
Hinggan League45.357.90.517.43
Tongliao88.7420.413.7623
Chifeng100.7117.650.9817.52
Xilin Gol league66.8317.52.5726.19
Alxa League41.6213.393.2532.17
Total1237.87295.473.1424.03

