Abstract
This paper examines whether the national green industrial policy (GIP) can effectively optimize the enterprises’ structural transformation and upgrading, and improve production efficiency of enterprises. Using China’s firm-level data from 1998 to 2007, we take the 2003 “Cleaner Production Promotion Law of PRC” as the turning point of GIP implementation, and employ the difference-in-differences (DID) method to explore the policy effect on total factor productivity (TFP) of enterprises. The analysis shows that GIP can enhance the enterprise’s resource allocation capability and TFP growth. The implementation path of policy mainly relies on the compensation mechanism to incentivize innovation and the elimination mechanism of market selection. Specifically, GIP enhances TFP growth by accelerating the dynamic replacement (enterprise entry and exit) and elimination mechanism of the market, and by promoting innovative production to enhance the enterprise’s production efficiency. Further heterogeneity analysis reveals that state-owned enterprises are more susceptible to the influence of GIP, and GIP exerts more restrictive impact on high-pollution industries. Also, GIP has more significant net spillover effect on technology-intensive enterprises. The study provides a reliable factual basis for the market effect of GIP and the direction for green industry development.
1. Introduction
The green economy emphasizes low carbon, environmental protection and coordination, sustainability and recycling in the process of economic development [1,2]. Globally, there have been rising concerns over climate change and environment issues. From the United Nations Intergovernmental Panel on Climate Change (IPCC) in 1997, to the UK White Paper “The future of our energy: building a low carbon society” in 2003, the Kyoto Protocol in 2005, the Copenhagen Agreement in 2009, and the Paris Agreement in 2015, there have been urgent calls to all nations to address climate and environmental issues. In this context and under international pressure, China has been paying increasing attention and taking policy actions to cope with climate and environmental problems. In recent years, Chinese leadership has set green economy and environmental protection as the nation’s top priority. The 2019 government work report and 19th National Congress targeted the energy consumption of GDP to drop by 3% annually. The decree emphasizes the cultivation of emerging industries such as network and information technology, high-end manufacturing, biomedical, new-energy, and artificial intelligence to achieve high-quality, high-efficiency and sustainable development [3]. It has been a national consensus that developing a green industrial economy is a powerful path for sustainable development, and is imperative for the construction of ecological civilization [4]. Another national consensus on pollution control is that the front-end pollution control (cleaner and greener upstream production process) should take precedence over terminal pollution control (pollution first and then control), as the former can transform the existing industrial form and process, engage in intensive resource and energy conservation, and low carbon environment in the production process. The green industrial policy (GIP), being the front-end pollution control approach, is just the right choice of pollution control policy. Also, it can not only save the high cost of “terminal pollution control” and avoid the “irreversibility of pollution”, but also realize high-quality development and enhance the innovation capability of enterprises, thereby improving resource utilization and total factor productivity (TFP) growth of enterprises [5].
Out of various policies and regulations on environmental control, the “Cleaner Production Promotion Law of the People’s Republic of China” (approbated on 29 June 2002, enacted and effective on 1 January 2003) is considered the central piece landmark legislation that initiated a “revolution” in cleaner industrial production. This legislation represents the first and groundbreaking law on cleaner production in China and a significant step taken by the Chinese Government to act on environmental industrial productions [6]. It mandates cleaner production to be included in the national economic and social development plan, environmental protection, resource utilization, industrial and regional development plans, etc. At the same time, it requires that the backward production technology, process, equipment, and products of microenterprises should be eliminated within a time limit, and scientific research, technology development, and international cooperation on cleaner production should be encouraged. This law stipulates explicit environmental protection requirements for the production process and business activities, and is marked as a “historical turning point” in the implementation of green industrial policy (GIP). The policy constitutes a quasi-natural experiment on environmental protection, and enables us to explore the relationship between green industrial policy and the operating performance of enterprises on production efficiency. Therefore, the core of this article is to examine whether GIP would promote the transformation and upgrading of enterprises, and achieve green development of industries. Specifically, this study is to investigate whether GIP would enhance the enterprise’s resource allocation capability and TFP growth.
This paper contributes to the literature in four ways. First, based on China’s firm-level data from 1998 to 2007, this paper measures the TFP of enterprises by the methods described in Olley and Pakes [7], Levinsohn and Petrin [8], and others [9,10,11,12,13], and uses the difference-in-differences (DID) method to analyze the relationship between GIP and TFP. Second, this paper provides institutional background regarding the process and stages of China’s green industry policy and identifies the quasi-experiment turning point of GIP. Third, this paper provides the pathway mechanism analysis of the implementation of GIP. One pathway is the innovation incentive and compensation mechanism [14], which promotes innovative production of new products and enhances the TFP growth of enterprises by innovation. The other pathway is the market selection and elimination mechanism, which accelerates the dynamic replacement of unfitting enterprises in market [15,16]. Fourth, the paper further analyzes possible different policy effects of GIP due to enterprise heterogeneity in ownership structure, innovation capability, market adaptability, and resource endowment.
2. Materials and Methods
2.1. Previous Studies
The national industrial cleaner production policy is expected to impact the production cost and operation revenue of enterprises. GIP’s requirement of cleaner energy and low-pollution production will inevitably increase cost burden to the enterprises [17], which may prompt them to postpone investment [18] and develop new products, resulting in lower profit and production efficiency. This strand of literature essentially argues that increasing environmental regulation intensity will bring negative effects [17,19]. On the other hand, the Porter Hypothesis [14] holds that environmental regulation will promote technological development, organizational innovation, and production process innovation, resulting in improvement of TFP growth for enterprises [4,15,16]. In addition, subsequent enterprise innovation and productivity growth will also effectively drive general social and economic growth and improve the efficiency of resource allocation [20], leading to high-quality green development [3].
Previous studies have established an “inverted N” relationship between the intensity of environmental regulation and total factor productivity (TFP) of enterprises. That is, in the initial stage of environmental regulation, the low external cost or penalty is not sufficient to induce the enterprises to comply and engage in technological innovation, and TFP exhibits a downward trend. As environmental regulation intensifies, enterprises are motivated to innovate and TFP rises. Finally, when environmental regulation intensifies even more substantially to exceed the endurance limit of the enterprises, TFP will start to fall [21].
Also, previous studies have shown that environmental regulation exerts an elimination mechanism on enterprises. That is, low-efficiency and high-pollution enterprises will be driven out of the market, and new industries such as energy-efficient green industry, high-tech industry, and information industry will enter the market. This dynamic evolution process of enterprises’ entry and exit is the source and driving force for enterprises to improve their TFP and efficiency [22,23]. Along this line, ref [11] found “the shadow of death effect” in their analysis of Israeli enterprises from 1979 to 1988. Baldwin and Gu [12] found that enterprise turnover (entry and exit) contributed 15–25% to labor productivity in Canadian enterprises. Disney et al. [24] showed that enterprise turnover accounted for 80–90% of TFP growth in Britain from 1980 to 1992. Ref [25] found that turnover of enterprises has a greater impact on labor productivity in transition economies. While a few scholars think that the influence of enterprise turnover is not significant [9,26], most hold the view that enterprise turnover caused by environmental regulation has a significant effect on productivity [10,27].
In sum, the existing literature has paid attention to the impact of environmental regulation on enterprise innovation and TFP in general, but relatively less attention has been paid to the market response and net market effect of GIP in particular, nor been studied whether GIP has accelerated the enterprise innovation process, and whether GIP has strengthened the market competition and elimination mechanism of enterprises. Our study attempts to fill this gap in the literature.
2.2. Institutional Background
China’s green industrial development policies can be viewed as having evolved through three stages. In the first stage (1978–1999), economic development held precedence over environmental protection. Environmental policies focused on “terminal pollution control” (pollution first and then control). While environmental legislation and implementation in the initial stage was weak, there were still some industrial environmental protection initiatives established, such as in 1983 when “environmental protection” was declared as a basic national policy, and “the Environmental Protection in the People’s Republic of China (Trial)” was formally promulgated in 1989. In 1996, the “Ninth Five-Year Plan” for National Economic and Social Development formally listed the sustainable development strategy as the basic national strategy.
The second stage of GIP, from 2000 to 2011, is characterized by increasing awareness and sense of urgency of environmental protection, and the strengthening of national environmental protection policies. In 2002, the 16th National Congress of the Communist Party advocated “a new road to industrialization” and “a scientific outlook on development.” Most importantly, the “Cleaner Production Promotion Law of the People’s Republic of China,” enacted and effective on 1 January 2003, initiated a “revolution” in cleaner industrial production. This law set wide-ranging comprehensive environmental requirements for the production process and enterprise activities, which was marked as the “turning point” of GIP. Subsequent to this major landmark legislation, supplementary policies were promulgated, such as the “Renewable Energy Law” in 2005, and the “Interim Measures for Public Participation in Environmental Impact Assessment” in 2006.
The third stage, from 2012 to the present, continues enhancement of GIP. Since the 18th National Congress (2012), the green development concepts such as ecological priority, low carbon economy, circular economy, and sustainable development have been applied in enterprise production and people’s lives. The 19th National Congress (2016) further promoted the development concepts of “innovation, coordination, green, open, sharing,” “green water and green hills are golden hills and silver mountains,” and the Three Firsts “conservation first, protection first, and natural recovery first.”
The implementation of GIP over the three stages has promoted the green transformation of economic development, as well as the green lifestyle of the populace, and has helped to establish a green and low-carbon economic development system, in which the 2003 “Cleaner Production Promotion Law of PRC” has undoubtedly played a pivotal role. Therefore, we propose to study the effect of GIP by examining the impact of this landmark legislation on the innovation and TFP of enterprises.
2.3. Pathway Mechanisms of GIP and Hypotheses
Conceptually, GIP impacts the enterprise’s innovation and TFP through two channels or pathway mechanisms. First, GIP regulates and incentivizes enterprises to improve their production efficiency through innovation and optimization of resource allocation, and through complying with the requirements of green development [20]. Second, GIP accelerates the elimination mechanism of enterprises (enterprises entering and exiting) to improve TFP of enterprises [22,23].
2.3.1. Enterprise Innovation Incentive and Compensation Mechanism
According to the dynamic competition theory of enterprise in environmental regulation and technological innovation [14], GIP requires enterprises to replace backward equipment, and update and adopt advanced technology and equipment to meet the needs of an ecological and green economy. At the same time, environmental industrial regulations push enterprises to increase innovation activities and adopt advanced environmental protection technologies to meet enterprises’ need for competitiveness and regulation compliance [28]. Studies have shown that environmental policies can promote technological innovation in enterprises to achieve a win–win outcome of economic growth and environmental friendliness [29]. Appropriate environmental regulations can stimulate the innovation compensation effect, thus not only to recoup the compliance cost but also increase productivity and enterprise competitiveness (via innovation in production technology and innovation in pollution control technology).
Figure 1 provides a flow chart illustrating the effect of GIP on the productivity and competitiveness of enterprises. GIP produces a strong environment supervision and market competition environment, and increases production cost and market entry threshold. To maximize profits and withstand competition, the enterprises must rely on independent innovation to develop a new product, new production mode, and new management structures to improve production efficiency and viability of enterprises. This mechanism forms Hypothesis 1:
Hypothesis 1 (H1).
GIP can promote enterprise innovation (generating new products) and enhance enterprise innovation performance (TFP growth) through external regulatory constraints.
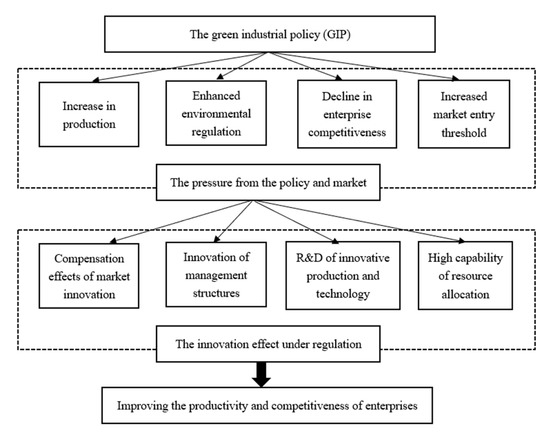
Figure 1.
Market innovation incentive and compensation effect mechanism.
2.3.2. Market Selection and Elimination Mechanism: Entry and Exit of Enterprises
Enterprise turnover (entry and exit) is an important pathway for economic development and market change [22,23,30]. The Schumpeterian view of creative destruction [14] expounds the historical development trend of the emergence of new things and elimination of old things. The competition and elimination mechanism between enterprises provides continuous impetus for economic development and ensures the vitality of the market, and environmental regulation (GIP) accelerates this mechanism.
The local dynamic equilibrium model of environmental regulation and employment [28] points out that environmental regulation raises the market threshold of enterprises through the mechanism of entry and exit, and forms the market selection mechanism of enterprises [30]. The determinants for an enterprise’s turnover behavior (entering or exiting the market) lie in its own labor productivity and TFP, and the comparative advantages. That high-productivity firms enter and low-efficiency firms exit is the basic law of market operation. Understanding the dynamic evolution process and the internal mechanism is essential to understand the sources of enterprise innovation and TFP growth.
There are several methods to analyze enterprise productivity and to decompose the dynamic evolution process, including the method of Baily et al. and etc. [7,8,9,10,11,12,13]. Among them, the FHK method [10] decomposes the overall productivity growth of the industry into the productivity growth of surviving enterprises, newly entering enterprises, and exiting enterprises. Although it overcomes the shortcomings of BHC [9], the FHK method [10] is susceptible to measurement errors. The GR [11] method takes the average value to smooth the error, and to make up for the deficiency of the FHK method. Baldwin and Gu [12] examined the effect of enterprise turnover on productivity by directly comparing the productivity of entering and exiting enterprises. However, the DOP method [13] can better understand the impact of the entry and exit of enterprises on TFP.
Olley and Pakes [7] proposed their OP method to decompose the TFP of enterprises into two parts: the arithmetic average of enterprise productivity and the covariance between the productivity of enterprises and market share:
where:
n is the total number of enterprises in phase t; the represents enterprise i’s market share in period t; represents enterprise i’s productivity in period t; is the average market share of enterprises in phase t; is the covariance of market share and enterprise productivity.
Following [12], the dynamic decomposition of TFP can be specified as follows:
where:
S, E, and X represent the surviving enterprise, entering enterprise and exiting enterprise, respectively; , the difference between the arithmetic average of the surviving enterprise productivity, representing the extent of the surviving enterprise’s technological progress; indicates the change in covariance between enterprise productivity and market share, representing the market scale effect. The larger an enterprise’s market share, the stronger its ability to allocate resources, and the higher its contribution to enterprise productivity, reflecting the scale effect of the market; indicates the entry effect of the enterprise; indicates the withdrawal effect of the enterprise, and both of them reflect the effect of market selection and turnover. Generally speaking, is called the growth effect of an enterprise, which reflects the productivity growth coming from the development of the enterprise itself. By construction, the effect of market selection and replacement is represented by , which reflects the changes in market productivity brought about by the change in the number of enterprises and by GIP to influence the operating performance and TFP growth of market enterprises through this pathway mechanism. Thus, we can state Hypothesis 2 as follows:
Hypothesis 2 (H2).
GIP enhances innovation performance of enterprises (the growth of TFP) by accelerating market turnover (the entry and exit of enterprises) and elimination mechanism.
2.4. Data and Empirical Specification
2.4.1. Data Source
This paper uses annual firm-level data across different industries during the period from 1998 to 2007. The data source is China’s industrial enterprise statistics, which contains detailed information and characteristics, including relevant economic performance indicators of the enterprise. Following data management procedures (sample selection and matching, dealing with missing data, etc.), we analyze the industrial policy (GIP) effects by using a balanced panel of 1,201,841 observations, and dividing the sample period into 1998–2002 and 2003–2007, five years before and five years after the promulgation of “Cleaner Production Promotion Law of PRC” on 1 January 2003, which, as mentioned earlier, is the turning point of GIP and constitutes a quasi-natural experiment of the policy.
2.4.2. Empirical Specification
Measurement of TFP
To maximize estimation accuracy and minimize measurement error and extraneous deviations, we follow [7] to measure TFP and adopt OLS (Ordinary Least Square) and LP (Levinsohn and Petrin) [8] for robustness test. According to [7], in the OP estimation, the following model is used to include the dummy variables of enterprise export:
where indicates the industrial value added of enterprise i in year t; is the investment (fixed assets formation) of the enterprise; is the number of employees; is a dummy variable indicating whether the enterprise has an export business; expresses whether it is a state-owned enterprise; is the life span of the enterprise; represents other variables, and represent individual fix-effect, time fix-effect, and random effect, respectively.
This paper applies the Olley–Pakes semiparametric three-step estimation method to address the simultaneity bias and sample selection bias in the least square estimation. In this method, the state variable is State ( and ), the control variable is cvars ( and ), the proxy variable is Proxy (lnI, the actual investment amount of the enterprise), the free variables are Free ( for employment number, year for time, type for industry dummy variable), and exit variable is exit (indicating whether the enterprise withdraws from the market).
Identification of Enterprise Status
Following [24] and [30], we identify and designate the enterprises appearing in the current period but not appearing in the previous period as “newly entered” enterprises, and enterprises appearing in the previous period but not in the current period as “newly exiting” enterprises, and enterprises existing in both periods as “still surviving” enterprises. The status of enterprise is expressed as a dummy variable. For a “newly entering” enterprise, it is given a value of 1 for the dummy variable enter and 0 otherwise. This same way of assigning values is used for dummy variables exit and survive.
Division of GIP Implementation Period
As mentioned earlier, the 2003 “Cleaner Production Promotion Law of PRC” is considered the key turning point of the green industrial development policy. We thus take 2003 as the year of policy shock and analyze the effect of GIP before and after this event. The dummy variable Policy takes the value of 1 for data from 2003 to 2007, and 0 otherwise.
Estimation Model and Descriptive Statistics
The paper uses the difference-in-differences (DID) method to examine the policy effect of GIP on TFP. The estimation model is set as follows:
where is the total factor productivity of enterprise i in year t; is the interaction between policy and enterprise state, indicating the net effect brought by policy; is the policy effect on the enterprise; represents the state of the enterprise (including enter, exit, or new-product); represents control variables; and represent the individual effect, time effect, and random effect, respectively.
Thus, taking the entry status of enterprises as an example, the sample is divided into four groups: the control group before policy implementation (enter = 0, policy = 0), the control group after policy implementation (enter = 0, policy = 1), the experiment group before policy implementation (enter = 1, policy = 0), and the experiment group after policy implementation (enter = 1, policy = 1). The interactive item (did = policy * enter) indicates the net effect brought by policy implementation.
Control Variables
The control variables or other explanatory variables in this study include capital, total assets of enterprises; age, the age of the enterprise; debt, the ratio of long-term debt over total asset; profit, the ratio of profit over total asset; liquidity, the ratio of liquid asset over total asset; and size, firm size measured by the annual average number of employees. Table 1 presents descriptive statistics of the variables.

Table 1.
Descriptive statistics.
Kernel density function in Figure 2 and correlation coefficient matrix in Table 2 are used to analyze and compare the distribution characteristics, reliability, and correlation of the TFP values estimated by different methods. Figure 2 shows that the value of TFP estimated by the LP method (TFP_LP) is the largest, and the kernel density graph tends to skew to the right. Figure 2 also shows that the estimates of TFP_LP and TFP_OLS are very close to each other (correlation reaches 0.9998), followed by the estimation result of TFP_FE. On the whole, the pairwise correlations between TFP estimated by four alternative methods are fairly high, all above 0.92, whereas the correlations between the value of TFP and labor and capital productivities are fairly low. This suggests that TFP is determined more by the allocation of resources than by the contribution of labor and capital. These results are consistent with other studies and thus can be taken as reliable.
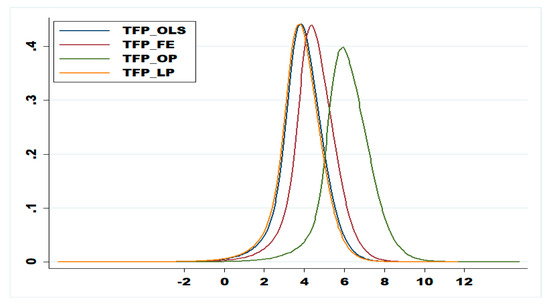
Figure 2.
Kernel density function of TFP estimates.
Table 2.
Correlation of total factor productivity (TFP) estimates under various methods (with labor productivity and capital productivity added).
Model to Test Pathway Mechanism
This paper analyzes the pathway mechanism from three angles (entry, exit, and new-product), by adding a mechanism identification model to the basic DID model, as follows.
- (1)
- Testing mechanism by way of enterprise entry:
- (2)
- Testing mechanism by way of enterprise exit:
- (3)
- Testing mechanism by way of enterprise innovation:
Equation (8) examines the relationship between GIP and enterprise entry. Equation (9) examines whether the newly entered enterprise brings about growth in TFP compared with the existing enterprises, and Equation (10) examines the common influence of GIP and enterprise entry, as well as the interactive effect (did) on TFP. Equations (11)–(16) are set up in a similar way to test the mechanism of enterprise exit and enterprise innovation.
3. Results and Discussions
3.1. Baseline Main Results
The paper uses the firm and year fixed-effect model and the difference-in-differences (DID) method to study the impact of GIP on TFP. The results are shown in Table 3, in which models (1)–(2), (3)–(4), and (5)–(6) represent the impact of GIP on enterprise entry, exit, and new-product innovation, respectively.
Table 3.
Baseline main results.
In the entry enterprise case, the coefficient of policy is 0.2655 in model (2), indicating that GIP (the policy of industrial cleaner production) significantly (p < 0.01) improved the innovation performance of enterprises and boosted the growth of TFP by 0.2655, which is an increase of 6.99% based on the sample mean of 3.7985. Thus, hypothesis 2 (H2) is supported. Compared with other enterprises, the TFP of newly entered enterprises is lower by about 0.2810. This may be related to the fact that the newly entered enterprises lacked the management experience and prowess for a short time. However, the interaction effect (did-entry) between the policy and entry is positive with an insignificant net effect of 0.0270.
In the exited enterprise case, the coefficient of policy is 0.2312 in model (4), indicating that policy (GIP) significantly (p < 0.01) improved the total factor productivity (TFP) of enterprises by 0.2312, which is an increase of 6.09% (mean = 3.7985). Compared with other enterprises, the TFP of newly exited enterprises is lower by 0.1671 and significant (p < 0.01). This suggests that the inefficient enterprises were withdrawn from the market, thus supporting H2. The interaction effect (did-exit) between the policy and exit is significantly (p < 0.01) positive and the net effect is 0.2151, which is an increase rate of 5.41%. These results indicate that GIP has a strong effect in promoting the withdrawal of low-efficiency enterprises from the market and enhancing the TFP of market enterprises. Thus, again, H2 is supported.
In the enterprise innovation (new-product) case, the coefficient of policy is 0.2350 in model (6), indicating that GIP significantly boosted the growth of TFP, thus, supporting H1. The coefficient of did-new-product is significant, showing that net effect of policy and new-product reaches 0.0767, an increase in TFP growth rate of 1.93%. The coefficient of new-product is positive and significant, again showing that GIP can promote enterprise innovation (generate new products) and improve enterprise innovation performance (TFP growth). Thus, H1 is verified. These results all show GIP prompts enterprises to strengthen R&D and innovation activities, develop new products, and adopt advanced production technologies for environmental protection to enhance their resource allocation capability and TFP growth. Thus, H1 is verified.
3.2. Robustness Checks and Counterfactual Test
To ensure the reliability of the results, we re-estimated the model using TFP measured by different methods. The results are shown in Table 4, which shows that the coefficient values of three focused explanatory variables for TFP measured by different methods are significant and essentially the same as the baseline results in Table 3.
Table 4.
Robustness test.
As mentioned above, the actual implementation year of GIP is 2003. We advanced the implementation year by 1 year (did-1), 2 years (did-2), and 3 years (did-3), and similarly delayed its implementation by 1 year (did+1), 2 years (did+2), and 3 years (did+3). The counterfactual results are presented in Figure 3, which shows that the coefficient estimates of the interaction terms between policy and others (entry, exit, and new-product) exhibit a common trend before and after the year of policy implementation. This indicates that there was no systematic error in the estimation approach used here and the baseline model, and the results are therefore reliable.
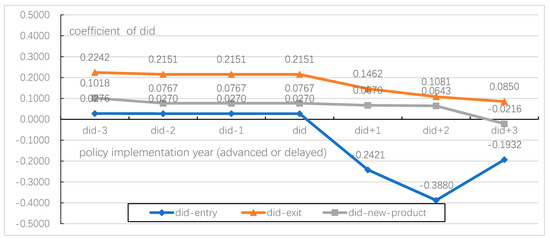
Figure 3.
Difference-in-differences (DID) coefficient estimates under the counterfactual test.
The results in Table 3 and Table 4 have effectively verified H1 and H2, indicating that GIP significantly enhances the production performance (TFP) of enterprises. To further validate the reliability of the results, we also conducted a counterfactual test on the baseline model. If the coefficient values (did-entry, did-exit, and did-new-product) exhibited a certain common trend before and after policy implementation, then the results are reliable.
3.3. Testing H1 and H2 through Pathway Mechanisms
In this section we expand the basic DID model by adding the intermediate mechanism identification model to further test H1 and H2. Table 5 shows that the impact of policy (GIP) on the entry and exit of enterprises in the market is 0.0927 and 0.155, respectively, and statistically significant. Table 5 also shows that compared with other enterprises, newly entered enterprises (entry) and exiting enterprises (exit) contribute to TFP by −0.2389 and −0.1671, respectively, but not significant. However, the coefficient of the interaction effect about did-entry and did-exit is 0.0270 and 0.2151, where the latter is significant while the former is not. In addition, it appears that GIP significantly enhances the performance (TFP) of surviving enterprises by 0.2548, which represents a growth rate of 6.71%. Thus, in sum, the policy (GIP) indeed can accelerate market turnover (entry and exit of enterprises) to improve TFP of enterprises, and particularly enhance TFP growth of surviving enterprises, convincingly verifying H2.
Table 5.
Testing pathway mechanism and H2.
Table 6 shows the effect of GIP on the innovation capability and TFP for newly entered enterprises, and for the surviving (continuing) enterprises. It appears that the policy effect on product innovation capability (new-product) is negative significant for both the newly entered enterprises and surviving enterprises. The effect of new-product on TFP is positive insignificant for newly entered enterprises and positive significant for surviving enterprises. This implies that the innovation and production induced by GIP is not mature enough yet in a short time for newly entered enterprises. The interaction effect (did-new-product) for newly entered enterprises is also negative but insignificant. However, the interaction effect (did-new-product) for surviving enterprises is positive and significant. These results illustrate that from a long-term perspective GIP promotes innovation of enterprises (generating new products) and enhances innovation performance (TFP) of enterprises through external regulatory constraints (imposed by GIP), convincingly verifying H1.
Table 6.
Testing pathway mechanism and H1.
3.4. Further Analysis Accounting for Enterprise Heterogeneity
3.4.1. Enterprise Heterogeneity by Ownership
Since enterprise ownership structure may lead to differences in autonomy and market bargaining power, and the ability of policy compliance, etc., we divide the sample into state-owned enterprises and non-state-owned enterprises to examine possible differences in policy effect due to this heterogeneity. Compared to non-state-owned enterprises, the state-owned enterprises conceivably may receive more preferential treatments and protection benefits from central and local governments, and may have stronger negotiation position in the market.
Table 7 shows that the interaction effect of policy and entry (did-entry) on TFP is positive significant, with the coefficient value for the state-owned enterprises (0.1266) greater than that of non-state-owned enterprises (0.0442). This implies that it is easier for the state-owned enterprises to enter the market and benefit from GIP. On the other hand, the interaction effect of policy and exit mechanism (did-exit) is weaker for the state-owned enterprises (0.0834) than that of non-state-owned enterprises (0.2312). The positive significant interaction effect reveals that as inefficient enterprises (such as “zombie enterprises” in the state sector) were withdrawn from the market, TFP of the market increased, again supporting H2. In addition, the interactive policy and new product (did-new-product) effect appears to be stronger for state-owned enterprises (0.1416) than that for non-state-owned enterprises (0.0422). This suggests that state-owned enterprises have higher market renewal and innovation ability, and are more susceptible to industrial policies and incentives.
Table 7.
Enterprise heterogeneity by ownership structure.
3.4.2. Enterprise Heterogeneity by Pollution Intensity
Since enterprises with different pollution levels may be burdened with different environmental costs and face different external pressure imposed by environmental regulation, we divide the enterprises into high-pollution industries and low-pollution industries according to the extent of pollution and industry characteristics. The regression results are shown in Table 8. The policy and entry interaction effect (did-entry) on TFP for high-pollution industries is positive significant, raising TFP of enterprises by 0.0446, while that for low-pollution industries is not significant. The policy and exit interaction effect (did-exit) on TFP for high-pollution industries is positive significant, and higher (0.2137) than that for low-pollution industries (0.2092). This indicates that GIP poses a greater restraint on high-pollution industries and has a higher positive spillover effect. The policy and new product interaction effect (did-new-product) for high-pollution industries is positive significant, and smaller (0.0389) than that for low-pollution industries (0.1016), suggesting that the transformation and innovation capability of high pollution industries is lower than that of low pollution industries.
Table 8.
Enterprise heterogeneity by pollution intensity.
3.4.3. Enterprise Heterogeneity by Factor Intensity
There may be different policy effects due to industry heterogeneity in resource factor endowment, energy consumption, human capital, and scientific innovation capability, as well as the environmental externalities and regulation sensitivity. We divide the industries into labor-intensive, capital-intensive and technology-intensive industries to examine possible different policy effects on TFP of industries in heterogeneous development stages and factor endowments.
As shown in Table 9, the policy impact of GIP (did-entry) on TFP is positive for labor-intensive, capital-intensive, and technology-intensive enterprises, but only significant for technology-intensive enterprises, which indicates a pronounced net effect of GIP on the market entry of technology-intensive enterprises. However, the impact of GIP on TFP for the three types of enterprises is all positive significant in the withdraw mechanism (did-exit), with the coefficient of capital-intensive industries (0.2388) higher than that of other two types (0.2275 and 0.1589). Further, with respect to the mechanism of enterprise innovation (did-new-product), the coefficient for technology-intensive enterprises (0.0684) is higher than that for labor-intensive enterprises (0.0642) and capital-intensive enterprises (0.0643), which indicates that the technological level of enterprises is the key to determine productivity growth of enterprises, and the promotion effect of GIP on innovation is more pronounced for technology-intensive enterprises.
Table 9.
Heterogeneity by factor intensity of industry.
4. Conclusions, Policy Recommendations, Limitations, and Directions for Future Study
Based on the firm-level data from China’s industrial statistics from 1998 to 2007, this paper measures the TFP of enterprises, and employs the difference-in-differences (DID) method to identify and explore the relationship between green industrial policy (GIP) and TFP of enterprises. The main findings follow. (1) On the whole, GIP can enhance the resource allocation capability and TFP growth of enterprises. (2) The implementation path of GIP mainly relies on the market innovation incentive and compensation mechanism (H1), and the market selection and elimination mechanism (H2); that is, GIP accelerates the dynamic replacement (entry and exit of enterprises) and elimination mechanism (withdrawn from the market), and enhances the TFP of enterprises through innovation–compensation incentive effect of external regulatory constraints. Both H1 and H2 are supported. (3) The model robustness tests confirm that the results are reliable, and there is no systematic error in the effect of GIP on TFP growth. The mechanism tests also effectively verified H1 and H2. (4) The firm heterogeneity analysis reveals that, compared with non-state-owned enterprises, the state-owned enterprises have higher policy incentive effect, market updating adaptability and innovation ability, and are more susceptible to the influence of GIP. In addition, GIP imposes a higher degree of restraint and incentive on highly polluting industries, but the innovation capability of low pollution industry is greater. Furthermore, technology is found to be the key to TFP growth, and the net effect of GIP on technology-intensive enterprises is more pronounced and significant.
Based on the above findings, some policy implications and prescriptions are in order:
- The results from this big-data study provide a factual basis for policymakers to implement green industrial policy toward a low-carbon, circular, and sustainable development model. Specifically, the findings can inform policymakers to make use of the market elimination mechanism to accelerate the transformation and upgrading of industries, and promote technological innovation by compensation and incentive mechanism.
- Proper use of policy can promote economic transformation and development. The application of environmental regulation tools can incentivize existing enterprises to engage in continuous innovations, encourage entry of innovative enterprises, and gradually phase out backward enterprises, thereby effectively improving the resource allocation capability and TFP growth of enterprises. In this respect, we advocate a new preemptive green industrial policy with front-end forward-looking governance, which breaks away from the old governance mode of enduring pollution before control and containment, and develop high-tech industries, information technology industries, an internet economy, and a new-energy economy.
- We also advocate for implementing different green industrial policies to match with enterprise heterogeneity in resource factor endowments, and adaptability to market risks. Specifically, we should take heed to the leading role of state-owned enterprises in the process of market-oriented reforms and industrial policy implementation, and also pay attention to the innovation capabilities of technology-intensive enterprises, as well as give full consideration to the environmental improvement effect of highly polluting industries.
An insightful reviewer pointed out one limitation of our study; we focus on the effect of GIP over productivity at the national level. Several authors [32,33] have analyzed the impact of the same law region by region. Since the application of the law, by nature, could be heavily dependent on regional characteristics, there could be important regional differences in the effect of the policy. We plan to pursue this advice in the future to examine possible regional heterogeneity of the policy effect. We also plan to explore suitable data to extend and update the study at the national and regional level. Moreover, it would be interesting to try the synthetic control methods used by [34] as an alternative methodology of investigation.
Author Contributions
Original draft preparation, P.L.; Review, revise and editing, H.C. and W.-C.H.; Formal analysis, H.C. and W.-C.H. All authors have read and agreed to the published version of the manuscript.
Funding
This research received funding support by “the Fundamental Research Funds for the Central Universities”, Zhongnan University of Economics and Law (201810339).
Acknowledgments
We are grateful for insightful comments and suggestions made by the editor and anonymous reviewers.
Conflicts of Interest
The authors declare no conflict of interest.
References
- Rees, W.E. Economic development and environmental protection: An ecological economics perspective. Environ. Monit. Assess. 2003, 86, 29–45. [Google Scholar] [CrossRef]
- Kaplowitz, M.D.; Lupi, F.; Yeboah, F.K.; Thorp, L.G. Exploring the middle ground between environmental protection and economic growth. Public Underst. Sci. 2013, 22, 413–426. [Google Scholar] [CrossRef]
- Li, Z.; Yang, W.; Wang, C.; Zhang, Y.; Yuan, X. Guided High-Quality Development, Resources, and Environmental Forcing in China’s Green Development. Sustainability 2019, 11, 1936. [Google Scholar] [CrossRef]
- Rodrik, D. Green industrial policy. Oxf. Rev. Econ. Policy 2014, 30, 469–491. [Google Scholar] [CrossRef]
- Heshmati, A.; Kumbhakar, S.C. Technical change and total factor productivity growth: The case of Chinese provinces. Technol. Forecast. Soc. Chang. 2011, 78, 575–590. [Google Scholar] [CrossRef][Green Version]
- Mol, A.P.; Liu, Y. Institutionalizing cleaner production in China: The cleaner production promotion law. Int. J. Environ. Sustain. Dev. 2005, 4, 227–245. [Google Scholar] [CrossRef]
- Olley, G.S.; Pakes, A. The Dynamics of Productivity in the Telecommunications Equipment Industry. Econometrica 1996, 64, 1263–1298. [Google Scholar] [CrossRef]
- Levinsohn, J.; Petrin, A. Estimating Production Functions Using Inputs to Control for Unobservables. Rev. Econ. Stud. 2003, 70, 317–341. [Google Scholar] [CrossRef]
- Baily, M.N.; Hulten, C.; Campbell, D.; Bresnahan, T.; Caves, R.E. Productivity Dynamics in Manufacturing Plants. Brook. Pap. Econ. Act. Microecon. 1992, 1992, 187–267. [Google Scholar] [CrossRef]
- Foster, L.; Haltiwanger, J.; Krizan, C.J. Aggregate productivity growth: Lessons from microeconomic evidence. New Dev. Product. Anal. 2001, 303–372. [Google Scholar] [CrossRef]
- Griliches, Z.; Regev, H. Firm productivity in Israeli industry 1979–1988. J. Econ. 1995, 65, 175–203. [Google Scholar] [CrossRef]
- Baldwin, J.R.; Gu, W. Participation in Export Markets and Productivity Performance in Canadian Manufacturing. 15 August 2003. Economic Analysis Research Paper Series. Available online: https://ssrn.com/abstract=1402804 (accessed on 27 July 2020). [CrossRef]
- Melitz, M.J.; Polanec, S. Dynamic Olley-Pakes decomposition with entry and exit. Rand J. Econ. 2015, 46, 362–375. [Google Scholar] [CrossRef]
- Porter, M.E.; Linde, C.V.D. Toward a New Conception of the Environment-Competitiveness Relationship. J. Econ. Perspect. 1995, 9, 97–118. [Google Scholar] [CrossRef]
- Nishimizu, M.; Page, J.M. Total Factor Productivity Growth, Technological Progress and Technical Efficiency Change: Dimensions of Productivity Change in Yugoslavia, 1965–78. Econ. J. 1982, 92, 920–936. [Google Scholar] [CrossRef]
- Kalirajan, K.P.; Obwona, M.B.; Zhao, S. A Decomposition of Total Factor Productivity Growth: The Case of Chinese Agricultural Growth before and after Reforms. Am. J. Agric. Econ. 1996, 78, 331–338. [Google Scholar] [CrossRef]
- Gray, W.B.; Shadbegian, R.J. Plant vintage, technology, and environmental regulation. J. Environ. Econ. Manag. 2003, 46, 384–402. [Google Scholar] [CrossRef]
- Viscusi, W.K. Employment Relationships with Joint Employer and Worker Experimentation. Int. Econ. Rev. 1983, 24, 313–322. [Google Scholar] [CrossRef]
- Boyd, G.A.; Mcclelland, J.D. The Impact of Environmental Constraints on Productivity Improvement in Integrated Paper Plants. J. Environ. Econ. Manag. 1999, 38, 121–142. [Google Scholar] [CrossRef]
- Lichtenberg, F.R.; Potterie, B.V.P.D.L. International R&D Spillovers A Comment. Eur. Econ. Rev. 1998, 42, 1483–1491. [Google Scholar]
- Khanna, N.; Plassmann, F. Total factor productivity and the Environmental Kuznets Curve: A comment and some intuition. Ecol. Econ. 2007, 63, 54–58. [Google Scholar] [CrossRef]
- Mattar, Y. Arab ethnic enterprises in colonial Singapore: Market entry and exit mechanisms 1819–1965. Asia Pac. Viewp. 2004, 45, 165–179. [Google Scholar] [CrossRef]
- Pe’Er, A.; Vertinsky, I. Firm exits as a determinant of new entry: Is there evidence of local creative destruction? J. Bus. Ventur. 2008, 23, 280–306. [Google Scholar] [CrossRef]
- Disney, R.; Haskel, J.; Heden, Y. Restructuring and productivity growth in UK manufacturing. Econ. J. 2003, 113, 666–694. [Google Scholar] [CrossRef]
- Bartelsman, E.J.; Haltiwanger, J.C.; Scarpetta, S. Microeconomic Evidence of Creative Destruction in Industrial and Developing Countries. October 2004. Available online: https://ssrn.com/abstract=612230 (accessed on 27 July 2020).
- Tybout, P.A.M. The Moderating Role of Prior Knowledge in Schema-Based Product Evaluation. J. Consum. Res. 1996, 23, 177–192. [Google Scholar]
- Brandt, L.; Biesebroeck, J.V.; Zhang, Y. Creative accounting or creative destruction? Firm-level productivity growth in Chinese manufacturing. J. Dev. Econ. 2012, 97, 339–351. [Google Scholar] [CrossRef]
- Berman, E. Environmental Regulation and Productivity: Evidence from Oil Refineries. Rev. Econ. Stat. 2001, 83, 498–510. [Google Scholar] [CrossRef]
- Eriksson, C.; Persson, J. Economic Growth, Inequality, Democratization, and the Environment. Environ. Res. Econ. 2003, 25, 1–16. [Google Scholar] [CrossRef]
- Dunne, T.; Samuelson, R.L. Patterns of Firm Entry and Exit in U.S. Manufacturing Industries. RAND J. Econ. 1988, 19, 495–515. [Google Scholar] [CrossRef]
- Guo, X.; Zhang, J.; Wu, L. Urban scale, productivity advantage and resource allocation. Manag. World 2019, 35, 77–89. [Google Scholar]
- Kostka, G.; Mol, A.P.J. Implementation and Participation in China’s Local Environmental Politics: Challenges and Innovations. J. Environ. Policy Plan. 2013, 15, 3–16. [Google Scholar] [CrossRef]
- Geng, Y.; Zhu, Q.; Doberstein, B.; Fujita, T. Implementing China’s circular economy concept at the regional level: A review of progress in Dalian, China. Waste Manag. 2009, 29, 996–1002. [Google Scholar] [CrossRef] [PubMed]
- Abadie, A.; Diamond, A.; Hainmueller, J. Synthetic Control Methods for Comparative Case Studies: Estimating the Effect of California’s Tobacco Control Program. J. Am. Stat. Assoc. 2010, 105, 493–505. [Google Scholar] [CrossRef]


© 2020 by the authors. Licensee MDPI, Basel, Switzerland. This article is an open access article distributed under the terms and conditions of the Creative Commons Attribution (CC BY) license (http://creativecommons.org/licenses/by/4.0/).