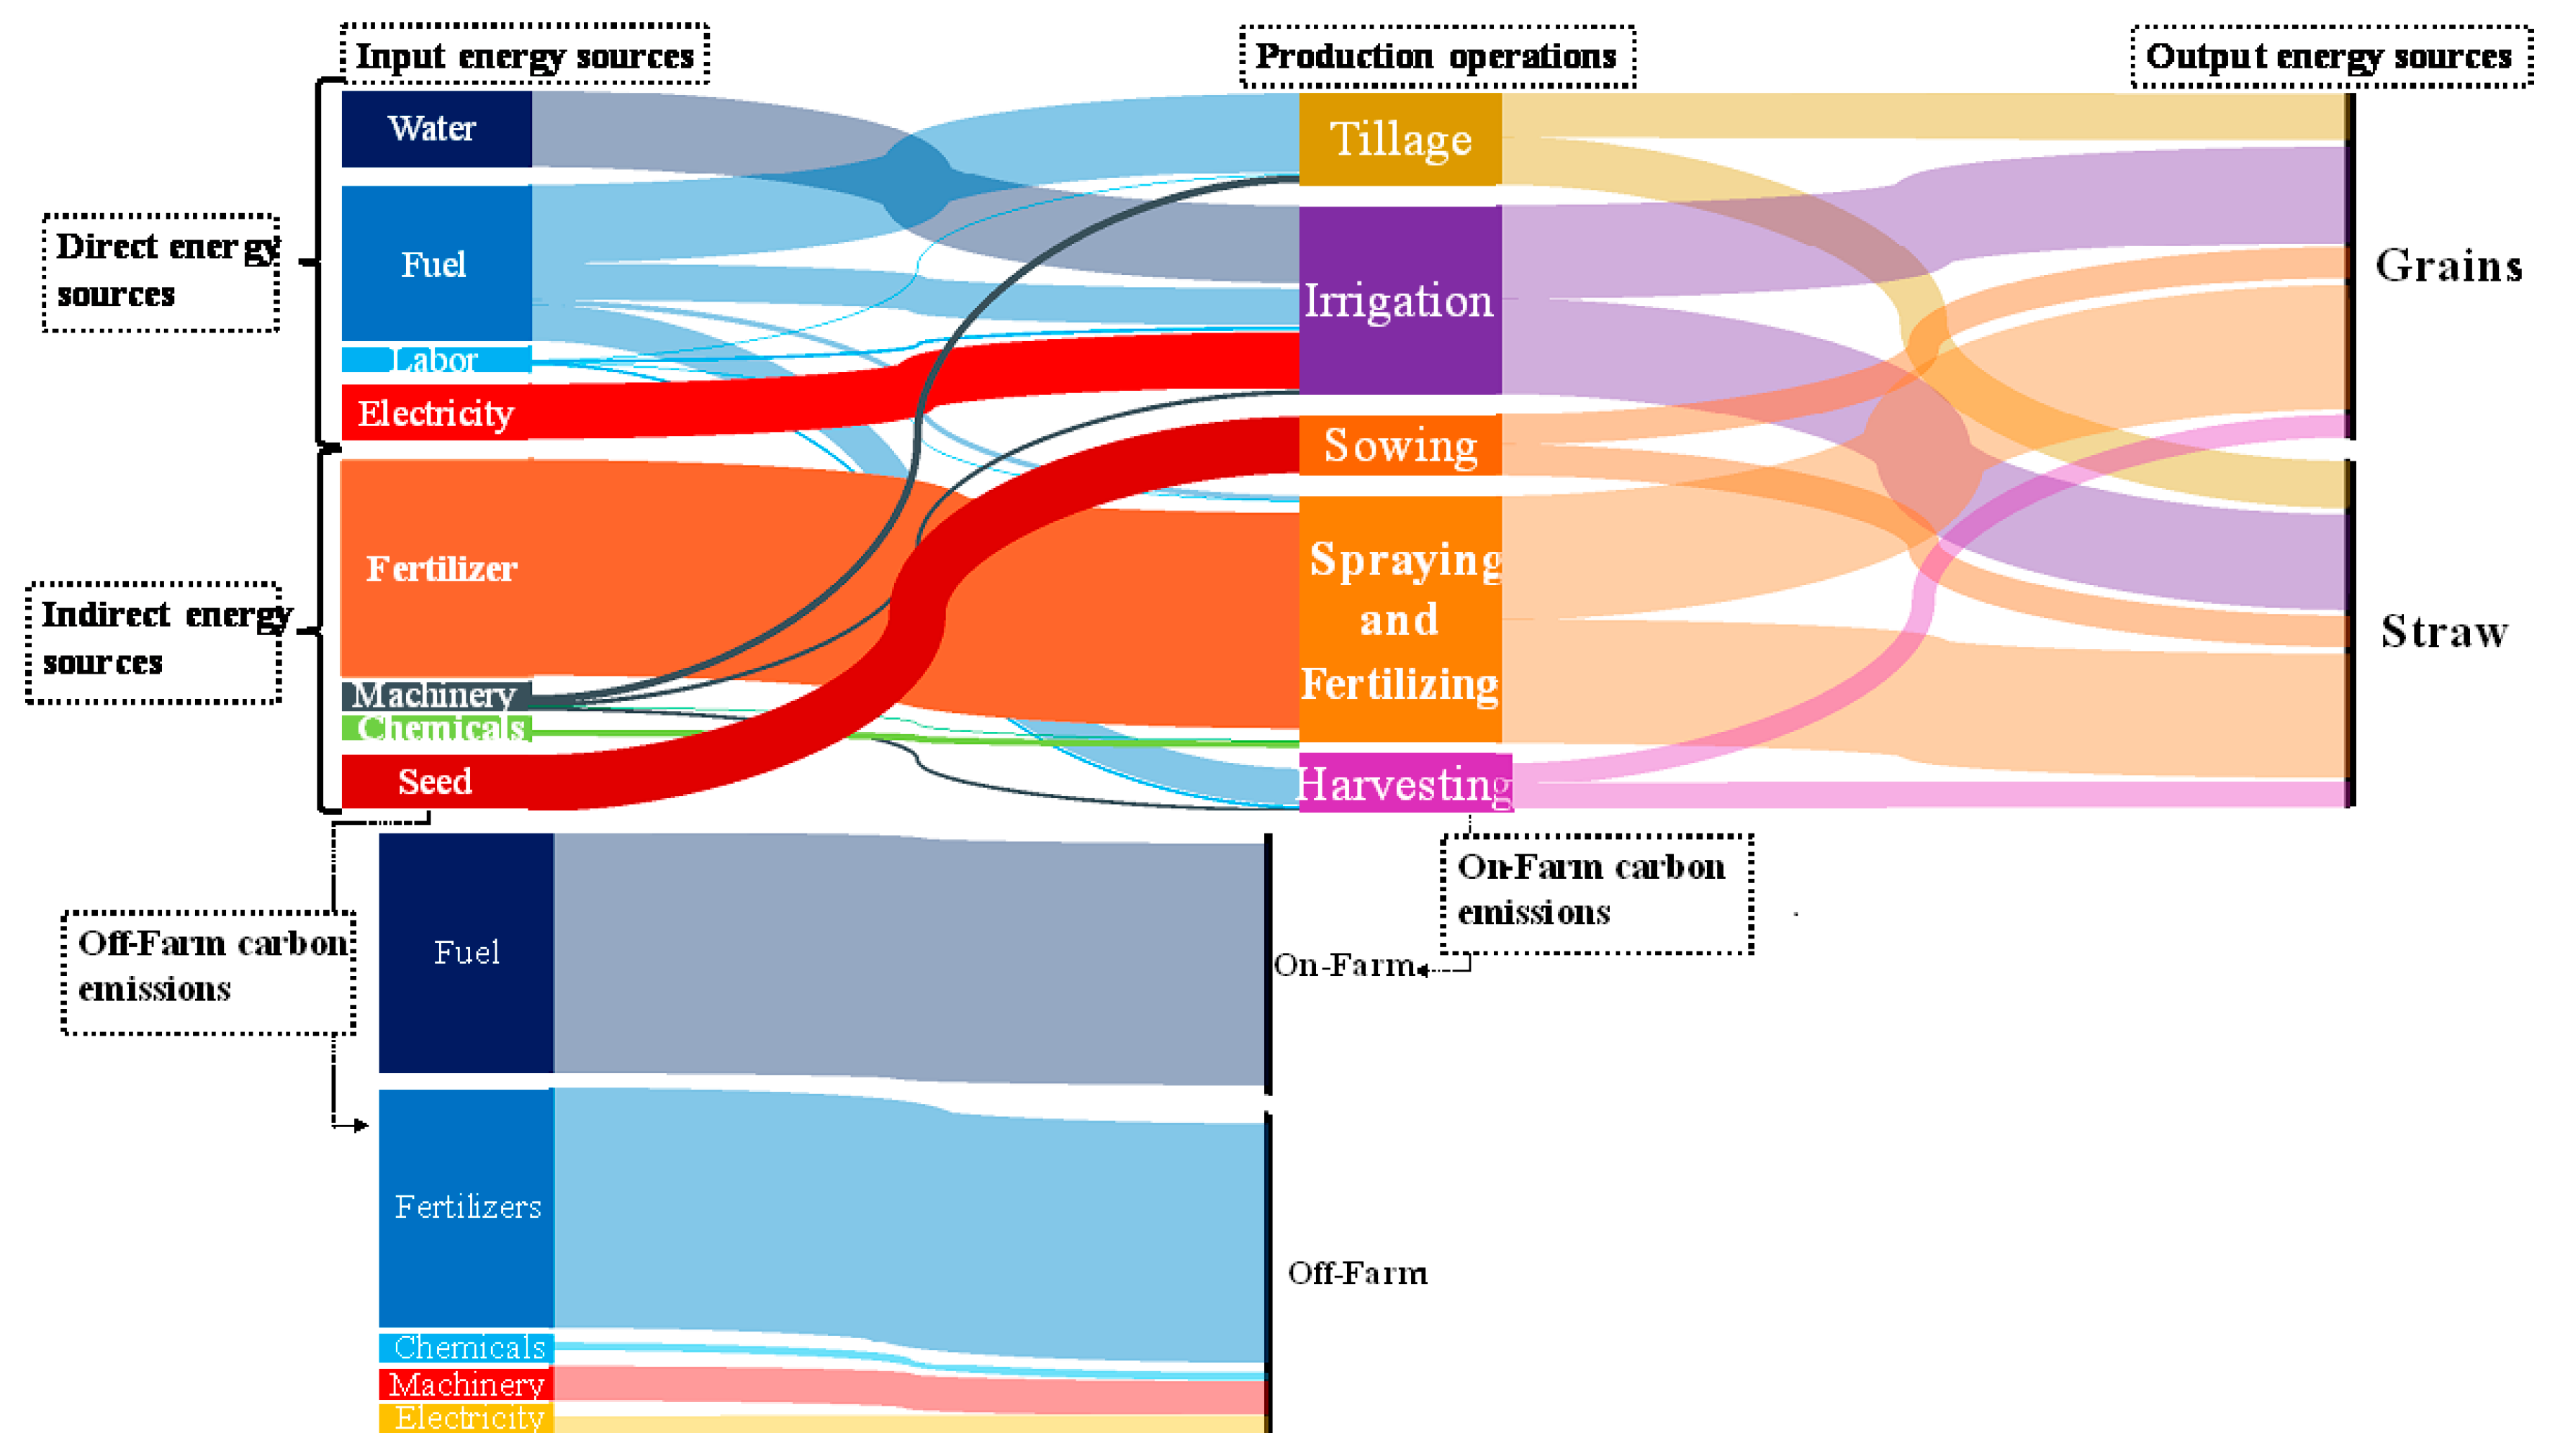
3.1. Input–Output Energy Consumption
Input energy is analyzed and discussed separately based on various energy sources (
Table 4) and production operations (
Table 5). The direct and indirect input energies consumed by all the sources in each predefined case (C-I to CV) are shown in
Figure 3. It is evident from the figure that indirect energy remains dominated in all cases except for C-Ⅳ. Fertilizer remained the top input energy source among all other sources and in all the cases. In this regard, it is ascertained that fertilizer constitutes about 31%, 40% and 39% of total input energy in C-Ⅲ, C-Ⅳ and C-Ⅴ, respectively which are higher energy consuming cases. The highest fertilizer energy input belongs to C-Ⅴ which is almost twice the fertilizer energy consumed in C-Ⅰ (the lowest energy consuming case). Therefore, fertilizer represented the highest energy input with mean value of 9.94 GJ/ha in all wheat production cases (
Figure 3), in accordance with the literature [
3,
20,
35,
45,
54,
55,
77]. Singh et al. [
3] investigated energy use pattern for wheat cultivation in India and found a similar trend in fertilizer energy use in Punjab province. The present study was also conducted in Punjab occupied by Pakistan. Therefore, there are no significant differences in the farm characteristics of these two studies. Moreover, Mani et al. [
35] studied energy consumption in wheat and maize production and found similar trends for wheat cultivations. Soltani et al. [
45], Yuan et al. [
20] and Safa et al. [
55] also found similar energy use pattern in their studies. However, Erdemir and Zeki [
58] conducted a study on organic farming and reported fuel as the highest energy input source. The contradiction in the results of present study to their study was due to difference in management practices by the farmers. Thus, input energy can be optimized by prudent fertilizer application, e.g., use of potassium fertilizer along with urea and diammonium phosphate (DAP) makes C-Ⅲ unique from others. This combination of fertilizers enhanced the energy efficiency of this case. Furthermore, the total indirect energy can be minimized by controlling single source applications (i.e., fertilizer).
Fuel is the second highest energy input source after fertilizer in all the cases except C-Ⅳ where electricity was the second highest energy input source. The higher electricity consumption in C-Ⅳ was due to higher electrical water pumping for irrigation. The highest fuel consumption belongs to C-Ⅴ comprising 31% of total input energy while the lowest corresponds to C-Ⅰ. Fuel consumption is the measure of machining practices in different production operations. Furthermore, higher fuel consumption results from extensive tillage practices and vice versa. Therefore, judicious fuel energy use is important to optimize direct energy usage in wheat production.
Water was the third highest energy input source in all the cases except C-Ⅳ. Highest water consumption was observed in C-Ⅲ and C-Ⅴ accounting for 14.7% and 12%, respectively of total input energies in these cases. On the other hand, the lowest water energy input was noted in C-Ⅰ due to lesser availability of costly tractor operated tube well for economically poor farmers in this class. Therefore, socioeconomic status of farmers also effects the farming practices for wheat cultivation. Electricity is also a major energy input for some cases like C-Ⅳ, but not very important for other cases. The reason for this difference is the use of alternatives, e.g., use of diesel engines/tractors instead of electric powered motors for water pumping. There are no significant differences among other input sources (labor, seed, herbicides and machinery) in all the cases. These sources are considered as minor energy input sources for wheat cultivation due to their lesser input values as depicted in
Figure 3. Finally, C-Ⅴ utilized the highest energy inputs in the form of fertilizers, fuel and machinery among all the cases (
Table 4) due to extensive tillage and fertilization. However, the lowest amount of energy in fuel, machinery and fertilizer sources highlights the lesser machine operations due to poor economic status of farmers in C-Ⅰ. Thus, socioeconomic characteristics of farms and farmers play an important role in energy use and energy proficiency. It is difficult for economically poor farmers (C-Ⅰ) to improve management practices for energy efficient wheat cultivation. However, another low input case C-Ⅱ has potential to improve its inputs and hence, energy efficiency by increasing energy inputs up to optimum level.
Energy from pre-described input sources is utilized in different production operations i.e., irrigation, tillage, sowing, spraying & fertilizing and harvesting & threshing. Labor, fuel and machinery are main energy sources employed in every operation. The operational energy with respect to these sources was calculated and presented in
Table 5. Irrigation is the energy consuming operation in which water is pumped and delivered to the field through a watercourse. The energy consumed in this operation is known as irrigation energy. On an average of all the cases, it was the highest energy consuming operation comprising 42.8% of average total operational energy, which is in accordance with previous literature Safa et al. [
55]. However, irrigation energy was ranked second after tillage energy in some cases i.e., C-Ⅲ and C-Ⅴ, where low energy irrigation water was available. Safa et al. [
55] investigated input and output energy flow for dry and irrigated lands. Results of the present study match with their results for irrigated lands which have similar farm properties to studied farms in the present study area. However, their results for dry lands differ due to lesser availability of irrigation water and complete dependence on rainfall in the studied area. The maximum (7.44 GJ/ha) and minimum (1.92 GJ/ha) irrigation energies were calculated in C-Ⅳ and C-Ⅰ, respectively. Irrigation was performed by different sources (i.e., canal, electric/diesel tube well) in the studied area. In this regard, the source of irrigation is a key driver to control input energy. Canal water and diesel engine operated tube wells water pumping consume less energy than electrical motors driven pumps. It is due to higher electrical energy (kWh) expenditure than diesel (liter) expenditure for pumping equal amounts of water as exhibited in
Table 4. Therefore, electricity consumption is an important energy input source in irrigation constituting 57% of average total irrigation energy among all the cases. However, fuel is more important in some cases like C-Ⅲ and C-Ⅴ, where fuel driven engines/tractors were used for water pumping. Moreover, low irrigation-energy usage (C-Ⅰ) reflects the poor economic status of farmers leading to a fewer number of irrigations.
Tillage energy is the energy consumed in soil pulverization and land preparation for wheat sowing. It was the second highest energy consuming operation when considering average of all the cases. However, tillage is the top energy consuming operation in much of the cases as described earlier. It constitutes an average of 37% of mean total operational energy in all the cases. The maximum and minimum tillage energy consumption were 6.76 GJ/ha and 2.55 GJ/ha in C-Ⅴ and C-Ⅰ/C-Ⅱ, respectively. Higher tillage energy consumption represented the higher availability of farm implements in C-Ⅴ. Fuel energy is crucial in tillage operation comprising an average of 91.5% of mean total energy consumed in this operation.
Harvesting and threshing is carried out by combine harvester in C-Ⅲ and C-Ⅴ. A tractor mounted/operated reaper and thresher is used by C-Ⅳ and C-Ⅱ. However, harvesting is done by hand-held sickle in C-Ⅰ, while threshing was conducted with same machinery as of C-Ⅳ and C-Ⅱ. The maximum harvesting and threshing energy was 2.48 GJ/ha in C-Ⅳ and C-Ⅱ, while the minimum was 1.08 GJ/ha in C-Ⅲ and C-Ⅴ. The average harvesting and threshing energy expenditure represent 18.42% (1.86 GJ/ha) of the total operational energy. Fertilizing and spraying of the crop were performed by broadcasting (manual) and sprayer, respectively. Pesticides are sprayed by boom and knapsack sprayers in C-Ⅲ, C-Ⅳ, C-Ⅴ and C-Ⅰ, C-Ⅱ, respectively. The higher pesticides application in C-Ⅱ results in consumption of 6.4% (0.64 GJ/ha) of total operational energy. The average fertilizing and spraying energy were about 0.25 GJ/ha (i.e., 2.5% of total energy consumption). On the other hand, broadcasting was used for sowing in all cases. Thus, lowest labor energy (
Table 5) is used in sowing among all the operations and cases (C-I to CV)—amounting to 0.012% of the total energy consumption. Finally, the total average operational energy is determined as 10.19 GJ/ha in consistence with results of [
55]. Overall, ANOVA test in the last row of
Table 5, shows that operational energy in C-Ⅰ and C-Ⅱ was the lowest among all cases. Furthermore, the highest operational energy is observed for C-Ⅳ and C-Ⅴ.
The total energy use by input and output sources is illustrated in
Figure 4. The input energy use in C-I. C-II, C-III, C-IV and C-V was 20.18 GJ/ha, 23.8 GJ/ha, 28.25 GJ/ha, 28.53 GJ/ha and 34.54 GJ/ha, respectively. The corresponding output energy use in all cases was 83.58 GJ/ha, 97.52 GJ/ha, 117.02 GJ/ha, 111.45 GJ/ha and 125.38 GJ/ha, respectively. The highest input energy is consumed in C-Ⅴ which leads to highest output energy as shown in
Figure 4. However, lowest input and output energy is found in C-Ⅰ due to poor management practices. Thus, average input and output energy consumed in wheat production is determined as 27.06 GJ/ha and 108.1 GJ/ha, respectively. These energy consumptions are found in agreement with results from references [
45,
55]. Soltani et al. [
45] conducted their study in a similar way by developing six different classes of farms on the basis of energy use pattern and found similar results.
The
is considered one of best indicators for efficient energy usage [
20]. The highest energy use efficiency was found in C-Ⅲ while the lowest corresponds to C-Ⅴ as shown in
Figure 4. The figure shows a trend in energy use efficiency with respect to energy inputs. Energy use efficiency increases with the increase in input energy up to a moderate energy input (C-Ⅲ) and then decreases with further increases in energy input (C-Ⅳ & C-Ⅴ). It necessitates the use of optimum energy input to ensure highest energy use efficiency. Energy productivity and net energy (
) for each case are shown in
Figure 5. The figure shows the highest energy productivity and net energy in C-Ⅲ while the lowest energy productivity in C-Ⅴ and net energy in C-Ⅰ. The lower energy input cases (C-Ⅰ and C-Ⅱ) have comparatively good energy proficiency as compared to higher energy input cases (C-Ⅳ and C-Ⅴ). Thus, C-Ⅲ is an optimum case because of higher energy indices such as
= 4.4,
= 153.94 kg/GJ and
= 91.13 GJ/ha when compared to the other cases (
Figure 4 and
Figure 5). Therefore, the agricultural practices performed in C-Ⅲ are recommended for efficient cultivation of wheat in the studied area. An equation (Equation (5)) was developed, based on all cases (C-I to C-V), using multiple regression to predict grain yield. Now, only the data of three input sources (i.e., machinery, water and fertilizers) was used to predict yield rather than all other inputs as presented in
Table 4 and
Table 5. The negative sign with machinery (Equation (5)) shows a decrease in yield with increase in machine operations. The reason behind such inverse relationship may be the effect of tillage on water retention capacity in the root zone. Higher tillage practices (which reflects higher machining operations) decrease the water retention time in the root zone and hence, there will be lesser water availability for the crop. This water shortage in the root zone leads to decreased crop yield. Thus, higher machine operations have adverse effects on grain yield as depicted in Equation (5). The actual and predicted grains yield is compared as shown in
Figure 6. The yield was predicted well in C-Ⅰ, C-Ⅳ and C-Ⅴ but is overestimated in C-Ⅱ and C-Ⅲ. The reason behind such over estimation (C-II & C-Ⅲ) may be the higher difference between water and machinery energy inputs than in the other cases. The coefficient of determination between actual and predicted yields was acceptable, i.e., 0.92 (
Figure 6). Therefore, grain yield in the study area can be predicted (Equation (5)) before cultivation by assuming three input sources (water, fertilizer, machinery). This equation may be helpful for farmers to optimize inputs for energy efficient cultivation of wheat in the study area.
Data envelopment analysis (DEA) was also conducted in this study and the results revealed that moderate energy input and slightly higher input cases i.e., C-Ⅲ and C-Ⅳ were technically efficient while low and high energy input cases i.e., C-Ⅰ, C-Ⅱ and C-Ⅲ were technically inefficient as shown in
Figure 7. The 100% technical efficiency of C-Ⅳ and C-Ⅴ shows that these cases lie on the frontier line and are the best production cases in converting their input sources (i.e., fertilizer, water and fuel) into output sources (i.e., yield). On the other hand, technically inefficient cases (i.e., C-Ⅰ, C-Ⅱ and C-Ⅴ) lie in the envelopment region developed by the frontier line and their inputs can be optimized to get the same level of outputs. The optimization of energy input sources in these cases is shown in
Figure 7. The figure shows highest improvement potential in the high energy input case i.e., C-Ⅴ with 25.2%, 41.6% and 8.6% reduction in fertilizer, fuel and water, respectively. There is also considerable amount of reduction potential in the two other inefficient cases to achieve the same level of output. Thus, such improvements in inputs can make these cases more efficient and should be adopted by the farmers in the study area. Furthermore, actual energy inputs and output (i.e., yield) for all the five cases was also compared by DEA and exhibited in
Figure 8. Figure shows comparative energy use behavior of each farm class. Higher values of inputs and outputs tend to move the curve towards the origin while lower values away from the origin. The high energy inputs and output case, i.e., C-Ⅴ lies exactly in origin while other cases show the comparative behavior of energy use with respect to this case. In this figure, an important point to note is the energy use and output producing behavior on C-Ⅱ and Ⅳ. Both cases consumed the same amount of water and fertilizer energies while C-Ⅳ produced higher yield than C-Ⅱ. The reason behind this is the higher electrical energy input in C-Ⅳ that increased the total input energy and hence, enhanced outputs. Moreover, other reason may be the higher available nutrient contents in the soils of C-Ⅳ than C-Ⅱ before application of fertilizers. Thus, it is important to measure the available soil NPK before fertilizing the field in wheat cultivation. This highlights the potential value of precision agriculture for efficient cultivation of wheat crop in the study area.
3.2. CO2 Emissions
In this study, CO
2 emissions (kg-CO
2/ha) from the production sources including fertilizers, pesticides, electricity, fuel, and machinery was calculated using CO
2 equivalents (
Table 3). The total average CO
2 emissions from the studied production sources was determined as 1120 kg-CO
2/ha and 283.7 kg-CO
2/ton, which was consistent with the results of Safa et al. [
1]. The highest share of CO
2 emissions comes from fertilizer and fuel energy in all cases as shown in
Figure 9. On an average of all the cases, fertilizer and fuel comprises 44.7% and 45% of total CO
2 emissions, respectively. Safa et al. [
1] in a study with irrigated and rainfed wheat found fertilizer and fuel as the top contributor to carbon emissions. However, their study revealed fuel as the second highest contributor after fertilizer while fuel was the highest contributor in the present study, though the difference among both studies is not significant. Moreover, Soltani et al. [
45] and Moghimi et al. [
41] found a similar pattern for carbon emissions in wheat production. It necessitates the judicious use of these sources to minimize the CO
2 emissions. Other energy input sources (i.e., machinery, chemicals and electricity) are minor contributors to carbon emissions. The highest CO
2 emissions were found in the higher energy input case, i.e., C-Ⅴ as 1548 kg-CO
2/ha while lowest emissions were calculated as 798.6 kg-CO
2/ha in the low energy input case, i.e., C-Ⅰ. The data thus shows a relationship between energy use and CO
2 emissions. Both CO
2 emissions and grain yield increased by increasing the input energy as evident from
Figure 10 for C-Ⅰ, C-Ⅱ and C-V. In contrast, C-Ⅳ consumed higher input energy than C-Ⅲ but produced lower grain yield and CO
2 emissions. The greater energy input in relation to yield observed in C-Ⅳ occurred because electric water pumps in C-Ⅳ consume higher input energy, but emit less CO
2 than the gasoline operated pumps and/or canal used water in C-Ⅲ. It is important to mention that higher grain yield does not guarantee a higher energy use efficiency due to corresponding input energy (
Figure 4). However, it may result in greater emissions of greenhouse gases particularly CO
2 as depicted in C-Ⅴ.

 ,
, 


