An Assessment of Tourism Climate Comfort in the China–Pakistan Economic Corridor

 , and
, and
Abstract
:1. Introduction
2. Materials and Methods
2.1. Study Area
2.2. Data
2.3. Methods
3. Results
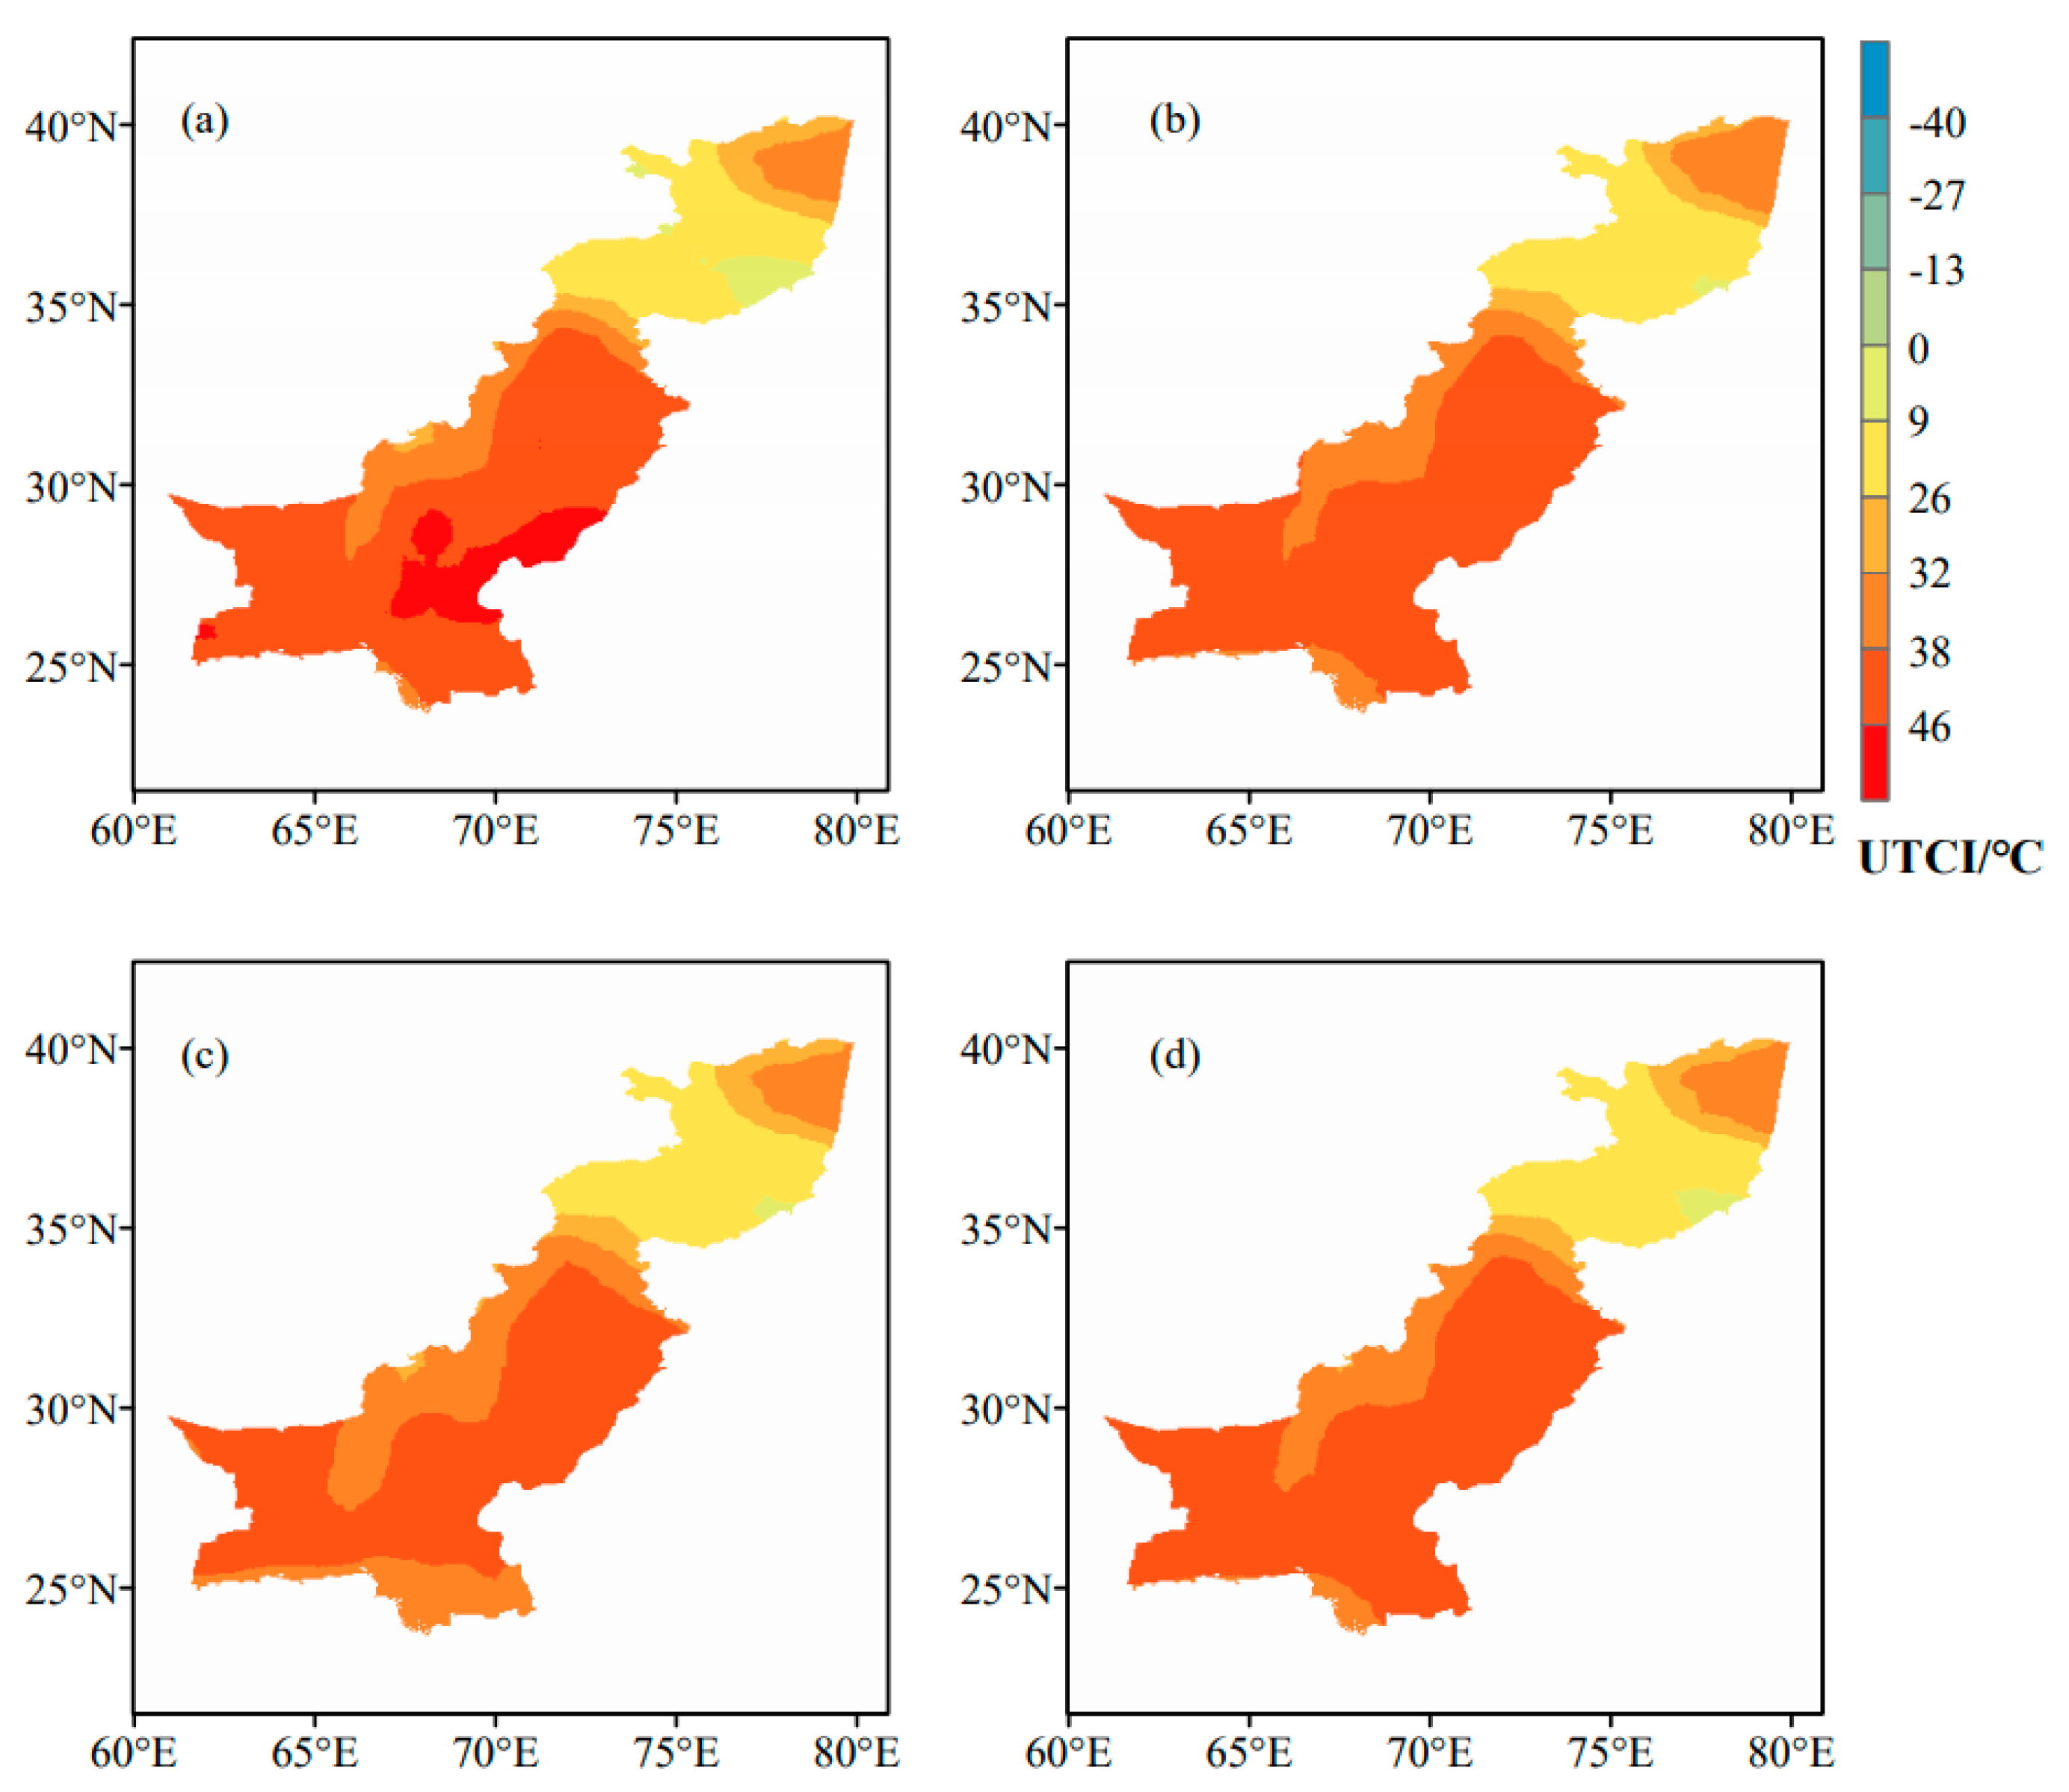
3.1. General Distribution Characteristics of UTCI in Summer
3.2. General Distribution Characteristics of UTCI in Winter
3.3. Differences in the Distribution of Summer Comfortable Climate and Winter Comfortable Climate
3.3.1. Distribution Characteristic of Different Types of Climate
3.3.2. Area Comparison of Different Thermal Stress Levels in Summer and Winter
4. Discussion
5. Conclusions
- (1)
- The comfortable summer climate is affected by middle–high latitudes or high altitudes. The comfortable summer climate regions of the CPEC were mainly distributed in Khyber Pakhtunkhwa in Pakistan and some regions of Xinjiang in China and also sporadically distributed in high-altitude mountains, such as the western plateau area. The comfortable winter climate regions were mainly distributed in vast areas, except for Karakoram and nearby areas. Compared with other countries and regions, altitude has the most significant impact on the distribution of a pleasant climate.
- (2)
- The climate has spatial heterogeneity, and the two types of pleasant climates show obvious regional separation characteristics. There are few regions with dual attributes of comfortable summer and winter climates in CPEC.
- (3)
- According to the calculation and comparison of the regional area of different climate comfort levels in summer and winter, it is found that the comfortable summer climate is scarcer in CPEC and is a monopoly resource, whereas the comfortable winter climate is widely distributed, meaning that it is a ubiquitous resource.
Author Contributions
Funding
Conflicts of Interest
References
- Gómez Martín, M.B. Weather, climate and tourism a geographical perspective. Ann. Tour. Res. 2015, 32, 571–591. [Google Scholar] [CrossRef]
- United Nations World Tourism Organization (UNWTO); United Nations Environmental Programme (UNEP); World Meteorological Organization (WMO). Climate Change and Tourism: Responding to Global Challenges; UNWTO: Madrid, Spain; UNEP: Paris, France; WMO: Geneva, Switzerland, 2008. [Google Scholar]
- Freitas, C.R.D. Tourism climatology: Evaluating environmental information for decision making and business planning in the recreation and tourism sector. Int. J. Biometeorol. 2003, 48, 45–54. [Google Scholar] [CrossRef]
- De Freitas, C.R.; Grigorieva, E.A. A comparison and appraisal of a comprehensive range of human thermal climate indices. Int. J. Biometeorol. 2017, 61, 487–512. [Google Scholar] [CrossRef]
- Potchter, O.; Cohen, P.; Lin, T.-P.; Andreas, M. Outdoor human thermal perception in various climates: A comprehensive review of approaches, methods and quantification. Sci. Total. Environ. 2018, 631–632, 390–406. [Google Scholar] [CrossRef]
- Morgan, R.; Gatell, E.; Junyent, R.; Micallef, A.; Ozhan, E.; Williams, A.T. An improved user-based beach climate index. J. Coast. Conserv. 2000, 6, 41–50. [Google Scholar] [CrossRef] [Green Version]
- Hamilton, J.; Lau, M. The role of climate information in tourist destination choice decision-making. In Tourism, Recreation and Climate Change; Gossling, S., Hall, C.M., Eds.; Routledge: London, UK, 2005; pp. 229–250. [Google Scholar]
- Lise, W.; Tol, R.S.J. Impact of climate on tourism demand. Clim. Chang. 2002, 55, 429–449. [Google Scholar] [CrossRef]
- De Freitas, C.R.; Scott, D.; McBoyle, G. A second generation climate index for tourism (CIT): Specification and verification. Int. J. Biometeorol. 2008, 52, 399–407. [Google Scholar] [CrossRef]
- Lin, T.P.; Matzarakis, A. Tourism climate and thermal comfort in sunmoon Lake, Taiwan. Int. J. Biometeorol. 2008, 51, 281–290. [Google Scholar] [CrossRef]
- Zaninović, K.; Matzarakis, A. The bioclimatological leaflet as a means conveying climatological information to tourists and the tourism industry. Int. J. Biometeorol. 2009, 53, 369–374. [Google Scholar] [CrossRef]
- Mieczkowski, Z. The tourism climatic index: A method for evaluating world climates for tourism. Can. Geogr. 1985, 29, 220–233. [Google Scholar] [CrossRef]
- Matzarakis, A. Weather-and climate-related information for tourism. Tour. Hosp. Plan. Dev. 2006, 3, 99–115. [Google Scholar] [CrossRef]
- Błażejczyk, K.; Epstein, Y.; Jendritzky, G.; Staiger, H.; Tinz, B. Comparison of UTCI to selected thermal indices. Int. J. Biometeorol. 2012, 56, 515–535. [Google Scholar] [CrossRef] [Green Version]
- Roshan, G.; Yousefi, R.; Błażejczyk, K. Assessment of the climatic potential for tourism in Iran through biometeorology clustering. Int. J. Biometeorol. 2018, 62, 525–542. [Google Scholar] [CrossRef] [PubMed]
- Jendritzky, G.; de Dear, R.; Havenith, G. UTCI-why another thermal index? Int. J. Biometeorol. 2012, 56, 421–428. [Google Scholar] [CrossRef] [Green Version]
- Fang, Y.; Yin, J. National assessment of climate resources for tourism seasonality in china using the tourism climate index. Atmosphere 2015, 6, 183–194. [Google Scholar] [CrossRef] [Green Version]
- Kovács, A.; Németh, Á.; Unger, J.; Kántor, N. Tourism climatic conditions of Hungary—Present situation and assessment of future changes. Idojaras 2017, 121, 79–99. [Google Scholar]
- Sahabi Abed, S.; Matzarakis, A. Quantification of the tourism climate of Algeria based on the climate-tourism-information-scheme. Atmosphere 2018, 9, 250. [Google Scholar] [CrossRef] [Green Version]
- Brosy, C.; Zaninovic, K.; Matzarakis, A. Quantification of climate tourism potential of Croatia based on measured data and regional modeling. Int. J. Biometeorol. 2014, 58, 1369–1381. [Google Scholar] [CrossRef]
- Roshan, G.R.; Saleh Almomenin, H.; Queiroz, D.S.H.S.; Attia, S. Estimate of outdoor thermal comfort zones for different climatic regions of Iran. Urban Clim. 2019, 27, 8–23. [Google Scholar] [CrossRef]
- Jacobs, C.; Singh, T.; Gorti, G.; Iftikhar, U.; Saeed, S.; Syed, A.; Abbas, F.; Ahmad, B.; Bhadwal, S.; Siderius, C. Patterns of outdoor exposure to heat in three South Asian cities. Sci. Total Environ. 2019, 674, 264–278. [Google Scholar] [CrossRef]
- Mahar, W.A.; Verbeeck, G.; Singh, M.K.; Attia, S. An investigation of thermal comfort of houses in dry and semi-arid climates of quetta, pakistan. Sustainability 2019, 11, 5203. [Google Scholar] [CrossRef] [Green Version]
- Zeng, D.; Wu, J.; Mu, Y.; Deng, M.; Wei, Y.; Sun, W. Spatial-temporal pattern changes of UTCI in the China-Pakistan economic corridor in recent 40 years. Atmosphere 2020, 11, 858. [Google Scholar] [CrossRef]
- Nicol, J.F.; Raja, I.A.; Allaudin, A.; Jamy, G.N. Climatic variations in comfortable temperatures: The Pakistan projects. Energy Build. 1999, 30, 261–279. [Google Scholar] [CrossRef]
- Dee, D.P.; Uppala, S.M.; Simmons, A.J.; Berrisford, P.; Poli, P.; Kobayashi, S.; Andrae, U.; Balmaseda, M.A.; Balsamo, G.; Bauer, P.; et al. The era-interim reanalysis: Configuration and performance of the data assimilation system. Q. J. R. Meteorol. Soc. 2011, 137, 553–597. [Google Scholar] [CrossRef]
- Jendritzky, G.; Havenith, G.; Weihs, P.; Batchvarova, E.; De Dear, R.J. The universal thermal climate index UTCI goal and state of COSTaction 730. In Environmental Ergonomics XII; Mekjavic, I.B., Kounalakis, S.N., Taylor, N.A.S., Eds.; Biomed: Ljubljana, Slovenia, 2007; pp. 509–512. [Google Scholar]
- Brode, P.; Fiala, D.; Blazejczyk, K.; Holmer, I.; Jendritzky, G.; Kampmann, B.; Tinz, B.; Havenith, G. Deriving the operational procedure for the Universal Thermal Climate Index (UTCI). Int. J. Biometeorol. 2012, 56, 481–494. [Google Scholar] [CrossRef] [Green Version]
- Ge, Q.; Kong, Q.; Xi, J.; Zheng, J. Application of UTCI in China from tourism perspective. Theor. Appl. Climatol. 2016, 128, 551–561. [Google Scholar] [CrossRef]
- Blazejczyk, K. Assessment of recreational potential of bioclimate based on the human heat balance. In Proceedings of the 1st International Workshop on Climate, Tourism and Recreation, International Society of Biometeorology Commission on Climate Tourism and Recreation, Neos Marmaras, Halkidiki, Greece, 5–10 October 2001; Matzarakis, A., de Freitas, C.R., Eds.; 2001; pp. 133–152. [Google Scholar]
- Blazejczyk, K. Multiannual and seasonal weather fluctuations and tourism in Poland. In Climate Change and Tourism-Assessment and Copying Strategies. Institute of Geography and Spatial Organization. Polish Academy of Sciences; Amelung, B., Blazejczyk, K., Matzarakis, A., Eds.; Maastricht-Warsaw-Freiburg: Maastricht, The Netherlands, 2007; pp. 69–90. [Google Scholar]
- Blazejczyk, K.; Matzarakis, A. Assessment of bioclimatic differentiation of Poland based on the human heat balance. Geogr. Pol. 2007, 80, 63–82. [Google Scholar]
- Matzarakis, A.; Rutz, F.; Mayer, H. Modelling radiation fluxes in simple and complex environments: Basics of the RayMan model. Int. J. Biometeorol. 2010, 54, 131–139. [Google Scholar] [CrossRef] [Green Version]
- Douglas, V.H. Percent of possible sunshine and the total cloud cover. Mon. Weather Rev. 1977, 105, 648–652. [Google Scholar]
- Błażejczyk, K. BioKlima—Universal Tool for Bioclimatic and Thermophysiological Studies. Available online: https://www.igipz.pan.pl/Bioklima-zgik.html (accessed on 15 April 2020).
- Mihaila, D.; Bistricean, P.I.; Briciu, A.E. Assessment of the climate potential for tourism. Case study: The North-East Development Region of Romania. Theor. Appl. Climatol. 2019, 137, 601–622. [Google Scholar] [CrossRef]
- Xu, M.; Hong, B.; Mi, J.; Yan, S. Outdoor thermal comfort in an urban park during winter in cold regions of China. Sustain. Cities Soc. 2018, 43, 208–220. [Google Scholar] [CrossRef]
- Kong, Q.; Zheng, J.; Fowler, H.J.; Ge, Q.; Xi, J. Climate change and summer thermal comfort in China. Theor. Appl. Climatol. 2019, 137, 1077–1088. [Google Scholar] [CrossRef] [Green Version]
- Wu, F.; Yang, X.; Shen, Z. Regional and seasonal variations of outdoor thermal comfort in China from 1966 to 2016. Sci. Total Environ. 2019, 665, 1003–1016. [Google Scholar] [CrossRef]
- Weihs, P.; Staiger, H.; Tinz, B.; Batchvarova, E.; Rieder, H.; Vuilleumier, L.; Maturilli, M.; Jendritzky, G. The uncertainty of UTCI due to uncertainties in the determination of radiation fluxes derived from measured and observed meteorological data. Int. J. Biometeorol. 2012, 56, 537–555. [Google Scholar] [CrossRef]


| UTCI (°C) | Stress Category | Thermal Perception |
|---|---|---|
| >46 | Extreme heat stress | Torrid |
| 38–46 | Very strong heat stress | Hottish |
| 32–38 | Strong heat stress | Hot |
| 26–32 | Moderate heat stress | Warm |
| 9–26 | No thermal stress | Comfortable |
| 0–9 | Slight cold stress | Cool |
| −13–0 | Moderate cold stress | Coolish |
| −27–−13 | Strong cold stress | Cold |
| −40–−27 | Very strong cold stress | Chilly |
| <−40 | Extreme cold stress | Freezing |
| Grid Type | Grid Number | Proportion (%) | Main Distribution Provinces |
|---|---|---|---|
| Summer | 320 | 19.99 | Xinjiang, Khyber Pakhtunkhwa |
| Winter | 1175 | 73.39 | All |
| Summer and Winter | 75 | 4.68 | Xinjiang, Khyber Pakhtunkhwa |
| Unsuitable | 31 | 1.94 | Xinjiang |
| Extreme Cold Stress | Very Strong Cold Stress | Strong Cold Stress | Moderate Cold Stress | Slight Cold Stress | ||||||
| Area | Percentage | Area | Percentage | Area | Percentage | Area | Percentage | Area | Percentage | |
| June | 0 | 0 | 0 | 0 | 0 | 0 | 0 | 0 | 32.18 | 3.06 |
| July | 0 | 0 | 0 | 0 | 0 | 0 | 0 | 0 | 3.94 | 0.37 |
| August | 0 | 0 | 0 | 0 | 0 | 0 | 0 | 0 | 3.94 | 0.37 |
| Summer | 0 | 0 | 0 | 0 | 0 | 0 | 0 | 0 | 13.13 | 1.25 |
| December | 0 | 0 | 1.31 | 0.12 | 89.31 | 8.49 | 139.21 | 13.24 | 90.62 | 8.62 |
| January | 0 | 0 | 7.88 | 0.75 | 102.44 | 9.74 | 174.68 | 16.61 | 61.07 | 5.81 |
| February | 0 | 0 | 5.25 | 0.50 | 77.49 | 7.37 | 102.44 | 9.74 | 143.81 | 13.68 |
| Winter | 0 | 0 | 5.25 | 0.50 | 87.34 | 8.31 | 137.90 | 13.12 | 101.13 | 9.62 |
| No Thermal Stress | Moderate Heat Stress | Strong Heat Stress | Very Strong Heat Stress | Extreme Heat Stress | ||||||
| Area | Percentage | Area | Percentage | Area | Percentage | Area | Percentage | Area | Percentage | |
| June | 179.93 | 17.11 | 59.10 | 5.62 | 149.07 | 14.18 | 533.88 | 50.78 | 97.19 | 9.24 |
| July | 195.69 | 18.61 | 47.28 | 4.50 | 202.26 | 19.24 | 602.17 | 57.28 | 0 | 0 |
| August | 203.57 | 19.36 | 61.07 | 5.81 | 286.97 | 27.30 | 495.79 | 47.16 | 0 | 0 |
| Summer | 191.75 | 18.24 | 54.50 | 5.18 | 195.03 | 18.55 | 596.92 | 56.78 | 0 | 0 |
| December | 730.22 | 69.46 | 0.66 | 0.06 | 0 | 0 | 0 | 0 | 0 | 0 |
| January | 705.27 | 67.08 | 0.00 | 0 | 0 | 0 | 0 | 0 | 0 | 0 |
| February | 671.12 | 63.84 | 51.22 | 4.87 | 0 | 0 | 0 | 0 | 0 | 0 |
| Winter | 719.72 | 68.46 | 0.00 | 0 | 0 | 0 | 0 | 0 | 0 | 0 |
© 2020 by the authors. Licensee MDPI, Basel, Switzerland. This article is an open access article distributed under the terms and conditions of the Creative Commons Attribution (CC BY) license (http://creativecommons.org/licenses/by/4.0/).
Share and Cite
Zeng, D.; Wu, J.; Mu, Y.; Li, H.; Deng, M.; Wei, Y.; Sun, W. An Assessment of Tourism Climate Comfort in the China–Pakistan Economic Corridor. Sustainability 2020, 12, 6981. https://doi.org/10.3390/su12176981
Zeng D, Wu J, Mu Y, Li H, Deng M, Wei Y, Sun W. An Assessment of Tourism Climate Comfort in the China–Pakistan Economic Corridor. Sustainability. 2020; 12(17):6981. https://doi.org/10.3390/su12176981
Chicago/Turabian StyleZeng, Di, Jinkui Wu, Yaqiong Mu, Hongyuan Li, Mingshan Deng, Yanqiang Wei, and Weibing Sun. 2020. "An Assessment of Tourism Climate Comfort in the China–Pakistan Economic Corridor" Sustainability 12, no. 17: 6981. https://doi.org/10.3390/su12176981