A GIS-Based Approach to Inform Agriculture-Water-Energy Nexus Planning in the North Western Sahara Aquifer System (NWSAS)

 ,
,  , ,
, ,
Abstract
:1. Introduction
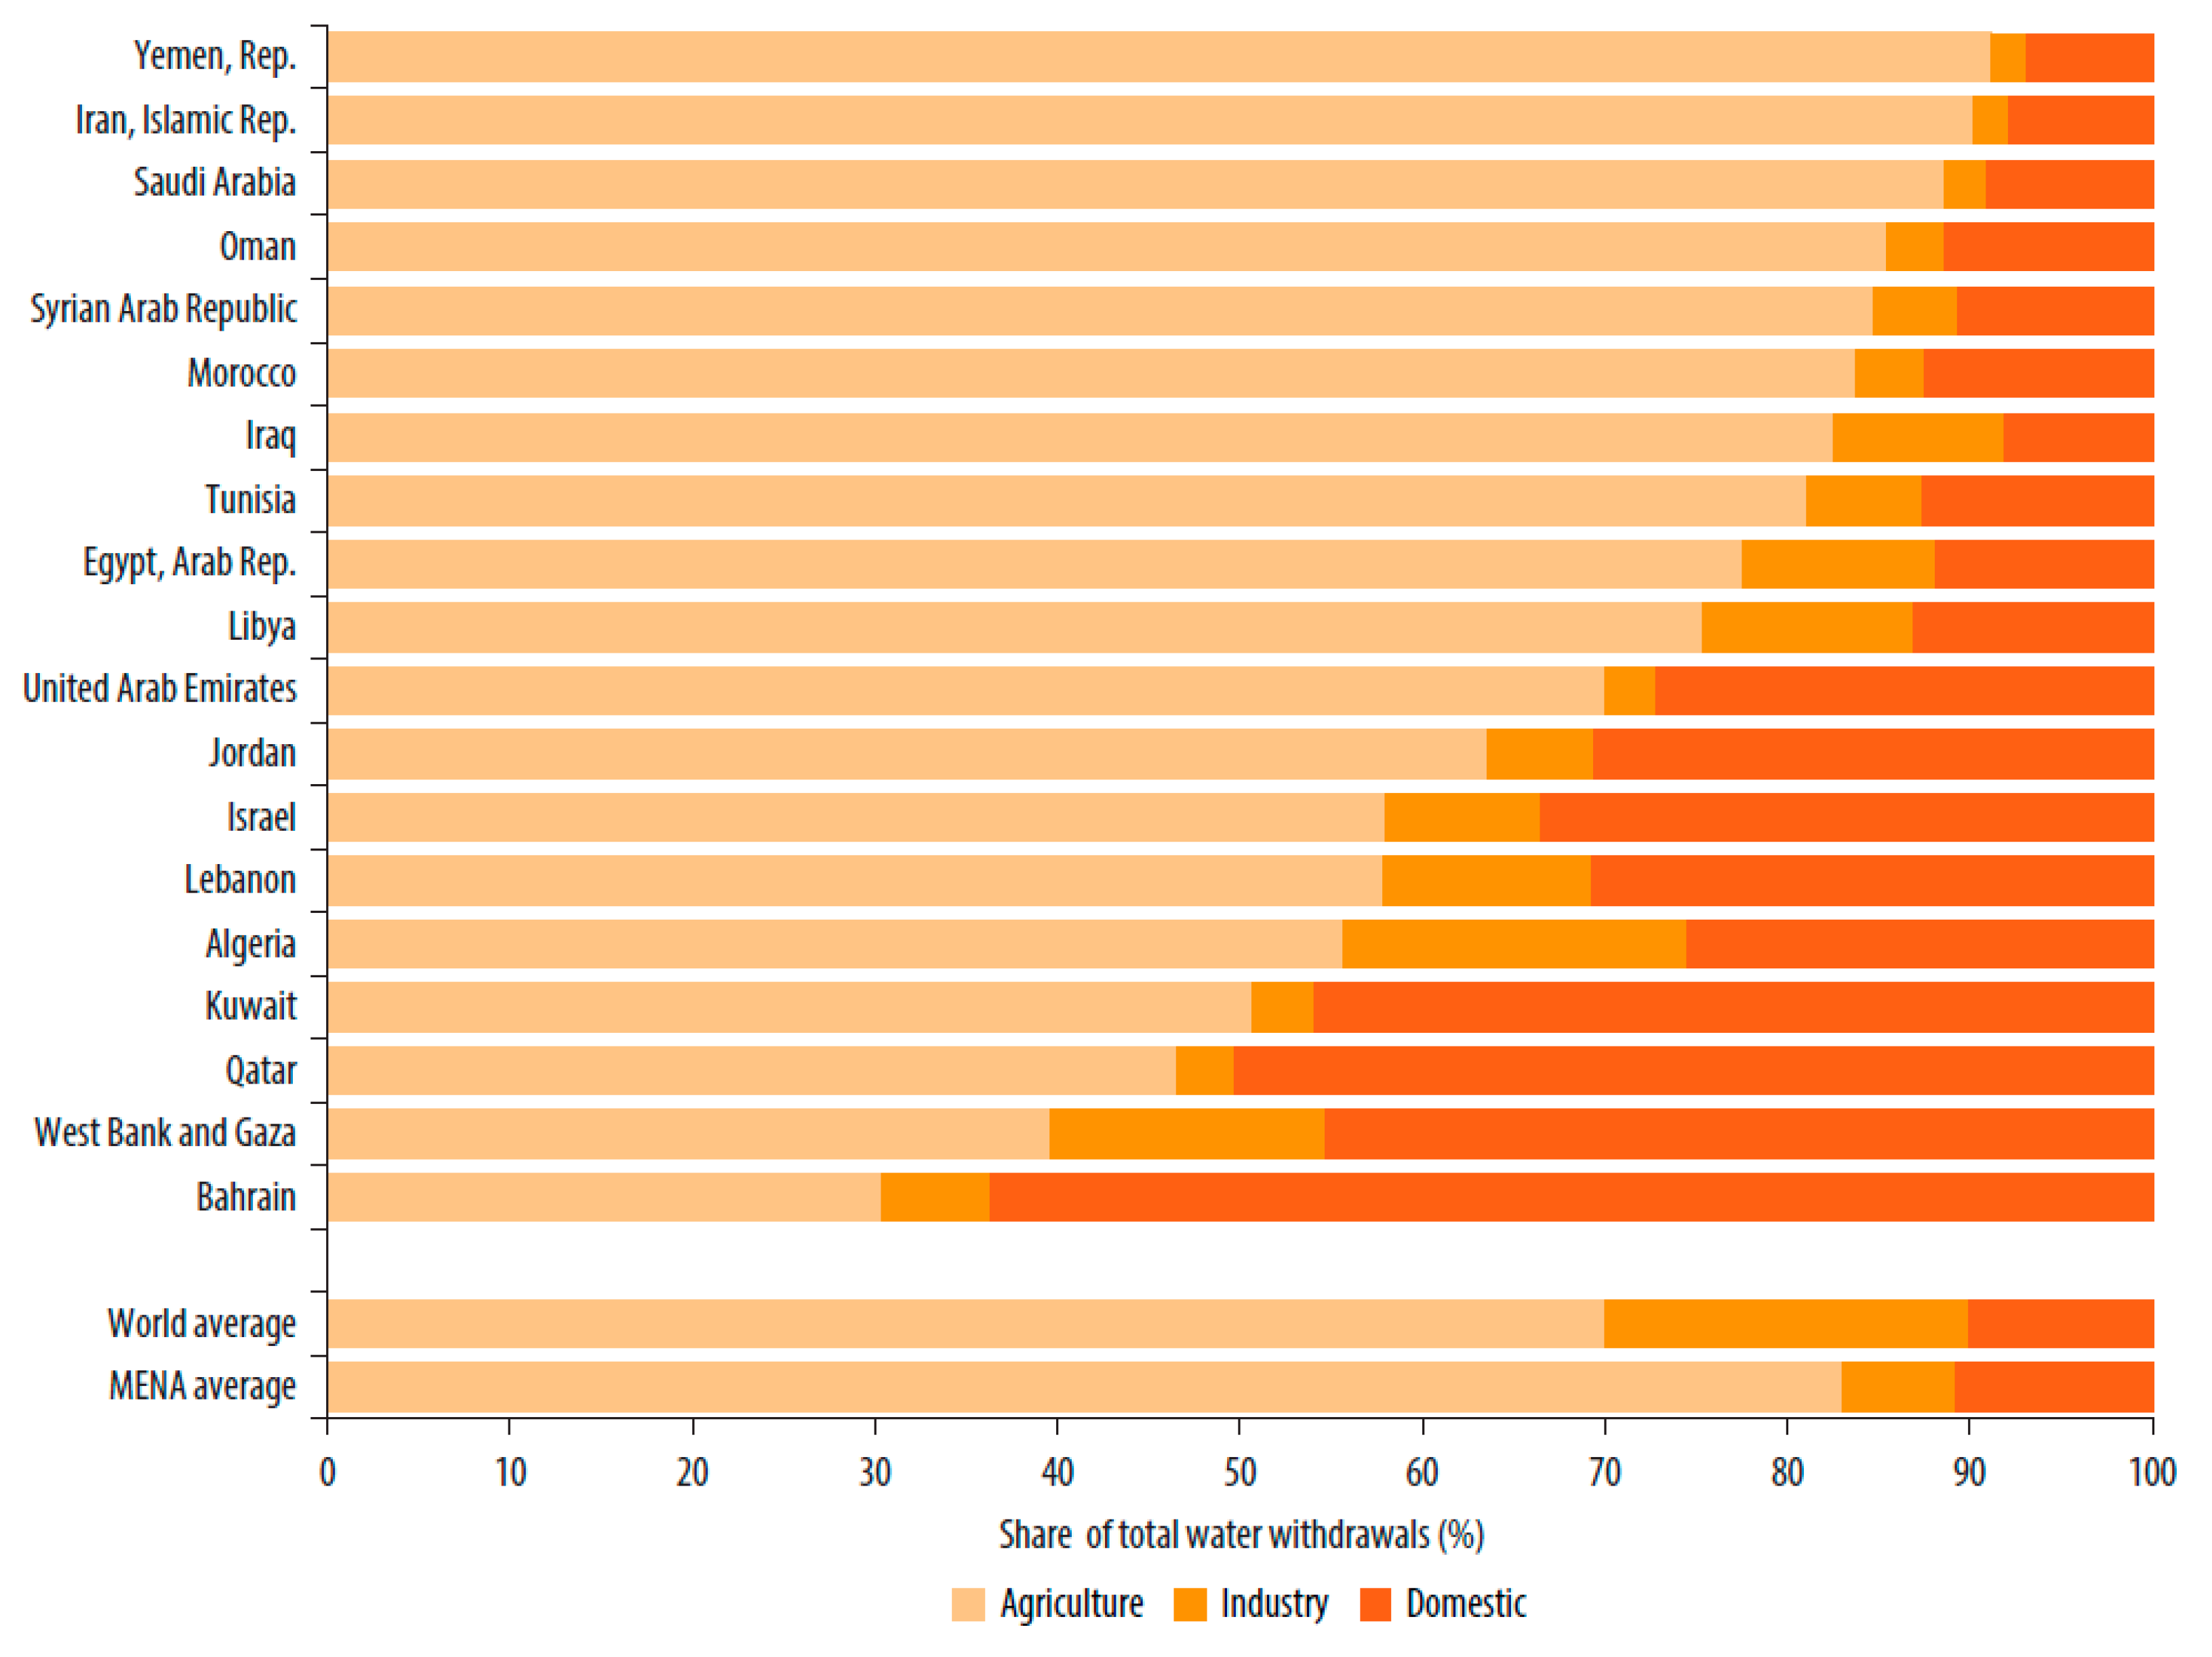
1.1. Context
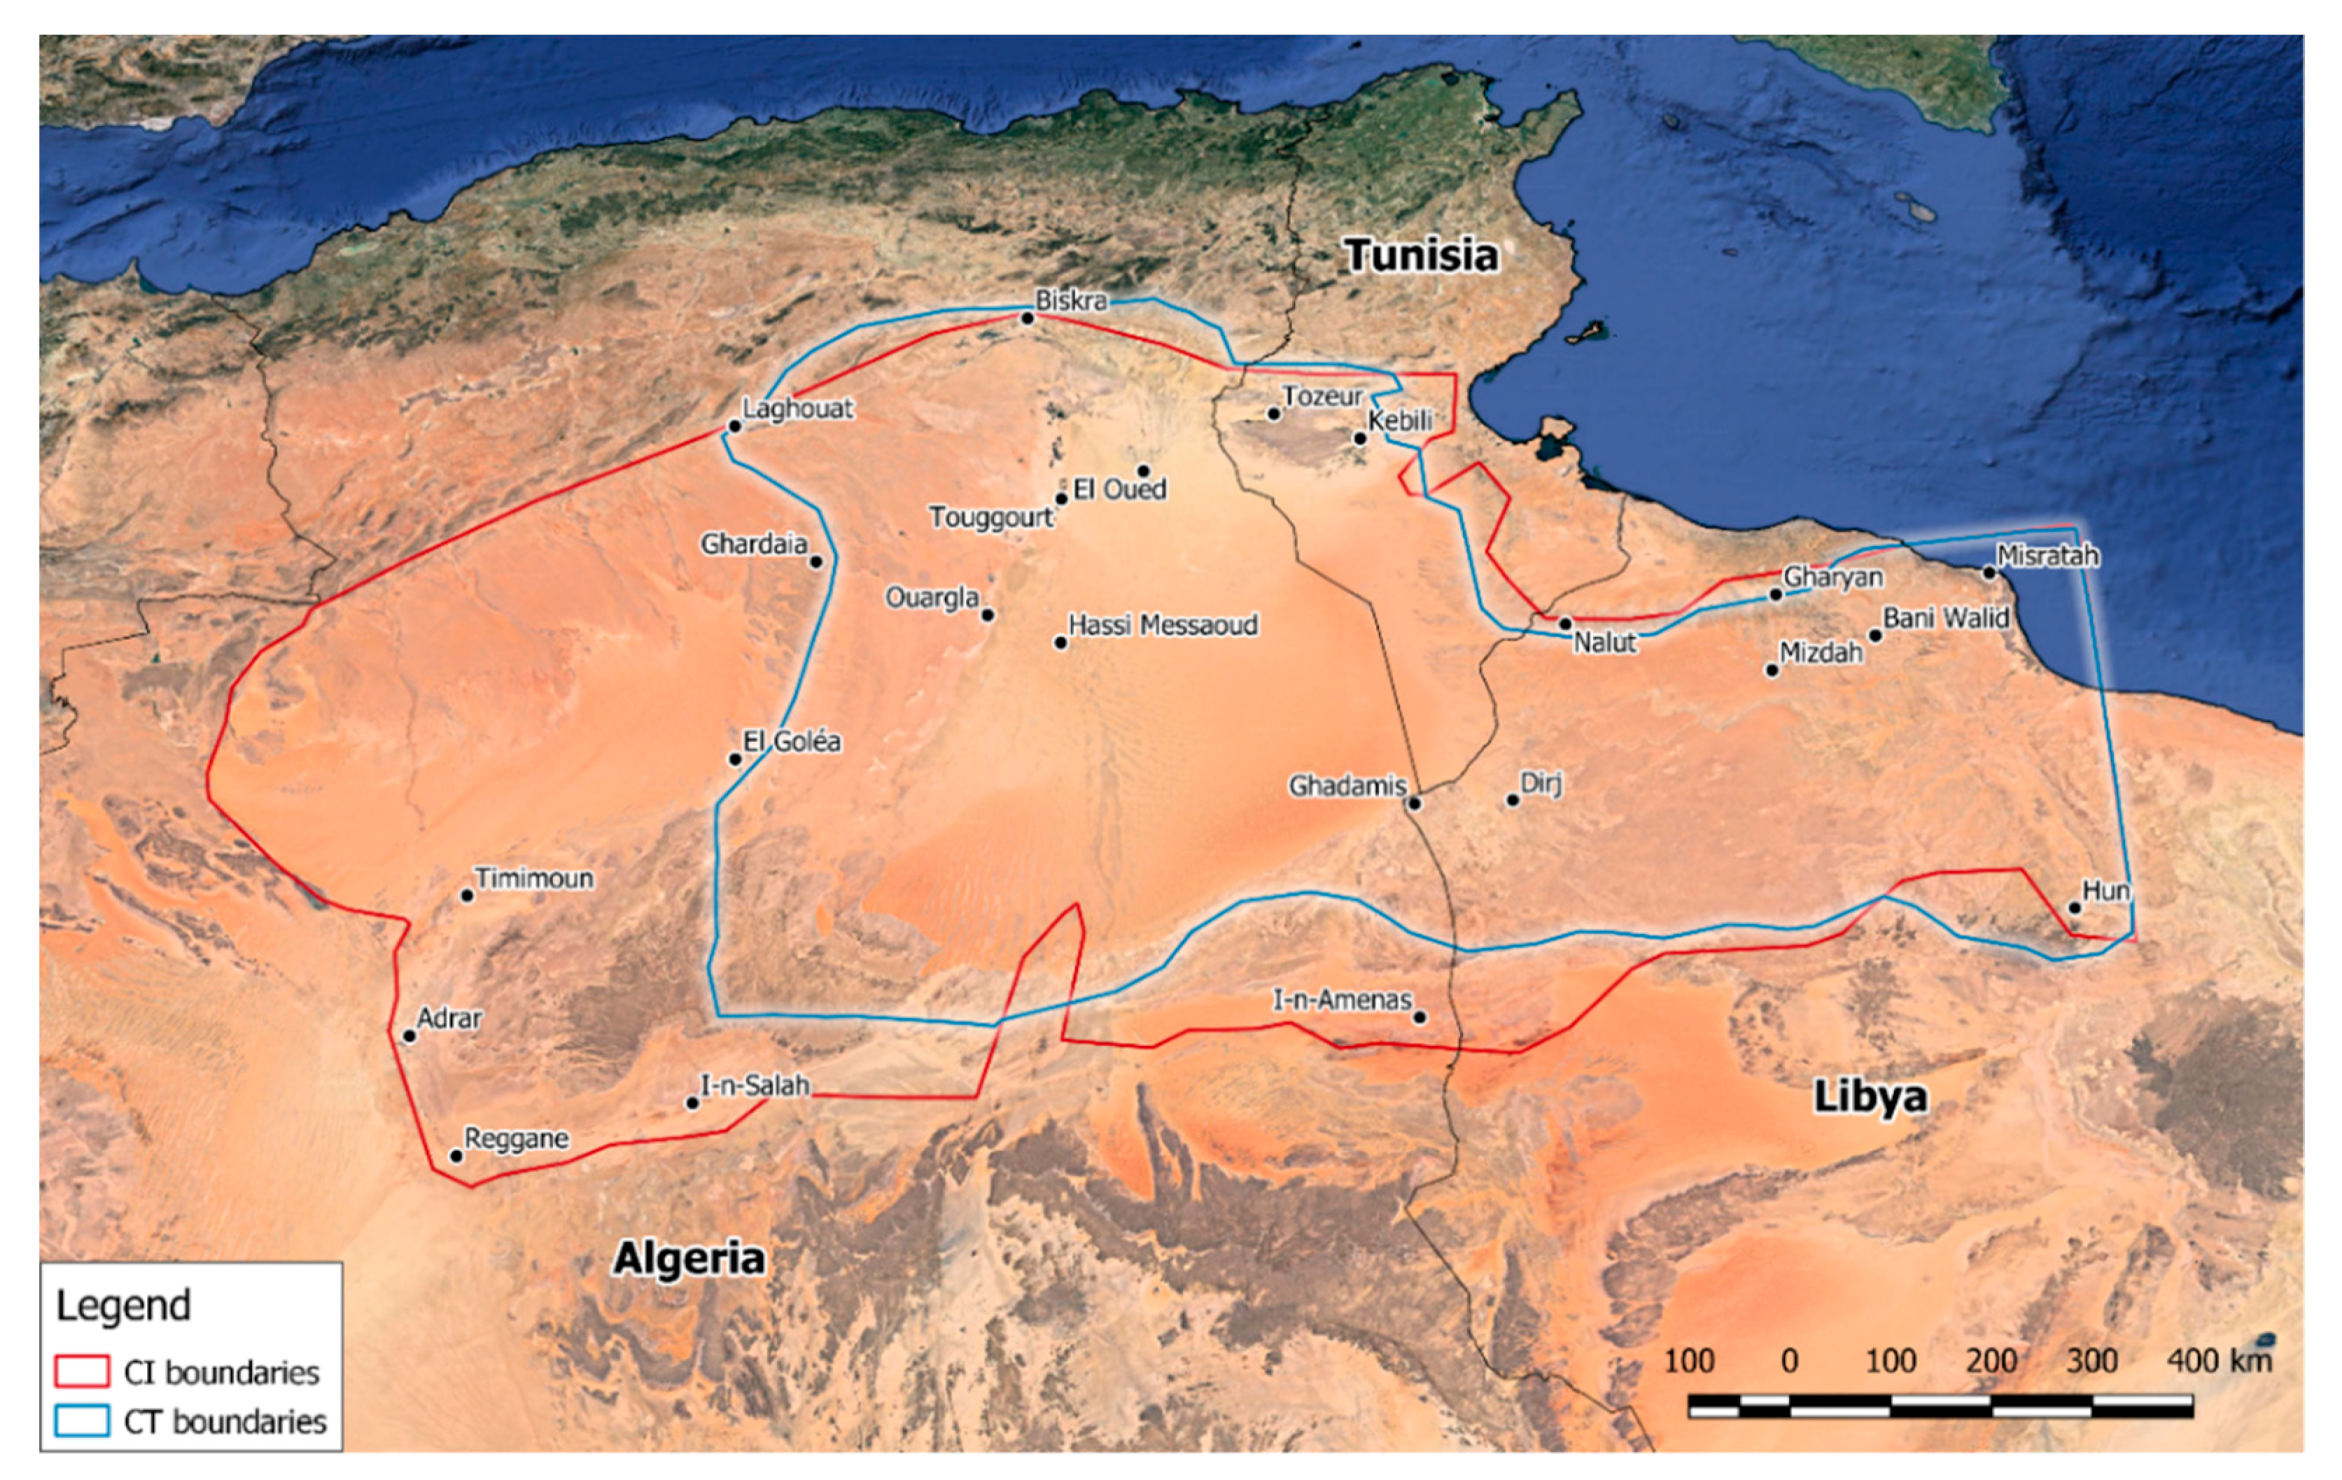
1.2. Background of the NWSAS
1.3. Previous Studies
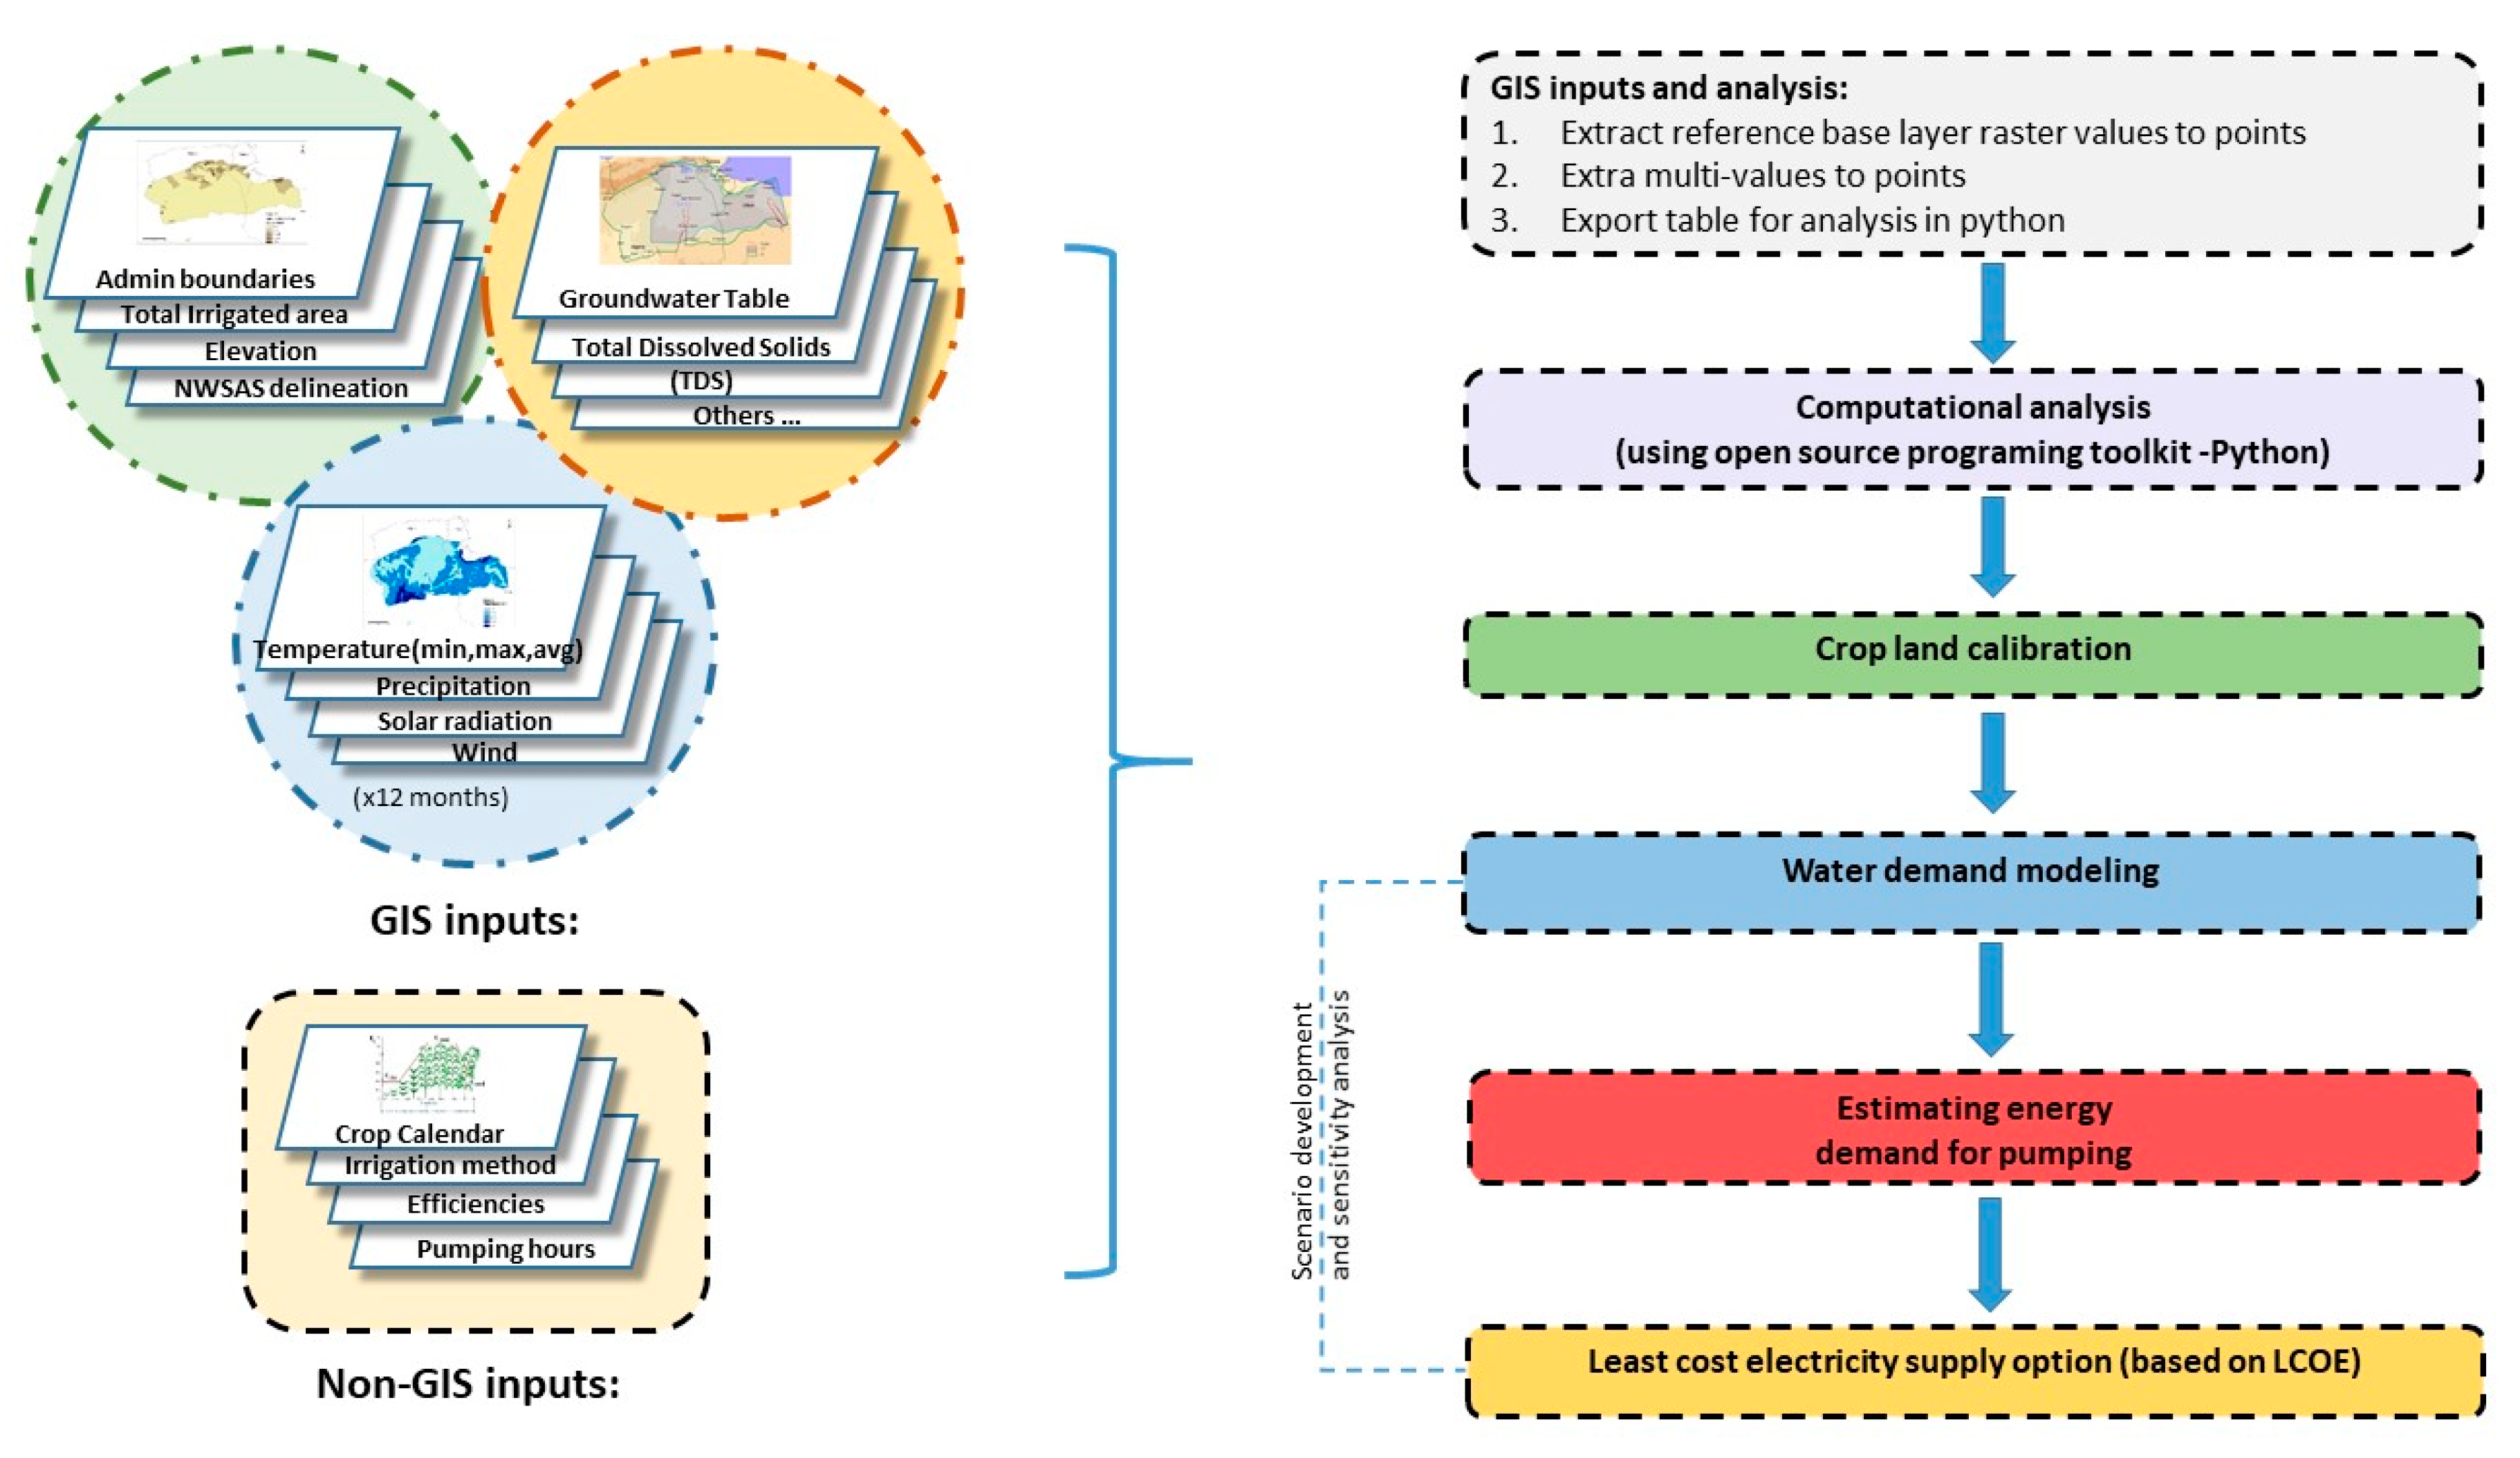
2. Materials and Methods
2.1. GIS Data Collection
2.2. Cropland Calibration
2.3. Estimation of the Irrigation Water Requirement
2.4. Estimation of the Electricity Requirement for Pumping
2.5. Estimation of the Least-Cost Electricity Supply Option
3. Scenarios and Nexus Questions
- What is the monthly irrigation requirement in each province?
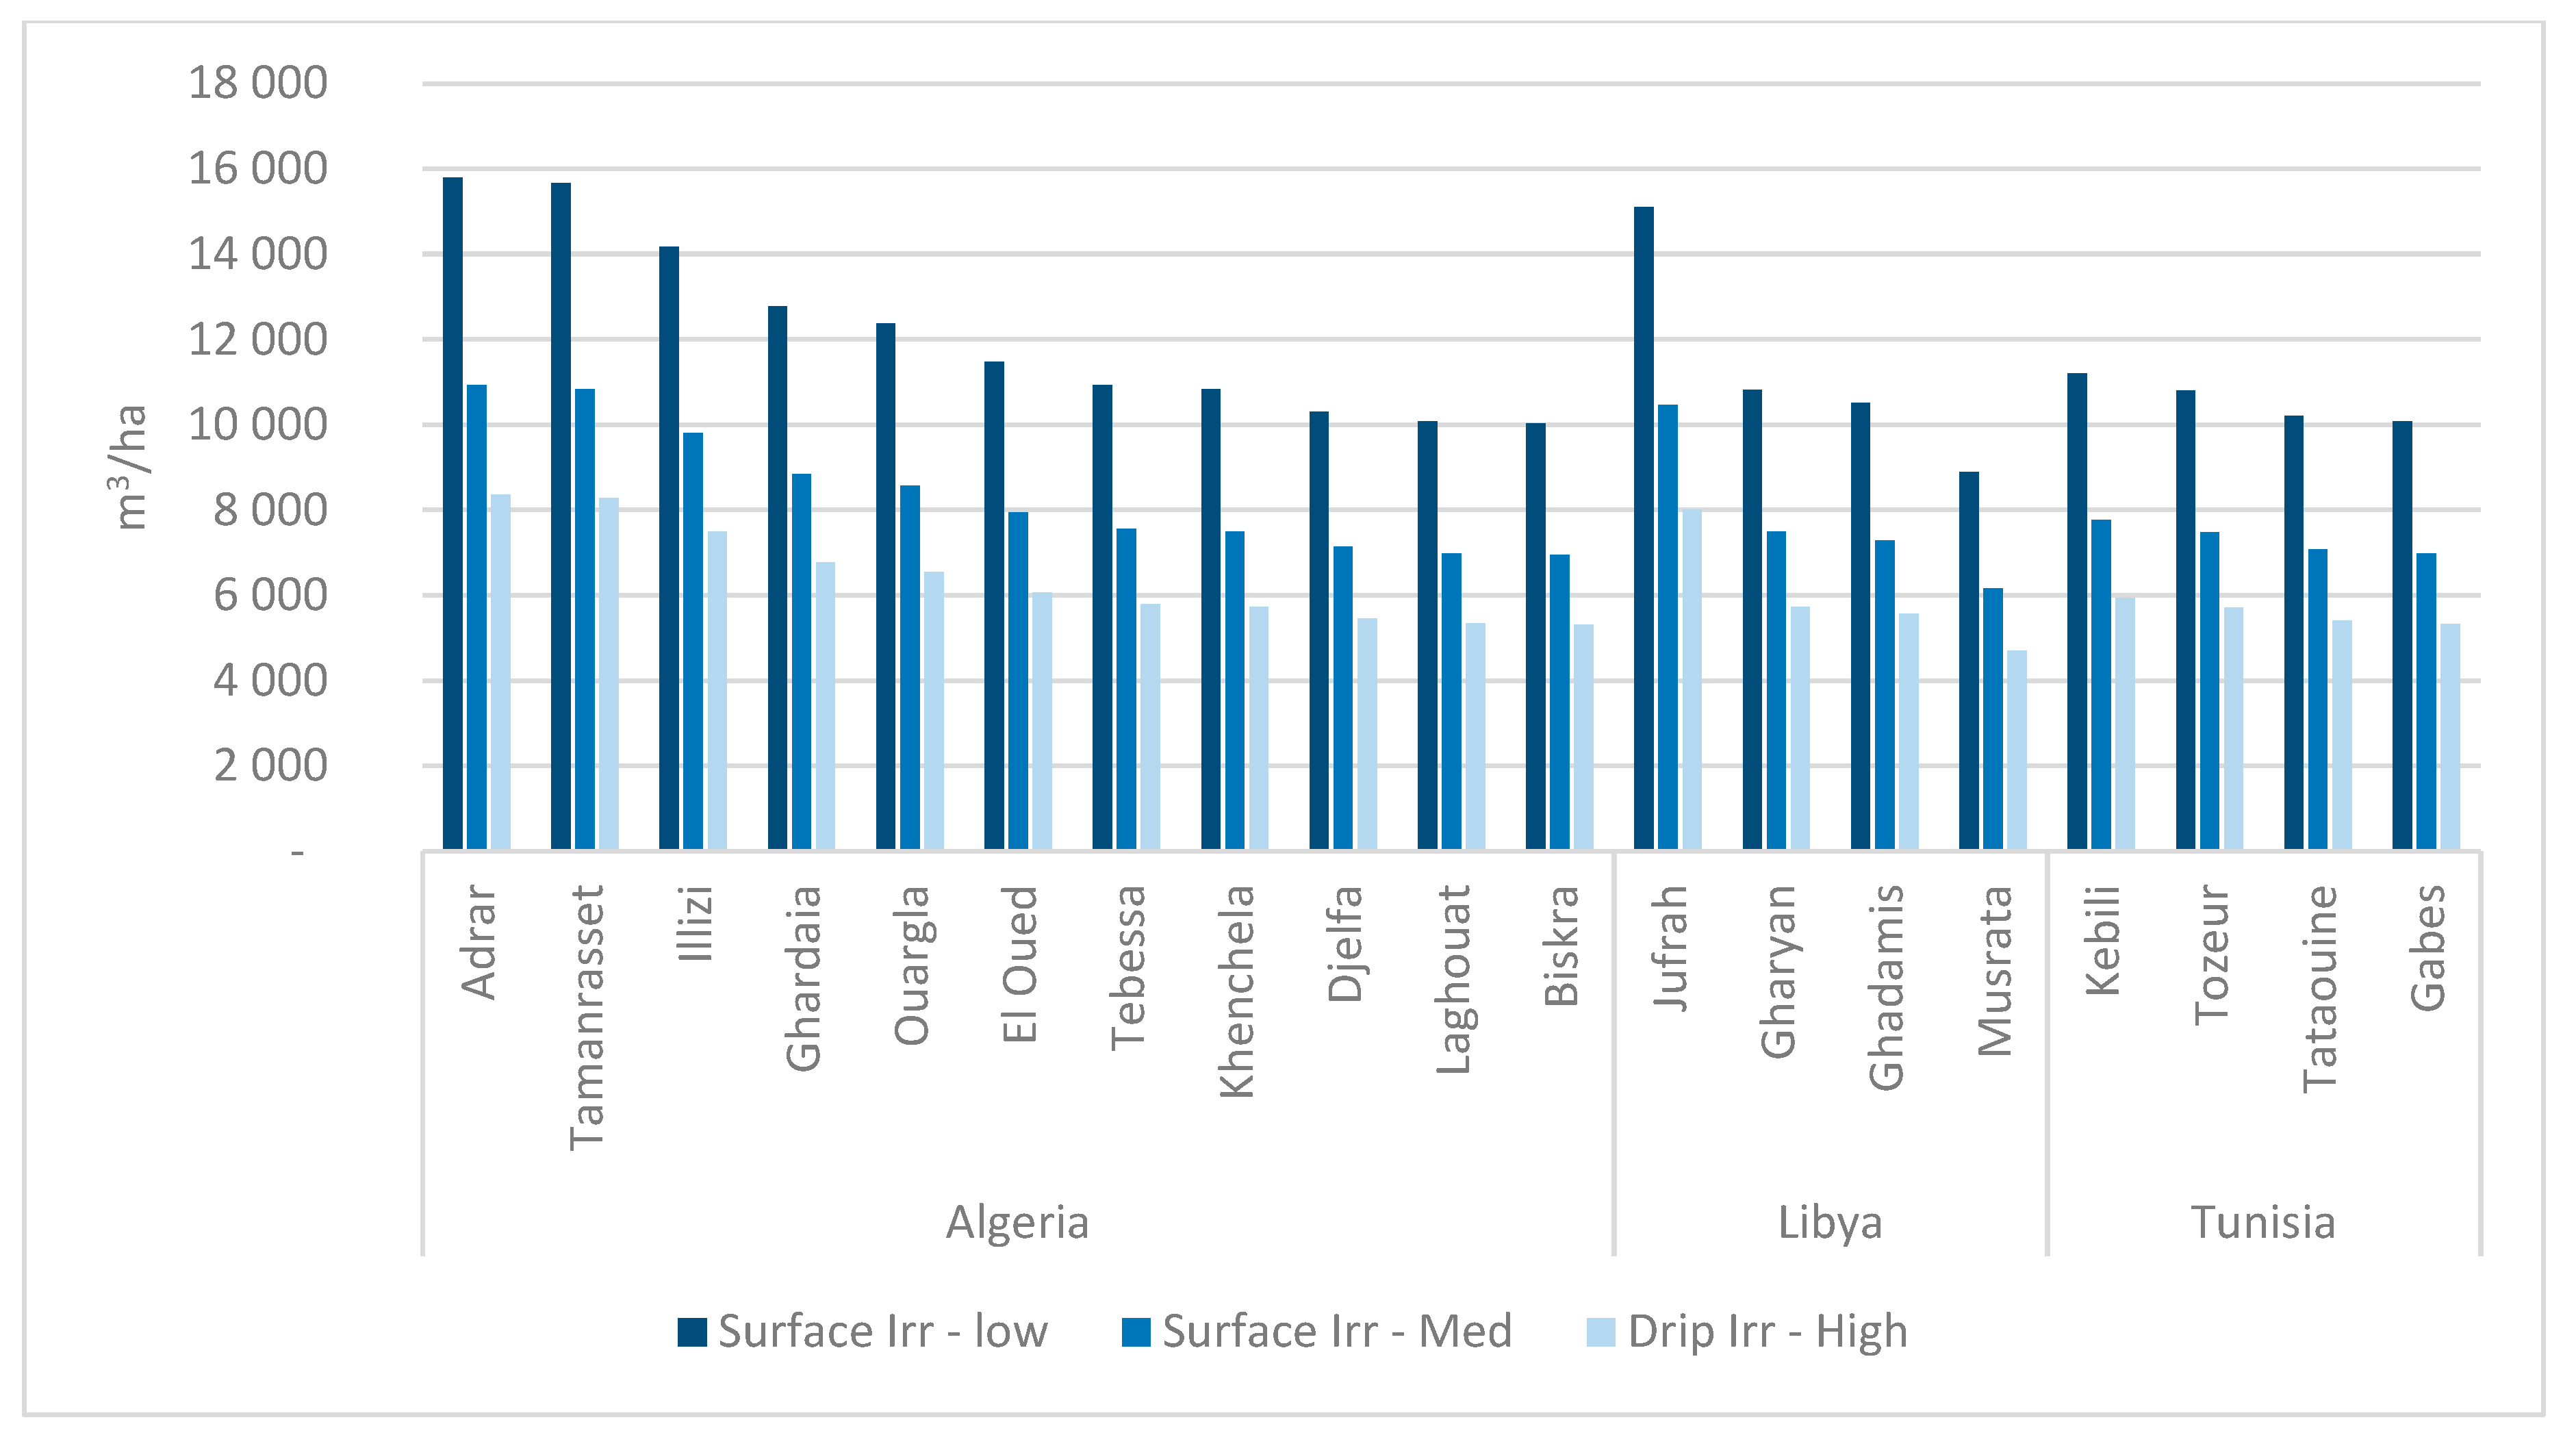
- What would be the impact of improving the efficiency of irrigation systems? Three levels of efficiency were investigated based on data obtained from literature [47] and consultation:
- ○
- Scenario 1: Surface irrigation—low efficiency (45%).
- ○
- Scenario 2: Surface irrigation—enhanced efficiency (65%).
- ○
- Scenario 3: Drip irrigation (85%).
- What is the electricity requirement associated with pumping?
- What would be the least-cost electricity supply option in each location to meet the estimated energy requirements?
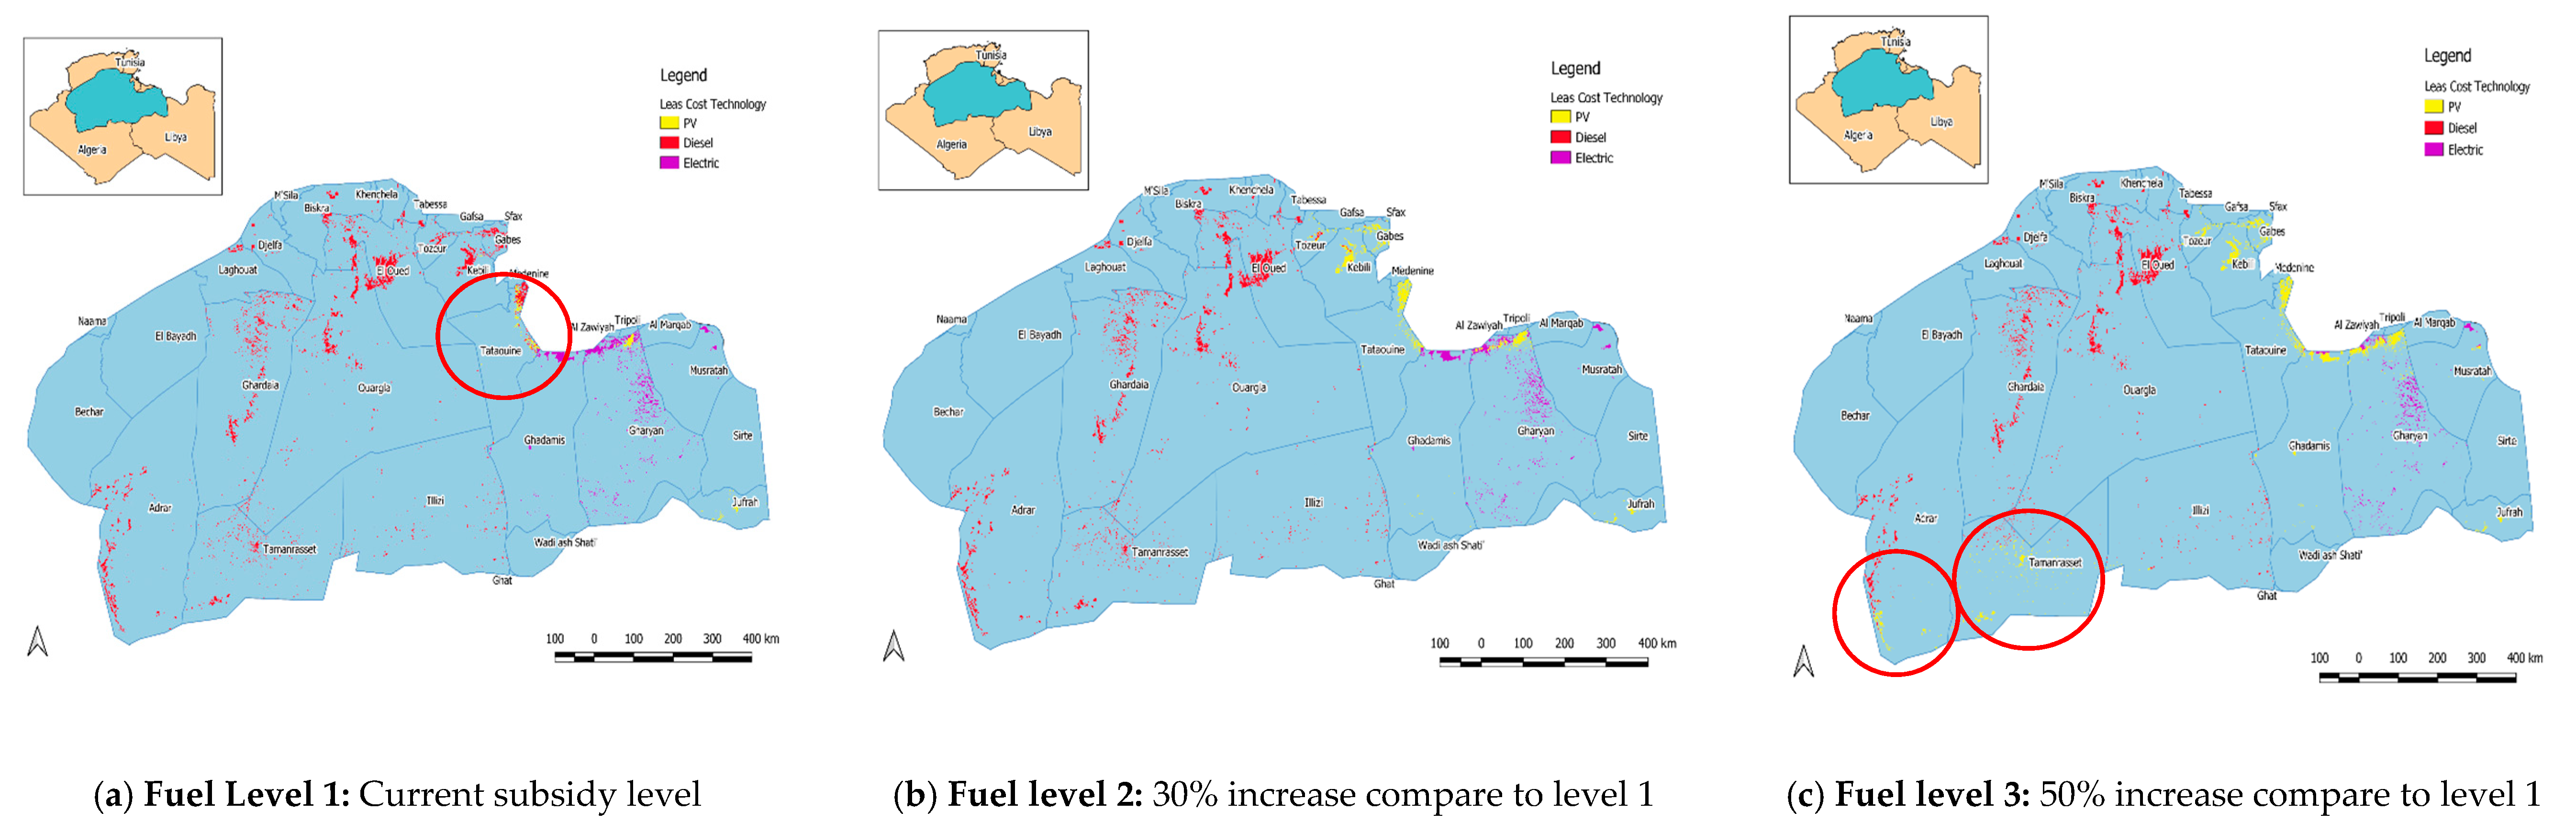
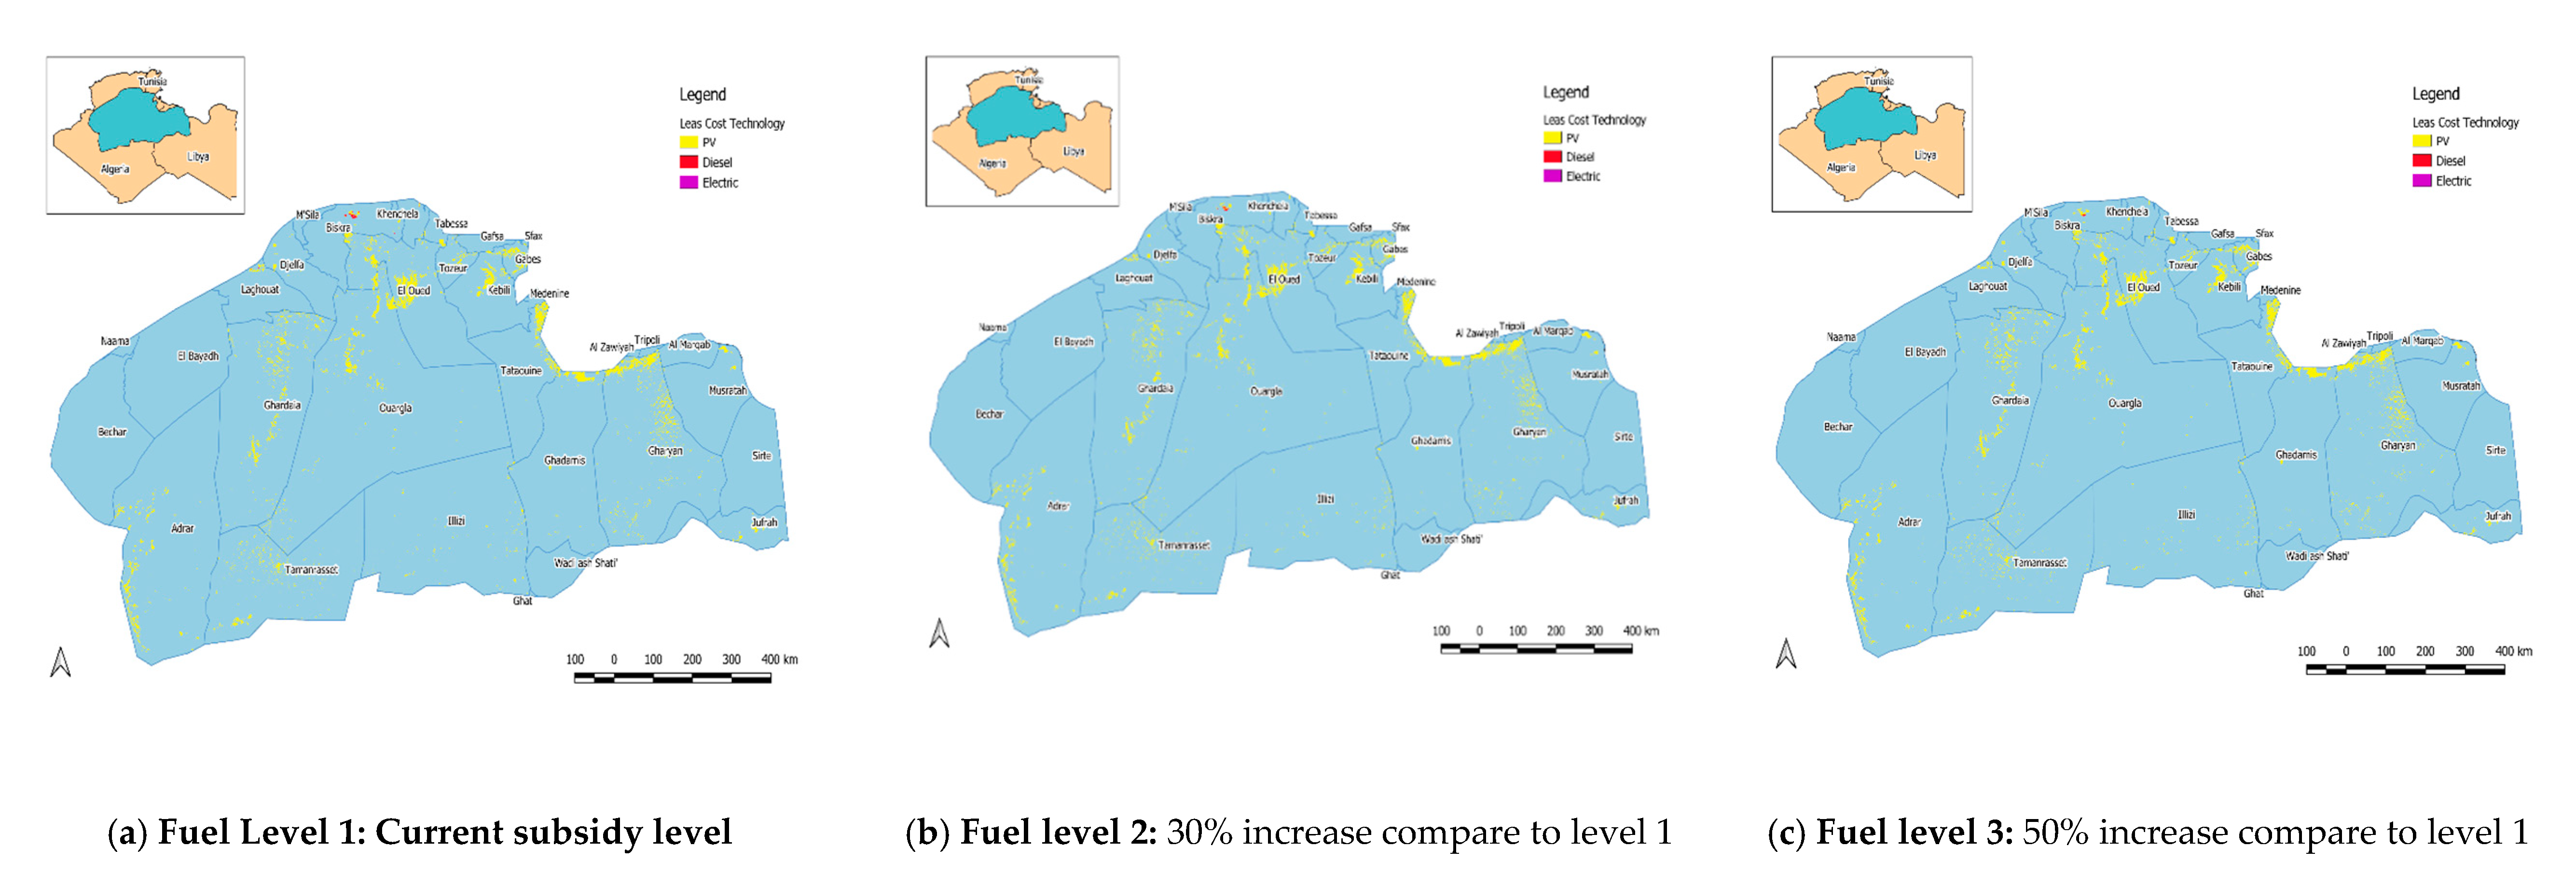
- What changes in technology cost and subsidy levels would be needed to make renewable technologies more competitive in the region?
4. Results and Discussion
What is the total irrigated cropland area?
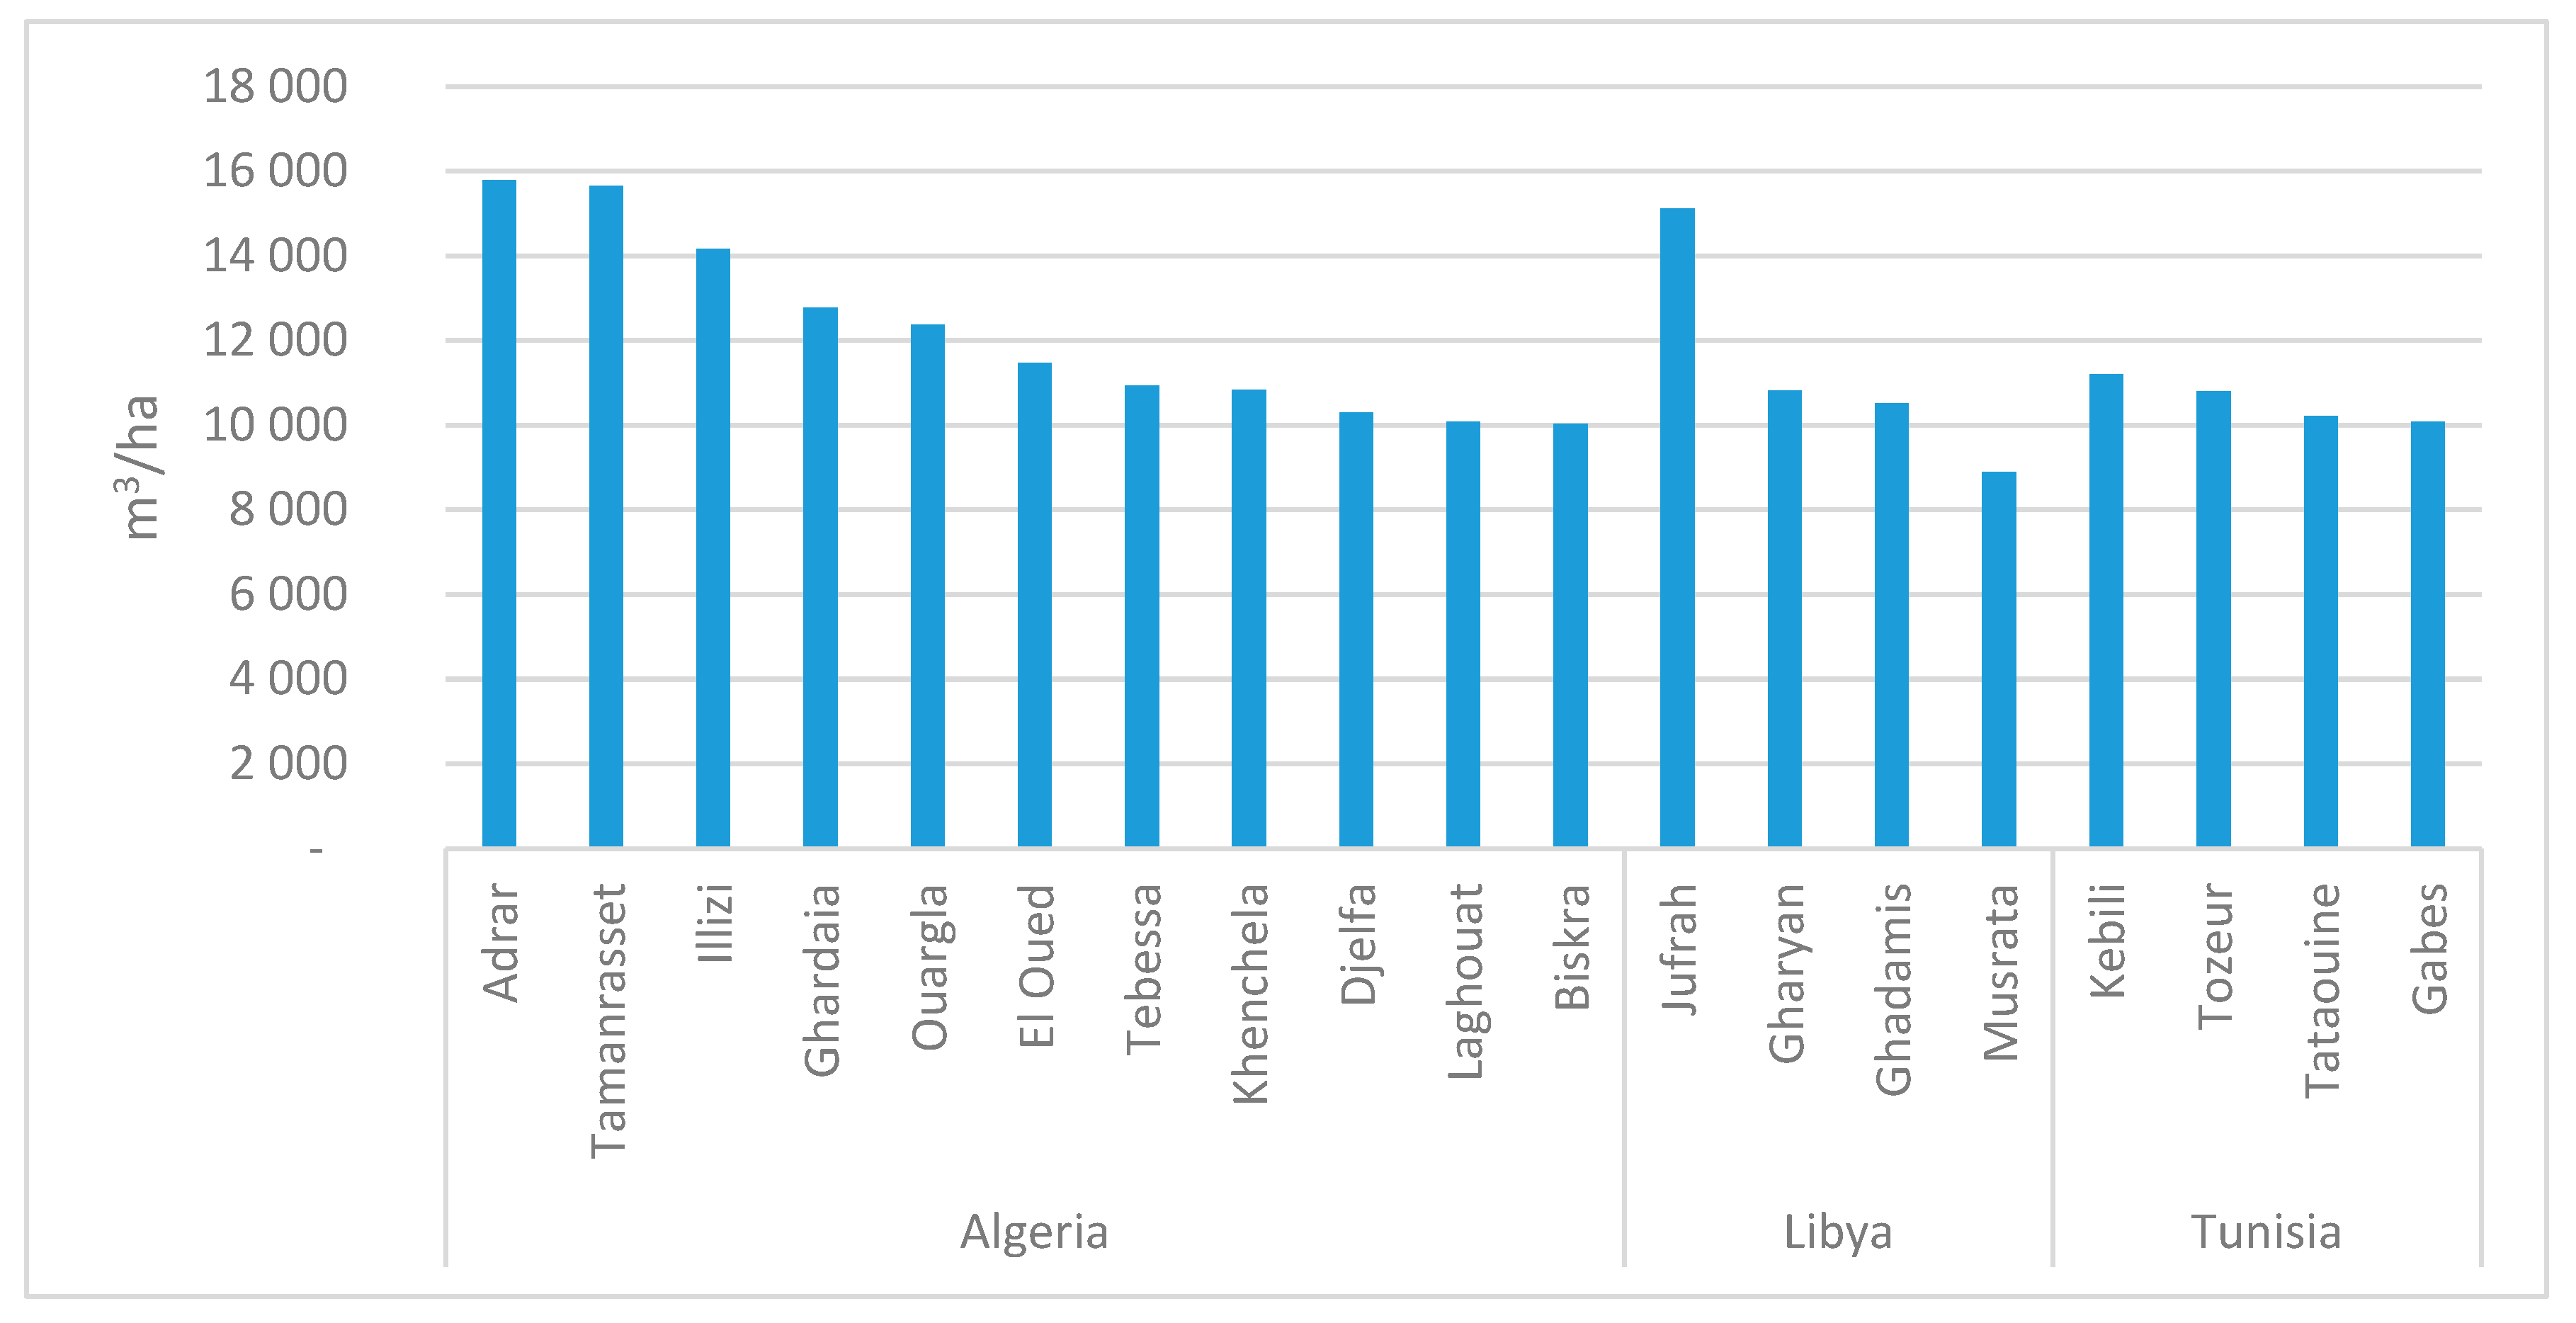
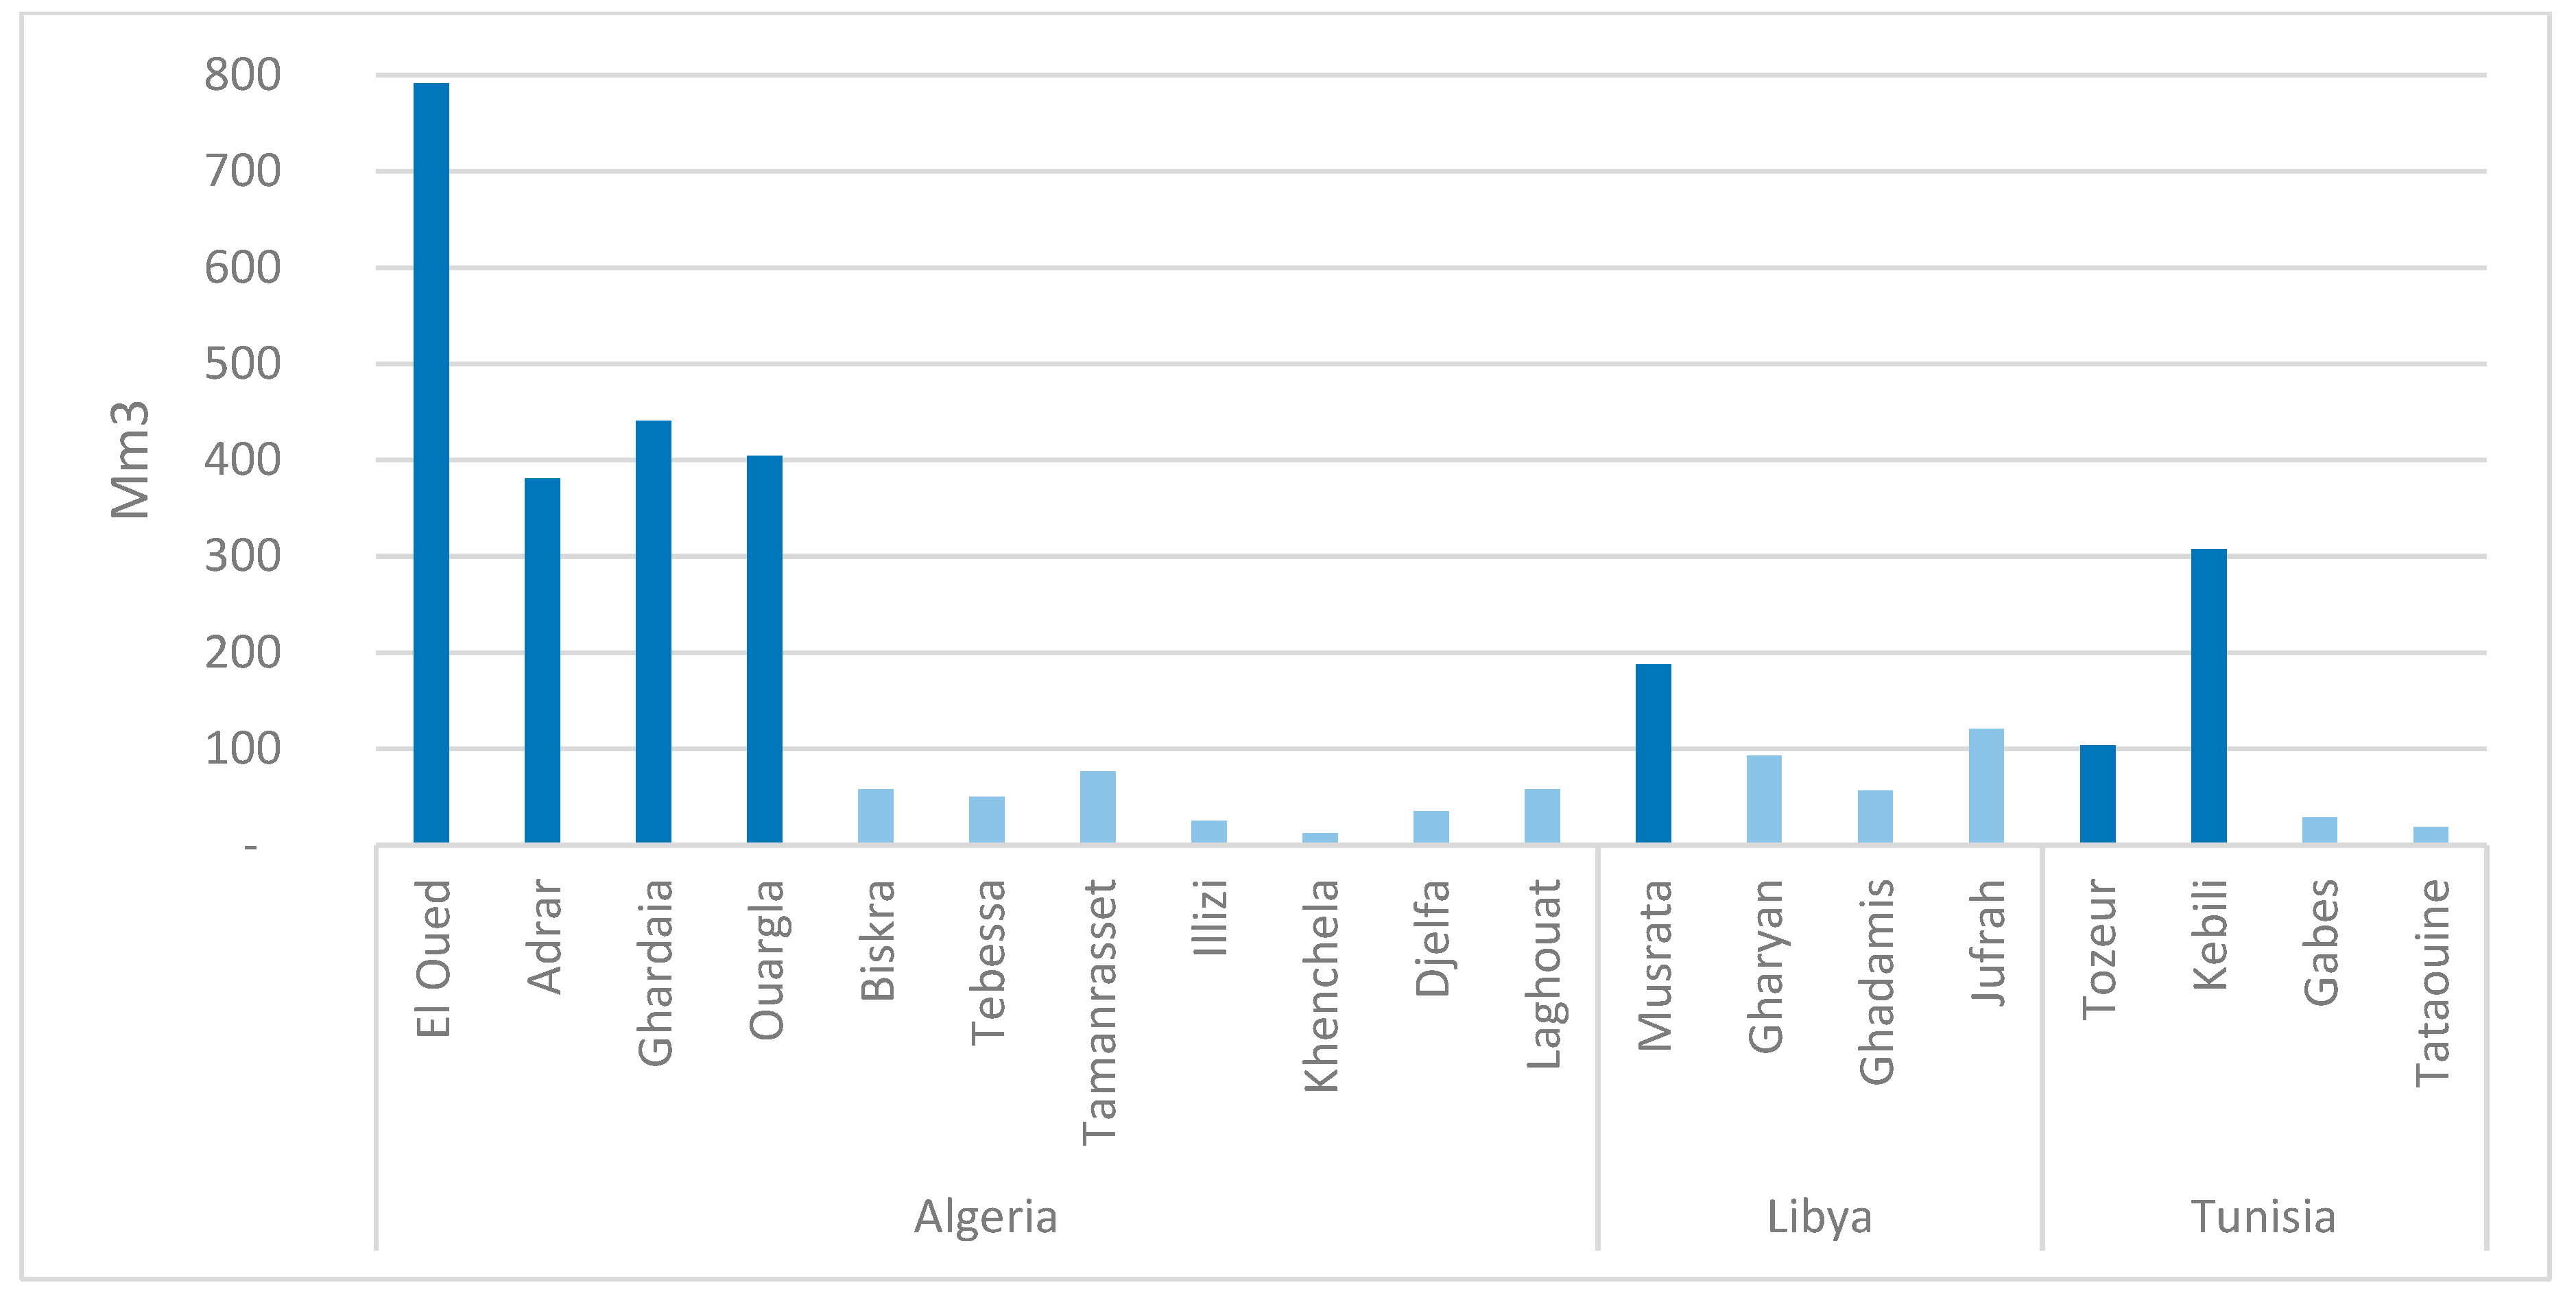
4.1. What is the Irrigation Requirement in Each Province of the NWSAS Region?
4.2. What is the Impact of Improving the Irrigation System on Water Demand Level?
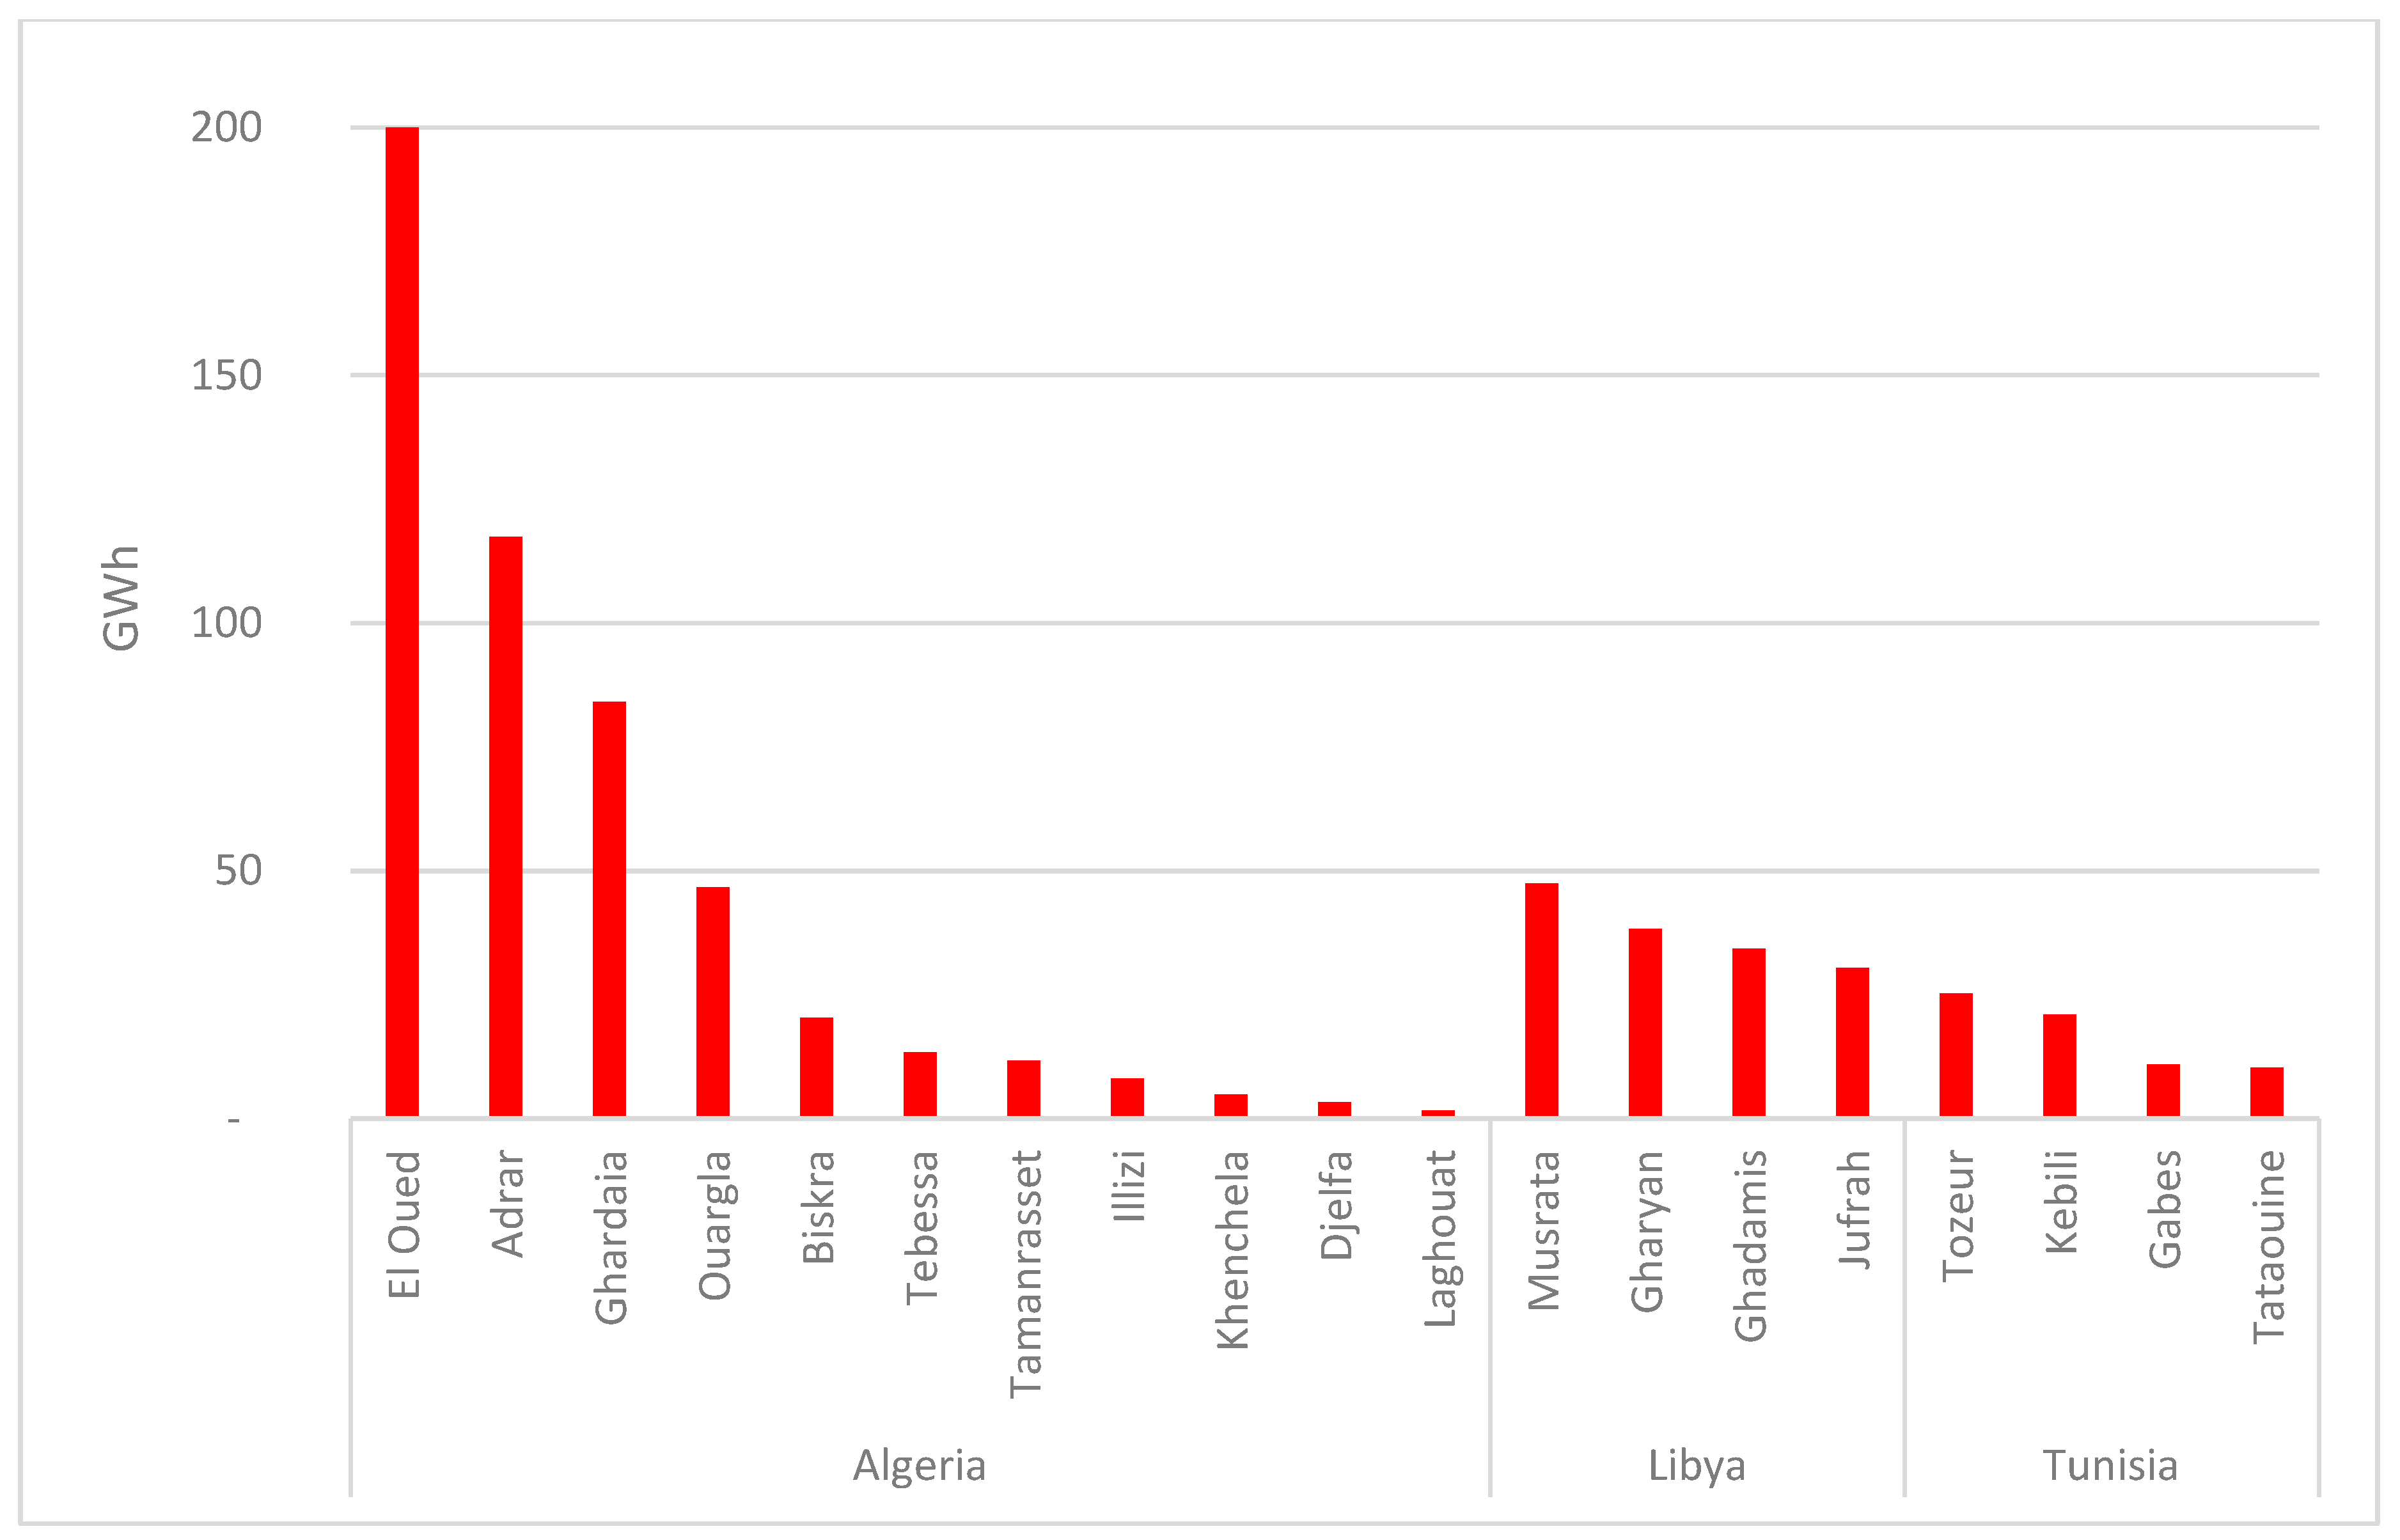
4.3. What is the Electricity Required for Pumping?
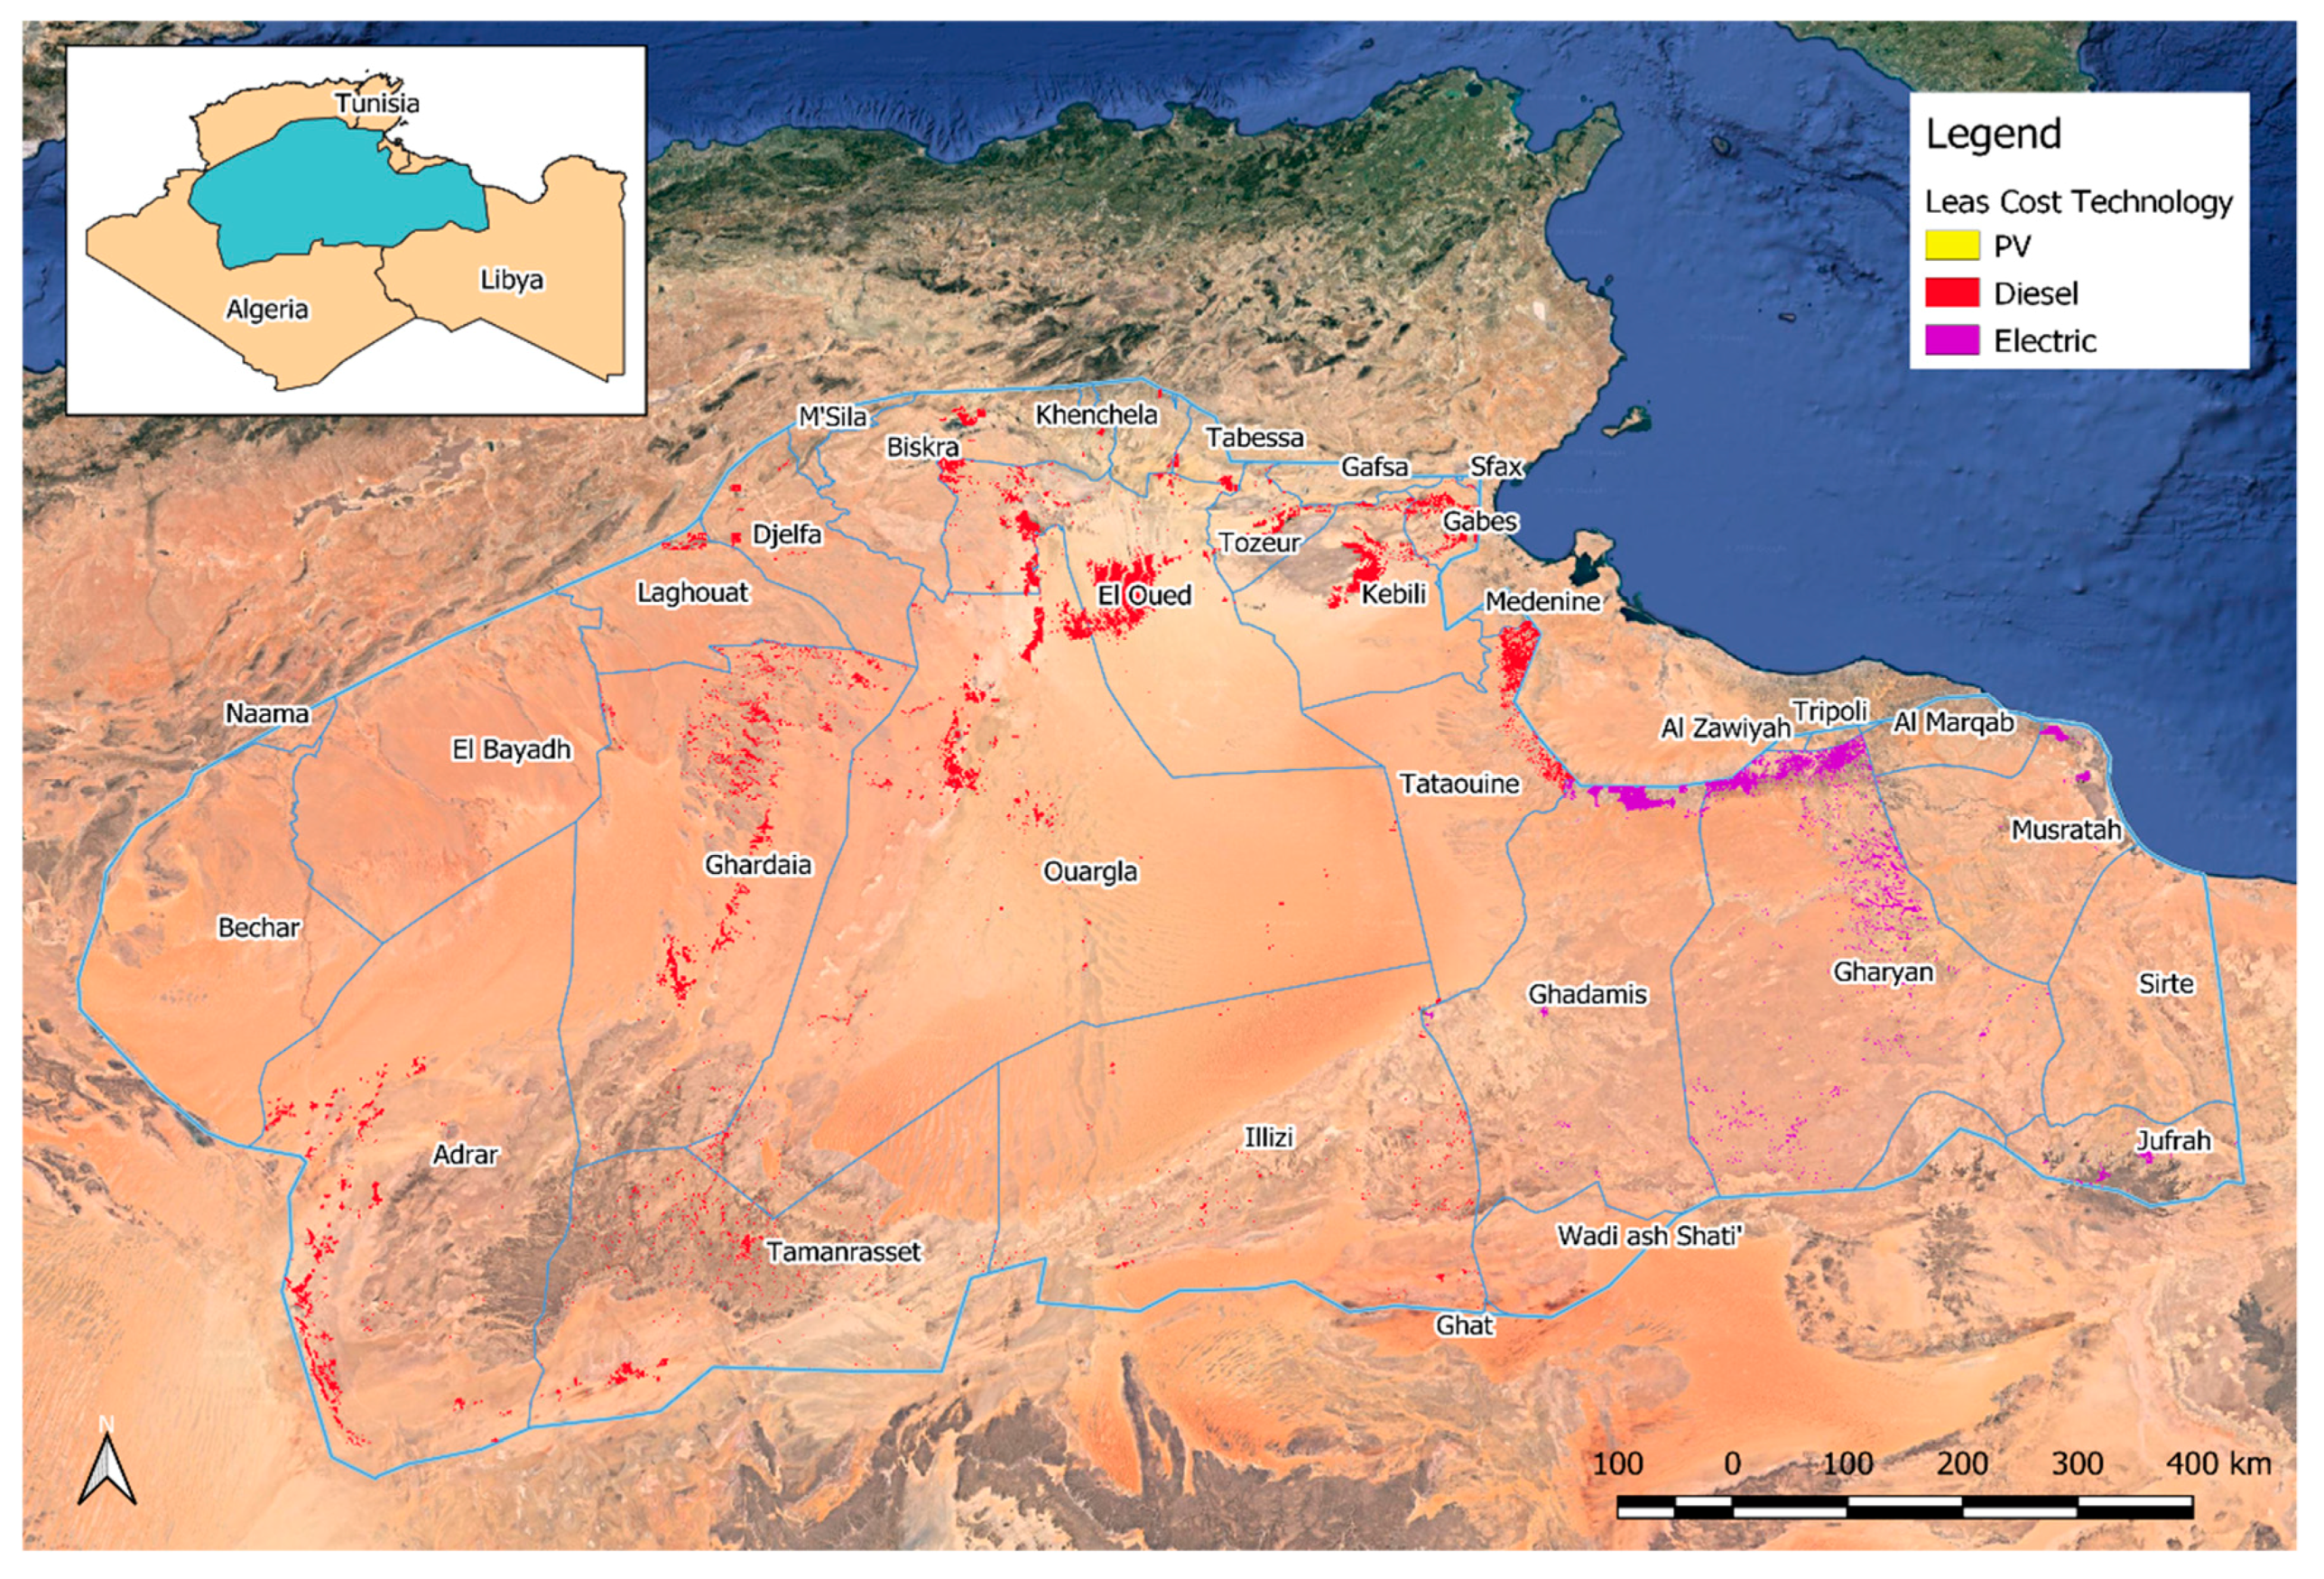
4.4. What is the Least-Cost Electricity Supply Option at Each Location to Meet the Estimated Energy Requirements?
4.5. What Changes in Subsidy Levels Are Needed to Make Renewable Technologies More Competitive in the Region?
5. Conclusions
Supplementary Materials
Author Contributions
Funding
Acknowledgments
Conflicts of Interest
Disclaimer
References
- UN, United Nations. The 2030 Agenda for Sustainable Development; A/RES/70/1; United Nations: New York, NY, USA, 2015; Available online: https://sustainabledevelopment.un.org/post2015/transformingourworld (accessed on 9 August 2017).
- Hoff, H. Understanding the Nexus. Background Paper for the Bonn2011 Conference: The Water, Energy and Food Security Nexus; Stockholm Environment Institute: Stockholm, Sweden, 2011; Available online: http://wef-conference.gwsp.org/fileadmin/documents_news/understanding_the_nexus.pdf (accessed on 10 August 2017).
- WB, World Bank. Beyond Scarcity: Water Security in the Middle East and North Africa; World Bank: Washington, DC, USA, 2018. [Google Scholar] [CrossRef]
- Howells, M.; Hermann, S.; Welsh, M.; Brazilian, M.; Segerström, R.; Alfstad, T.; Gielen, D.; Rofner, H.; Fischer, G.; van Velthuizen, H.; et al. Integrated analysis of climate change, land-use, energy and water strategies. Nature Clim. Chang. 2013, 3, 621–626. [Google Scholar] [CrossRef]
- de Strasser, L.; Lipponen, A.; Howells, M.; Stec, S.; Bréthaut, C. A methodology to assess the water energy food ecosystems nexus in Transboundary River Basins. Water 2016, 8, 59. [Google Scholar] [CrossRef]
- UNECE, United Nations Economic Commission for Europe. Methodology for Assessing the Water-Food-Energy-Ecosystems Nexus in Transboundary Basins and Experiences from Its Application: Synthesis; United Nations Economic Commission for Europe: New York, NY, USA; Geneva, Switzerland, 2018; Available online: http://www.unece.org/fileadmin/DAM/env/water/publications/WAT_55_NexusSynthesis/ECE-MP-WAT-55_NexusSynthesis_Final-for-Web.pdf (accessed on 6 September 2018).
- Almulla, Y.; Ramos, E.; Gardumi, F.; Taliotis, C.; Lipponen, A.; Howells, M. The role of energy-water nexus to motivate transboundary cooperation: An indicative analysis of the Drina River Basin. IJSEPM 2018. [Google Scholar] [CrossRef]
- Korkovelos, A.; Khavari, B.; Sahlberg, A.; Howells, M.; Arderne, C. The role of open access data in geospatial electrification planning and the achievement of SDG7. An OnSSET-based case study for Malawi. Energies 2019, 12, 1395. [Google Scholar] [CrossRef]
- OSS, Sahara and Sahel Observatory. Socio-Economic Aspects of Irrigation in the SASS Basin (SASSIII). 2014. Available online: http://www.oss-online.org/sites/default/files/publications/OSS-SASS_Socioeco_En.pdf (accessed on 10 October 2017).
- AbuZeid, K.; Elrawady, M.; CEDARE. North Western Sahara Aquifer System (NWSAS) 2012 State of the Water Report; Monitoring & Evaluation for Water in North Africa (MEWINA) project, Water Resource Management Program; CEDARE: Cairo, Egypt, 2015; Available online: http://web.cedare.org/wp-content/uploads/2005/05/North-Western-Sahara-Aquifer-System-NWSAS-2012-State-of-the-Water.pdf (accessed on 10 October 2017).
- OSS, Sahara and Sahel Observatory. For a Better Valorization of Irrigation Water in the SASS Basin: Diagnosis and Recommendations; Sahara and Sahel Observatory: Tunis, Tunisia, 2015; Available online: http://www.oss-online.org/sites/default/files/fichier/Synthese-SASS-En.pdf (accessed on 10 October 2017).
- UNECE, United Nations Economic Commission for Europe. National Consultation workshop for Libya: Assessing the Water-Food-Energy-Ecosystems Nexus in the North-West Sahara Aquifer System. Available online: https://www.unece.org/environmental-policy/conventions/water/meetings-and-events/water/other-water-related-events/2019/national-consultation-workshop-for-libya-assessing-the-water-food-energy-ecosystems-nexus-in-the-north-west-sahara-aquifer-system/docs.html (accessed on 22 August 2019).
- UNEP, United Nations Economic Program. Protection of the North West Sahara Aquifer System (NWSAS) and Related Humid Zones and Ecosystems; United Nations Environment Programme: Nairobi, Kenya, 2010; Available online: https://iwlearn.net/documents/legal-frameworks/north-western-sahara-aquifer-system-nwsas (accessed on 10 October 2017).
- AMCOW, African Ministers’ Council on Water; GWP, Global Water Partnership; OSS, Sahara and Sahel Observatory. Integration of climate Change Impact in the NWSAS Water Resources Management Report of Phase A: Definition of the Baseline and Choice of Climatic Scenarios; African Ministers’ Council on Water; Global Water Partnership; Sahara and Sahel Observatory: Tunis, Tunisia, 2015. [Google Scholar]
- IEA, International Energy Agency. Algeria: Electricity and Heat for 2014; International Energy Agency: Paris, France, 2016; Available online: http://www.iea.org/statistics/statisticssearch/report/?country=ALGERIA&product=electricityandheat&year=2014 (accessed on 25 October 2019).
- IEA, International Energy Agency. Tunisia: Electricity and Heat for 2014; International Energy Agency: Paris, France, 2016; Available online: http://www.iea.org/statistics/statisticssearch/report/?country=Tunisia&product=electricityandheat (accessed on 25 October 2019).
- IEA, International Energy Agency. Libya: Electricity and Heat for 2014; International Energy Agency: Paris, France, 2016; Available online: http://www.iea.org/statistics/statisticssearch/report/?country=LIBYA&product=electricityandheat&year=2014 (accessed on 25 October 2019).
- IEA, International Energy Agency. IEA Fossil Fuel Subsidies Database. Available online: https://www.iea.org/weo/energysubsidies/ (accessed on 25 October 2019).
- Ferdinand, E. The Political Economy of Energy Subsidies in Egypt and Tunisia: The Untold Story, Oxford Energy Comment. 2017. Available online: https://www.oxfordenergy.org/wpcms/wp-content/uploads/2017/08/The-political-economy-of-energy-subsidies-in-Egypt-and-Tunisia-the-untold-story.pdf?v=f003c44deab6 (accessed on 25 October 2019).
- Khater, A.R. North Western Sahara Aquifer System (NWSAS) M&E Rapid Assessment Report; CEDARE: Cairo, Egypt, 2014; Available online: http://web.cedare.org/wp-content/uploads/2005/05/North-Western-Sahara-Aquifer-System-NWSAS-Monitoring-and-Evaluation-Rapid-Assessment-Report.pdf (accessed on 10 October 2017).
- OSS, Sahara and Sahel Observatory. Agricultural Demostration Pilots in the Sass Basin; Sahara and Sahel Observatory: Tunis, Tunisia, 2014; Available online: http://www.oss-online.org/sites/default/files/publications/OSS-SASS-PDA_En.pdf (accessed on 10 October 2017).
- Tsanis, I.K.; Naoum, S.; Boyle, S.J. A GIS interface method based on reference evapotranspiration and crop coefficients for the determination of irrigation requirements. Water Int. 2002, 27, 233–242. [Google Scholar] [CrossRef]
- Daccache, A.; Ciurana, J.S.; Rodriguez Diaz, J.A.; Knox, J.W. Water and energy footprint of irrigated agriculture in the Mediterranean region. Environ. Res. Lett. 2014, 9, 124014. [Google Scholar] [CrossRef]
- Moksnes, N.; Korkovelos, A.; Mentis, D.; Howells, M. Electrification pathways for kenya–linking spatial electrification analysis and medium to long term energy planning. Environ. Res. Lett. 2017, 12, 095008. Available online: http://stacks.iop.org/1748-9326/12/i=9/a=095008 (accessed on 1 August 2018). [CrossRef]
- ONSSET. Open Source Spatial Electrification Tool. Available online: http://www.onsset.org/about.html (accessed on 17 August 2017).
- Howells, M.; Rogner, H.; Strachan, N.; Heaps, C.; Huntington, H.; Kypreos, S.; Hughes, A.; Silveira, S.; DeCarolis, J.; Bazillian, M.; et al. OSeMOSYS: The open source energy modeling system: An introduction to its ethos, structure and development. Energy Policy 2011, 39, 5850–5870. [Google Scholar] [CrossRef]
- NASA, National Aeronautics and Space Adminstration. Data.GISS: Global Land Cover Datasets. Available online: https://data.giss.nasa.gov/landuse/ (accessed on 20 September 2019).
- ESA, European Space Agency. GlobCover. Available online: http://due.esrin.esa.int/page_globcover.php (accessed on 20 September 2017).
- USGS, U.S. Geological Survey. Land Cover Type Yearly L3 Global 0.05Deg CMG, MCD12C1 Courtesy of the NASA Land Processes Distributed Active Archive Center (LP DAAC), Sioux Falls, South Dakota. Available online: https://lpdaac.usgs.gov/dataset_discovery/modis/modis_products_table/mcd12c1 (accessed on 20 September 2017).
- ESA, European Space Agency. ESA CCI LAND COVER–S2 Prototype Land Cover 20m Map of Africa. 2016. Available online: http://2016africalandcover20m.esrin.esa.int/ (accessed on 22 August 2018).
- Saaty, T.L. The Analytic Hierarchy Process; McGraw-Hill: New York, NY, USA, 1980. [Google Scholar]
- Bandyopadhyay, S.; Jaiswal, R.K.; Hegde, V.S.; Jayaraman, V. Assessment of land suitability potentials for agriculture using a remote sensing and GIS based approach. Int. J. Remote Sens. 2009, 30, 879–895. [Google Scholar] [CrossRef]
- Akıncı, H.; Özalp, A.Y.; Turgut, B. Agricultural land use suitability analysis using GIS and AHP technique. Comput. Electron. Agric. 2013, 97, 71–82. [Google Scholar] [CrossRef]
- Feizizadeh, B.; Blaschke, T. GIS-multicriteria decision analysis for landslide susceptibility mapping: Comparing three methods for the Urmia Lake Basin, Iran. Nat. Hazards 2013, 65, 2105–2128. [Google Scholar] [CrossRef]
- Nithya, C.N.; Srinivas, Y.; Magesh, N.S.; Kaliraj, S. Assessment of groundwater potential zones in Chittar Basin, Southern India using GIS based AHP technique. Remote Sens. Appl. Soc. Environ. 2019, 15, 100248. [Google Scholar] [CrossRef]
- Pegios, K. A GIS-Based Approach for Productive Uses of Electricity—The Case Study of Water and Electricity Demand for Agriculture in Tanzania; University of Thessaly: Volos, Greece, 2018; Available online: https://ir.lib.uth.gr/xmlui/bitstream/handle/11615/49064/17915.pdf?sequence=1 (accessed on 17 September 2019).
- Allen, R.G.; Pereira, L.S.; Raes, D.; Smith, M. FAO Irrigation and Drainage Paper 56—Crop Evapotranspiration (Guidelines for Computing Crop Water Requirements). 1998. Available online: http://www.fao.org/3/X0490E/X0490E00.htm (accessed on 15 August 2019).
- Kay, M.; Hatcho, N. Small Scale Pumped Irrigation—Energy and Cost; FAO: Rome, Italy, 1992. [Google Scholar]
- Richards, M. PyETo—Pyeto 0.2 Documentation. Available online: https://pyeto.readthedocs.io/en/latest/index.html (accessed on 15 August 2019).
- Zaid, A.; Jiménez, E.J.A. Date Palm Cultivation. 2002. Available online: http://www.fao.org/3/Y4360E/y4360e0f.htm (accessed on 15 August 2019).
- Sonneveld, B.G.J.S.; Marei, A.; Merbis, M.D.; Alfarra, A. The future of date palm cultivation in the Lower Jordan Valley of the West Bank. Appl. Water Sci. 2018, 8. [Google Scholar] [CrossRef] [PubMed]
- Steduto, P.; Hsiao, T.; Fereres, E.; Raes, D. (Eds.) Crop Yield Response to Water; FAO irrigation and drainage paper; Food and Agriculture Organization of the United Nations: Rome, Italy, 2012; ISBN 978-92-5-107274-5. [Google Scholar]
- Rai, R.K.; Singh, V.P.; Upadhyay, A. Planning and Evaluation of Irrigation Projects: Methods and Implementation; Academic Press: London, UK, 2017; ISBN 978-0-12-811856-6. [Google Scholar]
- Fan, Y.; Li, H.; Miguez-Macho, G. Global patterns of groundwater table depth. Science 2013, 339, 5. Available online: https://science.sciencemag.org/content/sci/339/6122/940.full.pdf (accessed on 22 August 2019). [CrossRef] [PubMed]
- Mentis, D.; Howells, M.; Rogner, H.; Korkovelos, A.; Arderne, C.; Zepeda, E.; Siyal, S.; Taliotis, C.; Bazilian, M.; de Roo, A.; et al. Lighting the world: The first application of an open source, spatial electrification tool (OnSSET) on Sub-Saharan Africa. Environ. Res. Lett. 2017, 12, 085003. [Google Scholar] [CrossRef]
- UNECE, United Nations Economic Commission for Europe. First Regional Consultation Workshop: Assessing the Water-Food-Energy-Ecosystems Nexus in the North-Western Sahara Aquifer. Available online: https://www.unece.org/index.php?id=46930 (accessed on 22 August 2019).
- FAO, Food and Agriculture Organization of the United Nations. Irrigation Water Management: Irrigation Scheduling. Annex I: Irrigation Efficiencies. 1989. Available online: http://www.fao.org/3/t7202e/t7202e08.htm (accessed on 18 October 2018).
- UNSTAT, United Nations Statistics Division. The 2016 Energy Balances. Available online: https://unstats.un.org/unsd/energystats/pubs/balance/ (accessed on 20 September 2019).
- IEA, International Energy Agency. World Energy Outlook 2018; International Energy Agency: Paris, France, 2018; Available online: https://www.oecd-ilibrary.org/docserver/weo-2018-en.pdf?expires=1548868703&id=id&accname=oid023441&checksum=29C9DBE4AC57F47F8F5EB69CF00D3859 (accessed on 30 January 2019).
- WB, World Bank. Energy Sector Management Assistance Program (ESMAP). Available online: https://esmap.org/node/3633 (accessed on 5 August 2019).
- WB, World Bank. Pump Price for Diesel Fuel (US$ per liter)|Data. Available online: https://data.worldbank.org/indicator/EP.PMP.DESL.CD?end=2016&locations=DZ-TN-LY&start=2016&view=bar (accessed on 5 August 2019).
- WB, World Bank. Electricity Tariffs Power Outages and Firm Performance. 2017. Available online: http://pubdocs.worldbank.org/en/444681490076354657/Electricity-Tariffs-Power-Outages-and-Firm-Performance.pdf (accessed on 5 August 2019).
- IRENA, International Renewable Energy Agency. Renewable Energy Technologies: Cost Analysis Series, Wind Power; Renewable energy technologies; International Renewable Energy Agency: Abu Dhabi, UAE, 2012; Available online: https://www.irena.org/documentdownloads/publications/re_technologies_cost_analysis-wind_power.pdf (accessed on 5 August 2019).
- Gager, E.; Lahham, N.; The Impact of Solar Pumping in Tunisia. Presented at the Webinar MEN-REM Task Force Nexus. 2019. Available online: www.water-energy-food.org (accessed on 5 August 2019).
- IRENA, International Renewable Energy Agency. Renewable Energy Technologies: Cost Analysis Series, Solar Photovoltaics; International Renewable Energy Agency: Abu Dhabi, UAE, 2012; Available online: https://www.irena.org/-/media/Files/IRENA/Agency/Publication/2012/RE_Technologies_Cost_Analysis-SOLAR_PV.pdf (accessed on 5 August 2019).


| Parameter | Algeria | Tunisia | Libya |
|---|---|---|---|
| Country area (km2) | 2,381,741 | 163,610 | 1,759,540 |
| Country area in the basin (km2) | 700,000 | 80,000 | 250,000 |
| Share of the national territory in the NWSAS (%) | 29 | 49 | 14 |
| Share of NWSAS (%) | 68 | 8 | 24 |
| Growing Cycle | Dates | Vegetable | Olives | |
|---|---|---|---|---|
| Planting | init_start | 01/11 | 01/11 | 01/03 |
| init_end | 30/03 | 25/11 | 30/03 | |
| Kc ini | 0.56 | 0.5 | 0.45 | |
| Growing | dev_start | 31/03 | 26/11 | 31/03 |
| dev_end | 04/05 | 31/12 | 30/06 | |
| mid_start | 05/05 | 01/01 | 01/07 | |
| mid_end | 30/09 | 07/02 | 31/08 | |
| Kc mid | 0.7 | 1 | 0.55 | |
| Harvesting | late_start | 01/10 | 08/02 | 01/09 |
| late_end | 31/10 | 28/02 | 30/11 | |
| Kc end | 0.56 | 0.8 | 0.6 | |
| Sources | [40,41] | [37] | [42] | |
| Distribution in the NWSAS provinces (% of irrigated cropland area) Based on consultation with local experts from countries. | In most provinces: Date Palm (50%) and Vegetables (50%) except: Gharyan (Libya): Olives (70%) and vegetables (30%) Jufrah (Libya): Dates (70%) and Vegetables (30%) | |||
| # | Country | Technologies Compared |
|---|---|---|
| 1 | Algeria | Diesel pumps, stand-alone PV and small-scale wind turbines. |
| 2 | Libya | Electric pumps (grid-connected), stand-alone PV and small-scale wind turbines. |
| 3 | Tunisia | Diesel pumps, stand-alone PV and small-scale wind turbines. |
| Technologies | Parameter | Units | Sensitivity Levels | Source | ||
|---|---|---|---|---|---|---|
| 1 | 2 | 3 | ||||
| Diesel Gen sets | Capital Cost (CAPEX) | USD/KW | 938 | 938 | 938 | [50] [51] |
| O & M | USD/KWh | 0.1 | 0.1 | 0.1 | ||
| Life Time | Years | 10 | 10 | 10 | ||
| Fuel Cost (Diesel, Algeria) | USD/Litre | 0.17 | 0.21 | 0.26 | ||
| Fuel Cost (Diesel, Tunisia) | USD/Litre | 0.62 | 0.78 | 0.93 | ||
| Electric Pump | Capital Cost (CAPEX) | USD/KW | 845 | 845 | 845 | [50] [52] |
| O & M | USD/KWh | 0.1 | 0.1 | 0.1 | ||
| Life Time | Years | 10 | 10 | 10 | ||
| Fuel cost (Electricity, Libya) | USD/KWh | 0.168 | 0.21 | 0.252 | ||
| Wind | Capital Cost (CAPEX) | USD/KW | 1300 | 1105 | 910 | [53] |
| O & M | USD/KWh | 0.02 | 0.02 | 0.02 | ||
| Life Time | Years | 20 | 20 | 20 | ||
| PV | Capital Cost (CAPEX) | USD/KW | 1140 | 970 | 680 | [54,55] |
| O & M | USD/KWh | 0.01 | 0.01 | 0.01 | ||
| Life Time | Years | 15 | 15 | 15 | ||
© 2020 by the authors. Licensee MDPI, Basel, Switzerland. This article is an open access article distributed under the terms and conditions of the Creative Commons Attribution (CC BY) license (http://creativecommons.org/licenses/by/4.0/).
Share and Cite
Almulla, Y.; Ramirez, C.; Pegios, K.; Korkovelos, A.; Strasser, L.d.; Lipponen, A.; Howells, M. A GIS-Based Approach to Inform Agriculture-Water-Energy Nexus Planning in the North Western Sahara Aquifer System (NWSAS). Sustainability 2020, 12, 7043. https://doi.org/10.3390/su12177043
Almulla Y, Ramirez C, Pegios K, Korkovelos A, Strasser Ld, Lipponen A, Howells M. A GIS-Based Approach to Inform Agriculture-Water-Energy Nexus Planning in the North Western Sahara Aquifer System (NWSAS). Sustainability. 2020; 12(17):7043. https://doi.org/10.3390/su12177043
Chicago/Turabian StyleAlmulla, Youssef, Camilo Ramirez, Konstantinos Pegios, Alexandros Korkovelos, Lucia de Strasser, Annukka Lipponen, and Mark Howells. 2020. "A GIS-Based Approach to Inform Agriculture-Water-Energy Nexus Planning in the North Western Sahara Aquifer System (NWSAS)" Sustainability 12, no. 17: 7043. https://doi.org/10.3390/su12177043