Abstract
Short-Term Load Forecasting (STLF) is the most appropriate type of forecasting for both electricity consumers and generators. In this paper, STLF in a Microgrid (MG) is performed via the hybrid applications of machine learning. The proposed model is a modified Support Vector Regression (SVR) and Long Short-Term Memory (LSTM) called SVR-LSTM. In order to forecast the load, the proposed method is applied to the data related to a rural MG in Africa. Factors influencing the MG load, such as various household types and commercial entities, are selected as input variables and load profiles as target variables. Identifying the behavioral patterns of input variables as well as modeling their behavior in short-term periods of time are the major capabilities of the hybrid SVR-LSTM model. To present the efficiency of the suggested method, the conventional SVR and LSTM models are also applied to the used data. The results of the load forecasts by each network are evaluated using various statistical performance metrics. The obtained results show that the SVR-LSTM model with the highest correlation coefficient, i.e., 0.9901, is able to provide better results than SVR and LSTM, which have the values of 0.9770 and 0.9809, respectively. Finally, the results are compared with the results of other studies in this field, which continued to emphasize the superiority of the SVR-LSTM model.
1. Introduction
Increasing the number of electrical energy consumers has caused problems, such as reduced reliability and stability in traditional power systems. To face such problems and better demand response, power systems must increase their generation capacity. However, there are other problems, such as increased fossil fuel consumption and environmental pollutions [1,2]. As the energy crisis and the environmental crisis become more serious, Distributed Generations (DGs), as the main forms of Renewable Energy Sources (RESs), have attracted much attention in issues related to energy management and sustainability of the power systems. In addition, efforts have been made to design a new type of power systems called smart grids for more energy-efficient management [3]. The main aim of the smart grid in power systems is energy management by the data corresponding to energy consumption/production via smart meters. Energy management in power grids reduces costs for the consumers and improves the reliability of the power supply. The concept of the smart grid is mainly comprised of a Microgrid (MG) as the main component [4,5].
An MG is a small regional unit of power systems whose energy generation and consumption are independent of macrogrids. Energy consumers in MGs, in addition to consuming energy, can also play a role in generating energy by small-scale energy generation sources. Such energy consumers are called prosumers. However, these customers can also be sellers if they are involved in energy generation. This means new electricity markets, such as trading between the prosumers, can be created in an MG, and unlike the available power systems, bidirectional energy transmission becomes necessary [6]. Awareness of MG energy consumption can provide more information to electricity consumers and generators so that they can have proper scheduling for balance, intraday, and day-ahead markets. However, energy management in an MG can be achieved for electricity consumers and generators. Achieving a sustainable energy system in the MG requires intelligent energy management. Load forecasting can be considered as one of the most important solutions to energy management in power systems, especially in MGs [7,8,9].
Consumed electrical load forecasting is one of the most important factors that can provide useful information to power systems operators to manage and save energy. Load forecasting is not the only goal in the operation and decision-making development of distribution network infrastructure. Rather, accurate forecasting of electricity network demand is a critical and decisive tool in making short-term decisions in network operation and long-term decisions in planning the development of electricity network infrastructure [10,11].
Load forecasting can be performed in various time horizons, such as short-term (one to several days), medium-term (one week to several months), and long-term (several years) predictions for forecasting in power systems studies. However, short-term horizons are considered mainly for the optimal operation of MGs and participation in the electricity market. MG operators can utilize short-term forecast results to provide appropriate pricing in the electricity market, as well as economic load distribution and energy management at the MG level for optimal operation [12,13]. Therefore, the more accurate the consumed load forecasting on the horizon ahead, the more savings are expected to be made in the operating costs of MGs and energy supply to consumers.
Recently, a wide diversity of methods has been suggested and implemented to solve the load forecasting issues. These approaches can be categorized into (1) persistence models, (2) statistics, (3) Artificial Neural Networks (ANNs), (4) Machine Learning, and (5) some hybrid approaches. A linear regression model in [14] is utilized to forecast the hourly load. The structure of the performed solution is obtained using trial and error, which is not a logical and reliable method. In [15], Short-Term Load Forecasting (STLF) is performed via a regression-based window. Choosing the exact window has a significant impact on the forecast results, and this window must be selected correctly. In [16], the persistence solution predicts the MG load in the same way (regression-based window). A Kalman filter-based model is presented in [17] for forecasting short-term household load demand. The Autoregressive Integrated Moving Average (ARIMA) model in [18] is selected for STLF. In [19], short-term load for an MG is forecasted using a Seasonal ARIMA (SARIMA) model. Similarly, other models, such as modified Autoregressive Moving Average (ARMA) and ARMA with Exogenous Variables (ARMAX) is proposed in [20,21,22] for STLF. However, due to the nonlinear features of the load, the aforementioned methods suffered from issues, such as not having enough capacity to handle the nonlinear properties of load, and are not capable of providing accurate results in load forecasting.
Later, the applications of ANN, machine learning hybrid models are utilized as an efficient tool to deal with the nonlinear features of the load. In this regard, solutions, such as backup machining and the Seasonality-Adjusted Support Vector Machines (SSA-SVM) in [23,24,25] are utilized for STLF. The models used in these studies sometimes do not reach ideal results due to the high-dimensional input data. In some other studies, issues with these models are improved using optimization algorithms. These models include optimized-SVM by Particle Swarm Optimization (PSO) [26], Genetic Algorithm (GA) with SVM [27], SVM based on Firefly Algorithm (FFA) [28,29], optimized-SVM by Grasshopper Optimization Algorithm [30], Empirical Mode Decomposition (EMD) with PSO-SVM [31]. In some other studies related to STLF, the hybrid approaches of Wavelet Transform (WT) with Fruit Fly Optimization (FFO) based on the Least Square Support Vector Machine (LSSVM) are utilized [32,33]. Additionally, in [34], load forecasting for an MG is performed using a hybrid FFO-based General Regression Neural Networks (GRNN). In [35], a solution of SVM based on the Dragonfly Algorithm (DA-SVM) is suggested to forecast the short-term load of an MG located in an offshore oil field. A three-stage architecture based on Self-Organizing Map (SOM), K-Means algorithm, and a Multilayer Perceptron (MLP) is utilized in [36] for STLF in MGs. In [37], aggregated power load in community MG is forecasted via a developed model of a Deep Recurrent Neural Networks (DRNN) with Long Short-Term Memory (LSTM) units. To forecast load demand in MG, applications of deep learning is modeled based on a hybrid of Convolutional Neural Networks (CNN) and a Gated Recurrent Unit (GRU) called CNN-GRU in [38]. In addition, in [38], the proposed hybrid model is compared with other load forecast methods, such as CNN-LSTM, 2-Dimensional (2D) CNN, GRU, LSTM, ARMIA, k-Nearest Neighbor (kNN) and Neural Network Ensemble (NNE). A Bi-directional LSTM unit-based DRNN model called DRNN Bi-LSTM is proposed in [4] to supply precise aggregated electrical load demand and the forecasting of photovoltaic power production. An enhanced framework for energy management is introduced in [39] to efficiently investigate the uncertainties caused by climate change in an MG. The suggested framework utilizes a ten-stage Markov chain to produce stochastic solar radiation and a procedure based on recursive least-squares for effective participation in electricity market bidding programs. In [40], power generation forecasting at Lancaster University is performed via a hybrid model of Radial Basis Function (RBF) and K-Means clustering applications. In an MG energy management framework, the prediction of load demand, wind energy, and solar power generation is performed considering temperature, meteorological and historical data for different time horizons as input via the ANN and SVR (Support Vector Regression) techniques. In [41], Maximum Power Point Tracking (MPPT) is investigated in the installed photovoltaic arrays in an MG using a fuzzy control method. The MG load forecasting in the French metropolis considering power consumption data as output variables is performed by one of the deep learning applications called LSTM [42]. In this study, in order to improve the performance of the LSTM and provide highly accurate prediction results, a GA is used to optimize the parameters of the LSTM network. In order to decrease the total cost of operations and improve the energy efficiency in an MG [43], a hybrid PSO and Opposition-based learning Gravitational Search Algorithm (PSO-OGSA) is utilized to solve the optimization problem considering different constraints. Plug-in electric vehicle STLF is performed in a smart grid by the GRNN technique to perform energy management [44].
According to the above-mentioned literature on STLF in the MG, it is observed that there is a gap for improvement in this field by presenting various methods. Providing a solution that is capable of solving nonlinear load properties and acts highly efficient in dealing with high-dimensional data that have effects on network load can be a major step in tackling the load forecasting problem. Demand load forecasting of an MG is a time series operation and the main problem of previous methods is the inability to process time-series data. Despite offering many energy management solutions through load forecasting, many of them suffer from the need for meteorological data. Given that meteorological data are not always available for future time horizons, providing a procedure that can provide accurate forecast results for the network structure by solving this problem can be an important step in load forecasting and energy management.
In this paper, data related to time series and their behavioral pattern are processed to forecast the MG load in the short term by one of the machine learning approaches called Support Vector Regression-LSTM (SVR-LSTM). The proposed hybrid model is a combination of the SVR and LSTM methods. The SVR-LSTM is applied to data related to an urban MG in Sub-Saharan Africa. Due to its structure and high ability to process time-series data when they have a high dimensional, SVR-LSTM is capable of improving the problems of conventional solutions and providing high performance in forecasting results. In addition, the SVR and LSTM methods are applied to the same data to compare with the results provided by the SVR-LSTM. Finally, the forecasted load accuracy by the models presented in this paper is compared and evaluated with the results of other studies.
The continuation of this paper is organized as follows. Section 2 introduces the suggested solutions. The simulation results are presented in Section 3. Section 4 compares the forecasted load with the results of other studies. In Section 5, the discussions of the paper are presented. Section 6 concludes the paper.
2. Methodologies
2.1. Support Vector Regression (SVR)
SVM was proposed in 1995 by Cortes and Vapnik as a machine learning method. SVM was applied to the problems of forecasting and dependency estimation [45]. The SVR utilizes the same origins as the SVM for regression and function approximation with some minor differences [40,41,46,47,48]. The principle advantage of SVR is to solve regression issues and forecast future values. Among the various versions of the SVR, the classic model (-SVR) that is mainly used in engineering and also employed in this paper [10,49]. In -SVR, the goal is finding a flat function, which maps the input data to output data with an error less than .
Consider the following function that maps the input data to the output data , where and .
where b is the bias and w controls the flatness of the function, where the higher flatness level seeks smaller w, denotes a linear function that fits input space to the feature space [45].
The above-mentioned problem can be modeled as the following convex optimization problem.
where each is either −1 or +1 indicating the class to which the corresponding input point belongs.
To deal with the infeasible constraints of the optimization issue in Equation (2), slack variables, i.e., and , can be presented. Hence, Equation (2) can be restated as [10]:
where i shows the number of input data, N is the number of the last instance of the input data, is a trade-off among the smoothness of and the permissible deviation greater than . To extend the formulation for nonlinear functions, the dual problem of Equation (3) can be derived using Lagrangian multipliers, i.e., , , , and , forming the Lagrange function as follows [10]:
After solving the dual problem function, can be derived as follows:
Finally, to make the algorithm nonlinear, the training pattern, , can be mapped into some feature space . In doing so, can be rewritten as follows [49]:
where is the Kernel function.
The objective is to find a smooth function in feature space instead of input space. The main structure of the SVR is displayed in Figure 1.
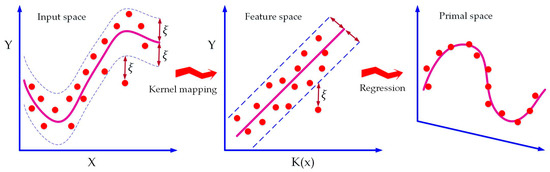
Figure 1.
The main structure of the SVR.
2.2. Long Short Term Memory (LSTM)
LSTM was suggested in 1997 by Hochreiter and Schmidhuber as a standard type of Recurrent Neural Networks (RNN) for learning and processing long-term information, time-series data, feature extraction, and pattern recognition [50,51]. The problems of gradient vanishing and the explosion of long-term dependencies have been improved by replacing the LSTM with basic hidden neurons in the RNN structure. As shown in Figure 2, the LSTM includes the forget gate, input gate, update gate, and output gate in the principle structure [52]. The LSTM network implements temporary memory through switch gates to prevent gradient vanishing. The main computation formula of the LSTM is as follows [52,53]:
where , , , and determine the output values of the forget, input, update, and output gates, respectively, , , , and demonstrate the weight metrics, , , , and illustrate the bias vectors, and show the memory cell and sigmoid activation function, respectively. In addition, the inputs of the four gates contain the LSTM target value at a past time step .
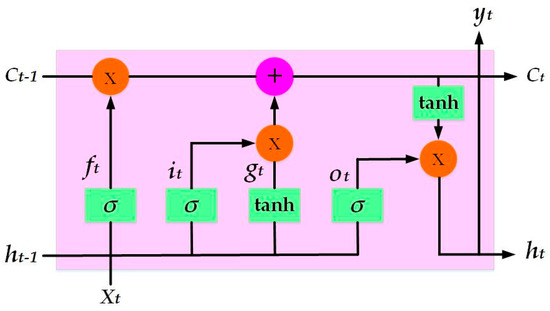
Figure 2.
The principle structure of LSTM.
2.3. Structure of the SVR-LSTM Model
Both SVR and LSTM methods have acceptable features for processing data and predicting their future values. The SVR extracts the relationship between input and output variables by creating a linear mapping. The LSTM can also estimate their behaviors well in the future by recollecting the long-term behavior of the data. The combination of these two models can estimate the long-term load demand behavior of an MG in the short term and with a high correlation coefficient. Figure 3 shows the hybrid structure of the SVR-LSTM model in this paper. As shown in the figure, periodic features are utilized as the SVR inputs (named SVR 1s) to calculate a series of initial values of the load. The recently observed actual value is selected as a time series. The steady series and time series are examples of abnormal features used as SVR (called SVR 2) and LSTM inputs. Oy1 and Oy2 are the outcomes of SVR 2 and LSTM, respectively. The combination of Oy1 and Oy2 predicts the final output of the SVR-LSTM model [53,54].
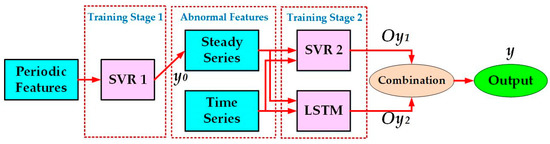
Figure 3.
Structure of the SVR-LSTM model.
Figure 4 shows the flowchart for training and forecasting the SVR-LSTM model. () is a sample set of input data containing abnormal features. represents the sample set utilized for SVR 1 training. shows the sample set selected to estimate and gain steady series for abnormal characteristics in the . is used for SVR 2 and LSTM training. is also intended for the LSTM training and the SVR 2 and LSTM based forecasting. The start times for , , and are indicated by , , and , respectively. The time periods for and are also denoted by and , respectively. is the end time of . After forming and designing the structure of the proposed model, the SVR 1 is trained based on and produces a steady series based on . Then, the abnormal characteristics including steady series and time series are added to . These processes are repeated until sufficient samples for are generated [53,54].
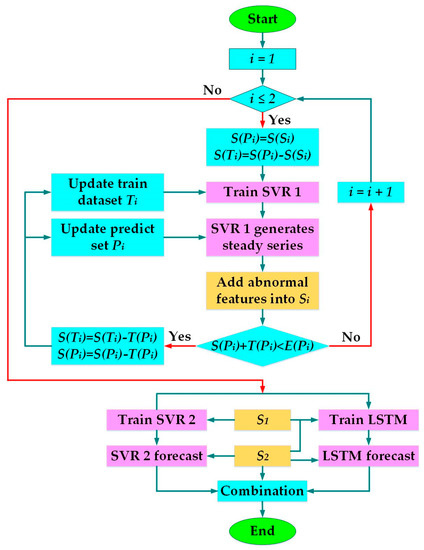
Figure 4.
Flowchart of the SVR-LSTM training and prediction.
3. Simulation Results
Using the learning methods, such as SVR and LSTM, to forecast the MG load requires a database including input and output variables. The dataset used in this paper is a freely available dataset related to the load profile of a rural MG in Sub-Saharan Africa [55]. Access to electricity for South African citizens, including rural residents, is a human rights issue guaranteed by government policies. However, many remote rural areas suffer from some problems, such as the high cost of connecting to the central grid and the lack of adequately supplying the load demand. A practical approach to solving these problems and connecting rural communities to a sustainable electricity source using the MG solutions is proposed [56]. For this reason, this paper focuses on energy management and achieving sustainable energy in an MG in South Africa. In this dataset, the MG load is obtained from the total household and commercial load, regardless of weather conditions. The household load is modeled by characteristics, such as the number of households, the percentage of the high-income, medium-income, and low-income households. Various commercial entities, such as water pumping for irrigation, grain milling, small shops, schools, clinics, and street lighting, are also used to model the commercial load. All modeling is performed hourly and within an hour [55]. For instance, Figure 5 shows the two samples of 24-h MG load profiles that are generated under different conditions by the input variables. Table 1 shows the values for the input variables in each instance of the illustrated load profiles in Figure 5.
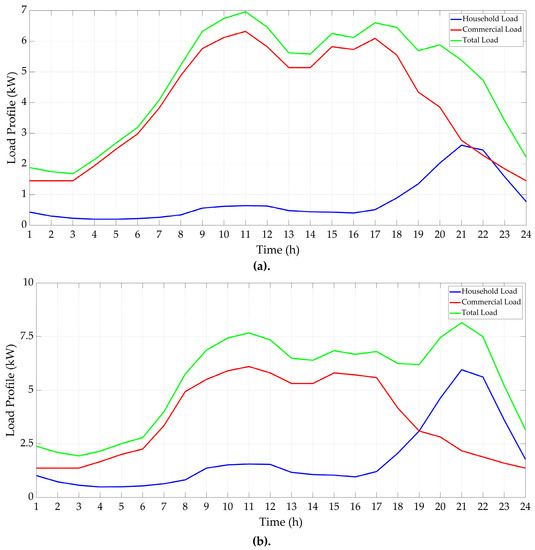
Figure 5.
Samples of 24-h MG load profile: (a) A low-population MG with the same income percentage for households, and (b) A populous MG with high-income households.

Table 1.
Input variables in each instance of the illustrated load profiles in Figure 5 and their corresponding values.
In this paper, the utilized dataset for each of the networks contains 240 samples of 24-h load profiles. Given that the objective of this paper is to perform short-term MG load forecasting, the input variables related to each hour are considered as an input sample, and the amount of the load related to that hour is selected as its output variable. Finally, a matrix of 5760×11 forms the input matrix. Each column of this matrix corresponds to each of the factors affecting the amount of the MG load. For each network, 70% of the data is selected for training, and the rest is for testing the network. Each network that can estimate an exact communication between input and target variables in the training phase can pass this phase with high accuracy. High competency in the training phase can also generate better and more accurate results in the test phase.
Evaluating the results of the training and test process introduces the capability and efficiency of each network. The more and better the forecasted results are evaluated with the statistical performance metrics, the accuracy of the results, and the effectiveness of the prediction models can be determined.
In this paper, statistical performance metrics, such as correlation coefficient (R), Mean Square Error (MSE), Root Mean Square Error (RMSE), Mean Absolute Error (MAE), and Mean Absolute Percentage Error (MAPE) are introduced and utilized to assess the results. Those metrics are calculated as follows [10]:
where and demonstrate the real and forecasted values of the load, respectively, and and are the mean of the real and forecasted values of the load, respectively.
Each of such metrics represents a specific concept of evaluation of results. R demonstrates the correlation coefficient between the actual and forecasted values of the designed model. MSE depicts the mean of the squares of the errors, which is the mean squared division between actual and forecasted values of the designed model. RMSE is a quadratic error metric and illustrates the standard deviation of errors. MAE shows the mean distance between the actual and forecasted values. MAPE is often utilized in regression and time-series issues to calculate the accuracy of forecasts. The best state to evaluate the results using such metrics is the maximum value for R and the minimum values for predictive error evaluation metrics [4].
Given that forecasts are made separately for the input variables for each hour of the day, networks needed to be well-trained to be able to model the MG load behavior for future forecasts. Designed networks are trained using specific data so that they can identify patterns underlying the behavior of input variables. Figure 6 shows the training phase results for each of the networks.
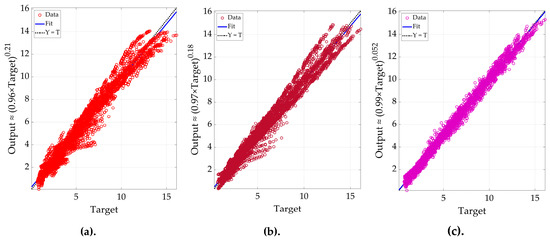
Figure 6.
Training phase results for networks: (a) SVR (Training: R = 0.9813), (b) LSTM (Training: R = 0.9852), and (c) SVR-LSTM (Training: R = 0.9956).
The evaluation of the results in Figure 6 is performed using the R metric. Thus, the results presented in this figure express the ability and effectiveness of the hybrid SVR-LSTM method. However, in general, each of the networks is able to pass the training phase with acceptable accuracy, despite the differences in the results. Figure 7 shows the training phase errors for each network in the MSE and RMSE formats. Table 2 compares and evaluates the results of the training phase for each network using other statistical performance metrics.
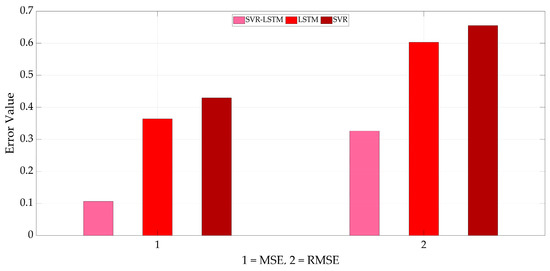
Figure 7.
Training phase errors for each network in the MSE and RMSE formats.
Table 2.
Evaluation of the results of the used networks in the training phase.
The results of short-term MG load forecasting for each of the proposed models and training data are evaluated using a variety of statistical metrics. As the forecasting error of the SVR-LSTM model is less than the conventional SVR and LSTM models and has a high correlation, the evaluation results indicate the efficiency of this hybrid model. Trained networks can be used as a toolbox to predict (1) new data, which is related to the future or at any time, and (2) test data, which is used at any time to forecast new data in the future. In the next step, test data are used to validate the training of each network.
Figure 8 shows the results of short-term MG load forecasts by each network for test data. In using learning methods, test results are very important. Thus, the validity of the training phase depends on the test results. Figure 9; Figure 10 also illustrate the test data forecasting errors for each network in the forms of the MSE and RMSE, and in the form of histograms, respectively.
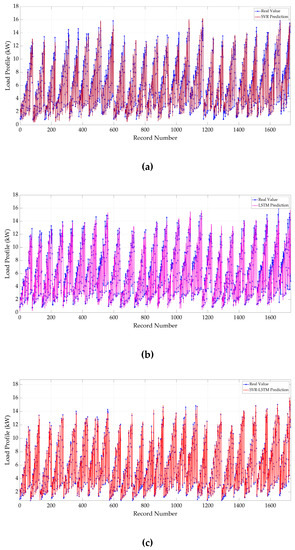
Figure 8.
Short-term load forecasts for MG by each network for test data; (a) SVR (Test: R = 0.9770), (b) LSTM (Test: R = 0.9809), and (c) SVR-LSTM (Test: R = 0.9901).
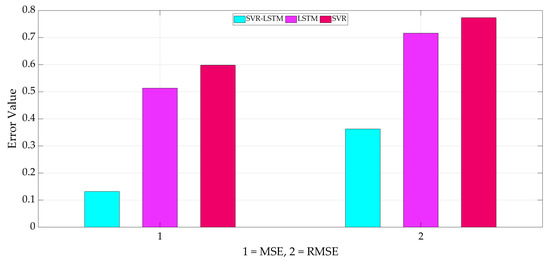
Figure 9.
Test data forecasting errors for each network in the forms of the MSE and RMSE.
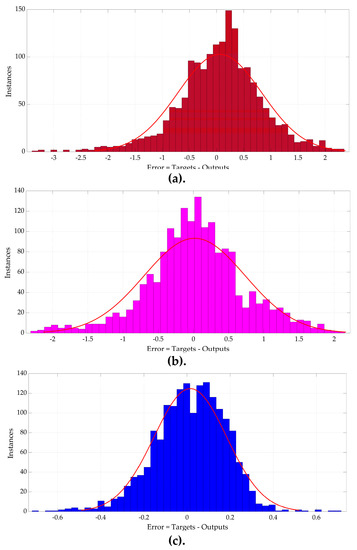
Figure 10.
Test data forecasting errors for each network in the form of histograms; (a) SVR ( = 0.05993 and = 0.77145), (b) LSTM ( = 0.017555 and = 0.71645), and (c) SVR-LSTM ( = 0.01523 and = 0.16857).
The results presented in the above figures, as in the training phase, show the efficiency of the hybrid SVR-LSTM procedure in short-term MG load forecasting. To better evaluate the results and efficiency of each of the utilized models in this study, Table 3 evaluates the test results with more statistical performance metrics.
Table 3.
Evaluation of the results of the used networks in the test phase.
In order to check the accuracy of each network in forecasting daily load on an hourly basis, a sample of forecasting test data is presented in Figure 11. This figure provides the accuracy and predictive error of each network clearly and visually for each hour of the day.
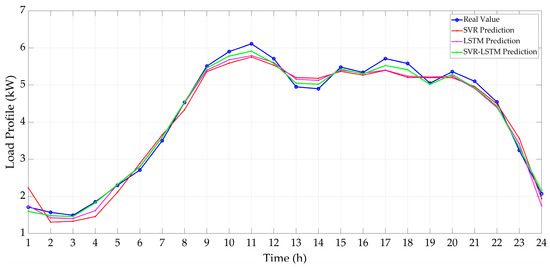
Figure 11.
A sample of an hourly daily load forecast in MG by each of the utilized networks.
The results presented in Table 3 show the efficiency of the saved networks in identifying new data, despite the validation of the training of each network. It is evident that the hybrid model of SVR-LSTM at this stage also has a good performance compared to the other two models. While comparing the two conventional models, LSTM is able to provide good results compared to the SVR for STLF in MG. The dependency of input variables on different hours of the day and following a specific behavioral pattern makes time series-based methods efficient. The proposed hybrid model can predict the demand load for each hour of the future days. However, it is possible to provide proper scheduling for electricity consumers and generators in the MG so that they can properly be managed and participate in the electricity market with proper planning.
4. Comparison of the Performance of the Proposed Method with the Results of Other Studies
Analyzing and comparing the results are the most important tasks in using learning methods while the performance of each model and the effectiveness of the data are obtained by evaluating and comparing various studies. A comparison of results should be performed with caution and for similar data. Most studies in this field have been conducted based on the impact of climate data, but meteorological data are not always available for the coming days. In this paper, STLF in MG is performed without considering climatic data, focusing on application conditions and electricity consumers and generators of an MG at any hour of the day. It should be noted that in using machine learning methods, selecting the appropriate method according to the available data is the most important part of the analysis. To represent the effectiveness of the suggested models in this paper, Table 4 compares the results of the methods used in this paper with the results of other studies. The comparison made in Table 4 demonstrates the efficiency and accuracy of the suggested hybrid model to forecast the short-term load in MG. In using machine learning applications, selecting the applicable model for load forecasting significantly affects the obtained results. In addition to forecasting the MG load in a short time horizon, the SVR-LSTM model is able to provide high accuracy in evaluating different statistical performance metrics compared to the models proposed and used in other studies.
Table 4.
Evaluation and comparison of the results of this paper with the results of other studies.
5. Discussion
The importance of energy management in MGs, especially in remote areas, has created many challenges. However, load forecasting programs have solved many of these issues. In this paper, by presenting a procedure that can accurately forecast the consumption load of an MG in a short-term horizon and without the need for meteorological information, the problems related to the load forecasting are solved. The proposed SVR-LSTM model is structured to cover many of the problems associated with high dimension data and data dependence on time series. The proposed model is capable of providing good performance even compared to solutions presented in other studies due to the generate an exact relationship between input and output variables in the time series. It should be noted that in using machine learning applications, especially for big data, choosing the exact method can be considered the most important stage of the project. Given that the MG is examined without the presence of RESs, for future work, issues related to RESs can also be added to solve the problem. Hence, the proposed method can be extended for the net load forecasting of MGs in the presence of RESs. Additionally, evaluating the effect of each of the input variables on the consumption load of the MG can be considered as a valuable work for future studies.
6. Conclusions
Forecasting the load of the Microgrid (MG) in a short-term horizon can be a very valuable achievement for the MG energy management system. Therefore, a new hybrid approach, namely Support Vector Regression-Long Short-Term Memory (SVR-LSTM) is presented in this paper for the MG load forecasting. Given that the suggested model is one of the applications of machine learning, it requires a dataset. Hence, in this paper, the SVR-LSTM is applied to the dataset related to the MG load in Sub-Saharan Africa. Surveys and data collection from the desired MG are performed without the presence of Renewable Energy Resources (RESs) in the MG and only included loads of household and commercial consumption. To present the efficiency of the designed method, the conventional SVR and LSTM models are also applied to the considered data. Designed networks are trained by the input variables to learn the behavioral patterns of the factors influencing the formation of the MG load. The forecasting results are analyzed using different statistical performance metrics. The results represent that the SVR-LSTM model with the highest value of correlation coefficient (i.e., R = 0.9901) and minimum error values is capable of providing better results than the SVR and LSTM. Among the two conventional methods, the LSTM with R = 0.9809 provides better results than the SVR with R = 0.9770. Finally, by presenting a comparative approach to the results presented in this paper with the results of other studies, the efficiency of the performed hybrid model of the SVR-LSTM is evaluated. It should be noted that the suggested model can be utilized for all available data for energy management and load forecasting problems.
Author Contributions
A.M.: writing—original draft, software, methodology, and data curation; S.Z.: methodology, investigation and validation, resources; M.S.: formal analysis, investigation and validation, conceptualization; B.M.-I. and F.M.: formal analysis, investigation and validation, conceptualization, writing—review and editing. All authors have read and agreed to the published version of the manuscript.
Funding
This research received no external funding.
Conflicts of Interest
The authors declare no conflict of interest.
References
- Moradzadeh, A.; Sadeghian, O.; Pourhossein, K.; Mohammadi-Ivatloo, B.; Anvari-Moghaddam, A. Improving residential load disaggregation for sustainable development of energy via principal component analysis. Sustainability 2020, 12, 3158. [Google Scholar] [CrossRef]
- Sadeghian, O.; Moradzadeh, A.; Mohammadi-Ivatloo, B.; Abapour, M.; Marquez, F.P.G. Generation units maintenance in combined heat and power integrated systems using the mixed integer quadratic programming approach. Energies 2020, 13, 2840. [Google Scholar] [CrossRef]
- Wang, Y.; Huang, Y.; Wang, Y.; Li, F.; Zhang, Y.; Tian, C. Operation optimization in a smart micro-grid in the presence of distributed generation and demand response. Sustainability 2018, 10, 847. [Google Scholar] [CrossRef]
- Yaprakdal, F.; Yilmaz, M.B.; Baysal, M.; Anvari-Moghaddam, A. A deep neural network-assisted approach to enhance short-term optimal operational scheduling of a microgrid. Sustainability 2020, 12, 1653. [Google Scholar] [CrossRef]
- Mohammadpourfard, M.; Weng, Y.; Pechenizkiy, M.; Tajdinian, M.; Mohammadi-Ivatloo, B. Ensuring cybersecurity of smart grid against data integrity attacks under concept drift. Int. J. Electr. Power Energy Syst. 2020, 119, 105947. [Google Scholar] [CrossRef]
- Jeong, G.; Park, S.; Hwang, G. Time Series Forecasting Based Day-Ahead Energy Trading in Microgrids: Mathematical Analysis and Simulation. IEEE Access 2020, 8, 63885–63900. [Google Scholar] [CrossRef]
- Shahryari, E.; Shayeghi, H.; Mohammadi-Ivatloo, B.; Moradzadeh, M. Optimal energy management of microgrid in day-ahead and intra-day markets using a copula-based uncertainty modeling method. J. Oper. Autom. Power Eng. 2020, 8, 86–96. [Google Scholar]
- Nguyen, T.T.; Pham, L.H.; Mohammadi, F.; Kien, L.C. Optimal Scheduling of Large-Scale Wind-Hydro-Thermal Systems with Fixed-Head Short-Term Model. Appl. Sci. 2020, 10, 2964. [Google Scholar] [CrossRef]
- Mohammadi, F.; Nazri, G.-A.; Saif, M. A bidirectional power charging control strategy for Plug-in Hybrid Electric Vehicles. Sustainability 2019, 11, 4317. [Google Scholar] [CrossRef]
- Moradzadeh, A.; Mansour-Saatloo, A.; Mohammadi-Ivatloo, B.; Anvari-Moghaddam, A. Performance evaluation of two machine learning techniques in heating and cooling loads forecasting of residential buildings. Appl. Sci. 2020, 10, 3829. [Google Scholar] [CrossRef]
- Hernandez, L.; Baladron, C.; Aguiar, J.M.; Carro, B.; Sanchez-Esguevillas, A.J.; Lloret, J.; Massana, J. A survey on electric power demand forecasting: Future trends in smart grids, microgrids and smart buildings. IEEE Commun. Surv. Tutor. 2014, 16, 1460–1495. [Google Scholar] [CrossRef]
- Tayab, U.B.; Zia, A.; Yang, F.; Lu, J.; Kashif, M. Short-term load forecasting for microgrid energy management system using hybrid HHO-FNN model with best-basis stationary wavelet packet transform. Energy 2020, 203, 117857. [Google Scholar] [CrossRef]
- Rodríguez, F.; Florez-Tapia, A.M.; Fontán, L.; Galarza, A. Very short-term wind power density forecasting through artificial neural networks for microgrid control. Renew. Energy 2020, 145, 1517–1527. [Google Scholar] [CrossRef]
- Hong, T.; Gui, M.; Baran, M.E.; Willis, H.L. Modeling and forecasting hourly electric load by multiple linear regression with interactions. In Proceedings of the IEEE PES General Meeting, Providence, RI, USA, 25–29 July 2010; IEEE: Piscataway, NJ, USA, 2010; pp. 1–8. Available online: https://ieeexplore.ieee.org/document/5589959 (accessed on 29 August 2020).
- Vu, D.H.; Muttaqi, K.M.; Agalgaonkar, A.P. Short-term load forecasting using regression based moving windows with adjustable window-sizes. In Proceedings of the 2014 IEEE Industry Application Society Annual Meeting, Vancouver, BC, Canada, 5–9 October 2014; IEEE: Piscataway, NJ, USA, 2014; pp. 1–8. Available online: https://ieeexplore.ieee.org/document/6978380 (accessed on 29 August 2020).
- Dutta, S.; Li, Y.; Venkataraman, A.; Costa, L.M.; Jiang, T.; Plana, R.; Tordjman, P.; Choo, F.H.; Foo, C.F.; Puttgen, H.B. Load and Renewable Energy Forecasting for a Microgrid using Persistence Technique. Energy Procedia 2017, 143, 617–622. [Google Scholar] [CrossRef]
- Zheng, Z.; Chen, H.; Luo, X. A Kalman filter-based bottom-up approach for household short-term load forecast. Appl. Energy 2019, 250, 882–894. [Google Scholar] [CrossRef]
- De Andrade, L.C.M.; da Silva, I.N. Very Short-Term Load Forecasting Based on ARIMA Model and Intelligent Systems. In Proceedings of the 2009 15th International Conference on Intelligent System Applications to Power Systems, Curitiba, Brazil, 8–12 November 2009; IEEE: Piscataway, NJ, USA, 2009; pp. 1–6. Available online: https://www.google.com/url?sa=t&rct=j&q=&esrc=s&source=web&cd=&cad=rja&uact=8&ved=2ahUKEwjb7Jbpq8LrAhXP2KQKHSYCB9YQFjABegQIARAC&url=http%3A%2F%2Fieeexplore.ieee.org%2Fdocument%2F5352829&usg=AOvVaw1JTp-WfTT0zI1FMbtKWq2B (accessed on 29 August 2020).
- Chakhchoukh, Y.; Panciatici, P.; Mili, L. Electric Load Forecasting Based on Statistical Robust Methods. IEEE Trans. Power Syst. 2011, 26, 982–991. [Google Scholar] [CrossRef]
- Huang, C.-M.; Huang, C.-J.; Wang, M.-L. A Particle Swarm Optimization to Identifying the ARMAX Model for Short-Term Load Forecasting. IEEE Trans. Power Syst. 2005, 20, 1126–1133. [Google Scholar] [CrossRef]
- Wang, B.; Tai, N.-l.; Zhai, H.-q.; Ye, J.; Zhu, J.d.; Qi, L.-b. A new ARMAX model based on evolutionary algorithm and particle swarm optimization for short-term load forecasting. Electr. Power Syst. Res. 2008, 78, 1679–1685. [Google Scholar] [CrossRef]
- Taylor, J.W. Short-Term Load Forecasting With Exponentially Weighted Methods. IEEE Trans. Power Syst. 2012, 27, 458–464. [Google Scholar] [CrossRef]
- Chen, B.-J.; Chang, M.-W.; Lin, C.-J. Load Forecasting Using Support Vector Machines: A Study on EUNITE Competition 2001. IEEE Trans. Power Syst. 2004, 19, 1821–1830. [Google Scholar] [CrossRef]
- Che, J.; Wang, J. Short-term load forecasting using a kernel-based support vector regression combination model. Appl. Energy 2014, 132, 602–609. [Google Scholar] [CrossRef]
- Hong, W.C. Electric load forecasting by support vector model. Appl. Math. Model. 2009, 33, 2444–2454. [Google Scholar] [CrossRef]
- Selakov, A.; Cvijetinović, D.; Milović, L.; Mellon, S.; Bekut, D. Hybrid PSO-SVM method for short-term load forecasting during periods with significant temperature variations in city of Burbank. Appl. Soft Comput. J. 2014, 16, 80–88. [Google Scholar] [CrossRef]
- Sun, W. A novel hybrid GA based SVM short term load forecasting model. In Proceedings of the 2009 2nd International Symposium on Knowledge Acquisition and Modeling, Wuhan, China, 30 November–1 December 2009; IEEE: Piscataway, NJ, USA, 2009; Volume 2, pp. 227–229. Available online: https://ieeexplore.ieee.org/document/5362081 (accessed on 29 August 2020).
- Kavousi-Fard, A.; Samet, H.; Marzbani, F. A new hybrid Modified Firefly Algorithm and Support Vector Regression model for accurate Short Term Load Forecasting. Expert Syst. Appl. 2014, 41, 6047–6056. [Google Scholar] [CrossRef]
- Barman, M.; Dev Choudhury, N.B. Season specific approach for short-term load forecasting based on hybrid FA-SVM and similarity concept. Energy 2019, 174, 886–896. [Google Scholar] [CrossRef]
- Barman, M.; Dev Choudhury, N.B.; Sutradhar, S. A regional hybrid GOA-SVM model based on similar day approach for short-term load forecasting in Assam, India. Energy 2018, 145, 710–720. [Google Scholar] [CrossRef]
- Wang, X.; Wang, Y. A Hybrid Model of EMD and PSO-SVR for Short-Term Load Forecasting in Residential Quarters. Math. Probl. Eng. 2016, 2016, 1–10. [Google Scholar] [CrossRef]
- Sun, W.; Ye, M. Short-Term Load Forecasting Based on Wavelet Transform and Least Squares Support Vector Machine Optimized by Fruit Fly Optimization Algorithm. J. Electr. Comput. Eng. 2015, 2015, 1–9. [Google Scholar] [CrossRef]
- Liu, J.; Li, C. The Short-Term Power Load Forecasting Based on Sperm Whale Algorithm and Wavelet Least Square Support Vector Machine with DWT-IR for Feature Selection. Sustainability 2017, 9, 1188. [Google Scholar] [CrossRef]
- Hu, R.; Wen, S.; Zeng, Z.; Huang, T. A short-term power load forecasting model based on the generalized regression neural network with decreasing step fruit fly optimization algorithm. Neurocomputing 2017, 221, 24–31. [Google Scholar] [CrossRef]
- Feng, Y.; Zhang, P.; Yang, M.; Li, Q.; Zhang, A. Short term load forecasting of offshore oil field microgrids based on DA-SVM. Energy Procedia 2019, 158, 2448–2455. [Google Scholar] [CrossRef]
- Hernández, L.; Baladrón, C.; Aguiar, J.M.; Carro, B.; Sánchez-Esguevillas, A.; Lloret, J. Artificial neural networks for short-term load forecasting in microgrids environment. Energy 2014, 75, 252–264. [Google Scholar] [CrossRef]
- Wen, L.; Zhou, K.; Yang, S.; Lu, X. Optimal load dispatch of community microgrid with deep learning based solar power and load forecasting. Energy 2019, 171, 1053–1065. [Google Scholar] [CrossRef]
- Afrasiabi, M.; Mohammadi, M.; Rastegar, M.; Kargarian, A. Multi-agent microgrid energy management based on deep learning forecaster. Energy 2019, 186, 115873. [Google Scholar] [CrossRef]
- Vincent, R.; Ait-Ahmed, M.; Houari, A.; Benkhoris, M.F. Residential microgrid energy management considering flexibility services opportunities and forecast uncertainties. Int. J. Electr. Power Energy Syst. 2020, 120, 105981. [Google Scholar] [CrossRef]
- Ma, J.; Ma, X. State-of-the-art forecasting algorithms for microgrids. In Proceedings of the ICAC 2017—2017 23rd IEEE International Conference on Automation and Computing: Addressing Global Challenges through Automation and Computing, Huddersfield, UK, 7–8 September 2017; IEEE: Piscataway, NJ, USA, 2017; pp. 1–6. Available online: https://eprints.lancs.ac.uk/id/eprint/88864/1/State_of_the_art_Forecasting_Algorithms_for_Microgrids_.pdf (accessed on 29 August 2020).
- Kim, J.C.; Huh, J.H.; Ko, J.S. Improvement of MPPT control performance using fuzzy control and VGPI in the PV system for micro grid. Sustainability 2019, 11, 5891. [Google Scholar] [CrossRef]
- Bouktif, S.; Fiaz, A.; Ouni, A.; Serhani, M.A. Optimal deep learning LSTM model for electric load forecasting using feature selection and genetic algorithm: Comparison with machine learning approaches. Energies 2018, 11, 1636. [Google Scholar] [CrossRef]
- Wu, X.; Cao, W.; Wang, D.; Ding, M. A Multi-Objective Optimization Dispatch Method for Microgrid Energy Management Considering the Power Loss of Converters. Energies 2019, 12, 2160. [Google Scholar] [CrossRef]
- Mansour-Saatloo, A.; Moradzadeh, A.; Mohammadi-Ivatloo, B.; Ahmadian, A.; Elkamel, A. Machine learning based PEVs load extraction and analysis. Electronics 2020, 9, 1–15. [Google Scholar]
- Ni, K.S.; Nguyen, T.Q. Image Superresolution Using Support Vector Regression. IEEE Trans. Image Process. 2007, 16, 1596–1610. [Google Scholar] [CrossRef]
- Mohammadi, F.; Zheng, C. Stability Analysis of Electric Power System. In Proceedings of the 4th National Conference on Technology in Electrical and Computer Engineering, Tehran, Iran, 27 December 2018. [Google Scholar]
- Mohammadi, F.; Nazri, G.A.; Saif, M. A Fast Fault Detection and Identification Approach in Power Distribution Systems. In Proceedings of the IEEE 5th International Conference on Power Generation Systems and Renewable Energy Technologies (PGSRET), Istanbul, Turkey, 26–27 August 2019. [Google Scholar]
- Cortes, C.; Vapnik, V. Support-Vector Networks. Mach. Learn. 1995, 20, 273–297. [Google Scholar] [CrossRef]
- Moradzadeh, A.; Pourhossein, K. Application of Support Vector Machines to Locate Minor Short Circuits in Transformer Windings. In Proceedings of the 2019 54th International Universities Power Engineering Conference, UPEC 2019—Proceedings, Bucharest, Romania, 3–6 September 2019; IEEE: Piscataway, NJ, USA, 2019; pp. 1–6. Available online: https://ieeexplore.ieee.org/document/8893542 (accessed on 29 August 2020).
- Hochreiter, S.; Schmidhuber, J. Long Short-Term Memory. Neural Comput. 1997, 9, 1735–1780. [Google Scholar] [CrossRef] [PubMed]
- Choi; Cho; Kim Power Demand Forecasting using Long Short-Term Memory (LSTM) Deep-Learning Model for Monitoring Energy Sustainability. Sustainability 2020, 12, 1109. [CrossRef]
- Wang, K.; Qi, X.; Liu, H. Photovoltaic power forecasting based LSTM-Convolutional Network. Energy 2019, 189. [Google Scholar] [CrossRef]
- Guo, J.; Xie, Z.; Qin, Y.; Jia, L.; Wang, Y. Short-Term Abnormal Passenger Flow Prediction Based on the Fusion of SVR and LSTM. IEEE Access 2019, 7, 42946–42955. [Google Scholar] [CrossRef]
- Zheng, Y.; Xie, M.; Wang, X. Research on Passenger Flow Forecast of Hangzhou Metro Based on LSTM-SVR. In Proceedings of the Proceedings—2019 International Conference on Artificial Intelligence and Advanced Manufacturing, AIAM 2019, Dublin, Ireland, 16–18 October 2019; pp. 273–276. Available online: https://ieeexplore.ieee.org/document/8950826 (accessed on 29 August 2020).
- Li, X.; Salasovich, J.; Reber, T. Microgrid Load and LCOE Modelling Results. National Renewable Energy Laboratory. 2018. Available online: https://data.nrel.gov/submissions/79 (accessed on 10 June 2020).
- Motjoadi, V.; Bokoro, P.N.; Onibonoje, M.O. A review of microgrid-based approach to rural electrification in South Africa: Architecture and policy framework. Energies 2020, 13, 2193. [Google Scholar] [CrossRef]


© 2020 by the authors. Licensee MDPI, Basel, Switzerland. This article is an open access article distributed under the terms and conditions of the Creative Commons Attribution (CC BY) license (http://creativecommons.org/licenses/by/4.0/).