Sustainable HRM through Improving the Measurement of Employee Work Engagement: Third-Person Rating Method


Abstract
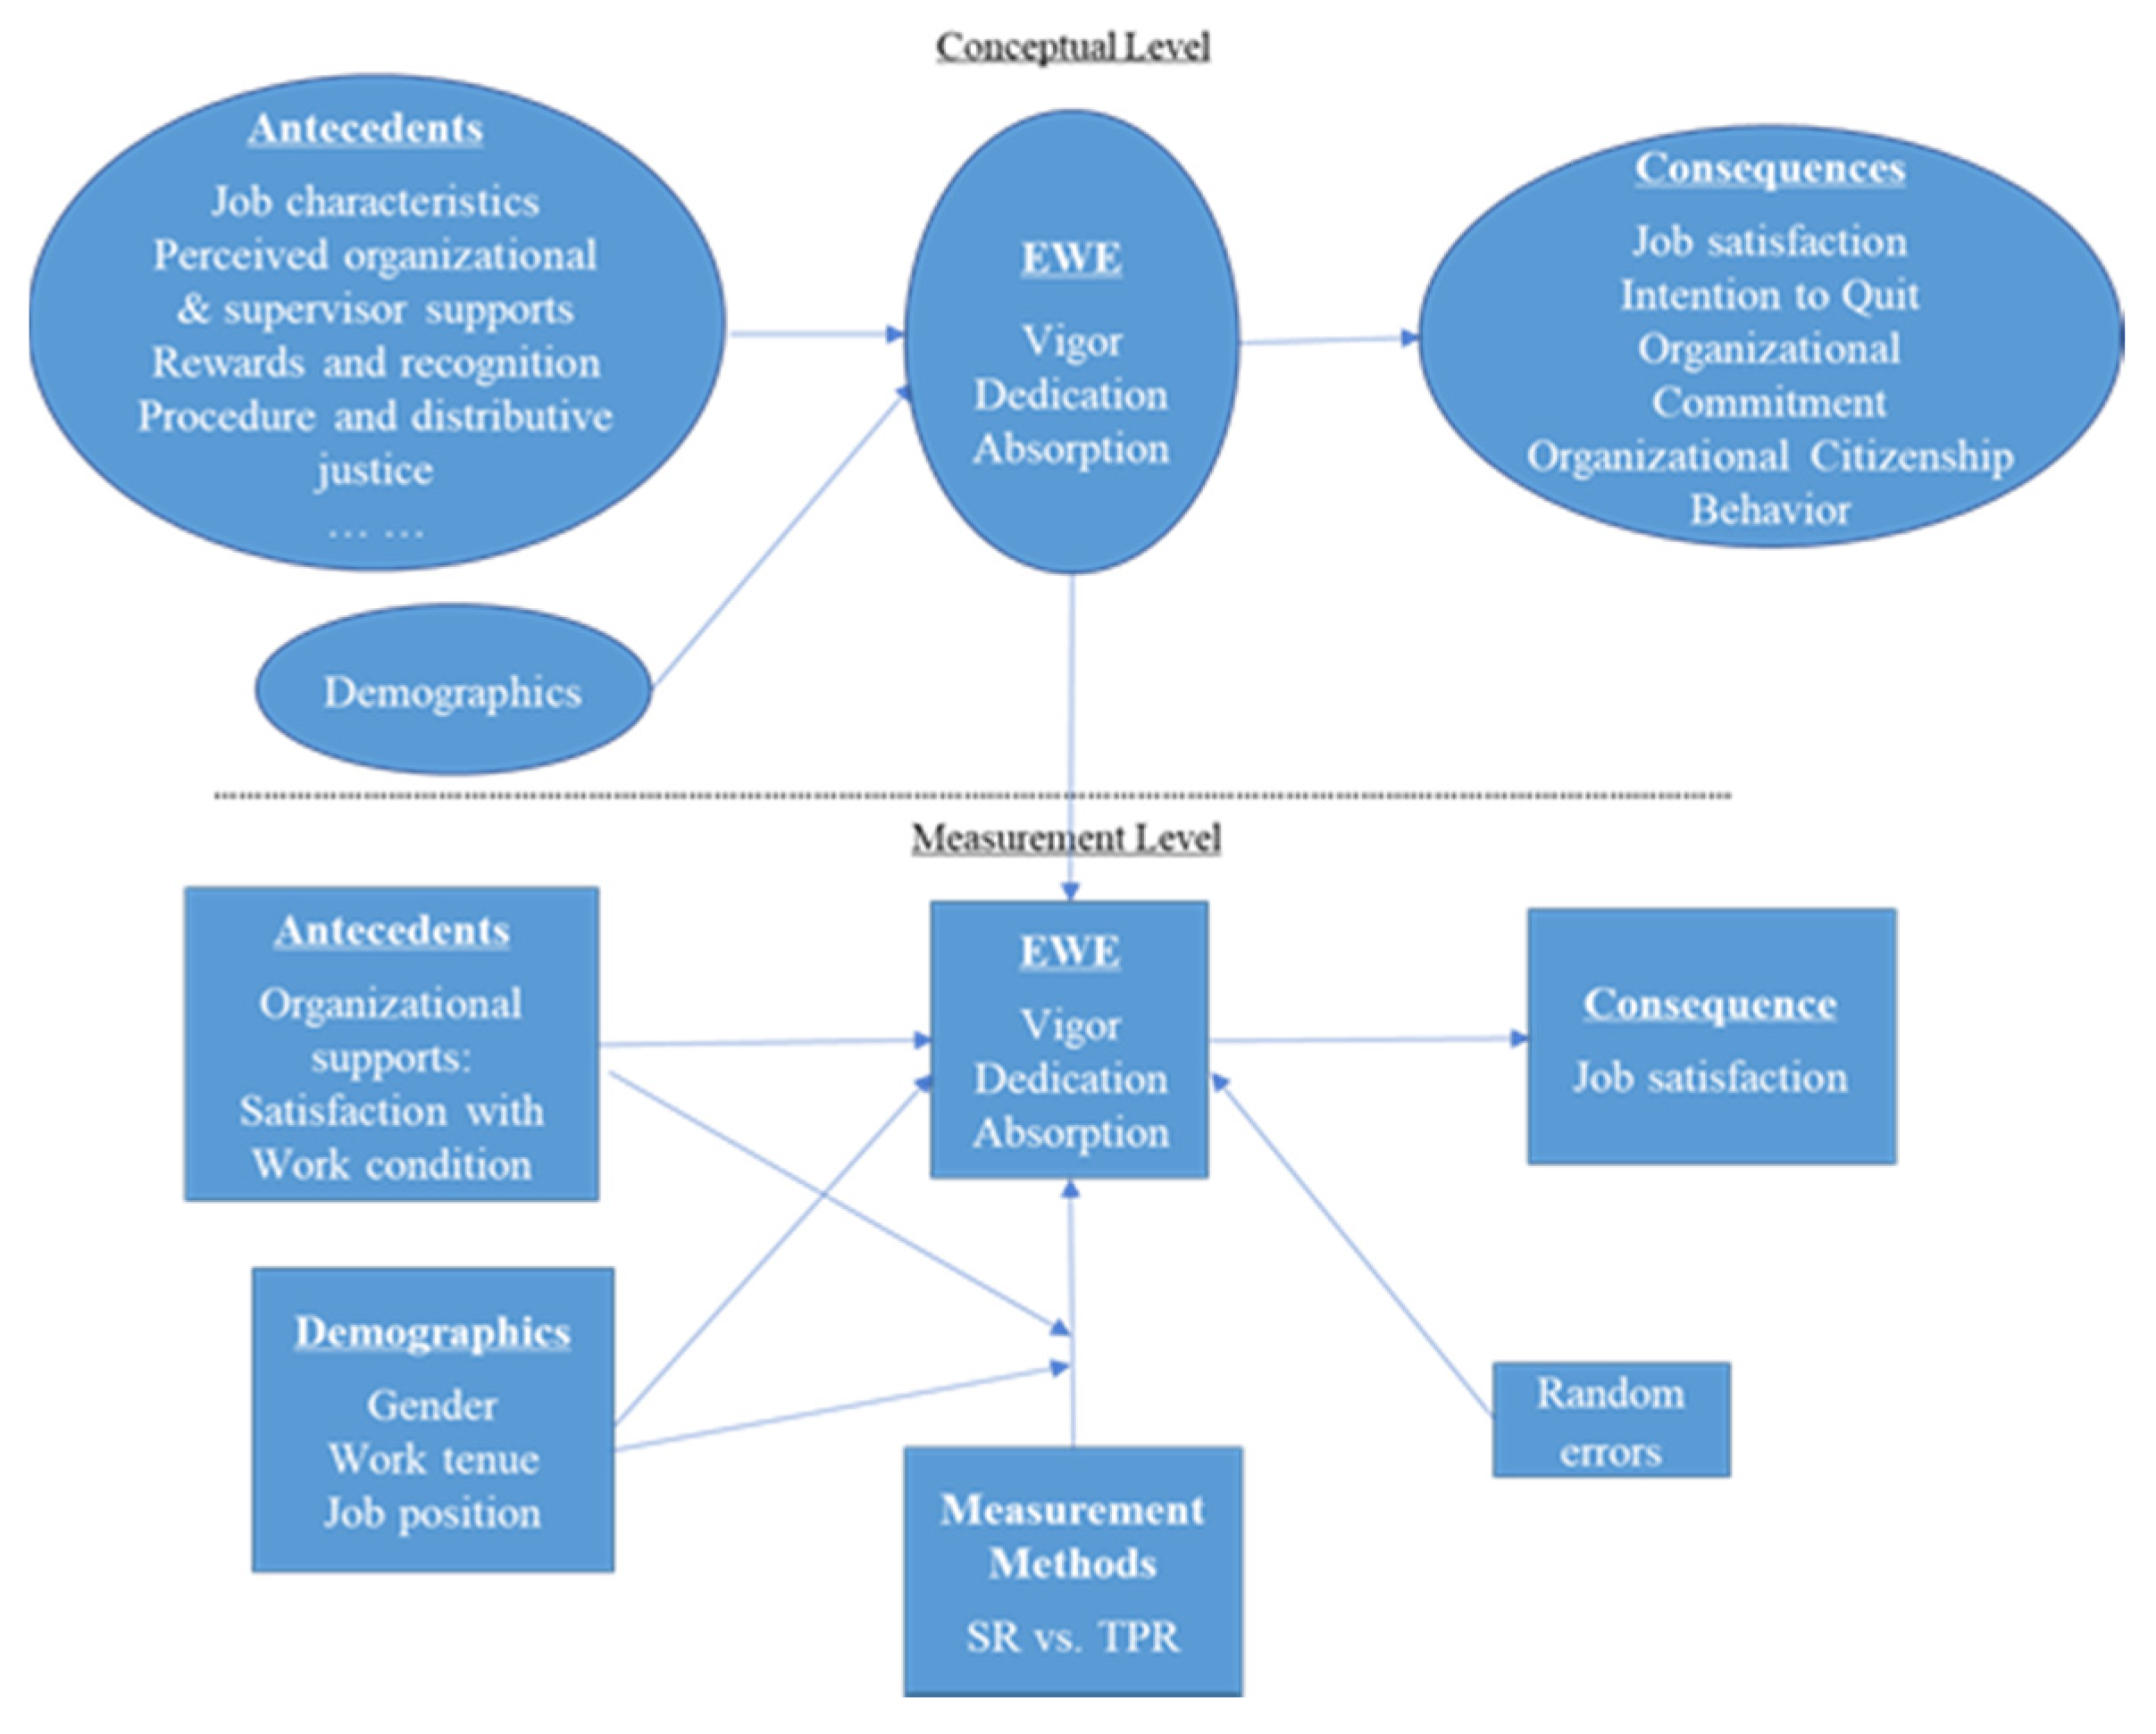
:1. Introduction
2. Literature Review
2.1. Work Engagement
2.2. Third-Person Technique
2.3. Third-Person Effect
3. Hypotheses Development
4. Method
4.1. Research Design and Setting
4.2. Sample and Procedure
4.3. Variable Measures
5. Results
5.1. Descriptive Statistics
5.2. Reliability, Validity, and Measurement Model Fit
5.3. Hypotheses Testing
6. Discussion
7. Conclusions
Author Contributions
Funding
Conflicts of Interest
References
- Ting, C.-T.; Hsieh, C.-M.; Chang, H.-P.; Chen, H.-S. Environmental Consciousness and Green Customer Behavior: The Moderating Roles of Incentive Mechanisms. Sustainability 2019, 11, 819. [Google Scholar] [CrossRef] [Green Version]
- Saura, J.R.; Reyes-Menendez, A.; Alonso, C. Álvarez Do Online Comments Affect Environmental Management? Identifying Factors Related to Environmental Management and Sustainability of Hotels. Sustainability 2018, 10, 3016. [Google Scholar] [CrossRef] [Green Version]
- United Nations. Department of Economic and Social Affairs: Sustainable Development. Available online: https://sdgs.un.org/goals (accessed on 1 August 2020).
- Ehnert, I.; Parsa, S.; Roper, I.; Wagner, M.; Müller-Camen, M. Reporting on sustainability and HRM: A comparative study of sustainability reporting practices by the world’s largest companies. Int. J. Hum. Resour. Manag. 2015, 27, 88–108. [Google Scholar] [CrossRef]
- Cain, L.; Busser, J.; Kang, H.J. Executive chefs’ calling: Effect on engagement, work-life balance and life satisfaction. Int. J. Contemp. Hosp. Manag. 2018, 30, 2287–2307. [Google Scholar] [CrossRef]
- Kaya, B.; Karatepe, O.M. Does servant leadership better explain work engagement, career satisfaction and adaptive performance than authentic leadership? Int. J. Contemp. Hosp. Manag. 2020, 32, 2075–2095. [Google Scholar] [CrossRef]
- Kahn, W. The essence of employee engagement: Lessons from the field. In Handbook of Employee Engagement: Perspectives, Issues, Research, and Practice; Albrecht, S.L., Ed.; Edward Elgar: Northampton, MA, USA, 2010; pp. 20–30. [Google Scholar]
- Maslach, C.; Schaufeli, W.B.; Leiter, M.P. Job Burnout. Annu. Rev. Psychol. 2001, 52, 397–422. [Google Scholar] [CrossRef] [Green Version]
- Saks, A.M. Antecedents and consequences of employee engagement. J. Manag. Psychol. 2006, 21, 600–619. [Google Scholar] [CrossRef] [Green Version]
- Ariza-Montes, A.; Arjona-Fuentes, J.M.; Han, H.; Law, R. Work environment and well-being of different occupational groups in hospitality: Job Demand–Control–Support model. Int. J. Hosp. Manag. 2018, 73, 1–11. [Google Scholar] [CrossRef]
- Kim, C.Y.; Lee, J.H.; Shin, S.Y. Why Are Your Employees Leaving the Organization? The Interaction Effect of Role Overload, Perceived Organizational Support, and Equity Sensitivity. Sustainability 2019, 11, 657. [Google Scholar] [CrossRef] [Green Version]
- Moyle, B.D.; Moyle, B.; Ruhanen, L.M.; Bec, A.; Weiler, B. Business Sustainability: How Does Tourism Compare? Sustainability 2018, 10, 968. [Google Scholar] [CrossRef] [Green Version]
- Szromek, A.R.; Kruczek, Z.; Walas, B. The Attitude of Tourist Destination Residents towards the Effects of Overtourism—Kraków Case Study. Sustainability 2019, 12, 228. [Google Scholar] [CrossRef] [Green Version]
- Trišić, I.; Štetić, S.; Privitera, D.; Nedelcu, A. Wine Routes in Vojvodina Province, Northern Serbia: A Tool for Sustainable Tourism Development. Sustainability 2019, 12, 82. [Google Scholar] [CrossRef] [Green Version]
- Shen, L.; Qian, J.; Chen, S.C. Effective Communication Strategies of Sustainable Hospitality: A Qualitative Exploration. Sustainability 2020, 12, 6920. [Google Scholar] [CrossRef]
- Martín, M.; Ángel, R.; Folgado-Fernández, J.A.; Palos-Sanchez, P.; Castejón-Jiménez, P. The Impact of the Environmental Quality of Online Feedback and Satisfaction When Exploring the Critical Factors for Luxury Hotels. Sustainability 2019, 12, 299. [Google Scholar] [CrossRef] [Green Version]
- Trafiałek, J.; Czarniecka-Skubina, E.; Kulaitienė, J.; Vaitkevičienė, N. Restaurant’s Multidimensional Evaluation Concerning Food Quality, Service, and Sustainable Practices: A Cross-National Case Study of Poland and Lithuania. Sustainability 2019, 12, 234. [Google Scholar] [CrossRef] [Green Version]
- Wikhamn, W. Innovation, sustainable HRM and customer satisfaction. Int. J. Hosp. Manag. 2019, 76, 102–110. [Google Scholar] [CrossRef]
- 8 Employee Engagement Statistics You Need to Know in 2020. 9 January 2020. Available online: https://blog.smarp.com/employee-engagement-8-statistics-you-need-to-know (accessed on 1 July 2020).
- State of the Global Workplace. 14 May 2019. Available online: https://www.gallup.com/workplace/257552/state-global-workplace-2017.aspx (accessed on 1 July 2020).
- De Cuyper, N.; Schreurs, B.; Elst, T.V.; Baillien, E.; De Witte, H. Exemplification and Perceived Job Insecurity. J. Pers. Psychol. 2014, 13, 1–10. [Google Scholar] [CrossRef]
- Stewart, S.M.; Bing, M.N.; Davison, H.K.; Woehr, D.J.; McIntyre, M.D. In the eyes of the beholder: A non-self-report measure of workplace deviance. J. Appl. Psychol. 2009, 94, 207–215. [Google Scholar] [CrossRef]
- Wilson, K. A Survey of Employment Engagement. Ph.D. Thesis, The Faculty of the Graduate School, University of Missouri-Columbia, Columbia, MO, USA, 2009. [Google Scholar]
- Podsakoff, P.M.; MacKenzie, S.B.; Podsakoff, N.P. Sources of Method Bias in Social Science Research and Recommendations on How to Control It. Annu. Rev. Psychol. 2012, 63, 539–569. [Google Scholar] [CrossRef] [Green Version]
- Schaufeli, W.B.; Bakker, A.B. UWES Utrecht Work Engagement Scale: Test manual. Utrecht University. 2003. Available online: www.Schaufeli.com (accessed on 20 October 2019).
- Ehnert, I.; Harry, W. Recent Developments and Future Prospects on Sustainable Human Resource Management: Introduction to the Special Issue. Manag. Rev. 2012, 23, 221–238. [Google Scholar] [CrossRef] [Green Version]
- Bondarouk, T.; Brewster, C.J. Conceptualising the future of HRM and technology research. Int. J. Hum. Resour. Manag. 2016, 27, 2652–2671. [Google Scholar] [CrossRef] [Green Version]
- Macke, J.; Genari, D. Systematic literature review on sustainable human resource management. J. Clean. Prod. 2019, 208, 806–815. [Google Scholar] [CrossRef]
- Macey, W.; Schneider, B. The meaning of employment engagement. Ind. Organ. Psychol. 2008, 1, 3–30. [Google Scholar] [CrossRef]
- Kahn, W.A. Psychological conditions of personal engagement and disengagement at work. Acad. Manag. J. 1990, 33, 321–349. [Google Scholar]
- Rich, B.L.; Lepine, J.A.; Crawford, E.R. Job Engagement: Antecedents and Effects on Job Performance. Acad. Manag. J. 2010, 53, 617–635. [Google Scholar] [CrossRef]
- Byrne, Z.S.; Peters, J.M.; Weston, J.W. The struggle with employee engagement: Measures and construct clarification using five samples. J. Appl. Psychol. 2016, 101, 1201–1227. [Google Scholar] [CrossRef] [PubMed]
- Shuck, B.; Adelson, J.L.; Reio, T.G. The Employee Engagement Scale: Initial Evidence for Construct Validity and Implications for Theory and Practice. Hum. Resour. Manag. 2016, 56, 953–977. [Google Scholar] [CrossRef]
- González-Romá, V.; Schaufeli, W.B.; Bakker, A.B.; Lloret, S. Burnout and work engagement: Independent factors or opposite poles? J. Vocat. Behav. 2006, 68, 165–174. [Google Scholar] [CrossRef]
- Joseph, D.L.; Newman, D.A.; Hulin, C.L. Job Attitudes and Employee Engagement: A Meta-Analysis of Construct Redundancy. In Academy of Manag. Proceedings; Academy of Management: New York, NY, USA, 2010; Volume 2010, pp. 1–6. [Google Scholar]
- Brayfield, A.H.; Rothe, H.F. An index of job satisfaction. J. Appl. Psychol. 1951, 35, 307–311. [Google Scholar] [CrossRef]
- Christian, M.; Garza, A.S.; Slaughter, J.E. Work Engagement: A Quantitative Review and Test of its Relations with Task and Contextual Performance. Pers. Psychol. 2011, 64, 89–136. [Google Scholar] [CrossRef] [Green Version]
- Baran, M.; Sypniewska, B. The Impact of Management Methods on Employee Engagement. Sustainability 2020, 12, 426. [Google Scholar] [CrossRef] [Green Version]
- Jung, H.S.; Yoon, H.H. How Does Workplace Romance Influence Employee Performance in the Hospitality Industry? Sustainability 2020, 12, 5478. [Google Scholar] [CrossRef]
- Grobelna, A. Effects of individual and job characteristics on hotel contact employees’ work engagement and their performance outcomes. Int. J. Contemp. Hosp. Manag. 2019, 31, 349–369. [Google Scholar] [CrossRef]
- Miao, S.; Rhee, J.; Jun, I. How Much Does Extrinsic Motivation or Intrinsic Motivation Affect Job Engagement or Turnover Intention? A Comparison Study in China. Sustainability 2020, 12, 3630. [Google Scholar] [CrossRef]
- Gigol, T. Influence of Authentic Leadership on Unethical Pro-Organizational Behavior: The Intermediate Role of Work Engagement. Sustainability 2020, 12, 1182. [Google Scholar] [CrossRef] [Green Version]
- Podsakoff, M.; MacKenzie, S.; Lee, J.Y. Common method biases in behavioral research: A critical review of the literature and recommended remedies. J. Appl. Psychol. 2003, 88, 879–903. [Google Scholar] [CrossRef]
- Ng, T.W.; Feldman, D.C. A comparison of self-ratings and non-self-report measures of employee creativity. Hum. Relat. 2012, 65, 1021–1047. [Google Scholar] [CrossRef]
- Fisher, R.J. Social Desirability Bias and the Validity of Indirect Questioning. J. Consum. Res. 1993, 20, 303–315. [Google Scholar] [CrossRef]
- Guilford, J.P. Psychometric Methods, 2nd ed.; McGraw-Hill: New York, NY, USA, 1954. [Google Scholar]
- Berry, C.M.; Carpenter, N.C.; Barratt, C.L. Do other-reports of counterproductive work behavior provide an incremental contribution over self-reports? A meta-analytic comparison. J. Appl. Psychol. 2012, 97, 613–636. [Google Scholar] [CrossRef]
- Min, H.; Park, J.; Kim, H.J. Common method bias in hospitality research: A critical review of literature and an empirical study. Int. J. Hosp. Manag. 2016, 56, 126–135. [Google Scholar] [CrossRef]
- Zarjam, P.; Epps, J.; Lovell, N.H. Beyond Subjective Self-Rating: EEG Signal Classification of Cognitive Workload. IEEE Trans. Auton. Ment. Dev. 2015, 7, 301–310. [Google Scholar] [CrossRef]
- Dillon, W.R.; Madden, T.J.; Firtle, N.H. Marketing Research in a Marketing Environment; Times Mirror: St. Louis, MO, USA, 1987. [Google Scholar]
- Skeiseid, H.; Derdowski, L.A.; Grahn, A.H.; Hansen, H. Motivating Sustainable Change in Tourism Behavior: The First- and Third-Person Effects of Hard and Soft Messages. Sustainability 2019, 12, 235. [Google Scholar] [CrossRef] [Green Version]
- Davidson, W.P. The third-person effect in communication. Public Opin. Q. 1983, 47, 1–15. [Google Scholar] [CrossRef] [Green Version]
- Boyle, M.P.; Schmierbach, M.; McLeod, D.M. Preexisting Factors or Media Effect? Understanding the Third-Person Perception. Atl. J. Commun. 2013, 21, 230–246. [Google Scholar] [CrossRef]
- Lee, B.; Tamborini, R. Third-Person Effect and Internet Pornography: The Influence of Collectivism and Internet Self-Efficacy. J. Commun. 2005, 55, 292–310. [Google Scholar] [CrossRef]
- Rosenthal, S.; Detenber, B.H.; Rojas, H. Efficacy Beliefs in Third-Person Effects. Commun. Res. 2015, 45, 554–576. [Google Scholar] [CrossRef]
- Salmon, C.T.; Poorisat, T.; Kim, S.-H. Third-person effect in the context of public relations and corporate communication. Public Relat. Rev. 2019, 45, 101823. [Google Scholar] [CrossRef]
- Mo, Z.; Liu, M.T.; Liu, Y. Effects of functional green advertising on self and others. Psychol. Mark. 2018, 35, 368–382. [Google Scholar] [CrossRef]
- Gunther, A.C.; Mundy, P. Biased Optimism and the Third-Person Effect. J. Q. 1993, 70, 58–67. [Google Scholar] [CrossRef]
- Allen, T.D.; Barnard, S.; Rush, M.C.; Russell, J.E. Ratings of Organizational Citizenship Behavior: Does the Source Make a Difference? Hum. Resour. Manag. Rev. 2000, 10, 97–114. [Google Scholar] [CrossRef]
- Sverke, M.; Låstad, L.; Hellgren, J.; Richter, A.; Naswall, K. A Meta-Analysis of Job Insecurity and Employee Performance: Testing Temporal Aspects, Rating Source, Welfare Regime, and Union Density as Moderators. Int. J. Environ. Res. Public Health 2019, 16, 2536. [Google Scholar] [CrossRef] [PubMed] [Green Version]
- Alicke, M.D.; Klotz, M.L.; Breitenbecher, D.L.; Yurak, T.J.; Vredenburg, D.S. Personal contact, individuation, and the better-than-average effect. J. Personal. Soc. Psychol. 1995, 68, 804–825. [Google Scholar] [CrossRef]
- Khalid, S.A.; Ali, H. Self and superior ratings of organizational citizenship behavior: Are there differences in the source of ratings? Probl. Perspect. Manag. 2005, 4, 147–153. [Google Scholar]
- Kumar, R.; Sia, S.K. Employee engagement explicating the contribution of work environment. Manag. Labour Stud. 2012, 37, 31–43. [Google Scholar] [CrossRef]
- Torres-Guijarro, S.; Bengoechea, M. Gender differential in self-assessment: A fact neglected in higher education peer and self-assessment techniques. High. Educ. Res. Dev. 2016, 36, 1–13. [Google Scholar] [CrossRef]
- Dipboye, R.L.; Flanagan, M.F. Research settings in industrial and organizational psychology: Are findings in the field more generalizable than in the laboratory? Am. Psychol. 1979, 34, 141–150. [Google Scholar] [CrossRef]
- Shore, L.M.; Thornton, G.C. Effects of gender on self and supervisory ratings. Acad. Manag. J. 1986, 29, 115–129. [Google Scholar]
- Magee, W. Effects of Gender and Age on Pride in Work, and Job Satisfaction. J. Happiness Stud. 2014, 16, 1091–1115. [Google Scholar] [CrossRef]
- Sturm, R.E.; Taylor, S.N.; Atwater, L.E.; Braddy, P.W. Leader self-awareness: An examination and implications of women’s under-prediction. J. Organ. Behav. 2014, 35, 657–677. [Google Scholar] [CrossRef]
- Keller, E. Reflections on Gender and Science; Yale University Press: New Haven, NH, USA, 1985. [Google Scholar]
- Maccoby, E.E. Gender and relationships. Am. Psychol. 1990, 45, 513–520. [Google Scholar] [CrossRef]
- Coffman, C.; Gonzalez-Molina, G. Follow this Path: How the World’s Greatest Organizations Drive Growth by Unleashing Human Potential; Warner Books: New York, NY, USA, 2002. [Google Scholar]
- Attridge, M. Measuring and Managing Employee Work Engagement: A Review of the Research and Business Literature. J. Work. Behav. Health 2009, 24, 383–398. [Google Scholar] [CrossRef]
- Kerfoot, K.M. Staff engagement: It starts with the leader. Medsurg Nurs. Off. J. Acad. Med.-Surg. Nurses 2008, 17, 64–65. [Google Scholar]
- Hambleton, R.K. Translating achievement tests for use in cross-national studies. Eur. J. Psychol. Assess. 1993, 9, 57–65. [Google Scholar]
- Etikan, I.; Musa, S.A.; Alkassim, R.S. Comparison of Convenience Sampling and Purposive Sampling. Am. J. Theor. Appl. Stat. 2016, 5, 1. [Google Scholar] [CrossRef] [Green Version]
- Bakker, A.B.; Demerouti, E. Towards a model of work engagement. Career Dev. Int. 2008, 13, 209–223. [Google Scholar] [CrossRef] [Green Version]
- Salanova, M.; Agut, S.; Peiró, J.M. Linking Organizational Resources and Work Engagement to Employee Performance and Customer Loyalty: The Mediation of Service Climate. J. Appl. Psychol. 2005, 90, 1217–1227. [Google Scholar] [CrossRef]
- Lee, Y.; Chang, H. Relations between team work and innovation in organizations and the job satisfaction of employees: A factor analytic study. Int. J. Manag. 2008, 25, 732–739. [Google Scholar]
- Hair, J.F.; Balck, W.C.; Babin, B.J.; Anderson, R.E. Multivariate Data Analysis, 7th ed.; Pearson Education: Upper Saddle River, NJ, USA, 2010. [Google Scholar]
- Stoffers, J.; Van Der Heijden, B.I.J.M.; Schrijver, I. Towards a Sustainable Model of Innovative Work Behaviors’ Enhancement: The Mediating Role of Employability. Sustainability 2019, 12, 159. [Google Scholar] [CrossRef] [Green Version]
- Milliman, J.; Gatling, A.; Kim, J. The effect of workplace spirituality on hospitality employee engagement, intention to stay, and service delivery. J. Hosp. Tour. Manag. 2018, 35, 56–65. [Google Scholar] [CrossRef]
- Shukla, S.; Adhikari, B.; Singh, V. Employee engagement-role of demographic variables and personality factors. Amity Glob. HRM Rev. 2015, 5, 65–73. [Google Scholar]
- Khodakarami, N.; Dirani, K. Drivers of employee engagement: Differences by work area and gender. Ind. Commer. Train. 2020, 52, 81–91. [Google Scholar] [CrossRef]
- Cismaru, L.; Iunius, R. Bridging the Generational Gap in the Hospitality Industry: Reverse Mentoring—An Innovative Talent Management Practice for Present and Future Generations of Employees. Sustainability 2019, 12, 263. [Google Scholar] [CrossRef] [Green Version]
- Xu, F.Z.; Wang, Y. Enhancing Employee Innovation through Customer Engagement: The Role of Customer Interactivity, Employee Affect, and Motivations. J. Hosp. Tour. Res. 2019, 44, 351–376. [Google Scholar] [CrossRef]

| Characteristics | Frequency (n) | Percentage (%) | |
|---|---|---|---|
| Gender | Male | 298 | 45.9 |
| Female | 351 | 54.1 | |
| Age (years) | ≤20 | 63 | 9.7 |
| 21–30 | 368 | 56.9 | |
| 31–40 | 162 | 25.0 | |
| 41–50 | 50 | 7.7 | |
| >50 | 4 | 0.6 | |
| Education | Middle school or lower | 74 | 11.6 |
| High school | 289 | 45.2 | |
| College | 205 | 32.1 | |
| Undergraduate or higher | 71 | 11.1 | |
| Marital Status | Married | 284 | 43.8 |
| Single/divorced | 364 | 56.2 | |
| Length of Working at Company (years) | <1 year | 126 | 19.5 |
| 1–2 | 119 | 18.5 | |
| 3–5 | 155 | 24.1 | |
| 6–9 | 94 | 14.6 | |
| ≥10 | 150 | 23.3 | |
| Job Position | Frontline service staffs | 217 | 33.8 |
| Frontline operation staffs | 78 | 12.2 | |
| Maintenance personnel | 67 | 10.5 | |
| Low level supervisors | 147 | 22.9 | |
| Mid-level managers | 76 | 11.9 | |
| Upper-level managers | 25 | 3.9 | |
| Miscellaneous job positions | 31 | 4.8 |
| Items | SFL | Mean | S.D. | |||
|---|---|---|---|---|---|---|
| SR | TPR | SR | TPR | SR | TPR | |
| Vigor: | 4.22 | 3.76 | 0.65 | 0.79 | ||
| 1. At my job, I feel strong and vigorous. | 0.72 | 0.78 | ||||
| 2. I can continue working for very long periods at a time. | 0.57 | 0.75 | ||||
| 3. At my job, I am very resilient, mentally. | 0.53 | 0.70 | ||||
| 4. At my work I always persevere, even when things do not go well. | 0.55 | 0.71 | ||||
| Dedication: | 4.04 | 3.57 | 0.88 | 0.90 | ||
| 1. I am proud of the work that I do. | 0.83 | 0.85 | ||||
| 2. To me, my job is challenging. | 0.75 | 0.86 | ||||
| 3. My job inspires me. | 0.81 | 0.87 | ||||
| 4. I find the work that I do full of meaning and purpose | 0.77 | 0.83 | ||||
| Absorption: | 4.13 | 3.60 | 0.75 | 0.91 | ||
| 1. I am immersed in my work. | 0.81 | - | ||||
| 2. When I am working, I forget everything else around me. | 0.59 | 0.78 | ||||
| 3. Time flies when I’m working | 0.57 | 0.79 | ||||
| 4. I feel happy when I am working intensely | 0.63 | 0.80 | ||||
| Indices: | ||||||
| NFI | 0.95 | 0.96 | ||||
| CFI | 0.96 | 0.97 | ||||
| IFI | 0.96 | 0.97 | ||||
| TLI | 0.94 | 0.96 | ||||
| RMSEA | 0.07 | 0.08 | ||||
| SRMR | 0.04 | 0.03 | ||||
| 1 | 2 | 3 | 4 | 5 | 6 | 7 | 8 | |
|---|---|---|---|---|---|---|---|---|
| 1. (SR) Overall Engagement | - | |||||||
| 2. (SR) Vigor | 0.83 | (0.73) | ||||||
| 3. (SR) Dedication | 0.90 | 0.59 | (0.88) | |||||
| 4. (SR) Absorption | 0.91 | 0.67 | 0.75 | (0.78) | ||||
| 5. (TPR) Overall Engagement | 0.67 | 0.52 | 0.63 | 0.62 | - | |||
| 6. (TPR) Vigor | 0.58 | 0.52 | 0.50 | 0.52 | 0.91 | (0.85) | ||
| 7. (TPR) Dedication | 0.65 | 0.45 | 0.68 | 0.56 | 0.92 | 0.74 | (0.92) | |
| 8. (TPR) Absorption | 0.61 | 0.46 | 0.54 | 0.61 | 0.91 | 0.76 | 0.76 | (0.84) |
| Overall Engagement | Vigor | Dedication | Absorption | |
|---|---|---|---|---|
| SR | 4.13 | 4.22 | 4.04 | 4.13 |
| TPR | 3.65 | 3.76 | 3.57 | 3.60 |
| Difference between SR vs. TPR | 0.49 | 0.46 | 0.47 | 0.53 |
| (t; p) | (20.46; 0.00) | (16.40; 0.00) | (16.83; 0.00) | (17.84; 0.00) |
| SR | TPR | Difference between SR and TPR | (t; p) | ||
|---|---|---|---|---|---|
| Work condition | Poor | 3.89 | 3.31 | 0.58 | (18.23; 0.00) |
| Good | 4.39 | 4.01 | 0.38 | ||
| Living condition | Poor | 3.91 | 3.33 | 0.59 | (19.48; 0.00) |
| Good | 4.34 | 3.96 | 0.38 |
| Overall Engagement | Vigor | Dedication | Absorption | |||||
|---|---|---|---|---|---|---|---|---|
| SR | TPR | SR | TPR | SR | TPR | SR | TPR | |
| Male | 4.15 | 3.58 | 4.25 | 3.69 | 4.06 | 3.47 | 4.13 | 3.54 |
| n = 296 | n = 296 | n = 296 | n = 296 | n = 296 | n = 296 | n = 296 | n = 295 | |
| Female | 4.12 | 3.71 | 4.19 | 3.82 | 4.03 | 3.64 | 4.14 | 3.66 |
| n = 348 | n = 349 | n = 348 | n = 349 | n = 348 | n = 349 | n = 348 | n = 348 | |
| (F; p) | (0.34; 0.56) | (5.21; 0.02) | (1.71; 0.19) | (4.26; 0.04) | (0.20; 0.65) | (5.41; 0.02) | (0.01; 0.91) | (2.96; 0.09) |
| Gender | Overall Engagement (SR–TPR) | Vigor (SR–TPR) | Dedication (SR–TPR) | Absorption (SR–TPR) |
|---|---|---|---|---|
| Male | 0.57 | 0.56 | 0.58 | 0.59 |
| Female | 0.41 | 0.38 | 0.39 | 0.48 |
| (F; p) | (11.71; 0.00) | (10.33; 0.00) | (11.03; 0.00) | (3.28; 0.07) |
| Length of Working at Company | Overall Engagement | Vigor | Dedication | Absorption | ||||
|---|---|---|---|---|---|---|---|---|
| SR | TPR | SR | TPR | SR | TPR | SR | TPR | |
| <1 Year | 3.98 | 3.60 | 4.09 | 3.78 | 3.84 | 3.51 | 4.01 | 3.47 |
| n = 125 | n = 126 | n = 125 | n = 126 | n = 125 | n = 126 | n = 125 | n = 126 | |
| 1–2 Years | 3.95 | 3.49 | 4.11 | 3.67 | 3.82 | 3.36 | 3.91 | 3.43 |
| n = 118 | n = 118 | n = 118 | n = 118 | n = 118 | n = 118 | n = 118 | n = 117 | |
| 3–5 Years | 4.05 | 3.61 | 4.11 | 3.70 | 4.00 | 3.51 | 4.05 | 3.63 |
| n = 155 | n = 154 | n = 155 | n = 154 | n = 155 | n = 154 | n = 155 | n = 153 | |
| 6–9 Years | 4.17 | 3.63 | 4.26 | 3.68 | 4.11 | 3.60 | 4.18 | 3.59 |
| n = 94 | n = 94 | n = 94 | n = 94 | n = 94 | n = 94 | n = 94 | n = 94 | |
| ≥10 Years | 4.44 | 3.83 | 4.49 | 3.91 | 4.37 | 3.78 | 4.46 | 3.80 |
| n = 148 | n = 149 | n = 148 | n = 149 | n = 148 | n = 149 | n = 148 | n = 149 | |
| (F, p) | (13.26; 0.00) | (3.50; 0.01) | (10.35; 0.00) | (2.23; 0.06) | (9.27; 0.00) | (4.05; 0.00) | (11.36; 0.00) | (3.47; 0.01) |
| Length of Working at Company | Overall Engagement (SR-TPR) | Vigor (SR-TPR) | Dedication (SR-TPR) | Absorption (SR-TPR) |
|---|---|---|---|---|
| <1 year | 0.39 | 0.32 | 0.34 | 0.54 |
| 1–2 years | 0.45 | 0.45 | 0.45 | 0.46 |
| 3–5 years | 0.44 | 0.41 | 0.48 | 0.41 |
| 6–9 years | 0.56 | 0.58 | 0.51 | 0.58 |
| ≥10 years | 0.61 | 0.58 | 0.58 | 0.65 |
| (F; p) | (3.02; 0.02) | (3.27; 0.01) | (2.07; 0.08) | (2.30; 0.06) |
| Job Position | Overall Engagement | Vigor | Dedication | Absorption | ||||
|---|---|---|---|---|---|---|---|---|
| SR | TPR | SR | TPR | SR | TPR | SR | TPR | |
| FLSS | 3.90 | 3.56 | 4.01 | 3.70 | 3.79 | 3.47 | 3.92 | 3.49 |
| n = 215 | n = 216 | n = 215 | n = 216 | n = 215 | n = 216 | n = 215 | n = 215 | |
| FLOS | 4.17 | 3.69 | 4.24 | 3.79 | 4.07 | 3.59 | 4.20 | 3.70 |
| n = 77 | n = 78 | n = 77 | n = 78 | n = 77 | n = 78 | n = 77 | n = 77 | |
| MP | 4.03 | 3.52 | 4.26 | 3.72 | 3.79 | 3.30 | 4.04 | 3.54 |
| n = 67 | n = 67 | n = 67 | n = 67 | n = 67 | n = 67 | n = 67 | n = 67 | |
| Supervisors | 4.16 | 3.56 | 4.21 | 3.65 | 4.10 | 3.49 | 4.14 | 3.54 |
| n = 147 | n = 147 | n = 147 | n = 147 | n = 147 | n = 147 | n = 147 | n = 147 | |
| M-L Managers | 4.52 | 3.94 | 4.56 | 4.00 | 4.52 | 3.91 | 4.47 | 3.90 |
| n = 75 | n = 75 | n = 75 | n = 75 | n = 75 | n = 75 | n = 75 | n = 75 | |
| U-L Managers | 4.64 | 4.07 | 4.62 | 4.07 | 4.71 | 4.14 | 4.58 | 3.97 |
| n = 25 | n = 25 | n = 25 | n = 25 | n = 25 | n = 25 | n = 25 | n = 25 | |
| (F, p) | (12.34; 0.00) | (4.27; 0.00) | (10.00; 0.00) | (11.24; 0.00) | (8.01; 0.00) | (2.63; 0.02) | (5.74; 0.00) | (2.93; 0.01) |
| Job Positions | Overall Engagement SR–TPR | Overall Engagement (SR–TPR) | Vigor (SR–TPR) | Dedication (SR–TPR) | Absorption (SR–TPR) | |
|---|---|---|---|---|---|---|
| Frontline | 3.99 | 3.58 | 0.41 | 0.39 | 0.39 | 0.46 |
| Supervisors | 4.16 | 3.56 | 0.60 | 0.57 | 0.62 | 0.60 |
| M-L Managers | 4.52 | 3.94 | 0.58 | 0.56 | 0.62 | 0.57 |
| U-L Managers | 4.64 | 4.07 | 0.57 | 0.55 | 0.57 | 0.61 |
| (F; p) | (19.84; 0.00) | (7.57; 0.00) | (3.25; 0.00) | (2.32; 0.06) | (3.99; 0.00) | (1.83; 0.12) |
| Hypotheses | Significance | Decision |
|---|---|---|
| Hypothesis 1 (H1).There is a significant positive relationship between employee work engagement measured by self-rating and employee work engagement measured by third-person rating. | sig. | Supported |
| Hypothesis 2 (H2a).Employee work engagement measured by self-rating is significantly higher than employee work engagement measured by third-person rating. | sig. | Supported |
| Hypothesis 2 (H2b).The differences in employee work engagement measured by self-rating vs. by third-person rating is largest for the dedication dimension and smallest for the absorption dimension. | sig. | Supported |
| Hypothesis 3 (H3a).Employee work engagement is positively related to work environment satisfaction for both self-rating and third-person rating. | sig. | Supported |
| Hypothesis 3 (H3b).The differences in employee work engagement measured by self-rating vs. by third-person rating is significantly larger under the poor work environment condition than under the good work environment condition. | sig. | Supported |
| Hypothesis 4 (H4a).Employee work engagement measured by self-rating is significantly higher for males than for females. | n.s. | Not supported |
| Hypothesis 4 (H4b).Employee work engagement measured by third-person rating is significantly lower for males than for females. | sig. | Supported |
| Hypothesis 4 (H4c).The differences in employee work engagement measured by self-rating vs. by third-person rating is significantly larger for males than for females. | sig. | Supported |
| Hypothesis 5 (H5a).Employee work engagement is negatively related to employee’s years of employment. | sig. | Reverse result |
| Hypothesis 5 (H5b).The difference in employee work engagement measured by self-rating vs. by third-person rating is significantly higher for employees with longer tenure than those with short tenure. | sig. | Supported |
| Hypothesis 6 (H6a).Employee work engagement is higher for managers and supervisors than for the non-manager/supervisors. | sig. | Supported |
| Hypothesis 6 (H6b).The difference in employee work engagement measured by self-rating vs. by third-person rating is significantly lower for employees with leadership positions than those without leadership position. | sig. | Supported |
© 2020 by the authors. Licensee MDPI, Basel, Switzerland. This article is an open access article distributed under the terms and conditions of the Creative Commons Attribution (CC BY) license (http://creativecommons.org/licenses/by/4.0/).
Share and Cite
Xu, F.Z.; Zhang, Y.; Yang, H.; Wu, B.T. Sustainable HRM through Improving the Measurement of Employee Work Engagement: Third-Person Rating Method. Sustainability 2020, 12, 7100. https://doi.org/10.3390/su12177100
Xu FZ, Zhang Y, Yang H, Wu BT. Sustainable HRM through Improving the Measurement of Employee Work Engagement: Third-Person Rating Method. Sustainability. 2020; 12(17):7100. https://doi.org/10.3390/su12177100
Chicago/Turabian StyleXu, Feng Zeng, Yun Zhang, Huixin Yang, and Bob T. Wu. 2020. "Sustainable HRM through Improving the Measurement of Employee Work Engagement: Third-Person Rating Method" Sustainability 12, no. 17: 7100. https://doi.org/10.3390/su12177100