Abstract
Winemaking is concerned about sustainable energy availability that implies new methods for process monitoring and control. The aim of this paper is to realize a comparative analysis of the possibilities offered using estimation techniques, balances, and filtering techniques such as the Kalman filter (KF) and the extended Kalman filter (EKF), to obtain indirect information about the alcoholic fermentation process during winemaking. Thus, an estimation solution of the process variables in the exponential growing phase is proposed, using an extended observer. In addition, two estimation solutions of this process with the EKF and an estimation of the decay phase of the fermentation process are presented. The difference between the two EKF variants consisted of taking into consideration the indicator of the integral of the error norm square for the second EKF, for which the performance criterion was the statistical average of this indicator. Results from the simulation of the estimation programs of the two EKF variants were more than satisfactory. This research provides a basis for using an EKF designed for advanced control of the alcoholic fermentation batch process as a knowledge-based system.
1. Introduction
For thousands of years, the food product of wine has had an economic and cultural impact on the world, especially in wine-producing countries such as Romania. Considered one of the foundations of civilization, wine remains the most popular alcoholic drink in the world [1].
An adequate strategy to improve the sustainability of the wine industry must start with an evaluation, as objective and accurate as possible, of the sustainability performance of its processes [2,3]. An additional issue for debate in the scientific community linked with industrial wine companies relates to the environmental pillar of sustainability [4,5]. The approach to sustainable development is based on the concept of environment–economy–society [6]. The wine industry focuses on reducing production costs, while simultaneously increasing product yield and maintaining quality [7,8]. These goals require the ability to accurately achieve and control optimal states in the fermentation processes. More traditional processes have been enhanced using improved types of equipment, better processing strategies, and new methods for process monitoring and control [9,10].
Generally, the fermentation process during winemaking takes place in a tank in which microorganisms (yeast) are grown by consuming nutrients (generally raw materials) under controlled environmental conditions: temperature, pH, agitation, aeration, etc. [11]. Such a process can be considered a biotransformation of nutrients into an important food product [12].
As a complex ecological and biochemical process, the alcoholic fermentation processes of winemaking involve many interactions relating to grape variety, microbiota, and technological operations. The process variables are often controlled empirically and traditionally. Factors such as fermentation temperature, grape juice composition, anaerobic conditions (due to CO2 production), low media pH, sulfur dioxide concentration level, selected yeast inoculation, and interaction with other microorganisms, amongst others, have an essential effect on the alcoholic fermentation process [11].
Due to significant model uncertainty, the lack of online sensors to detect important state variables, the nonlinear and time-varying nature of the system, and the slow response of the process (cells and metabolic concentrations), control system design of the alcoholic fermentation process in winemaking is a challenge.
An important issue connected with the control of the alcoholic fermentation process is the use of online sensors specific to biochemical and microbiological applications that characterize these kinds of processes [13]. Research relating to the development of these biosensors is abundant [14,15] but is far from being finished. At present, few sensors are sufficiently reliable to be used in industrial processes. In order to overcome these difficulties, theoretical frameworks have been developed, in particular, to design “software sensors” for the online monitoring of biological variables that can cope with the lack of instrumental sensors.
The state estimator (also known as a software sensor or observer in the specialized literature) is an algorithm used for determining measurements of a process based on other accessible measurements related to their acquisition [16]. As an optimal filter for linear models, Kalman filters (KFs) are commonly applied in many industrial processes for tracking and estimation due to their simplicity, optimality, tractability, and robustness [17,18]. By assuming that the behavior of the system is described by a nonlinear model, and that the mean and covariance of the measurement errors are known, extended and unscented Kalman filters (EKF/UKF) are used to estimate the state of the system [19].
Among the estimation techniques proposed in the literature, three have been recognized to have strong potential in the online estimation of bioprocesses: estimation through elemental balances, the adaptive observer, and filtering techniques (KF, EKF) [9].
Over the past 10 years, the development of online software sensors for the winemaking industry has progressed very little. Considering all of the above-mentioned aspects, the present study aimed to develop state estimators for the alcoholic fermentation process of winemaking to obtain indirect information about this process, and thus provide information necessary for the future design of an advanced control, such as a knowledge-based system. This system uses the information from the online software sensors at the first level of a process control system and in the future could be part of a control smart platform [20]. The main novelty of the current work lies in an estimation solution of the alcoholic fermentation process variables for white winemaking, in the most important phases of the process (the exponential growth and decay phases), using an extended observer.
2. Materials and Methods
2.1. Defining the System Structure of the Process
To design a state estimation of the alcoholic fermentation processes in winemaking was a delicate task for us due to its variable structure (the mathematical model is heterogeneous, described by phases). We concluded that is not practical to create a whole estimation for all phases (latent, exponential growth, and decay). The objective is to conceive of a process control that will use models for all three phases and, at the level of this control system, based on the measured and estimated variables, establish a toggle from one phase to another. Therefore, it is reasonable that the estimation is treated distinctly for the exponential growth phase and for the decay phase, the most important phases of the fermentation process.
One of the essential issues for the viability of process control is the use of measuring equipment suitable for all of the variables that characterize the process. This study adopts the hypothesis that the following variables are measured in real time: the temperature of the fermentation process (temperature sensor system) and the released carbon dioxide concentration (absorption in an IR analyzer). The ethanol concentration is determined by HPLC-MS equipment. In addition, at the beginning of each process, the initial concentration of the substrate will be determined (which does not need to be measured in real time). Biomass concentration and substrate concentration are the important variables, which must be estimated in real time.
The structure and the model of the process used in designing the observers are presented in Figure 1 [21]. The presentation of the process, the nonlinear mathematical model of the alcoholic fermentation process developed, and the dynamic behavior of this process through direct sensitivity analysis method (DSA) can be studied in [21]. For the experiments, Saccharomyces cerevisiae YEPD wine yeast was used, being seeded on a culture medium with the following composition: 5 g L−1 KH2PO4, 2 g L−1 (NH4)2SO4, 0.4 g L−1 (MgSO4)·7H2O, 1 g L−1 yeast extract, 50 g L−1 glucose and Mauzac must (sterilized through flash pasteurization). The sugar content of the grape must was supplemented with sucrose up to 180 g L−1 and 40 mL hL−1 tiaminol was added. The SO2 content reached 50 mg L−1 and the pH was adjusted at 3.8 mg L−1 H3PO4. Both the fermentation medium and the bioreactor were autoclaved for 20 min at 120 °C. A New Brunswick continuously stirred bioreactor equipped with pH and temperature sensors was used. The operating conditions were: working volume—8 L, the temperatures were at 18 °C and 28 °C, stirring speed—150 rpm, pH—3.8, influent glucose concentrations—180 g/L and 210 g/L, and without aeration, the necessary oxygen was dissolved in must. To evaluate the total fermentation yield losses under different operating conditions, four experiments were carried out [21].
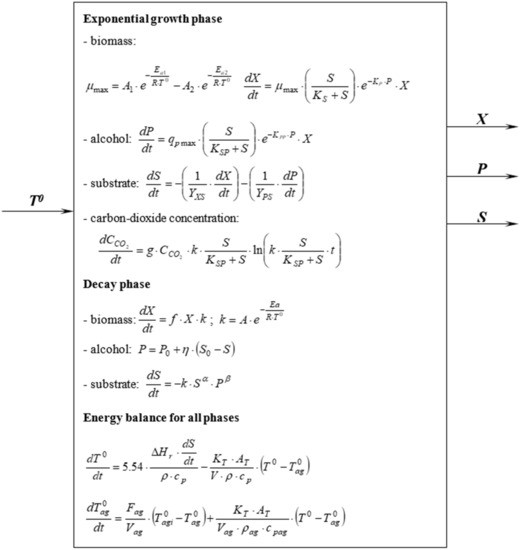
Figure 1.
The structure and process model used in developing the observers.
An additional issue is the lack of structural properties of the system (concerning the system’s observability). This aspect is highlighted by the modal analyses of the linearized system, in which only the microbiological system of X, P, and S is considered (T0, the fermentation process temperature, is an input variable and is maintained constantly by the control loop).
The process model (Figure 1) was structured as a MATLAB/Simulink (version 2014a, Mathworks, Inc., Natick, MA, USA) diagram and then linearized using MATLAB (version 2014a, Mathworks, Inc., Natick, MA, USA) functions. As a result, an observable index equal to 3 was obtained. However, the observable matrix determinant was extremely small (10−6), which showed that the system is unobservable. This finding can be explained by the fact that the right part of the substrate state equation is a result of a linear combination of the right parts of the biomass and product state equations.
In these conditions, the substrate equation is removed and is considered to be an output equation. Thus, the state model of the microbiological subsystem has the following form:
where x1 is the biomass concentration (X), x2 represents the alcohol concentration (P), and S is deduced from the output equation:
where i is the step index of integration with the Euler method and h is the integration step.
In addition, it can be found that in the exponential growth phase, the expressions and are very close to 1, and can thus be substituted with this value. The numerical simulation checkout demonstrated that the dismissal of these factors from the exponential growth phase did not influence the results.
Considering the above-mentioned factors in the exponential growth phase and regarding the choice of the output variable in the state estimation process, there are two alternatives:
- (a)
- to use P, the product concentration, as the output variable (the concentration of ethylic alcohol);
- (b)
- or to use the released carbon dioxide concentration as the output variable.
In the proposed model, the released carbon dioxide concentration equation:
defines the system as being variable, and must be extended with two additional state variables:
where v1 is initialized at the value 1. In this case, the state variable v2 becomes time t, which is present in Equation (4). The increasing order of the nonlinear system is undesirable because it significantly complicates the estimation algorithms. Therefore, the information from the released CO2 concentration analyzer is used in the control process (being essential), and, for the design of the extended estimators, the product concentration, P, is utilized as the output.
2.2. Developing the Extended Observer for State Estimation of the Exponential Growth Phase
The extended observers are state estimators for nonlinear systems.
The following state model of a nonlinear system is considered:
Assuming that the function from the state equation is derivable, Equation (6) can be linearized in the nominal point of operation. The matrix A of the state linear equation has the form:
The A(x) and C parameters of the linear model can be used in the nominal point from the state trajectory because the output of Equation (7) is considered to be linear.
Assumption that the matrix rank:
is equal to n, the system is observable and there is a solution for designing an observer. Observability of a linear system can be determined relatively easily; however, for a nonlinear system the difficulty consists in the necessity for all of the points from the state trajectory to be observable. For systems with high order, determining observability is problematic, but for the systems with reduced order (n = 2, 3), complete observability determination is possible.
Furthermore, an observer in the current point of operation is designed with the equation:
and the error equation depends on the A(x) matrix of the state equation, calculated for the estimated current state, :
The matrix of error amplification depends, in this case, on the estimated current state. This parameter is established by imposing the poles p1, p2, …, pn on System (11), that is, by imposing the characteristic polynomial:
On the other hand, the characteristic polynomial of System (11) is:
With the analytical calculation, the right part of Equation (13) is developed and the characteristic polynomial of the following form is developed:
The following condition is set:
that involves the equality of the coefficients from the two polynomials:
The vector in these equations and are also known. Thus, a system of n algebraic equations is solved considering as unknown, and the vector components are obtained:
Thus, the vector of amplification from the observer equation is not constant, but depends on the current point from the state trajectory.
The issues relating to the principles presented above are adopted for the system estimation of the processes of biomass and substrate concentration.
Suppose that the biotechnological process is described by the following state equations:
where x1 is the biomass concentration, x2 is the fermentation product concentration, and µmax is the maximum specific growth rate that depends on temperature T0 (the temperature T0 is an input variable):
The state vector is:
and the output equation is:
therefore:
The A(x) matrix of the linearized system, calculated in the current point of operation , is:
Taking into account the functions’ expression, and the following is obtained:
The observability matrix of the system is:
Because:
it follows that the system is observable at any point of the state trajectory, (fermentation product) being always infinite.
The extended observer equation is:
or, taking into account the concentrated form of the state equations:
The deduction of the amplification vector of the extended observer:
implies the allocation of some desired poles within the error of Equation (11).
The characteristic polynomial of the matrix is:
Imposing the p1 and p2 poles, the characteristic polynomial has the form:
From the identification of the polynomial’s coefficients in Equations (31) and (32), the expressions of the components of amplification vector of the extended observer are obtained:
2.3. Developing the EKF for State Estimation of the Exponential Growing Phase
2.3.1. First Variant of the EKF
The EKF equation for a continuous time has the form of Equation (10). However, the determination of the amplification is not made by an allocation procedure, but by an optimization problem with a statistical approach.
By defining the error of estimation:
the performance criterion is imposed as follows:
where E is the symbol of statistical average. In this case, the vectoral parameter of KF is [17]:
where P is the solution of the Riccati algebraic equation:
In this equation, A is the matrix of the linearized system, which is dependent on . Therefore, the P and Ke matrix will depend on the estimated state .
For the estimation of the fermentation process state in the exponential growth phase, based on the EKF presented above, the Kalman MATLAB function was used, and called at each step of the estimation algorithm.
2.3.2. Second Variant of the EKF
The second variant of the EKF, utilized for the alcoholic fermentation process estimation, takes into consideration an indicator in the form of the integral of the error norm square:
The performance criterion is the statistical average of this indicator.
In this case, the amplification of the error in EKF has the expression:
where P(t) is the symmetrical matrix obtained by integrating the Riccati differential matrix equation:
For the examined process, the system model is:
where is expressed as Equation (19).
The matrix of the linearized system can be expressed as the forms of Equations (23) or (24). The P(t) symmetrical matrix from the Riccati equation is considered to have the form:
and the Riccati differential matrix equation is written under components as:
2.4. The State Estimation of the Decay Phase
The equation of biomass concentration variation in the decay phase is:
where , thus resulting in:
The model of the biomass concentration is disconnected from the models of the P and S variables because the temperature T0 of the fermentation process is an exogenous variable, being established by the loop control.
Furthermore, taking into account that the product concentration model is given by the algebraic equation:
and the variance equation of the substrate concentration is:
it follows that the dynamic of this phase belongs to the state equation of the substrate concentration:
Moreover, the substrate concentration model is disconnected from the remaining variables. Thus, the dynamic system is formed by two disconnected state equations (two independent systems of first order) and an output algebraic equation that provides the P variable.
3. Results and Discussion
For the validation of the approach presented in Section 2.1, the dynamic evolutions of X and S variables were determined (Figure 2), considered as state variables of the system with the order 3, resulting from Equations (1)–(3) of the model. Practically, the respective variables coincide (the gaps depend on the integration step h). Hence, the results we have achieved to use the product concentration as the output variable and the information from the released CO2 concentration analyzer to be utilized in the control process for identifying in which phase is the alcoholic fermentation process, are realistic.
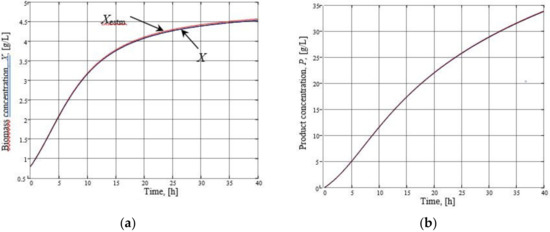
Figure 2.
The evolution of the state variables X (a) and P (b) according to Equations (1)–(3) of the model.
The extended observer and EKF for state estimation of the exponential growth phase were implemented in the MATLAB system.
In the case of the extended observer (Section 2.2), by imposing the polls p = [−5 − 8], for biomass concentration, a very good dynamic of the estimation error cancellation was obtained (Figure 3). Moreover, the estimation error of the substrate concentration is negligible, as can be seen in Figure 4.
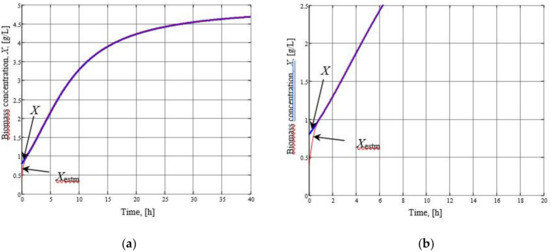
Figure 3.
The biomass concentration estimation (a), exploded view (b).
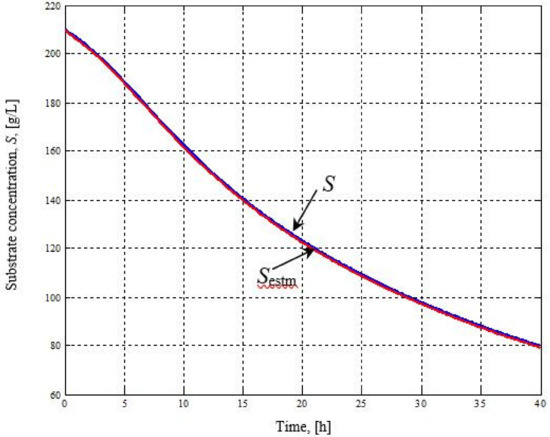
Figure 4.
The evolution of the real and estimated substrate concentration.
In practice, the allocation of the polls is made as a function of the system noise level. Figure 5 presents the evolutions of biomass and substrate concentration estimations under noise, applied to both of the state variables (0.1 × randn).
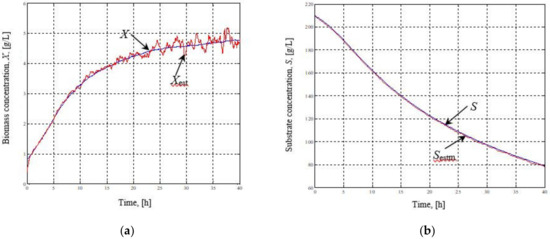
Figure 5.
The estimation of the biomass (a) and substrate (b) under noise conditions; p = [−5 − 8].
The relatively important effect on the estimation of the microbial cells’ concentration, but a reduced influence on the estimated substrate concentration, can be observed. In order to reduce the noise influence, polls closest to the origin can be allocated. For p = [−1 − 0.5], the results are shown in Figure 6. It is noted that the error dynamic cancellation is slower, but the noise effect is lower. In addition, the estimation error of the consumed substrate concentration at high values of time increases slightly, while still remaining at an insignificant value.
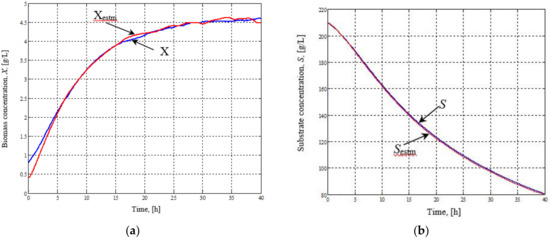
Figure 6.
The estimation of the biomass (a) and substrate (b) under noise conditions; p = [−1 − 0.5].
Results of the simulation of the estimation programs of the EKF (Section 2.3) are illustrated in Figure 7a,b. For the first variant of EKF (Figure 7a) the noise parameters were: . The obtained evolutions were more than satisfactory. If the noise level of the system was increased threefold, the results were still very good, as can be seen in Figure 7b for the second EKF developed. It can be observed that, in comparison with the extended observer, the results are better under the circumstances of the presence of a high noise level.
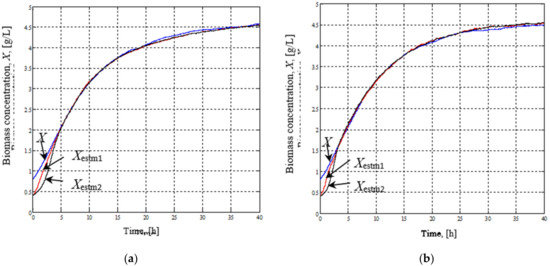
Figure 7.
The estimation results of the biomass with the two versions of the EKF (Xestim1, Xestim2), respectively, for (a) and for (b).
In these conditions, the second variant of the EKF developed, that takes into consideration the indicator of the integral of the error norm square, indicates being used as online software sensors either for biomass or for substrate.
Generally, the design of a state estimator, either as a classical observer or as a KF, starts from the process equation (that is, using the process model for state estimation). This is because in the decay phase, the initial state of the process is unknown, in order to initialize the state of the observer, the estimator model also includes—in addition to the process model (Section 2.4.)—the the term. Initially, this term has an important share, then, as tends to x, its share is diminished until it is cancelled; thus, the estimator model becomes practically identical to the process model. Considering these aspects, it is concluded that, in the decay phase, the system model has initial states that are known and equal to the state variable values from the previous phase (of the exponential growth phase). Therefore, the estimation of the variables in the decay phase can be realized according to the scheme presented in Figure 8. After the exponential growth phase is exhausted, at moment
, the and estimations are transferred as initializations of the biomass and substrate concentration state equations. These equations then are integrated, with the measured value of the temperature T0(t) also known. Following equation initialization, the estimations are obtained by the integration of the state equations.
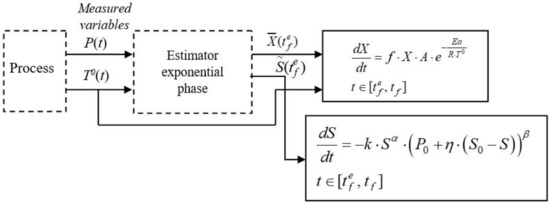
Figure 8.
The structure of the estimation block in the decay phase.
For the alcoholic fermentation process of white wine, this research proposed an estimation solution of the process variables in the exponential growth and decay phases as a new sustainable method for process monitoring and control systems.
4. Conclusions
Designing an accurate control system of the alcoholic fermentation process in winemaking relies on obtaining data in real time, as fully as possible, relating to the variables that define the process, either by a system of physical sensors or by estimators. This research work established the structure of a heterogeneous mathematical model of the alcoholic fermentation batch process such that variable estimation is performed in each phase (exponential growth and decay phases) and in which only the microbiological system of X, P, and S is considered. The mathematical model was linearized and system observability was determined considering, for the design of extended estimators, information from the released CO2 concentration analyzer used in the control process and the product concentration utilized as output. Then, for state estimation of the process variables, an estimation solution using extended observers was developed and validated. By imposing polls closest to the origin on these extended observers, the error dynamic cancellation was slower, but the noise effect was lower. In addition, the estimation error of the consumed substrate concentration at high time values increased slightly, but remained at an insignificant value. Moreover, two estimation solutions of this process with EKF were designed in order to improve the obtained results with extended observers. Results from the simulation of the estimation programs of the two EKF variants were more than satisfactory. If the noise level of the system was increased threefold, the results were still clearly beneficial for the second EKF developed. It was observed that, in comparison with the extended observer, the results were better under the circumstances of a high noise level.
Furthermore, this research provides a basis for using an EKF designed for advanced control of the alcoholic fermentation batch process in winemaking as a knowledge-based system. This system could be applied to the information from online software sensors at the second level of the process control system and our future efforts will be directed in designing such an advanced control system for introducing more efficient and sustainable approaches to the winemaking industry.
Funding
This project was financed by Lucian Blaga University of Sibiu, research grant number LBUS-IRG-2017-03.
Conflicts of Interest
The author declares no conflict of interest.
References
- Genc, M.; Genc, S.; Goksungur, Y. Exergy analysis of wine production: Red wine production process as a case study. Appl. Therm. Eng. 2017, 117, 511–521. [Google Scholar] [CrossRef]
- Schenka, C.; Schulzb, V.; Roschc, A.; von Wallbrunn, C. Less cooling energy in wine fermentation—A casestudy in mathematical modeling, simulation and optimization. Food Bioprod. Process. 2017, 103, 131–138. [Google Scholar] [CrossRef]
- Merli, R.; Preziosi, M.; Acampora, A. Sustainability experiences in the wine sector: Towards the development of an international indicators system. J. Clean. Prod. 2018, 172, 3791–3805. [Google Scholar] [CrossRef]
- Grumezescu, A.M.; Holban, A.M. Fermented Beverages; Woodhead Publishing: Sawston, UK, 2019. [Google Scholar]
- Mozell, M.R.; Thach, L. The impact of climate change on the global wine industry: Challenges & Solutions. Wine Econ. Policy 2014, 3, 81–89. [Google Scholar] [CrossRef]
- Calicioglu, O.; Flammini, A.; Bracco, S.; Bellù, L.; Sims, R. The future challenges of food and agriculture: An integrated analysis of trends and solutions. Sustainability 2019, 11, 222. [Google Scholar] [CrossRef]
- Galati, M.; Galati, A.; Crescimanno, M.; Tinervia, S. The integration of quality and safety concerns in the wine industry: The role of third-party voluntary certifications. J. Clean. Prod. 2016, 112, 267–274. [Google Scholar] [CrossRef]
- Gilinsky, A.; Newton, S.K.; Vega, R.F. Sustainability in the Global Wine Industry: Concepts and Cases. Agric. Agric. Sci. Procedia 2016, 8, 37–49. [Google Scholar] [CrossRef]
- Jose de Assis, A.; Filho, R.M. Soft sensors development for on-line bioreactor state estimation. Comp. Chem. Eng. 2000, 24, 1099–1103. [Google Scholar] [CrossRef]
- Marcin Błazejowski, M.; Kwiatkowski, J.; Gazda, J. Sources of economic growth: A global perspective. Sustainability 2019, 11, 275. [Google Scholar] [CrossRef]
- Şipoş, A. Current State and Perspective in the Models Applicable to Oenology. In Grapes and Wines—Advances in Production, Processing, Analysis and Valorization; Jordão, A.M., Cosme, F., Eds.; InTechOpen: Rijeka, Croatia, 2018; pp. 143–169. [Google Scholar] [CrossRef]
- Farza, M.; Hammouri, H.; Othman, S.; Busawon, K. Nonlinear observers for parameter estimation in bioprocesses. Chem. Eng. Sci. 1997, 52, 4251–4267. [Google Scholar] [CrossRef]
- Harms, P.; Kostov, Y.; Rao, G. Bioprocess monitoring. Curr. Opin. Biotechnol. 2002, 13, 124–127. [Google Scholar] [CrossRef]
- Kress-Rogers, E.; Brimelow, C.J.B. Instrumental measurements and sensory parameters. In Instrumentation and Sensors for the Food Industry, 2nd ed.; Woodhead Publishing Series in Food Science; Technology and Nutrition: Sawston, UK, 2001; pp. 31–60. [Google Scholar] [CrossRef]
- Ferreira, L.S.; De Souza, M.B., Jr.; Trierweiler, J.O.; Broxtermann, O.; Folly, R.O.M.; Hitzmann, B. Aspects concerning the use of biosensors for process control: Experimental and simulation investigations. Comp. Chem. Eng. 2003, 27, 1165–1173. [Google Scholar] [CrossRef]
- Stavropoulos, P.; Chantzis, D.; Doukas, C.; Papacharalampopoulos, A.; Chryssolouris, G. Monitoring and Control of Manufacturing Processes: A Review. In Proceedings of the (CIRP CMMO) Procedia CIRP, 14th CIRP Conference on Modelling of Machining Operations, Turin, Italy, 13–14 June 2013; Volume 8, pp. 421–425. [Google Scholar]
- Ljung, L. Asymptotic behavior of the extended Kalman filter as a parameter estimator for linear systems. IEEE Trans. Autom. Control 1979, 24, 36–50. [Google Scholar] [CrossRef]
- Julier, S.J.; Uhlmann, J.K. New extension of the Kalman filter to nonlinear systems. In Proceedings of the SPIE 3068 Signal Processing, Sensor Fusion, and Target Recognition VI, Orlando, FL, USA, 28 July 1997. [Google Scholar] [CrossRef]
- Barbu, M. Conducerea Automată a Proceselor Biotehnologice; Editura Galati University Press: Galati, Romania, 2009; pp. 134–140. [Google Scholar]
- Athanasopoulou, L.; Papacharalampopoulos, A.; Stavropoulos, P. Context awareness system in the use phase of a smart mobility platform: A vision system for a light-weight approach. Proc. CIRP 2020, 88, 560–564. [Google Scholar] [CrossRef]
- Sipos, A.; Agachi, P.S.; Meyer, X.M.; Strehaiano, P. Batch fermentation process: Modeling and direct sensitivity analysis. Acta Aliment Hung 2010, 39, 222–233. [Google Scholar] [CrossRef]
© 2020 by the author. Licensee MDPI, Basel, Switzerland. This article is an open access article distributed under the terms and conditions of the Creative Commons Attribution (CC BY) license (http://creativecommons.org/licenses/by/4.0/).