Abstract
This paper presents an evaluation of the economic cost of precipitation shortage in the production of lamb in Extremadura. Given that the production strategy is based on maintaining a productivity target by supplementing natural pastures in contexts of water scarcity, the approach will be based on the analysis of the cost structure of the sector. A monetized cash flow model will be presented, which allows us to evaluate economic impacts through a financial perspective. The study focuses on a set of 1583 farms associated into the cooperative EA Group. These members have a total of 804,000 animals, which represents more than 40% of total sheep in Extremadura. Results shows a relation between precipitation minimums and feed quantity maximums of the series analyzed. Mayor direct impact is represented by an increase in feed supplementation needs, with an economic estimation of 54 million euros over two years for the whole sector. At the farm level, there is an average reduction of profits of 50% in the case of owned land, and bankruptcy in the case of renting land. In the context of data-driven policy making, this estimate provides a tool for European Policy funding negotiation a in sector which is considered as highly strategic because of its positive impacts on the environment, the generation of employment and maintenance of rural populations in marginal areas and for the production of high-quality food with a minimal use of natural resources.
1. Introduction
One of the effects of climate change is the exacerbation of the land degradation process, within a context of the increasing frequency and intensity of drought events [1]. The economic use of natural resources such as water and land in the Mediterranean region is constrained by scarcity, climatic conditions and demographic pressures. The countries that surround the Mediterranean will host 560 million people in 2030 and the demand for meat and animal products is set to climb steeply as the population increases [2]. Climate change has turned out especially relevant to the wellbeing and health of the animals raised in extensive farming and, therefore, it affects the safety and quality of the food chain [3].
Extensive livestock farming is highly influenced by water scarcity, especially due to its effects on the quantity and quality of pastures for food [4]. This kind of production is relevant in Spain, being the member of the European Union with the largest area of land, and with the greatest diversity of extensively managed livestock systems based on natural pasture production [5]. The activity is particularly important in the Autonomous Community of Extremadura, with the highest concentration of sheep livestock in Spain (it has around 22% of the country’s total animals and the largest number of producers dedicated to the production of lamb meat, with a total of 15,799 farms in 2018 [6]). The maintenance of this extensive livestock exploitation system implies the existence of an economic activity that produces quality food and creates jobs in economically marginal territories [5]. In the case of Extremadura, this is not a completely anachronic and marginal activity. On the contrary, there is a co-existence of traditional producers with enterprises that invest in research and development, with an export-oriented product to high quality markets, such as halal and kosher meat [7].
This combination of demographic pressures and the need to expand production of sustainable and high-quality food within the context of climate change raises the question of how climate is currently affecting the economy of the livestock sector. The answer to this question is the first step for the design of forward-looking adaptation strategies that can contribute to the resilience of this sustainable and ecological production system.
Various international studies have addressed the problem of assessing the economic impact of drought on livestock production, such as [8] in Australia and [9,10,11] in the USA. Studies for Extremadura, however, explored other topics such as the characteristics of extensive livestock farming [12], the challenges facing climate change [5], the cost structure of the sector [13,14,15], the availability water during droughts [16] and the perceptions of farmers about the sustainability of their activities [17]. None have focused particularly on the economic impact produced by water scarcity.
The economic impact assessment is important not only because the Mediterranean is among the most arid regions in the world, but also because of future climate forecasts for Spain. According to the Spanish National Meteorology Agency, 87% of projections shows a decrease in annual precipitation levels [18]. As for spring precipitation levels, the most important levels for natural pasture growth, projections show a higher proportion of decreases compared to winter precipitation for almost all regions of Spain. In particular, Extremadura has the third highest decrease after Andalucía and Murcia [18].
The livelihood, savings and risk management mechanisms of millions of people depend on livestock farming, as well as countless ecosystem services and many small-scale economies [19]. It is expected that an economic impact estimate will contribute to the promotion of sustainable food production in the context of water scarcity through a sector that has positive implications for the environment (in terms of the maintenance of local ecosystems such as Dehesa and the Mediterranean Forest) and for society (in terms of the maintenance of rural populations and income levels in marginal areas).
Therefore, this work aims to take a preliminary step to assess the economic cost of drought events in lamb production in Extremadura, considering the singularities of the activity in the region. Given that the production strategy is based on maintaining a productivity goal by supplementing natural pastures in contexts of water scarcity, the approach will be based on the analysis of the cost structure of the sector. Therefore, this work will focus on designing an assessment to evaluate the level of increase of supplementary alimentation cost in comparison with the occurrence of precipitation shortage. A monetized cash flow model will be presented, which allows us to evaluate economic impacts through a financial perspective. The main objective of the study will be to provide orders of magnitude of economic impact, in order to identify the scale of the microeconomic, sectorial or macroeconomic problem.
To the best of our knowledge, this is the first paper to conduct a study to test the losses caused by drought in extensive sheep farming in Spain and, especially, in an area of high ecological value where maintaining the rural population is a priority. It is expected to provide important insights to public and private interventions, such as financial and economic evaluation of infrastructure, direct assistance through transfers, improving insurance and hedging instruments or the promotion of technology for optimal use of natural pastures.
The remainder of this paper is organized as follows. Section 1 provides an overview of the literature review and the description of the production cycle of the case studied. Section 2 summarizes the data used and the methodology used to construct the economic impact assessment model. Section 3 analyzes findings and Section 4 concludes with a summary, the model’s limitations, policy implications and future lines of research.
2. State of the Art
Different approaches to estimate the impact of climate change over livestock can be found across the literature.
Ref. [20] presents a literature review concluding that there are relatively few studies of impacts on livestock compared to crops and that the magnitude of climate change impacts is not known; it also suggests that because of heterogeneous production systems, varied agroecological zones and different production objectives, data collection is a challenge and evidence is still fragmented.
In order to show the diversity of the problem, and to collect evidence to design and justify the methodology of the study, different approaches to estimate the impact of climate change over livestock are summarized within this section.
Ref. [9] used two methods to valuate impacts of natural disasters on livestock: reduced hay production and reduced grazing potential. The economic impact of reduced hay production was valuated using a method similar to the one commonly used for estimating crop damages. The economic losses associated with reduced grazing potential was calculated using: the number of acres and days that grazing was impacted; typical stocking rates (i.e., number/size of animals per acre); consumption of forages per cow; and hay prices.
Ref. [8] evaluated the impacts of future climate change on pasture and livestock productivity in Australia. Livestock production systems in Australia are based on dryland pastures and are highly sensitive to climate variability. The study used the GRAZPLAN simulation models (commonly used in Australia) to assess the impacts of climate change (1970–99, 2030, 2050 and 2070 climate). The study evaluated impacts on Aboveground Net Primary Production (ANPP) as an indicator for pasture, which is defined as the amount of aboveground plant biomass or carbon accumulated over a specific time period. Estimates of ANPP are used to determine forage availability and stocking rates for livestock. The sensitivity of ANPP to changes in rainfall was higher (ranged from 0.4 to 1.7) compared to increases in temperature and CO2. In addition, the climate models project that the dry summer period will lengthen, exacerbating the risk of erosion due to lower ANPP. The study measured financial losses based on gross income per hectare and operating profit per hectare. Operating profits were projected to decline the most in drier locations.
Ref. [10] uses the Input-Output (IO) and Social Accounting Matrix model IMPLAN (IMpact analysis for PLANning) to estimate the impacts of drought on livestock and agriculture and direct, indirect and induced effects on the Texas economy. The model draws from statistical data related to the US business economy. The study focused on four measures of economic activity during the 2011 drought: industry output, value added, labor income and employment. An important finding was a decrease in employment as a result of drought.
Ref. [21] uses a Computable General Equilibrium model to investigate the economy-wide impact of drought in Botswana, particularly socio-economic impact of drought on sectoral output, factor payments and households’ welfare.
Ref. [11] conducted a survey ranchers’ drought management strategies in Wyoming, a drought-prone state. The survey found that the greatest drought impact to ranching operations is decreased grazing capacity, followed by profitability, winter feed availability and irrigation water. Many ranchers manage drought in similar ways by selling livestock and buying feed, which highlights the market risks of major price fluctuations associated with drought. The findings suggest “three components of national drought policy that encourages flexibility and thus increases resilience of ranches to drought: (1) encouraging forage-sharing mechanisms; (2) promoting income diversification that is independent of climatic variability; and (3) facilitating a shift to diversified livestock production systems. These measures could increase sustainability of ranching livelihoods and provision of ecosystem services despite predicted increases in intensity and duration of future droughts.”
As for the region studied in this work, although there are numerous studies that analyze different characteristics of the sheep sector in Extremadura, none have focused on economic impact models using a quantitative approach. Some of these studies for Spain and Extremadura are mentioned below.
Ref. [12] presents a summary of definitions and structural particularities of extensive livestock farming, in contrast with intensive systems. The study estimated that around 54% of production of sheep and goat meat is made by grazing without external feed supplementation, and 37% is done through a mixture of grazing and external feeding.
Ref. [13] studied the financial structure of the sector, showing as a result the low profitability of the activity. As for costing models, Refs. [14,15] develops the Agri-benchmark scheme, which uses a homogeneous methodology that allows the comparison of balance sheets estimated for different farms, estimating two schemes of representative farms for Extremadura. The models estimated from 2008 to 2018 show a large fluctuation in feeding supplementation costs in comparison with other forms of expenditure.
Refs. [22,23] analyze the structure of Dehesa Extremadura farms, presenting indicators of sustainability. In the case of sheep farms, 37.8% of them have a low stocking rate with low input needs such as labor and materials, and with extensive use of the land and grass. However, they have the lowest profitability, with a small profit margin (3.1%). Ref. [16] conducted an initial study of water availability for farm animals in Extremadura. The methods included field work, digital topographic maps and aerial photographs to assess the potential hydrological resources of each farm, and interviews to gather information about water management. “Results indicate that almost 20% of the farms suffer problems of water availability in summer and almost 50% during droughts. Data indicate a positive relationship between problems of water supply and the degree of aridity.”
Ref. [5] presents an extensive exploration of impacts and vulnerabilities of climate change on extensive livestock in Spain. However, the approach is qualitative and does not present monetized estimations of economic impacts. The report itself identifies the absences of cost impact estimation and promotes the developing of economic assessments as the basis for the construction of short-, medium- and long-term estimation models for monitoring and developing adaptation strategies.
As the conclusion of this section, two points can be summarized. First, international experience shows that there is not a unique standardized model to evaluate climate change and drought impacts over extensive livestock production. Second, there are no monetized economic assessments of this activity in Extremadura. As for a methodological approach, impact studies can be divided into two groups: (i) those which follow an agronomical approach, relating water availability with grazing potential, such as [8,9]; and (ii) those which follow a sectorial or macroeconomic approach, applying input output or general equilibrium models, relating drought events with impacts on profits and other socioeconomic variables such as [10,21]. In the case of Extremadura, none of these approaches have been applied, and most studies are focalized in the description of the productive structure of the sector [12,13,22,23], over water availability at the farm level [16] and qualitative characterizations of climate change impacts [5].
Given the fact that there is not a unique standardize model and considering the singularities of farms in Extremadura described in the literature, a specific economic impact valuation model is presented here, adapted to the objectives of the study and information availability. To specify the approach, the characteristics of the productive cycle of the case studied are summarized in the next section.
Production Cycle and Structure of Meat Sheep in Extremadura
There is no single definition of extensive livestock farming: at least ten definitions are listed for the case of farms in Spain [12]. Through a survey, the authors arrive at the following definition:
“extensive livestock farming takes advantage of the natural resources of the territory, with a low use of external inputs and mainly through grazing. In general, it is characterized by the use of livestock breeds adapted to the territory, the use of diverse pastures depending on their spatial and temporal availability, and the maintenance of the environment”[12] (p. 25).
In the case of Extremadura, the activity is carried out in the open field and in large pieces of land. Only the fattening of the lambs is carried out in controlled environments in feedlots. The reproductive cycle has been genetically modified so that the sheep can become pregnant and give birth at any time of the year, in order to distribute calving more evenly over time and therefore control the flow of lambs into the feedlot.
A sheep productivity level was set for the analyzed sample on 3 calving within a 2-year period. To reach the productivity goal, the consumption of natural pastures was complemented with feed. A lower quantity or quality of pastures implies higher supplementation costs.
The supplementation scheme implies that between 75% and 90% of the production cost structure is associated with the mother’s diet. The food purchased consists of concentrate (feed, corn, oats, barley, wheat, protein compound) and volume (hay and straw). According to interviews with specialists, the ideal ration in theory is 60% ration of volume and 40% concentrate, although in practice 50% are given for both.
As for the climate impact, the most important risks that affect the activity in the region is precipitation shortage and droughts, events that negatively affect the quantity and quality of natural pastures. During these shortages, the mothers’ fertility might decrease. As a productivity objective is pursued, the sheep will still be pregnant and the number of lambs will not decrease, but at a higher cost: protein and energy needs are stabilized through food supplementation. In some cases, it also involves increasing spending on hormonal treatments.
Given the productive structure, those climatic events impact on the cost structure of the sector, rather than generating a decrease in productivity. The critical variable is the lower production of natural pasture, which translates into greater purchases of balanced feed and, to a lesser extent, an increase in fertility treatments.
Therefore, this work will focus on designing an assessment to evaluate the level of increase of supplementary alimentation cost in comparison with the occurrence of precipitation shortages.
3. Methods and Data
3.1. The Data
The study focuses on a set of 1583 farms associated into the cooperative EA Group, which was created as result of the fusion of two second grade cooperatives: Oviso and Cordesur. During the period studied, members of EA Group had a total of 804,000 animals, which represents more than 40% of the total sheep in Extremadura. The geographical distribution of the farms is presented in Figure 1, with the highest concentration being observed in the central/eastern area of the Autonomous Community.
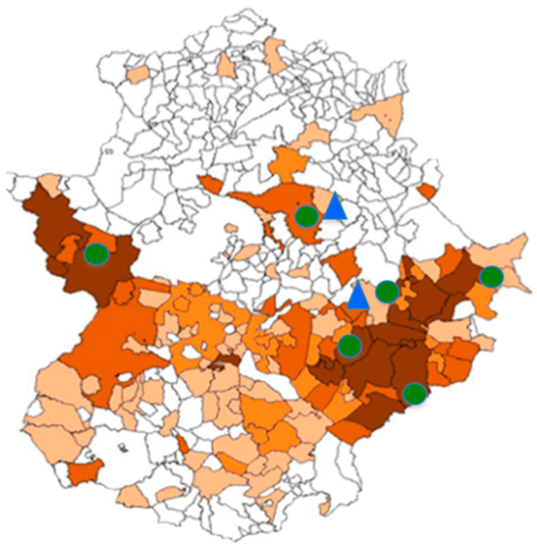
Figure 1.
Geographic distribution of farms. This figure has been provided by EA Group (2019).
The following data were used:
- To estimate the cost structure of the sector, the model of representative farm designed by the Spanish Ministry of Agriculture and Fisheries, Food and Environment for the period 2008–2018 was used. The model results were from the Agri-benchmark scheme, which uses a homogeneous methodology that allows the comparison of the results obtained for all farms, regardless of the place in which they are located. This methodology is fundamentally based on the Typical Farm concept from the TIPI-CAL Calculation Model, a technical-economic analysis tool that allows monitoring of basic financial activities [14,15]. The data of costs and financial activities ranged from 2008 to 2018.
- The two representative models (owner and tenant) of Extremadura were used. The owner model balance sheet is estimated on a stock of 1000 animals, while the tenant is based on 600 animals. Interviews were carried out with specialists from EA group to obtain confirmation that the structure of both schemes is representative of the group of farms associated with EA Group cooperative. Interviews were carried out during 2018 in Badajoz, Villanueva and Mérida as part of research activities of the project 086-18 “Impact of climate change over livestock production”, funded by Fundación Bancaria Caja de Extremadura.
- To analyze the impact on feed price, data provided by the Ministry of Agriculture and Fisheries, Food and Environment of Spain were used. [24]
- For the determination of the land tenure structure of each farm, data of the EA Group were used, where information on the rented and owned land is available from all farms of the sample.
- Regarding climate information, precipitation data sets provided by the meteorology department of the University of Extremadura from primary sources of the National Meteorology Service (AEMET) were used. Meteorological stations of the area with the highest concentration of livestock were selected: Campanario, Don Benito and Monterrubio de la Serena.
3.2. Methodology
The methodology follows an empirical approach, based on evaluating the performance of critical variables (expenditure on supplementation against precipitation levels) during the period 2008–2018. This approach is consistent with the objective of the study: to provide orders of magnitude of the economic impact. Therefore, the objective of the methodology was to develop a criterion to select cases of considerable deviations of the critical variable, and compare and contrast this with the existence, or not, of adverse weather conditions. The rationale for this method can be found in [25,26,27,28,29]
The basic steps of the methodology were the following:
- The evolution of costs is analyzed, identifying if there are significant deviations that might be related with unfavorable climatic conditions, specifically rainfall deficits in comparison to historical behavior.
- Series are separated in prices and quantities, in order to evaluate which effect has the greatest impact on cost increases.
- If deviations of variables can be attributed to rainfall deficits, the economic valuation of the phenomenon will be estimated by means of a counterfactual scenario of critical variables. The counterfactual scenario represents which value would have been in a non-extreme scenario. Two counterfactual values are estimated: one for quantities and one for the price. Different criteria to determine the counterfactual value can be applied:
- ○
- A simple average of the entire series
- ○
- A simple series average up to the year prior to the critical event
- ○
- An interpolated value
- ○
- An estimated value according to the trend line estimated by ordinary least squares
- ○
- A theoretical or exogenous value.
Regarding results, cost increase will be valued per animal in both farm models (rented and ownerships schemes) and will be extrapolated to all farms of the sample, with data of the number of animals and land tenure per farm. To extrapolate, the owner and tenant model were used in proportion to the owned and leased land of each farm. As cost-increase was valuated per animal, where extrapolation was proportional to the number of animals of each farm.
3.3. The Extrems-Identification Model
The methodology estimates the trend of the critical variable and selects cases of considerable deviations from it. Over empirical bases, it was then studied whether those deviations can be explained by climate events.
There are many models to estimate the trend, such as linear and non-linear regression, polynomial adjustment, moving averages and local regression models. However, in empirical studies the estimation of the trend is mainly done by using a linear or log-linear model [26,27,28,29]. The equations of such models are:
where is the actual value in year t, is the time period, is the intercept, is the critical variable coefficient and is the stochastic error. The absolute deviation from the trend is:
where is the value of critical variable in year t and is the estimated trend in year t. To measure the magnitude of each deviation, there are different approaches. One of them is to define exogenous scales in relative deviation [28]:
where is the relative deviation, is the absolute deviation and is the estimated trend. The other approach is to classify in relation to the standard deviation of the sample [29]
where k is the number of standard deviations that represents the limit from which cases are considered non-extreme or extreme. The selection of k is empirical and depends on the distribution of the sample.
Either classification allows for identifying cases of deviations that must contrasted with climate variables to determine if there is any kind of attribution. Therefore, having the potential cases, the following step is to analyze climatic variables and determine if there was a negative context in those years.
The methodology allowed us to easily identify extreme deviations of the variable that are potentially explained by climate shocks. It is a simple approach which deals properly with scarce information. The trend estimation allows for reconstructing a theoretical scenario for every year, in the absence of climate variability. This means that the approach constructs a baseline or counterfactual scenario from which is possible to measure the production loss and consequently the loss of income using different price forecasts.
However, the analyzed series in this research has two limitations for estimating the trend: it is short and severely affected by extreme events, generating a bias in the trend, influenced by the effect that is trying to be isolated. Therefore, the approach is simplified by calculating the simple average of the series and its standard deviation. Despite the fact that the simple average is also affected by extremes, the bias was reduced in comparison with the use of the linear trend. Once the extreme cases were identified, they were contrasted with the climate information in order to attribute such deviations to adverse climatic conditions.
For the cases that an attribution is confirmed, the economic valuation was carried out. For this, the valuation price and the counterfactual scenario of feeding quantities needed to be determined. The counterfactual scenario represents the level of feeding used in non-extreme conditions. Since the valuation price is considered exogenous (see Appendix B), the spot price of the analyzed year is used. Regarding counterfactual quantities, the average quantity level excluding the years that have been considered to be extremes was used.
In all, the methodology can be summarized as follows:
The dichotomic function selects feed values that exceeds one standard deviation from the index average:
with , where is the feed index, the feed quantity and is the average of the time series.
Values of are potential cases of large feed values generated by adverse climate conditions. Those cases are contrasted with precipitation data, using the same extreme selection methodology.
Counterfactual alimentation quantity is used to estimate the increase of alimentation costs during years with precipitation shortage. It is defined as the simple average excluding the extreme cases identified by :
Incremental cost () is estimated as the difference between observed feed during the extreme event () and the counterfactual quantity (), valuated at the feed market price of the year ():
3.4. Extrapolation
Grazing land () of each farm can be owned (), rented () or a combination of both: .
The total number of sheep () can be distributed according to land tenure (), estimating the number of sheep in each type of land ownership: .
The number of sheep under a land renting scheme () is estimated in relation to the proportion of rented land: . Likewise, the number of sheep under a land ownership scheme () is estimated in relation to the proportion of owned land: .
The total number of sheep under each scheme () is estimated in addition to the cases of each farm:
With the incremental cost () and the number of sheep estimated for each scheme (), the total incremental cost for the hole sample () is estimated:
4. Results
The maximum values for feed supplementation costs are observed for 2012 and 2017 (Figure 2).
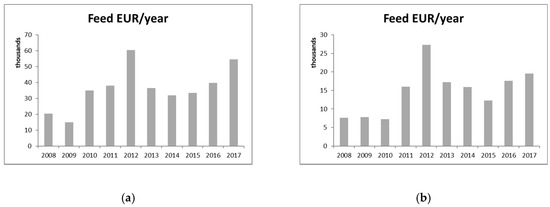
Figure 2.
Feed supplementation cost in euros. (a) Ownership scheme, (b) renting scheme. Source: Own elaboration with data from Ministerio de Agricultura y Pesca, Alimentación y Medio Ambiente, España [14,15].
Splitting the series into prices and quantities, it was verified that the increase in both years is mostly explained by the quantity effect (Figure 3). Fluctuations in feed prices respond to exogenous effects, given the fact that they are made from commodities in which prices are set in the international market (Appendix B).
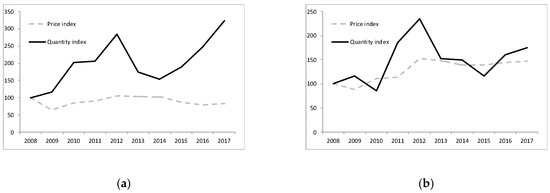
Figure 3.
Price and quantity indexes, 2008=100. (a) Ownership scheme, (b) renting scheme. Source: Own elaboration with data from Ministerio de Agricultura y Pesca, Alimentación y Medio Ambiente, España [14,15].
The methodology identified three cases of deviation that exceed the standard deviation threshold: two in the owner scheme and one in the renting scheme (). The identified years were 2012 and 2017 (Figure 4a,b).
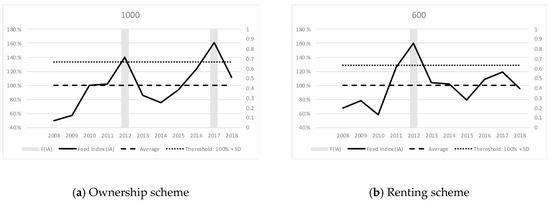
Figure 4.
The feed index and one standard deviation threshold. (a) Ownership scheme, (b) Renting scheme. Source: Own elaboration.
The selected years have to be contrasted with climate information. The precipitation characterization for Extremadura from the National Meteorology Service of Spain (Appendix C), shows that 2012 was characterized between dry and very dry, and 2017 between very dry and extremely dry (Table 1).

Table 1.
Precipitation characterizations for Extremadura.
However, to apply the identification of extremes, rainfall data of the station with the highest territorial influence for the farms studied was used (Don Benito Station). Precipitation shortages are observed for 2012 and 2017, reaching minimal values of the sample. In both cases, the values exceeded the threshold of one standard deviation (Figure 5). It must be pointed out that even though year 2015 is characterized as very dry, the methodology did not identify extremes either in feed supplementation or in precipitation shortages in Don Benito Station.
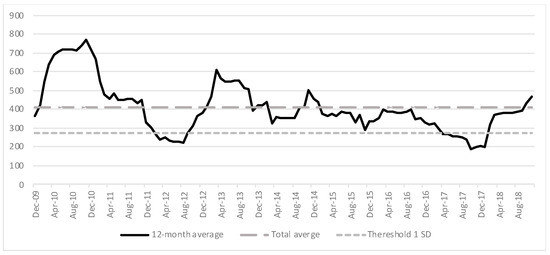
Figure 5.
Accumulated rainfall of 12 months and one standard deviation threshold for Don Benito Station. Own elaboration with data from the Meteorology Department of the University of Extremadura.
Therefore, the increase in feed supplementation in 2012 and 2017 can be attributed to decreases in quantity and the quality of grass because of the precipitation shortage. When applying the valuation methodology, the incremental alimentation needs in the context of precipitation shortage was estimated as 83.7 kilos per sheep in 2012 and 116.2 kilos per sheep in 2017 in the ownership scheme, and 68.2 kilos per sheep in 2012 in the renting scheme (Figure 6a,b).
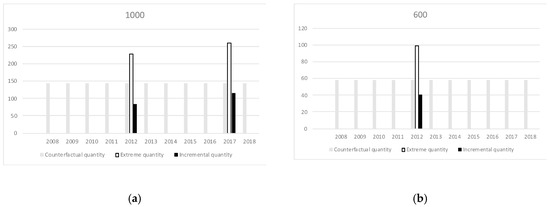
Figure 6.
Incremental cost valuation. (a) Ownership scheme, (b) Renting scheme. Source: own elaboration.
Valuating incremental quantities with spot prices, incremental cost was estimated as €22.3–€24.4 per animal in the ownership scheme and €31.3 in the renting scheme. Distributing incremental cost in all farms in relation with land tenure, aggregated incremental cost for the hole sample was estimated to be €13.8 million in 2012 and €6.7 million in 2017. A summary of the results can be found in the Table 2:
Table 2.
Summary of results.
Extrapolating results for the hole sheep stock of Extremadura, incremental cost was valued at €41.2 million in 2012 and €12.9 million in 2017.
Impact can also be evaluated at a microeconomic scale, estimating the benefits of the balance sheet (Appendix A) of each representative farm (Figure 7):
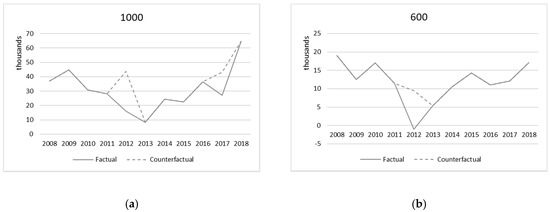
Figure 7.
Benefits in Euros per farm. (a) Ownership scheme, (b) Renting scheme. Source: Own elaboration.
- In the ownership scheme, the estimated benefit of €43,624 in 2012 was reduced to €15,974, whereas the estimated benefit of €43,323 in 2017 was reduced to €27,019.
- In the renting scheme, the estimated benefit of €9425 of 2012 turned into a negative result of €1031.
5. Conclusions
An empirical study was presented to evaluate the impact of precipitation shortages over the cost structure of meat lamb production in Extremadura. The main findings can be summarized in three points:
- there is a relation between precipitation minimums and feed quantity maximums of the series analyzed.
- the major impact of precipitation shortages is an increase in feed supplementation, with an estimated impact to the meat lamb sector of Extremadura of €54.1 million over two years.
- there is a reduction of benefits at the farm level: 50% reduction on average in the ownership scheme and total reduction in the renting scheme, showing negative results during the precipitation shortage of 2012.
For point one, the result is consistent with findings across the literature concerning the negative relation between water availability and grazing potential. Given the singularities of the production strategy, this result validates the adaptation strategy of farmers of increasing feed supplementation during droughts, in order to maintain productivity levels. Point two shows that the aggregated cost of feed supplementation might not be considerable for the whole sector and even less so at the macroeconomic scale. However, the third point shows a huge microeconomic impact, estimating profit reduction or even bankruptcy in the renting scheme. This last result is consistent with studies in Extremadura that show the low profitability and financial fragility of the activity.
In all, the methodology provided a first order of magnitude of the impact level both at the macro and micro scale, that contributes to previous discussions about sustainability and vulnerability to climate change presented across the literature, but where a monetized impact evaluation was missing. However, among the limitations of the study, it can be mentioned that it lacks a sensitivity analysis. If only extreme cases are selected, milder drought events will not be considered and therefore impacts might be underestimated. To perform a sensibility analysis, a theoretical experimental approach is needed, relating pasture quantity and quality of pastures with the precipitation level, and energy and protein needs of animals at different stages of the reproduction cycle. However, this experimental approach will not take into account adaptation behavior from farmers, which is incorporated into the empirical approach presented in this work. Yet, another limitation is related to the two production models of owner and renting scheme used to estimate the economic impact. Despite being representative of most farms of the sample, it is not possible to draw a line between farms with small and large stock of animals, or with farms that implement new technologies. Both points are important to differentiate levels of impact according to cost structure and production techniques.
Despite its limitations, estimates are robust and directly convertible into monetary impacts, providing a baseline for policy design. In the context of data-driven policy making, this provides a tool for European Policy funding negotiation, in a sector which is considered strategic because of its positive impacts on the environment, the generation of employment and maintenance of rural populations in marginal areas and for the production of high-quality food minimizing the use of natural resources.
Regarding the latter, the results show that there is space to apply public policy to the better development of the sector. First, fiscal and financial costs of public interventions might not be considerable at the macro scale, but can make the difference at a micro scale, stabilizing profits to ensure the financial sustainability of the activity. Second, different impacts in ownership and renting schemes opens up a new research field regarding land tenure relation to financial fragility. Third, the importance of feed supplementation in cost structure and the fact that price is highly correlated with international commodities prices drives a discussion on how to hedge not only quantities but also price risk fluctuations.
As for future lines of research, besides a deeper specification of the model such as the treatment of non-extreme cases, the following are derived from this study: estimating future economic impacts by means of different climate forecast scenarios, assessing how a decrease in profits affects social the vulnerability of local producers, evaluate cost-benefit of adaptation strategies of remote sensing technology for optimal use of natural pastures, developing hedging tools that are accessible to farmers and valuation of environmental assets such as natural pastures and water.
Author Contributions
Conceptualization, E.T. and A.G.-G.; Methodology, E.T.; Validation, E.T., A.G.-G and I.P.-F.; Formal Analysis, E.T.; Investigation, E.T., A.G.-G. and I.P.-F.; Resources, A.G.-G.; Writing—Original Draft Preparation, E.T.; Writing—Review & Editing, I.P.-F.; Visualization, I.P.-F.; Supervision, A.G.-G.; Project Administration, A.G.-G.; Funding Acquisition, A.G.-G. All authors have read and agreed to the published version of the manuscript.
Funding
This work was supported by the Fundación Caja de Extremadura (UEx project ref. 086-18).
Acknowledgments
The authors would like to thank EA Group for supporting this work by providing experimental data. The authors would also like to thank the following for useful discussions during preparation of the document: F. Javier Acero, Beatriz Agudo, Miguel Cortés, Antonio Jurado, Marcelino Núñez, Pedro L. Rodriguez Medina, Antonio Serrano and two anonymous reviewers for their useful comments on an earlier version of the manuscript.
Conflicts of Interest
The authors declare no conflict of interest.
Appendix A. Cost Structure of Farms. RENGRATI Models for Extremadura
Table A1.
Ownership scheme. FARM 1000-EXT. Meat sheep. In Euros.
Table A1.
Ownership scheme. FARM 1000-EXT. Meat sheep. In Euros.
| 2008 | 2009 | 2010 | 2011 | 2012 | 2013 | 2014 | 2015 | 2016 | 2017 | 2018 | |
|---|---|---|---|---|---|---|---|---|---|---|---|
| Crops | 10,910 | 9436 | 7735 | 3991 | 1430 | 9900 | 8762 | 14,159 | 10,424 | 9750 | 14,238 |
| Feed | 20,305 | 14,932 | 35,007 | 37,906 | 60,499 | 36,589 | 31,971 | 33,344 | 39,758 | 54,589 | 40,642 |
| Variable | 9619 | 11,004 | 7294 | 16,164 | 17,994 | 18,211 | 14,511 | 14,137 | 18,984 | 23,167 | 23,779 |
| Fix | 15,083 | 9925 | 10,203 | 10,530 | 11,318 | 11,479 | 11,479 | 11,131 | 11,131 | 11,255 | 12,425 |
| Renting | 0 | 0 | 0 | 0 | 0 | 0 | 0 | 0 | 0 | 0 | 0 |
| Financial | 349 | 1607 | 1415 | 1946 | 1926 | 0 | 16 | 0 | 0 | 0 | 0 |
| Amortization | 2523 | 3597 | 3597 | 3597 | 3597 | 3597 | 3854 | 3854 | 3050 | 4397 | 3922 |
| Total expenditures | 58,789 | 50,501 | 65,252 | 74,134 | 96,764 | 79,777 | 70,594 | 76,626 | 83,347 | 103,158 | 95,006 |
| Total income | 115,709 | 115,413 | 116,548 | 127,721 | 138,482 | 114,262 | 119,206 | 123,383 | 144,032 | 165,172 | 184,787 |
| Benefits | 36,920 | 44,911 | 30,936 | 28,226 | 15,974 | 8374 | 24,343 | 22,488 | 36,417 | 27,019 | 64,601 |
Note: The table shows the cost structure ownership farms elaborated by RENGRATI [14,15]. Ministerio de Agricultura y Pesca, Alimentación y Medio Ambiente.
Table A2.
Renting scheme. FARM 600-EXT. Meat sheep. In Euros.
Table A2.
Renting scheme. FARM 600-EXT. Meat sheep. In Euros.
| 2008 | 2009 | 2010 | 2011 | 2012 | 2013 | 2014 | 2015 | 2016 | 2017 | 2018 | |
|---|---|---|---|---|---|---|---|---|---|---|---|
| Crops | 4521 | 6286 | 4062 | 4564 | 4676 | 4742 | 3500 | 3850 | 3840 | 3915 | 3915 |
| Feed | 7628 | 7816 | 7286 | 15,974 | 27,311 | 17,250 | 15,897 | 12,264 | 17,613 | 19,568 | 16,802 |
| Variable | 5984 | 4245 | 4021 | 8751 | 9779 | 9912 | 9234 | 8767 | 8889 | 11,692 | 12,300 |
| Fix | 8474 | 5598 | 6038 | 6574 | 6293 | 6426 | 6383 | 6252 | 6572 | 6372 | 7350 |
| Renting | 12,408 | 14,718 | 17,865 | 10,685 | 10,947 | 11,139 | 10,800 | 11,190 | 11,190 | 10,538 | 10,538 |
| Financial | 551 | 1426 | 1251 | 951 | 551 | 375 | 191 | 0 | 21 | 0 | 0 |
| Amortization | 1613 | 4113 | 4170 | 4494 | 4094 | 4094 | 4094 | 4094 | 4894 | 4528 | 4528 |
| Total expenditures | 41,178 | 44,203 | 44,694 | 51,992 | 63,651 | 53,939 | 50,100 | 46,418 | 53,019 | 56,613 | 55,433 |
| Total income | 61,560 | 56,687 | 62,514 | 64,322 | 63,489 | 60,184 | 61,231 | 61,268 | 64,691 | 69,389 | 59,961 |
| Benefits | 19,059 | 12,484 | 16,980 | 11,461 | −1031 | 5363 | 10,537 | 14,255 | 11,042 | 12,133 | 17,171 |
Note: The table shows the cost structure rented farms elaborated by RENGRATI [14,15]. Ministerio de Agricultura y Pesca, Alimentación y Medio Ambiente.

Figure A1.
Total distribution of expenditures in percentage for the period 2008–2017. Source: Own elaboration with data from Ministerio de Agricultura y Pesca, Alimentación y Medio Ambiente [14,15].
Figure A1.
Total distribution of expenditures in percentage for the period 2008–2017. Source: Own elaboration with data from Ministerio de Agricultura y Pesca, Alimentación y Medio Ambiente [14,15].

Table A3.
Mean, standard deviation (SD), maximin and minimum of variables.
Table A3.
Mean, standard deviation (SD), maximin and minimum of variables.
| FARM 1000-EXT. Meat Sheep. | FARM 600-EXT. Meat Sheep. | |||||||
|---|---|---|---|---|---|---|---|---|
| Expenditures | Mean | SD | Max | Min | Mean | SD | Max | Min |
| Crops | 9158 | 3809 | 14,238 | 1430 | 4352 | 760 | 6286 | 3500 |
| Feed | 36,867 | 13,006 | 60,499 | 14,932 | 15,037 | 6019 | 27,311 | 7286 |
| Variable | 15,897 | 5260 | 23,779 | 7294 | 8507 | 2713 | 12,300 | 4021 |
| Fix | 11,451 | 1383 | 15,083 | 9925 | 6576 | 757 | 8474 | 5598 |
| Renting | 0 | 0 | 0 | 0 | 12,002 | 2293 | 17,865 | 10,538 |
| Financial | 660 | 861 | 1946 | 0 | 483 | 521 | 1426 | 0 |
| Amortization | 3599 | 483 | 4397 | 2523 | 4065 | 856 | 4894 | 1613 |
| Total expenditures | 77,632 | 16,322 | 103,158 | 50,501 | 51,022 | 6551 | 63,651 | 41,178 |
| Total income | 133,156 | 23,258 | 184,787 | 114,262 | 62,300 | 3252 | 69,389 | 56,687 |
| Benefits | 30,928 | 15,050 | 64,601 | 8374 | 11,768 | 5686 | 19,059 | −1031 |
| Feed Price | 228 | 32 | 266 | 161 | 236 | 42 | 284 | 160 |
| Feed in tns | 162 | 54 | 260 | 80 | 62 | 18 | 99 | 36 |
| Feed in tns per sheep | 0.16 | 0.05 | 0.26 | 0.08 | 0.06 | 0.02 | 0.10 | 0.04 |
Source: Own elaboration with data from Ministerio de Agricultura y Pesca, Alimentación y Medio Ambiente [14,15].
Appendix B. Feed Price Variability
Analyzing variability sources, it is observed that the price of feed is exogenous, since it is closely linked to the evolution of the international commodities that comprise it (basically barley, corn, wheat, soybean meal and sunflower meal).

Figure A2.
Feed price and commodity prices. Source: Own elaboration with data from Ministerio de Agricultura, Pesca y Alimentación [24] and Reuters [41].
Figure A2.
Feed price and commodity prices. Source: Own elaboration with data from Ministerio de Agricultura, Pesca y Alimentación [24] and Reuters [41].

Estimating a multiple linear regression model between those variables, a regression coefficient of 84% is estimated (Table A3). Given the high explanatory level of the international price of commodities, the internal price of feed will be considered as an exogenous variable (that is, not influenced by internal climatic factors).
Table A4.
Multiple linear regression model between commodities and feed.
Table A4.
Multiple linear regression model between commodities and feed.
| Dependent Variable: PIENSO | ||||
|---|---|---|---|---|
| Method: Least Squares | ||||
| Sample: 1/13/2012 12/27/2019 | ||||
| Included Observations: 416 | ||||
| Variable | Coefficient | Std. Error | t-Statistic | Prob. |
| C | 32.53264 | 2.405863 | 13.52223 | 0.0000 |
| CEBADA | 0.047925 | 0.014003 | 3.422542 | 0.0007 |
| MAIZ | 0.227812 | 0.024989 | 9.116647 | 0.0000 |
| SOYBEEN | 0.194113 | 0.018139 | 10.70115 | 0.0000 |
| SUNFLOWER | 0.052792 | 0.025340 | 2.083371 | 0.0378 |
| TRIGO | 0.166256 | 0.035119 | 4.734050 | 0.0000 |
| R-squared | 0.847764 | Mean dependent var | 100.2043 | |
| Adjusted R-squared | 0.845908 | S.D. dependent var | 10.79049 | |
| S.E. of regression | 4.235761 | Akaike info criterion | 5.739321 | |
| Sum squared resid | 7356.084 | Schwarz criterion | 5.797456 | |
| Log likelihood | –1187.779 | Hannan-Quinn criter. | 5.762307 | |
| F-statistic | 456.6389 | Durbin-Watson stat | 0.225999 | |
| Prob(F-statistic) | 0.000000 | |||
Note: The feed price is from Ministerio de Agricultura, Pesca y Alimentación [24], the commodities prices are from Reuters [41]. All variables are in same unit: €/TON.
Appendix C. Precipitation Characterization

Figure A3.
Precipitation characterization. Source: Agencia Estatal de Meteorología. Ministerio para la Transición Ecoloógica. Gobierno de España [30,31,32,33,34,35,36,37,38,39,40]. EH = Extremely humid: precipitation exceed maximum registered record during 1981–2010. MH = Very humid: f<20%. Precipitations are within the interval of the 20% most humid years. H = Humid: 20%<f<40%. N = Normal: 40%<f<60%. Precipitation are around the median value. S = Dry: 60%<f<80%. MS = Very Dry: f>80%. ES = Extremely dry: precipitation do not reach minimum levels registered during 1981–2010.

References
- IPCC Special Report. Climate change and land. 2019. Available online: https://www.ipcc.ch/srccl/ (accessed on 23 July 2020).
- Partnership for Research and Innovation in the Mediterranean Area (PRIMA). Available online: http://prima-med.org/ (accessed on 23 July 2020).
- IPCC Climate Change 2014: Impacts, Adaptation and Vulnerability. 2014. Available online: https://www.ipcc.ch/report/ar5/wg2/ (accessed on 18 August 2020).
- Díaz, I.; Achkar, M.; Mazzeo, N. Drought vulnerability assessment of cattle producers in the Sierras del Este-Uruguay: Interactions between actors and agents. Outlook Agric. 2018, 47, 315–325. Available online: https://journals.sagepub.com/doi/abs/10.1177/0030727018808807 (accessed on 23 July 2020). [CrossRef]
- Rubio, A.; Roig, S. Impactos, Vulnerabilidad Y Adaptación En Los Sistemas Extensivos De Producción Ganadera En España. Oficina Española De Cambio Climático. Ministerio De Agricultura Y Pesca, Alimentación Y Medio Ambiente. 2017. Available online: https://www.adaptecca.es/sites/default/files/documentos/informe_ganaderia_extensiva_cambio_climatico.pdf (accessed on 23 July 2020).
- Subdirección General de Productos Ganaderos. Dirección General de Producciones y Mercados Agrarios. In El Sector Ovino Y Caprino De Carne En Cifras; Principales Indicadores Económicos; Ministerio de agricultura: Madrid, Spain, 2018. Available online: https://www.mapa.gob.es/es/ganaderia/publicaciones/indicadoreseconomicosovinoycaprinocarne2018_tcm30-428265.pdf (accessed on 18 August 2020).
- Extremadura21 El Cordero Extremeño Mira Hacia La Meca. 2017. Available online: https://extremadura21.com/2017/01/20/el-cordero-extremeno-mira-hacia-la-meca/ (accessed on 18 August 2020).
- Moore, A.; Ghahramani, A. Climate change and broadacre livestock production across southern Australia. 1. Impacts of climate change on pasture and livestock productivity, and on sustainable levels of profitability. Glob. Chang. Biol. 2013, 19, 1440–1455. Available online: https://onlinelibrary.wiley.com/doi/epdf/10.1111/gcb.12150 (accessed on 23 July 2020). [CrossRef] [PubMed]
- Guidry, K.M.; Pruitt, J.R. Damages to Louisiana agriculture from natural disasters. Choices Mag. FoodFarm Resour. Issues 2012, 27, 1–6. Available online: https://www.jstor.org/stable/pdf/choices.27.3.09.pdf?seq=1 (accessed on 23 July 2020).
- Ziolkowska, J.R. Socio-Economic Implications of Drought in the Agricultural Sector and the State Economy. Economies 2016, 4, 19. Available online: https://www.mdpi.com/2227-7099/4/3/19/pdf (accessed on 23 July 2020). [CrossRef]
- Kachergis, E.; Derner, J.D.; Cutts, B.B.; Roche, L.M.; Eviner, V.T.; Lubell, M.N.; Tate, K.W. Increasing flexibility in rangeland management during drought. Ecosphere 2014, 5, 77. Available online: https://esajournals.onlinelibrary.wiley.com/doi/epdf/10.1890/ES13-00402.1 (accessed on 23 July 2020). [CrossRef]
- Ruiz, J.; Herrera, P.M.; Barba, R.; Busqué, J. Definición y caracterización de la ganadería extensiva en España. In Fund Entretantos Y Minist. De Agric. PescaAliment. Y Medio Ambiente; 2017; Available online: https://www.mapa.gob.es/es/ganaderia/temas/produccion-y-mercados-ganaderos/informesobreganaderiaextensivaenespanaoctubre2017nipo_tcm30-428264.pdf (accessed on 23 July 2020).
- ECREA. Resultados técnico-económicos del Ganado Ovino de carne en 2015. Estudios de Costes y rentas de las Explotaciones Agrarias. Subdirección General de Análisis, Coordinación y Estadística, Subsecretaría. Ministerio de Agricultura, Pesca y Alimentación, Gobierno de España. 2015. Available online: https://www.mapa.gob.es/es/ministerio/servicios/analisis-y-prospectiva/ganadoovinodecarne_tcm30-482451.pdf (accessed on 23 July 2020).
- Ministerio de Agricultura, pesca y Alimentación, Gobierno de España. RENGRATI Red Nacional De Granjas Típicas (OVINO DE CARNE) 1000-EXT: Resultados ejercicio económico ovino de carne. 2017. Available online: https://www.mapa.gob.es/es/ganaderia/temas/produccion-y-mercados-ganaderos/sectores-ganaderos/red-de-granjas-tipicas/ovino-caprino/default.aspx (accessed on 28 August 2020).
- Ministerio de Agricultura, pesca y Alimentación, Gobierno de España. RENGRATI Red Nacional de Granjas Típicas (OVINO DE CARNE) 600-EXT: Resultados ejercicio económico ovino de carne. 2017. Available online: https://www.mapa.gob.es/es/ganaderia/temas/produccion-y-mercados-ganaderos/sectores-ganaderos/red-de-granjas-tipicas/ovino-caprino/default.aspx (accessed on 28 August 2020).
- Schnabel, S.; Pulido, M.; Lavado, J.F. The availability of water in ranches of Mediterranean type climate. In Grupo de Investig. GeoAmbiental Univ. de Extremad.; 2009; Available online: https://pdfs.semanticscholar.org/eeee/e3dea74d17fa17b4f20e157c4d90d1b5a22c.pdf (accessed on 23 July 2020).
- Morales-Reyes, Z.; Navarro-Ríos, M.; Moleón, M.; Mateo-Tomás, P.; Blanco, G.; Botella, F.; Donázar, J.A.; Margalida, A.; Pérez, I.; Valverde, M.; et al. Percepción de los ganaderos sobre la sostenibilidad de los sistemas agroganaderos tradicionales en España en un contexto de cambio global. In Actas XXVI Jorn. Técnicas SEAE X Semin. Agroecol. C. Climático Y Agrotur.; 2017; Available online: http://hdl.handle.net/10261/179061 (accessed on 23 July 2020).
- Amblar, P.; Casado, M.J.; Pastor, A.; Ramos, P.; Rodríguez, E. Guía de Escenarios regionalizados de cambio climático sobre España a partir de los resultados del IPCC-AR5. 2017. Available online: http://www.aemet.es/documentos/es/conocermas/recursos_en_linea/publicaciones_y_estudios/publicaciones/Guia_escenarios_AR5/Guia_escenarios_AR5.pdf (accessed on 23 July 2020).
- Herrera, P.M. Ganadería y cambio climático: Un acercamiento en profundidad. Fundación Entretantos Y Plataforma Por La Ganadería Extensiva Y El Pastoralismo. 2020. Available online: http://www.ganaderiaextensiva.org/wp-content/uploads/2020/03/CuadernoEntretantos6_GanaderiayCC.pdf (accessed on 23 July 2020).
- Escarcha, J.F.; Lassa, J.A.; Zander, K.K. Livestock Under Climate Change: A Systematic Review of Impacts and Adaptation. Climate 2018, 6, 54. Available online: https://www.mdpi.com/2225-1154/6/3/54 (accessed on 18 August 2020). [CrossRef]
- Juana, J.S.; Makepe, P.M.; Mangadi, K.T.; Narayana, N. The Socio-economic Impact of Drought in Botswana. Int. J. Environ. Dev. 2014, 11, 43–60. Available online: https://www.researchgate.net/profile/James_Juana/publication/282132415_Socioeconomic_Impact_of_Drought_in_Botswana/links/560413b608aea25fce30b37e/Socioeconomic-Impact-of-Drought-in-Botswana.pdf (accessed on 23 July 2020).
- Gaspar, P.; Mesías, F.J.; Escribano, M.; Rodriguez de Ledesma, A.; Pulido, F. Economic and management characterization of dehesa farms: Implications for their sustainability. Agrofor. Syst. 2007, 71, 151–162. Available online: https://link.springer.com/article/10.1007/s10457-007-9081-6 (accessed on 18 August 2020). [CrossRef]
- Gaspar, P.; Mesías, F.J.; Escribano, M.; Pulido, F. Sustainability in Spanish Extensive Farms (Dehesas): An Economic and Management Indicator-Based Evaluation. Rangel. Ecol. Manag. 2009, 62, 153–162. Available online: https://doi.org/10.2111/07-135.1 (accessed on 18 August 2020). [CrossRef]
- Precios Pienso. Available online: https://www.mapa.gob.es/es/ganaderia/temas/alimentacion-animal/acceso-publico/precios.aspx. (accessed on 23 July 2020).
- Thomasz, E.; Rondinone, G.; Vilker, A. The economic cost of extreme and severe droughts in soybean production in Argentina. Rev. Contaduría Y Adm. 2019, 64, 1–24. Available online: https://dialnet.unirioja.es/descarga/articulo/6770162.pdf (accessed on 23 July 2020). [CrossRef]
- Tannura, M.A.; Irwin, S.H.; Good, D.L. Weather, Technology, and Corn and Soybean Yields in the U.S. Corn Belt. In Marketing and Outlook Research Report 2008-01; Department of Agricultural and Consumer Economics, University of Illinois at Urbana-Champaign: Champaign, IL, USA, 2008; Available online: https://ageconsearch.umn.edu/record/37501/files/morr_08-01.pdf (accessed on 23 July 2020).
- Thomasz, E.; Casparri, M.; Vilker, A.; Rondinone, G. Medición económica de eventos climáticos extremos en el sector agrícola: El caso de la soja en Argentina. Rev. De Investig. En Modelos Financ. 2016, 4. Available online: http://www.economicas.uba.ar/wp-content/uploads/2016/02/Thomasz-E.-O.-Casparri-M.-T.-Vilker-A.-S.-Rondinone-G.-y-Fusco-M.-Medici%C3%B3n-econ%C3%B3mica-de-eventos-clim%C3%A1ticos-extremos-en-el-sector-agricola-el-caso-de-la-soja-en-Argentina.pdf (accessed on 23 July 2020).
- Heinzenknecht, G. Proyecto riesgo y seguro agropecuario. In Oficina De Riesgo Agropecu; 2011. Available online: http://www.ora.gov.ar/informes/enso.pdf (accessed on 23 July 2020).
- Baethgen, W.E. Climate Risk Management and Adaptation to Climate Change. In Uruguay Climate Change Here and Now Suplementary document for the UNDP Report on Human Development; UNDP Uruguay, Montevideo; Springer: Berlin, Germany, 2010; Available online: https://acsess.onlinelibrary.wiley.com/doi/pdf/10.2135/cropsci2009.09.0526 (accessed on 23 July 2020).
- AEMET. Resumen Anual Climatológico 2018. Available online: http://www.aemet.es/documentos/es/serviciosclimaticos/vigilancia_clima/resumenes_climat/anuales/res_anual_clim_2018.pdf (accessed on 23 July 2020).
- AEMET. Resumen Anual Climatológico 2017. Available online: http://www.aemet.es/documentos/es/serviciosclimaticos/vigilancia_clima/resumenes_climat/anuales/res_anual_clim_2017.pdf (accessed on 23 July 2020).
- AEMET. Resumen Anual Climatológico 2016. Available online: http://www.aemet.es/documentos/es/serviciosclimaticos/vigilancia_clima/resumenes_climat/anuales/res_anual_clim_2016.pdf (accessed on 23 July 2020).
- AEMET. Resumen Anual Climatológico 2015. Available online: http://www.aemet.es/documentos/es/serviciosclimaticos/vigilancia_clima/resumenes_climat/anuales/res_anual_clim_2015.pdf (accessed on 23 July 2020).
- AEMET. Resumen Anual Climatológico 2014. Available online: http://www.aemet.es/documentos/es/serviciosclimaticos/vigilancia_clima/resumenes_climat/anuales/res_anual_clim_2014.pdf (accessed on 23 July 2020).
- AEMET. Resumen Anual Climatológico 2013. Available online: http://www.aemet.es/documentos/es/serviciosclimaticos/vigilancia_clima/resumenes_climat/anuales/res_anual_clim_2013.pdf (accessed on 23 July 2020).
- AEMET. Resumen Anual Climatológico 2012. Available online: http://www.aemet.es/documentos/es/serviciosclimaticos/vigilancia_clima/resumenes_climat/anuales/res_anual_clim_2012.pdf (accessed on 23 July 2020).
- AEMET. Resumen Anual Climatológico 2011. Available online: http://www.aemet.es/documentos/es/serviciosclimaticos/vigilancia_clima/resumenes_climat/anuales/res_anual_clim_2011.pdf (accessed on 23 July 2020).
- AEMET. Resumen Anual Climatológico 2010. Available online: http://www.aemet.es/documentos/es/serviciosclimaticos/vigilancia_clima/resumenes_climat/anuales/res_anual_clim_2010.pdf (accessed on 23 July 2020).
- AEMET. Resumen Anual Climatológico 2009. Available online: http://www.aemet.es/documentos/es/serviciosclimaticos/vigilancia_clima/resumenes_climat/anuales/res_anual_clim_2009.pdf (accessed on 23 July 2020).
- AEMET. Resumen Anual Climatológico 2008. Available online: http://www.aemet.es/documentos/es/serviciosclimaticos/vigilancia_clima/resumenes_climat/anuales/res_anual_clim_2008.pdf (accessed on 23 July 2020).
- Thomson Reuters Eikon Database. Available online: https://eikon.thomsonreuters.com (accessed on 23 July 2020).


© 2020 by the authors. Licensee MDPI, Basel, Switzerland. This article is an open access article distributed under the terms and conditions of the Creative Commons Attribution (CC BY) license (http://creativecommons.org/licenses/by/4.0/).