Article

Analysis of Urban Morphological Effect on the Microclimate of the Urban Residential Area of Kampung Baru in Kuala Lumpur Using a Geospatial Approach

by
Sheikh Ahmad Zaki
1,*,
Nor Suhada Azid
1,
Mohd Fairuz Shahidan
2,*,
Mohamad Zaki Hassan
3,
Mohd Yusof Md Daud
3,
Nor Azlina Abu Bakar
2,
Mohamed Sukri Mat Ali
1 and
Fitri Yakub
1
1
Malaysia-Japan International Institute of Technology, Universiti Teknologi Malaysia, Jalan Semarak, Kuala Lumpur 54100, Malaysia
2
Faculty of Design and Architecture, Universiti Putra Malaysia, Serdang 43400, Selangor, Malaysia
3
Razak Faculty of Technology and Informatics, Universiti Teknologi Malaysia, Jalan Sultan Yahya Petra, Kuala Lumpur 54100, Malaysia
*
Authors to whom correspondence should be addressed.
Sustainability 2020, 12(18), 7301; https://doi.org/10.3390/su12187301
Submission received: 8 August 2020 / Revised: 3 September 2020 / Accepted: 3 September 2020 / Published: 6 September 2020

Abstract

:
As a Malay Agricultural Settlement established in 1900, Kampung Baru which is located in Kuala Lumpur, has become a subject of prolonged national interests in terms of economic, social, environment, and political issues along with the pressure of modern and future development. This study investigated the urban morphological impact of Kampung Baru on the intensity of urban heat island (UHI) by developing a smart geodatabase for urban climatic mapping. The database provided baseline data which was crucial to unveil the spatiotemporal characteristics of UHI in Kampung Baru. Determination of the urban heat island intensity (UHII) in Kampung Baru was carried out through two approaches, mobile and fixed measurements. In a period of six days, the mobile measurement was conducted within the target area at night using a motorcycle equipped with the temperature and relative humidity data logger while the fixed measurement was conducted using the similar equipment installed at a school building in the area. Building height data were also collected while building footprints were digitized using a topographical map and the satellite image was used as the base map. To estimate the UHII, the reference data for rural temperature was obtained from the Malaysian Meteorological Department (MMD). All of the data were analyzed using ArcGIS to portray the temperature pattern in the study area. The analysis revealed the presence of UHI effect in Kampung Baru at the average building height of six to ten metres. The results of the fixed measurement showed an island-like local maximum in the study area with the average and maximum UHII values of 4.4 °C and 6.0 °C, respectively. The results from the mobile measurement also showed that the highest temperature was recorded in Kampung Baru rather than in the surrounding areas of different land-use types throughout the observation days. The spatial temperature distribution in the study area also showed that the most affected part was the south-west of Kampung Baru which is surrounded by tall buildings. The findings of this study could be utilized in the planning of new development in the city of Kuala Lumpur.

1. Introduction

The local climate of an urban area is usually different from that of the surrounding area. Urban climate is influenced by urban heat island (UHI) which refers to the relative warmness of a city [1]. UHI was determined in some studies as a comparison of the mean and maximum temperatures between urban and rural areas. In certain research, the temperatures were compared, such as between seasons, months, years or days. Study has shown that UHI problems are worsening as a result of urban growth and heavy industrialization that tends to trigger changes in the urban temperature [2]. With the increase in the global urban population as a result of urbanization, the effect of the UHI phenomenon is getting worse. It has worsened as more vegetated areas and permeable lands are transformed into urban areas, hence resulting in the increase of albedo [3,4]. Albedo is the amount of solar energy that is reflected by the surface to the surrounding area. Other factors that contribute to UHI effects are building thermal properties, urban form, and anthropogenic heat release [5,6]. Magee [7] described UHI as the average temperature change between the urban and rural areas in Fairbanks, Alaska. Mean urban and rural temperature patterns were used to determine the occurrence of UHI. Moreover, the temperature trends of an area before and after urbanization illustrated the influence of urbanization on the occurrence of UHI. However, historical records of temperature data obtained before urbanization of most cities are not available, and this creates an obstacle for studying UHI. This trend has become significant in the tropics where the lack of shade and greenery has resulted in a failure to offset the heat from direct solar gain. Moreover, the use of dark materials in buildings and hard pavements causes the increase in heat absorption, thereby contributing to high urban temperature. Besides, changes in urban morphology, particularly in the tropical urban areas, influence local microclimates which directly increases the UHI effect [8,9,10]. A report by Nieuwolt [11], which was one of the earliest tropical urban microclimatic studies, was conducted in Singapore. This was followed by numerous studies on the heat island intensity in tropical cities around the globe, which contributed to the understanding of the UHI phenomenon [8,12]. In regard to Malaysia, work in this field was pioneered by Sham [13] who investigated the UHI intensity in selected Malaysian cities and discovered that the heat island intensity ranged from 2 °C to 7 °C. More specifically, the study found that the heat island intensity on clear days in Kuala Lumpur was about 6 °C. Several studies have since been carried out to evaluate the heat island intensity in other urban centers in Malaysia [14,15]. Moreover, previous studies on UHI in Kuala Lumpur have reported that UHI has major effects on thermal comfort, human health, pollution, societal economy, and meteorology and climate. Policymakers, local governments, and engineers must therefore consider the factors that contribute to the UHI phenomenon before designing and developing new urban areas [16,17,18,19]. Nevertheless, there has been no detailed study to investigate the microclimate of Kampung Baru in terms of weather patterns and effects of UHI. Kampung Baru is chosen as a case study since it is one of the most densely populated suburban areas in Kuala Lumpur. Moreover, it is located less than 5 km from the city center where high-rise buildings such as the Petronas Twin Tower and the Kuala Lumpur Tower (KL Tower) dominate the city’s skyline. The development of an urban area should prioritize the mitigation of UHI effects [16,17,18,19,20]. Specific considerations are investigated for determining UHI effects from urban morphological characteristics. These include diminishing greenery due to increased urban growth, materials used to construct skyscrapers, reshaping of the city’s architectural forms, building scale extension, growing anthropogenic heat production, and other additional factors such as climate change and spatial location of the area [21,22].
In order to carry out the comprehensive analysis of UHI, acquisition and processing of remote sensing data were implemented by the ArcGIS software. Daytime and nighttime thermal data were loaded into the ArcGIS software and analyzed by a spatial analyst module. Besides, the land-use layer was used to extract the statistical data of each individual land-use type [22]. Urban morphology database can be used widely in many applications, and one of the applications is the UHI analysis that had been used in previous researches [23,24]. Mapping, monitoring, and modeling of urbanization progress with regard to climate change requires holistic and integrated approaches. Geo-information technology is one of the promising tools to analyze the UHI phenomenon in terms of spatial and temporal resolutions more effectively [24,25]. Utilizing the aforementioned tools and comprehensive approaches, this study investigated the urban morphological impact of Kampung Baru on the intensity of urban heat island (UHI) by developing a smart geodatabase for urban climatic mapping.

2. Methodology

2.1. Study Area

Kampung Baru, Kuala Lumpur, is geographically located at latitude 3°09′ N and longitude 101°43′ E, covering approximately 301.38 acres lying between the Klang River and Batu Road, as shown in Figure 1. Kampung Baru has been established since 1899 by the British government and was put under the administration of the Kuala Lumpur City Hall in February 1972 [26]. The surrounding environment of the study area presents the topography of a compact urban area, surrounded by various commercial buildings such as the Kuala Lumpur City Center (KLCC). It is a traditional and contemporary domestic residential area situated within the capital of Malaysia.
The older part of Kampung Baru was characterized by densely packed buildings of single and double-story houses with non-uniform footprints. A large part of this enclave is full of traditional houses, built about 100 years ago. Some parts of this area generally have taller buildings that are mainly residential apartments or commercial buildings. In this study, the whole area of Kampung Baru was focused on the investigation of the influence of a densely packed built area on the urban climate. The vicinity located within 500 m from the study area was also included in this investigation.

2.2. Building Morphology

In this study, 3D building models were created using a low-cost technique (i.e., utilizing the on-site database and human resources) rather than using a satellite image and aerial photography or Light Detection and Ranging (LIDAR). In fact, the low-cost technique was preferred to be used in this study since the on-site database and human resources were readily available and easily handled. In the past, one of the main difficulties of the morphometric approach was the limited availability of data describing urban texture. In this study, the purpose of using a low-cost instrument to comprehensively collect building height data is relevant. Collection of the building height data in the study area was completed in about two months. All buildings on the map were individually checked and identified on the study site.
Building height was measured from the ground level using the TruPulse 200L laser rangefinder. This method of building height determination was based on the development of digital elevation models (DEM) and comparative morphological analysis in the Northern European and North American cities [27].
Building height data was used to calculate urban morphological parameters. The measuring instrument is able to distinguish between near and far objects. To make use of the full nominal accuracy of the instrument (0.5 m), it was placed in front of a building’s façade and a set of three auxiliary measurements were then performed.
The measurement was performed repeatedly on multiple targets, and the results were compared to detect any uncertainty in the data. Basically, three to five measurements were found to be enough because the results of each measurement were almost constant. Besides, the instrument that was new was calibrated by the manufacturer and used for the first time in this data collection. This contributed to the accuracy and consistency of measured data.
In this study, building footprints were digitized from the topographic map of Kuala Lumpur, for which the last survey was in 2004. The sheet number of the map is 16 and the scale of the map is 1:10,000. The building footprints depict the placement of each building and are possibly linked with data acquisition of the building height collected in a particular area. The building footprints were digitized for all buildings using the ArcGIS software. The high-resolution satellite image taken in 2013 was overlaid with the topographic map to update the existing buildings in the study area. All buildings on the map and satellite image were checked and identified on the site. For some buildings, the building footprint was found to be less accurate and this would be corrected after identifying and measuring them on the site. Every building was described by a 2D polygon with specific attributes corresponding to its footprint and rooftop elevation.
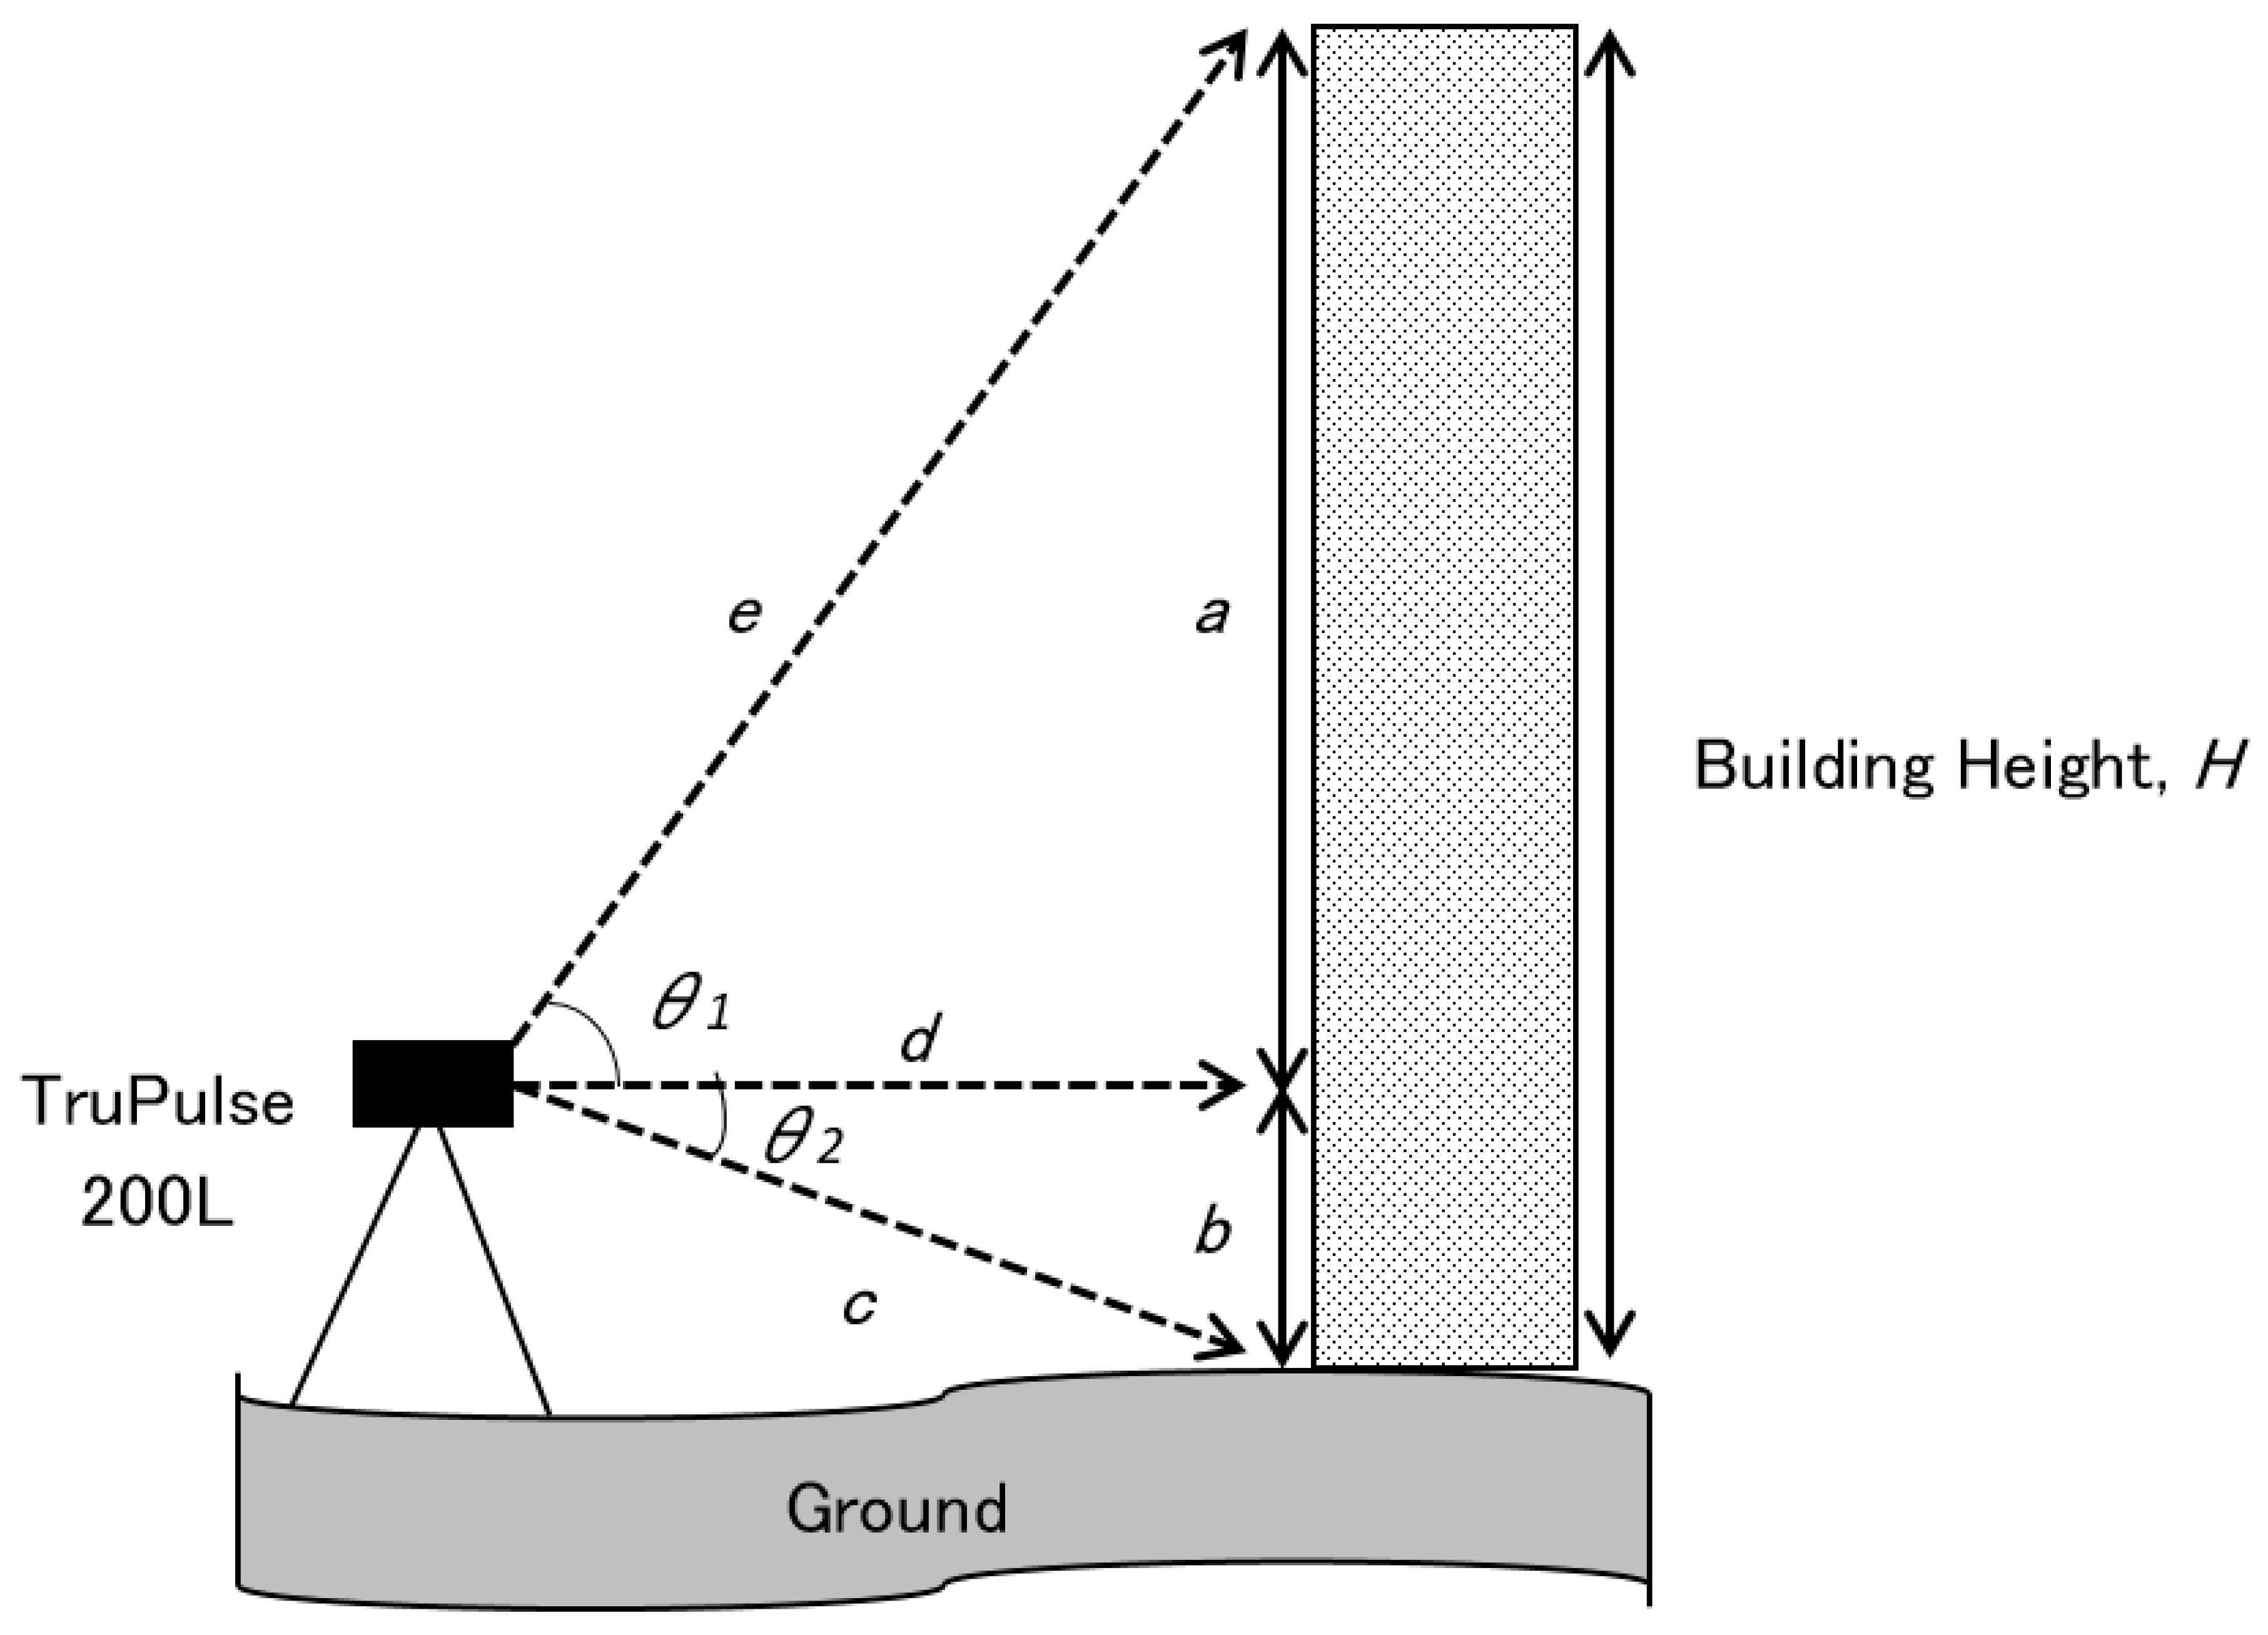
The building height data collection is one of the most critical parts in constructing the 3D model of the building footprints that had been digitized. The building height was measured from the ground level using a distance meter, TruPulse 200L. The instrument was positioned at two to three meters from the building façade, as shown in Figure 2. Using the TruPulse 200L, two measurements were taken, perpendicular to the desired length and the other two measurements were at inclination. For the building morphology application, each building is simply represented by a single polygon of uniform shape with height [28].
The method used to measure height of a building is known as the technique of three shots. First, to measure slope distance, the laser rangefinder was directed straight to the building’s line of sight, d. Next, the laser rangefinder was specifically aimed at the bottom of the building to measure the slope angle of θ2, and next to the building’s highest point to measure the slope angle of θ1. Based on the Pythagorean theorem, the building height was then calculated.
Average building height of an area represents the depth of the buildings in urban canopy. The information can be used as a first-order approximation of the surface roughness, z0, when multiplied by the proportionality constant [29]. In this section, the height characteristics were summarized for the case study of Kampung Baru. Equations (1) and (2) were used to calculate the mean and standard deviation of building height.
h ¯ = i = 1 N h i N
S h = i = 1 N ( h i h ¯ ) 2 N
where, h ¯ is the average building height, s h is the standard deviation of building height, h i is the height of building i , and N is the total number of buildings in the area. The mean building height of Kampung Baru varies depending on the land-use type.
Building plan area fraction, λp, is defined as the ratio of the plan area of buildings to the total surface area of the target region. This parameter represents the density of buildings in an area whereby a higher λp indicates a higher density of the buildings in a particular area. λp is calculated using Equation (3):
λ p = A p A T
where, A p is the sum of the areas of the building footprints and A T is the total plan area.

2.3. Field Measurement

In this study, two methods of data collection were conducted. The first measurement was done using a fixed station and the second method was done using a mobile measurement technique. This section briefly explains about the instruments used to collect the climate data and data collection procedure.

2.3.1. Instrumentation

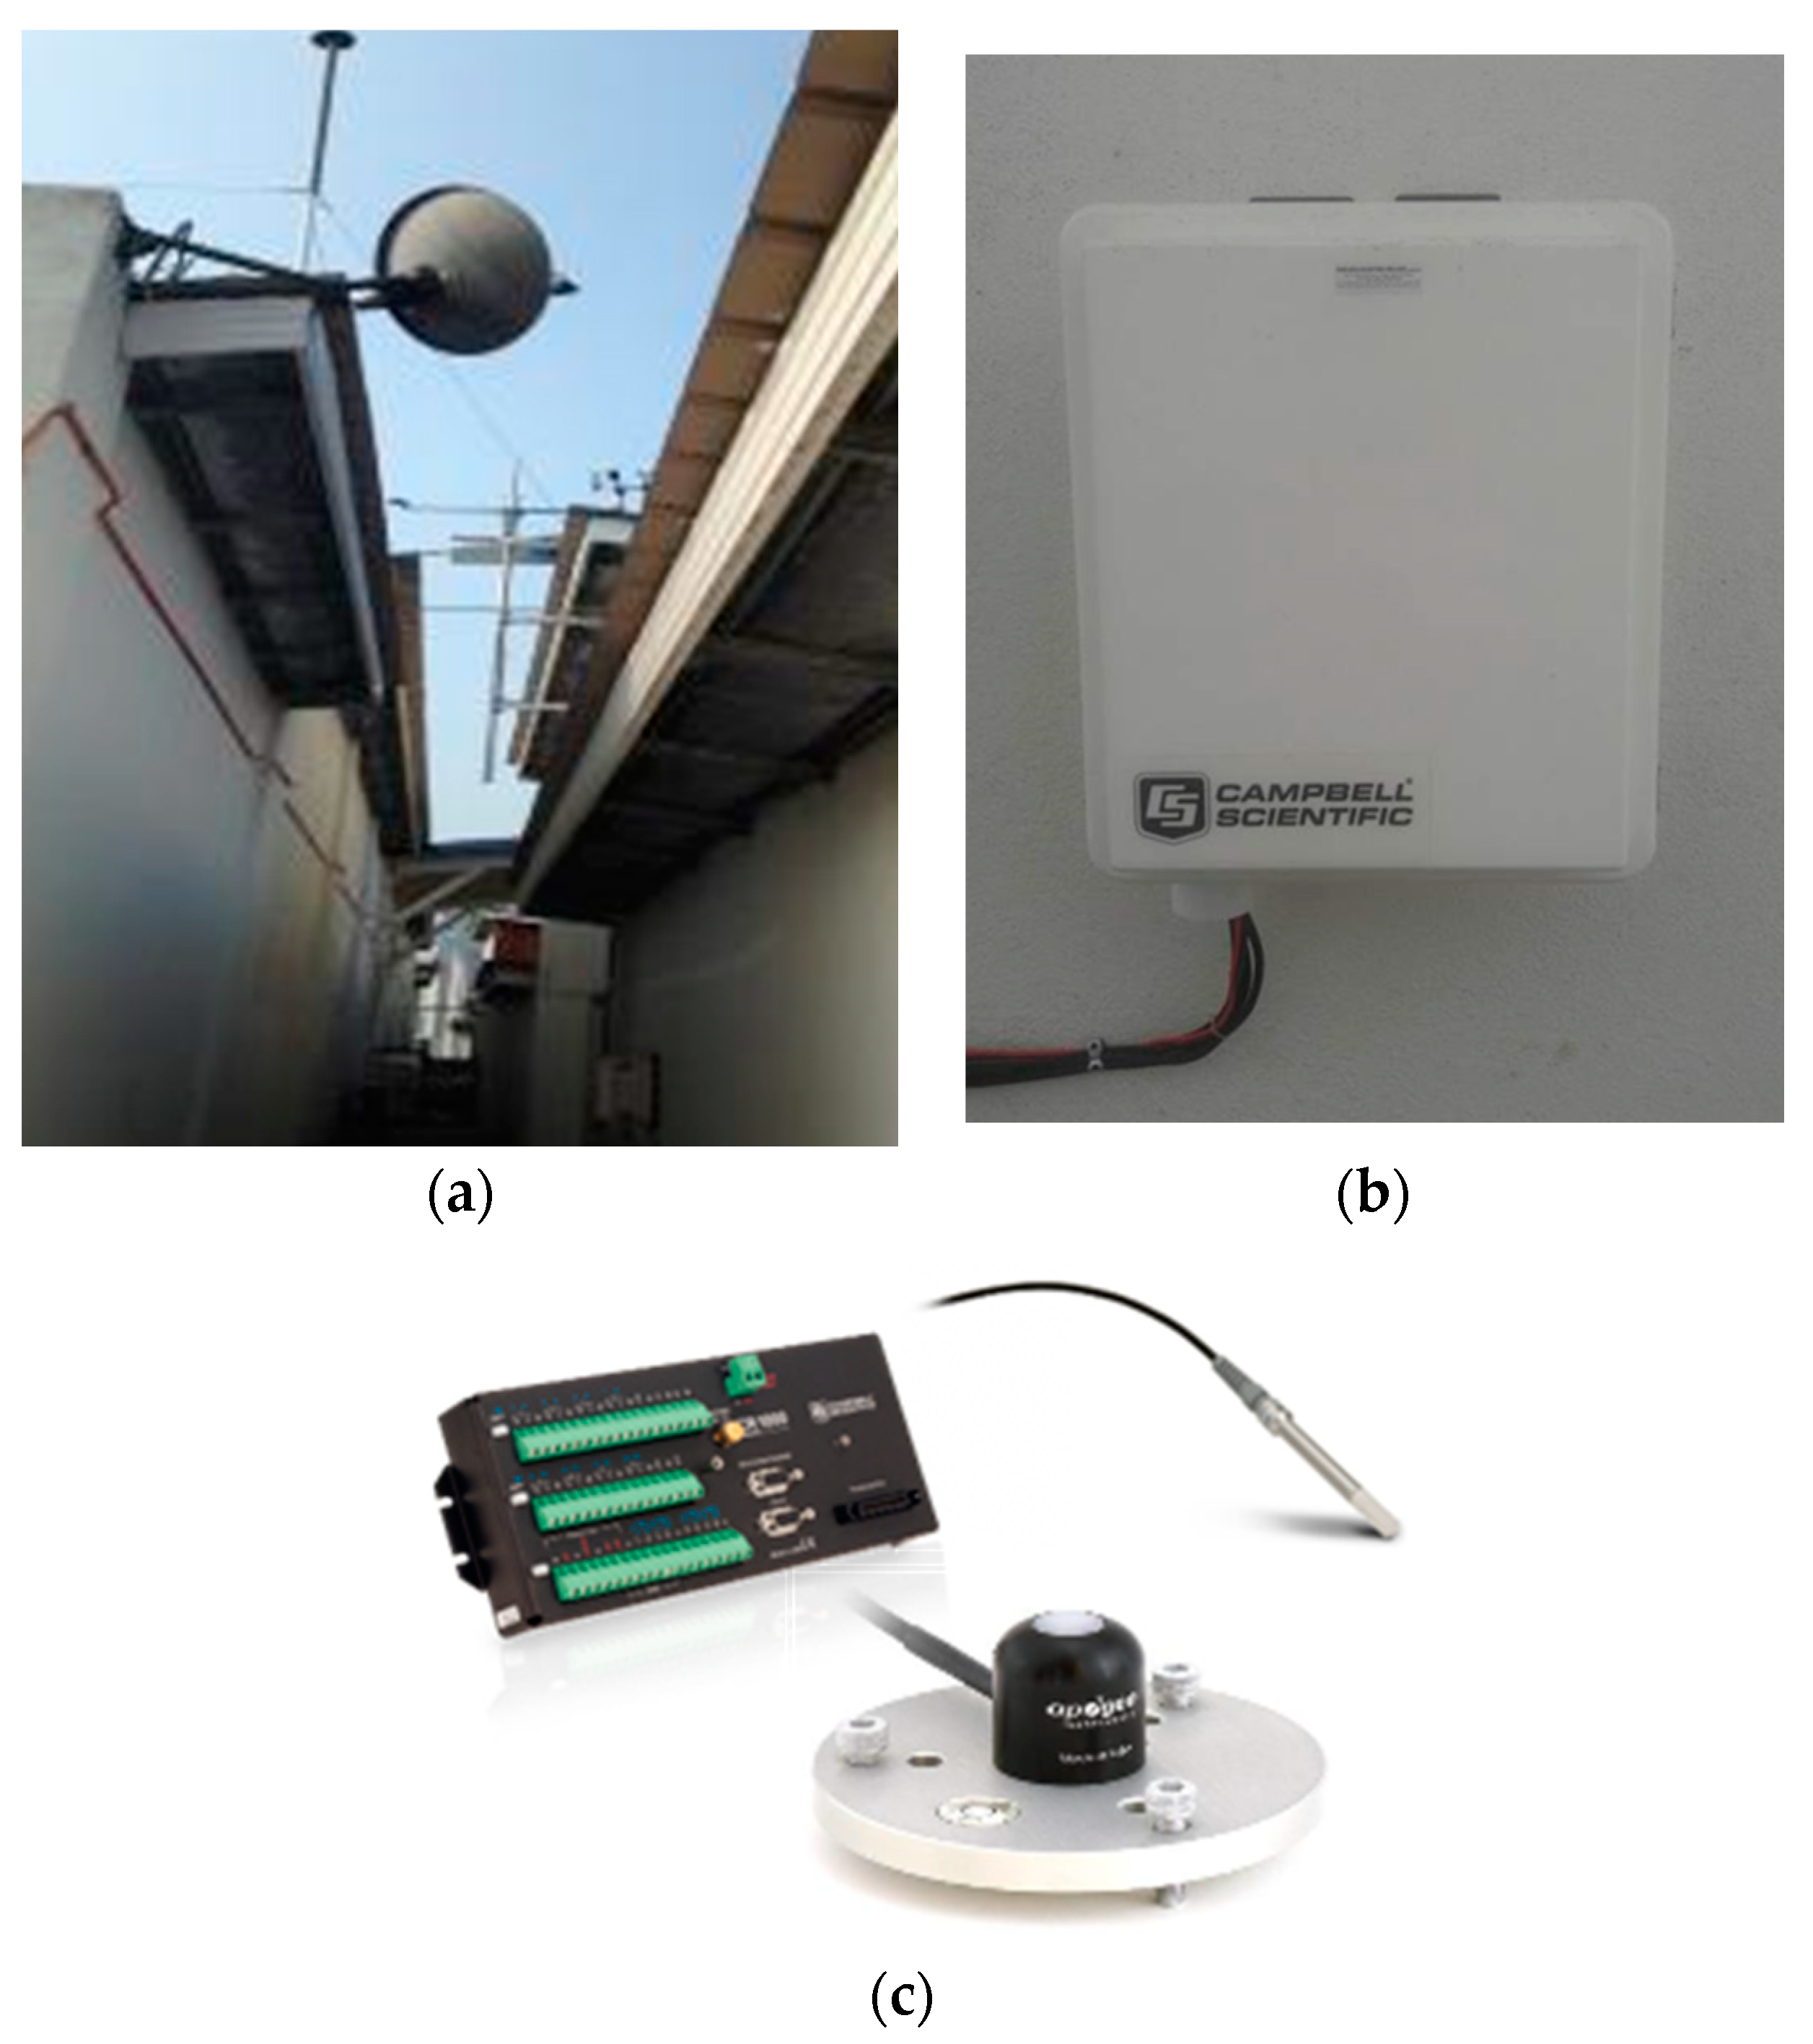
Campbell Scientific CR1000 data logger is the instrument used as a fixed station (hereafter referred to as ‘MJIIT-CS’). It was installed at the rooftop of MJIIT, UTMKL (3°10′ N, 101°43′ E) at the height of 68.0 m from the ground level. The MJIIT building is situated approximately one kilometer from the study area (i.e., Kampung Baru). It was set to log the data at a one-min interval. The sensors can measure air temperature, relative humidity, and solar radiation. The data logger was attached to the CS215 temperature and humidity sensor probe and Apogee SP110 self-powered pyranometer, and covered by a solar radiation shield as shown in Figure 3. The collected data is stored in the built-in data logger. Table 1 summarizes the instrument specifications and settings of the MJIIT-CS weather station.
The data logger, Hobo pro-V2, was fitted with built-in air temperature and relative humidity sensors. This data logger was used for mobile measurement and as a fixed station at the study area, as shown in Figure 4. One set of Hobo pro-V2 data logger was used as a fixed station for six days at a one-second time interval. Meanwhile, three (3) sets of Hobo pro-V2 were used during the mobile measurement. The sensors were mounted at a height of 2.5 m above the ground and shielded with a solar radiation shield to prevent direct solar radiation exposure; otherwise, that will impact the temperature variables assessed. Data logger specifications including instrument type, setting, and accuracy are shown in Table 2.

2.3.2. Site Selection

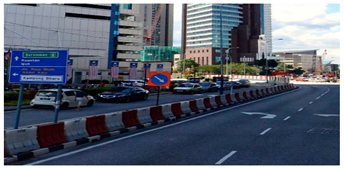
In this study, the selected locations were referenced as ‘environmental settings’ during the data collection. Table 3 summarizes the types of land-use categories for urban climate data collection. In fact, the six land-use categories that were selected in this study represent the majority and diversity of environmental settings in Kampung Baru and its surrounding area. This is essential for better understanding of the local microclimate during the site investigation.
The first element represents a body of water, i.e., pond, which is situated at Titiwangsa Lake Gardens. The second element is a park which is also situated at Titiwangsa Lake Gardens. The next element is a highway which refers to Jalan Tun Razak. Along the highway, there are buildings such as hospitals, schools, petrol stations, shop lots, and so on.
Another important element considered is urban residential area. Urban residential area is the study area which is Kampung Baru. This is the most important element to be studied since Kampung Baru is a crowded urban area with low-rise buildings surrounded by high-rise buildings.
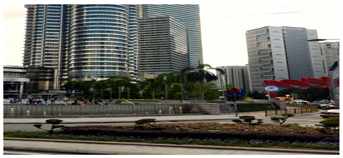
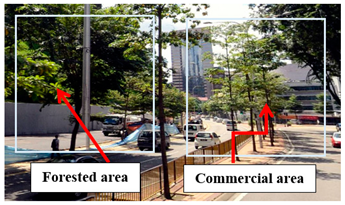
The next element is downtown. A downtown area refers to the downtown of Kuala Lumpur where buildings in this area are mostly skyscrapers. The last element is rural and mountain. This element refers to the forest reserve area located in the center of Kuala Lumpur. A government reserve area is located to the west of the center of Kuala Lumpur, whereas a commercial and residential area is located to the east. In this study, observation was done along the road next to the forest reserve instead of in the forest reserve area.

2.3.3. Fixed Measurement

Urban climate data for a complete one-year period was collected from MJIIT-CS. In this study, only air temperature and relative humidity were analyzed. The data logger was set up at a 10-min interval. The measurement was carried out from March 2014 until February 2015.
Four monsoon seasons which are Southwest monsoon, Northeast monsoon, and two inter-monsoon seasons took place throughout the measurement period. The weather phenomena of El Niño and La Niña were also observed within the measurement period.

2.3.4. Mobile Measurement

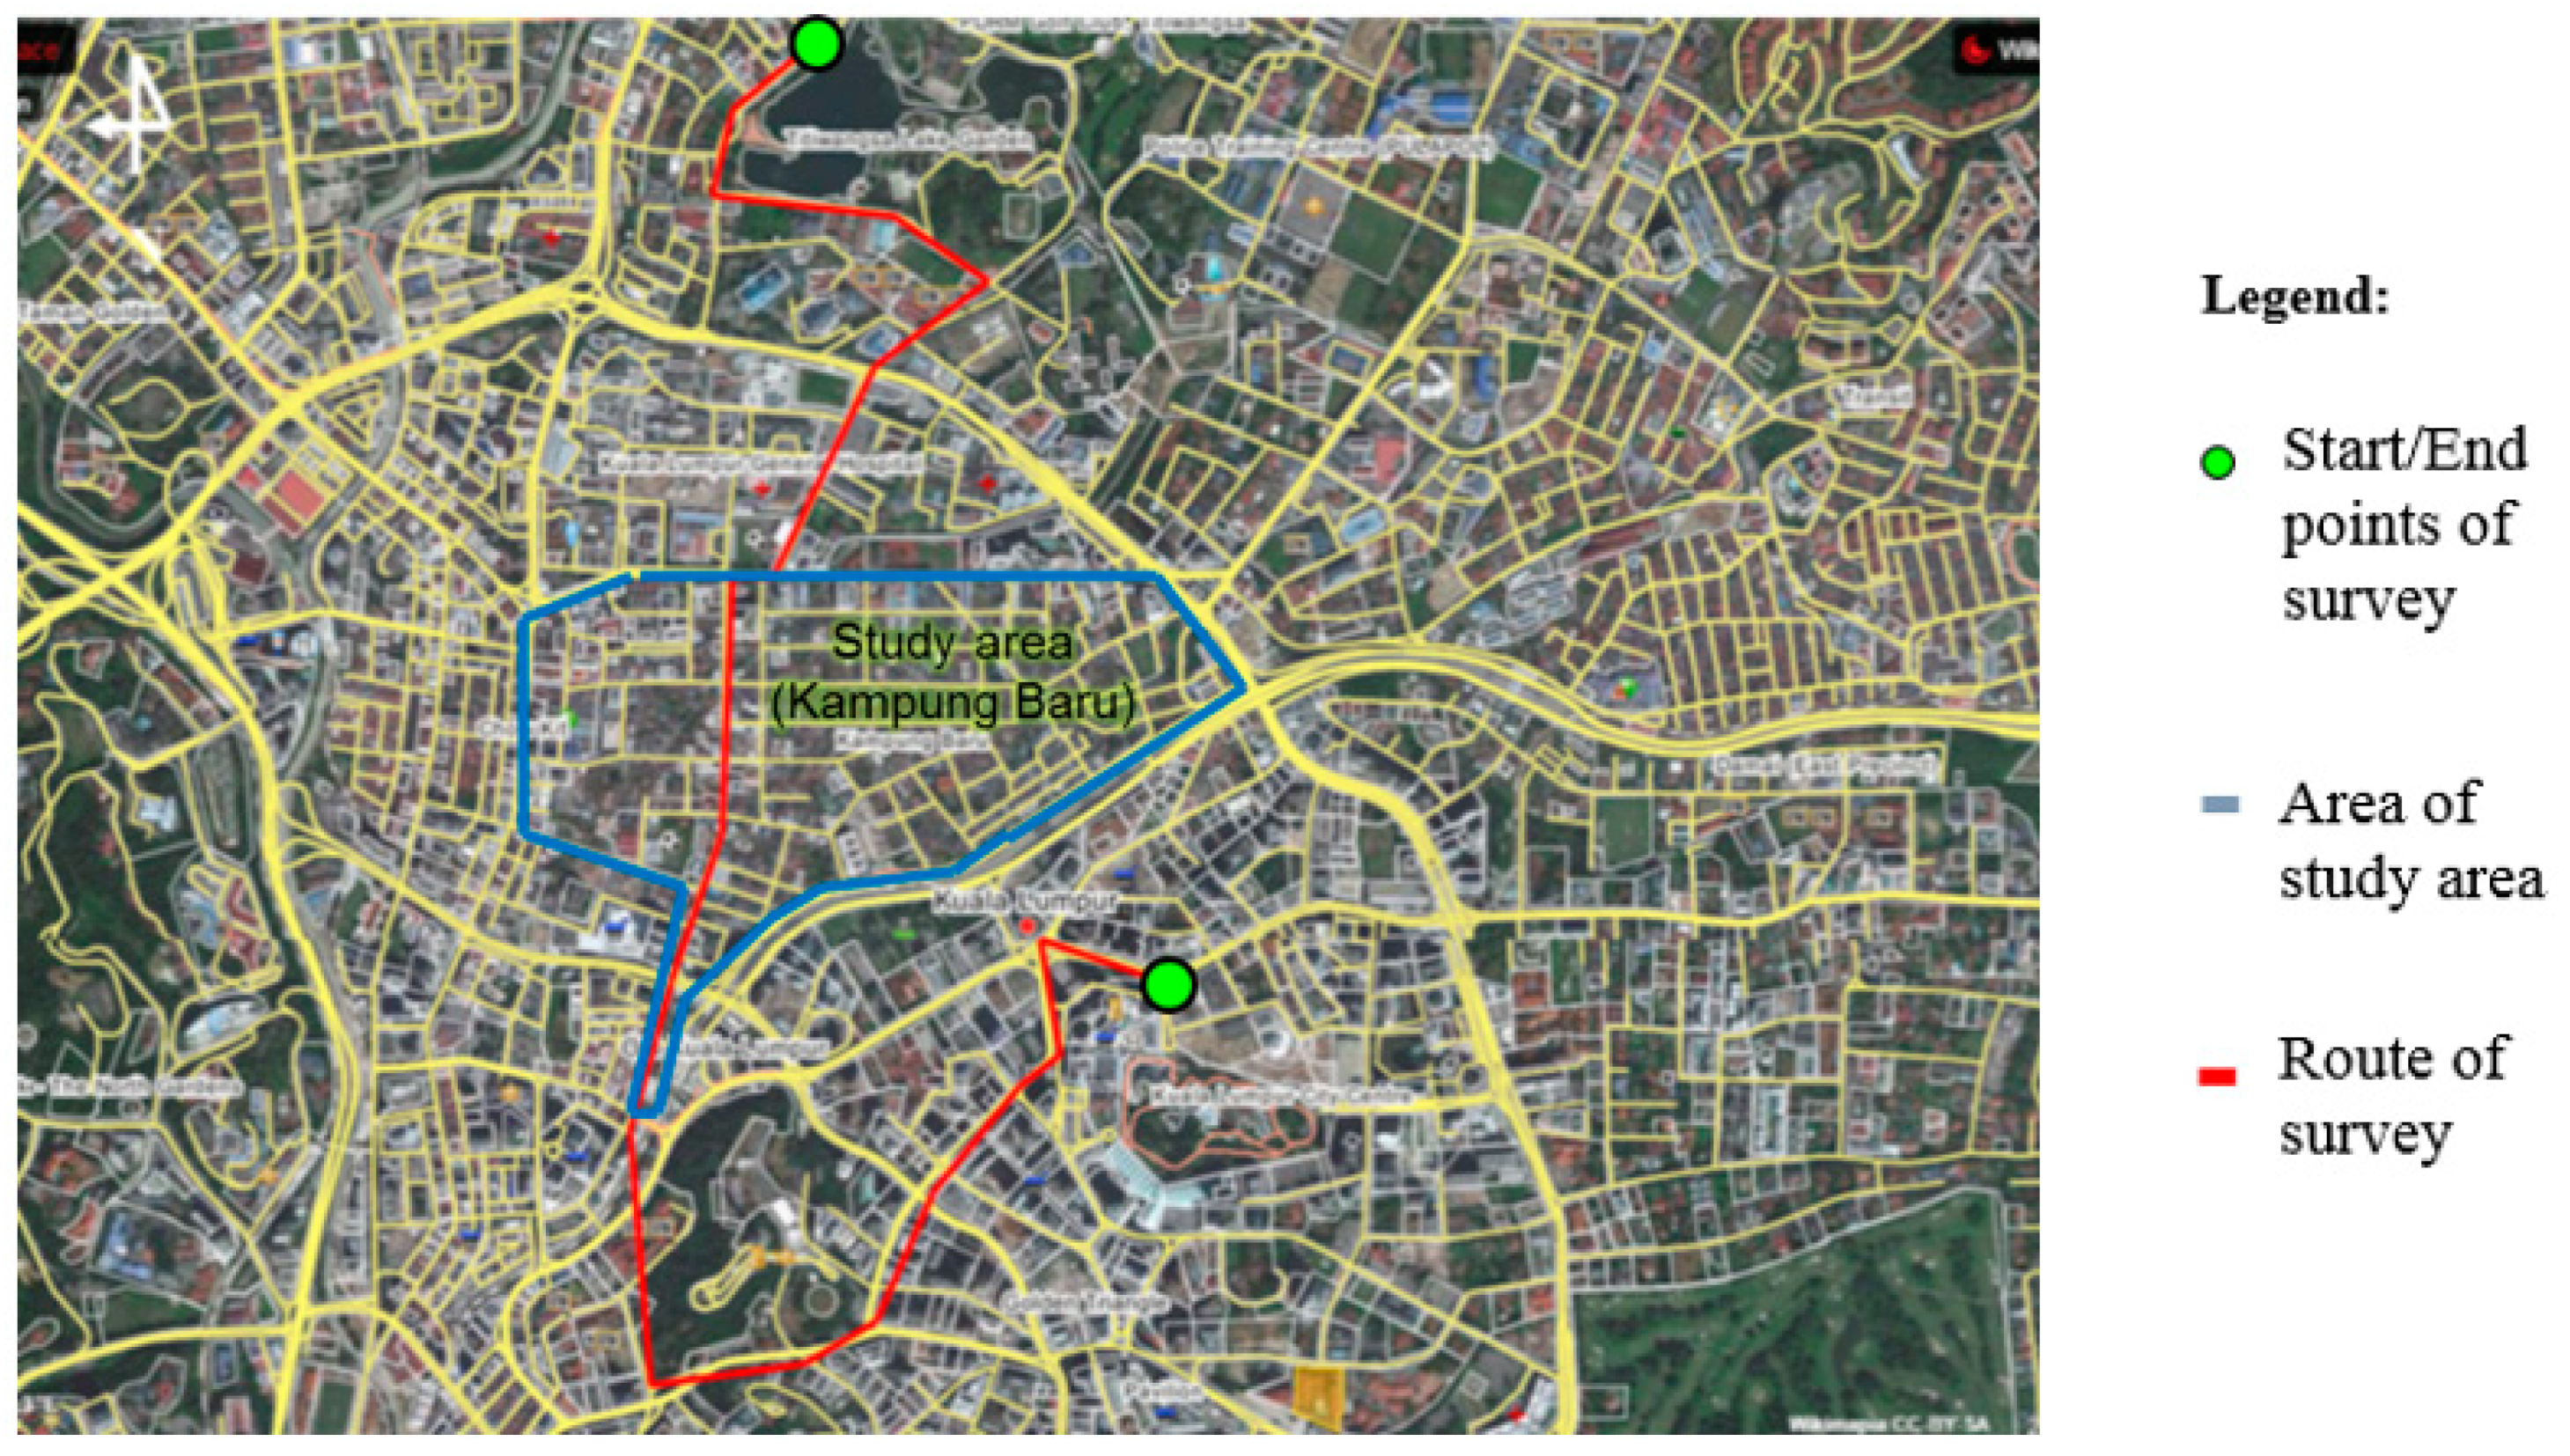
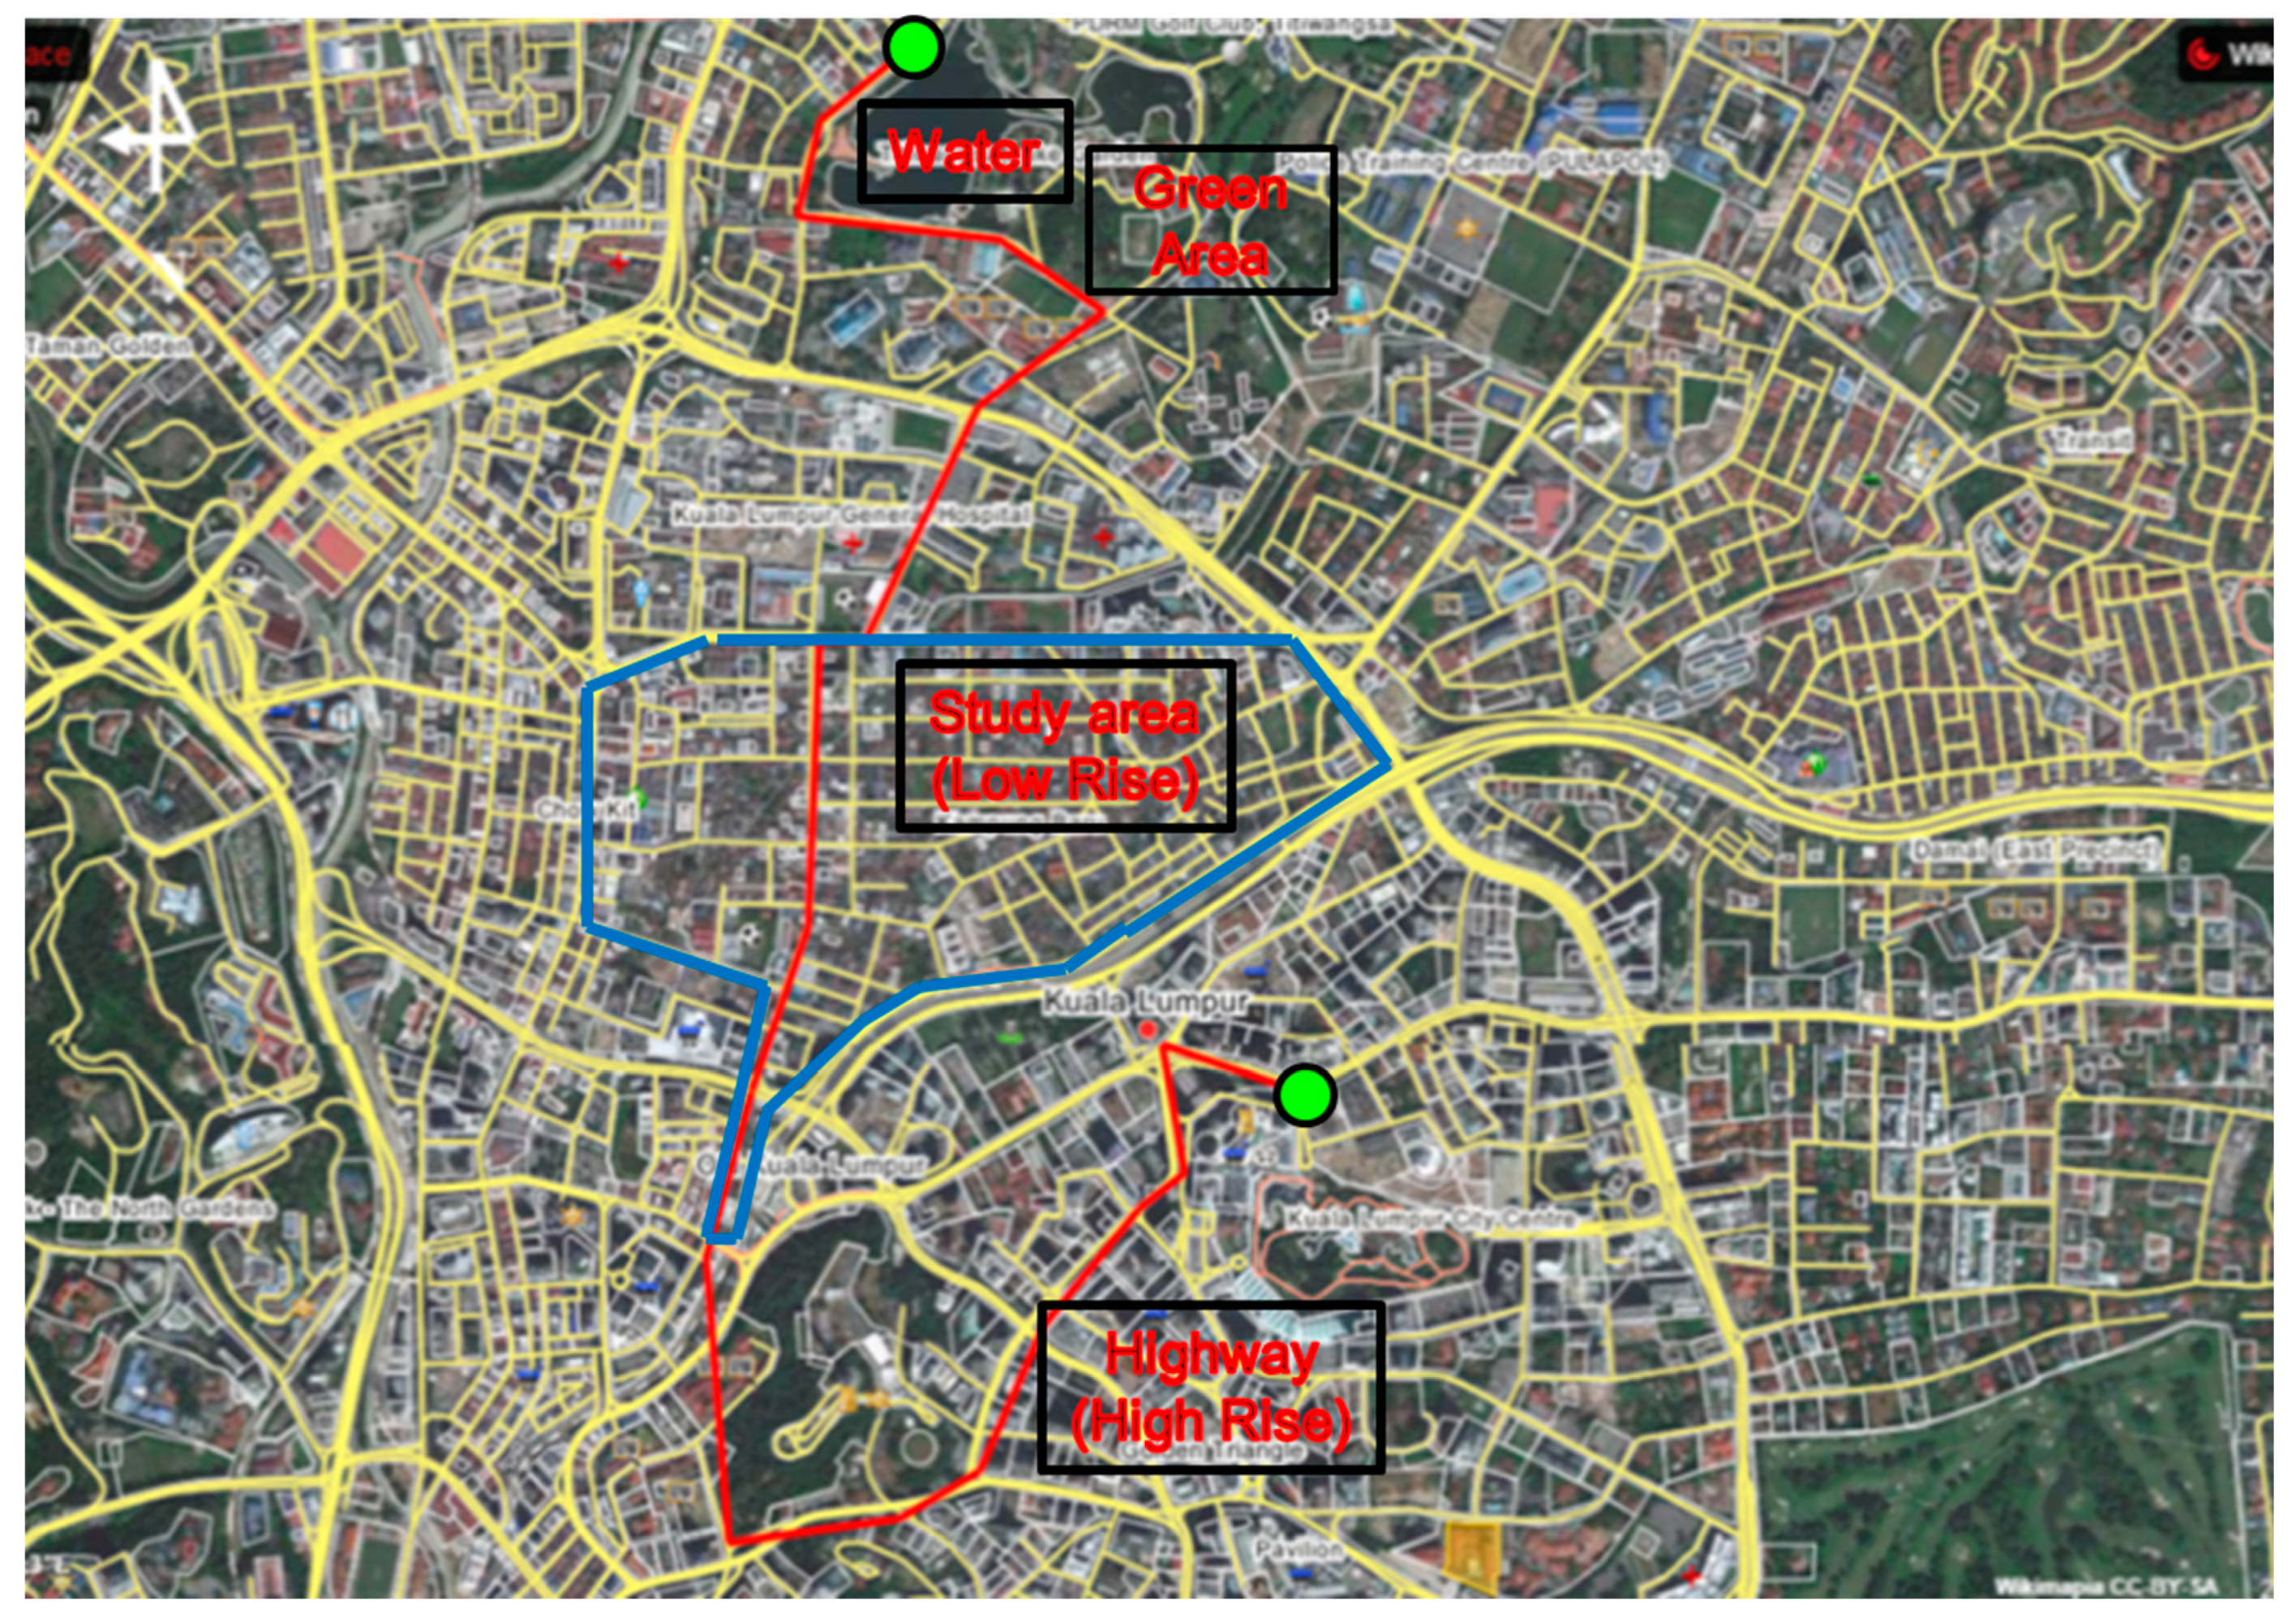
The handheld measuring technique was carried out for six (6) selected days in April and May 2015 in Kampung Baru. In addition, the measurement also covered approximately 500 m from the boundary of the study area. Figure 5 shows the route of the mobile survey which covered different types of land uses. Details on different land uses can be referred to in Table 2. The mobile measurement route was planned to have a better understanding of how the pattern of land use would affect the surrounding urban microclimate. The various land uses along the route are indicated in Figure 6. During mobile measurement, the air temperature and relative humidity data were collected.
The mobile measurement was conducted using a motorcycle equipped with a handheld Global Positioning System (GPS) and two separated Hobo pro-V2 with a solar radiation shield. One set of Hobo pro-V2 data logger was also installed at the fixed station in the study area as a control. All the instruments continuously collected the data on temperature and relative humidity at an interval of one second. The observation was made for seven days from 20:30 to 22:30, i.e., from 24 April 2015 to 8 May 2015, with a vehicle speed of approximately 20–30 km/h.
Table 4 summarizes mobile measurement details. Two (2) instruments were used during the mobile measurement. Other than the installed instruments for mobile measurement, one instrument was installed temporarily at the study area (school) as a control during the mobile measurement. This control is important to check if data recorded by the two instruments were different or containing error.

2.4. Geospatial GIS Data

The GIS spatial database of Kampung Baru was developed using various sources of data. The primary sources of data were obtained from the Department of Survey and Mapping Malaysia (DSMM). However, the existing spatial data of Kampung Baru could not be updated using the Kuala Lumpur topography map from the DSMM as it was last updated in 2006. Therefore, the WorldView2 satellite image, which was last updated in 2010, and the Google Earth image, which was last updated in October 2017, was used to develop the spatial data of Kampung Baru.
The geodatabase of Kampung Baru was developed using ArcGIS 10.1, which consists of 3D building geometry (i.e., footprint and height) and urban climate data. The map was geo-referenced to the Geodetic Datum of Malaysia 2000 (GDM2000) coordinate system. The limitation of the available topographic map is the outdated spatial and attribute data. To overcome this limitation, field mapping and detailed site investigation are occasionally organized to evaluate the available topographic information and obtain updates from the field observations.
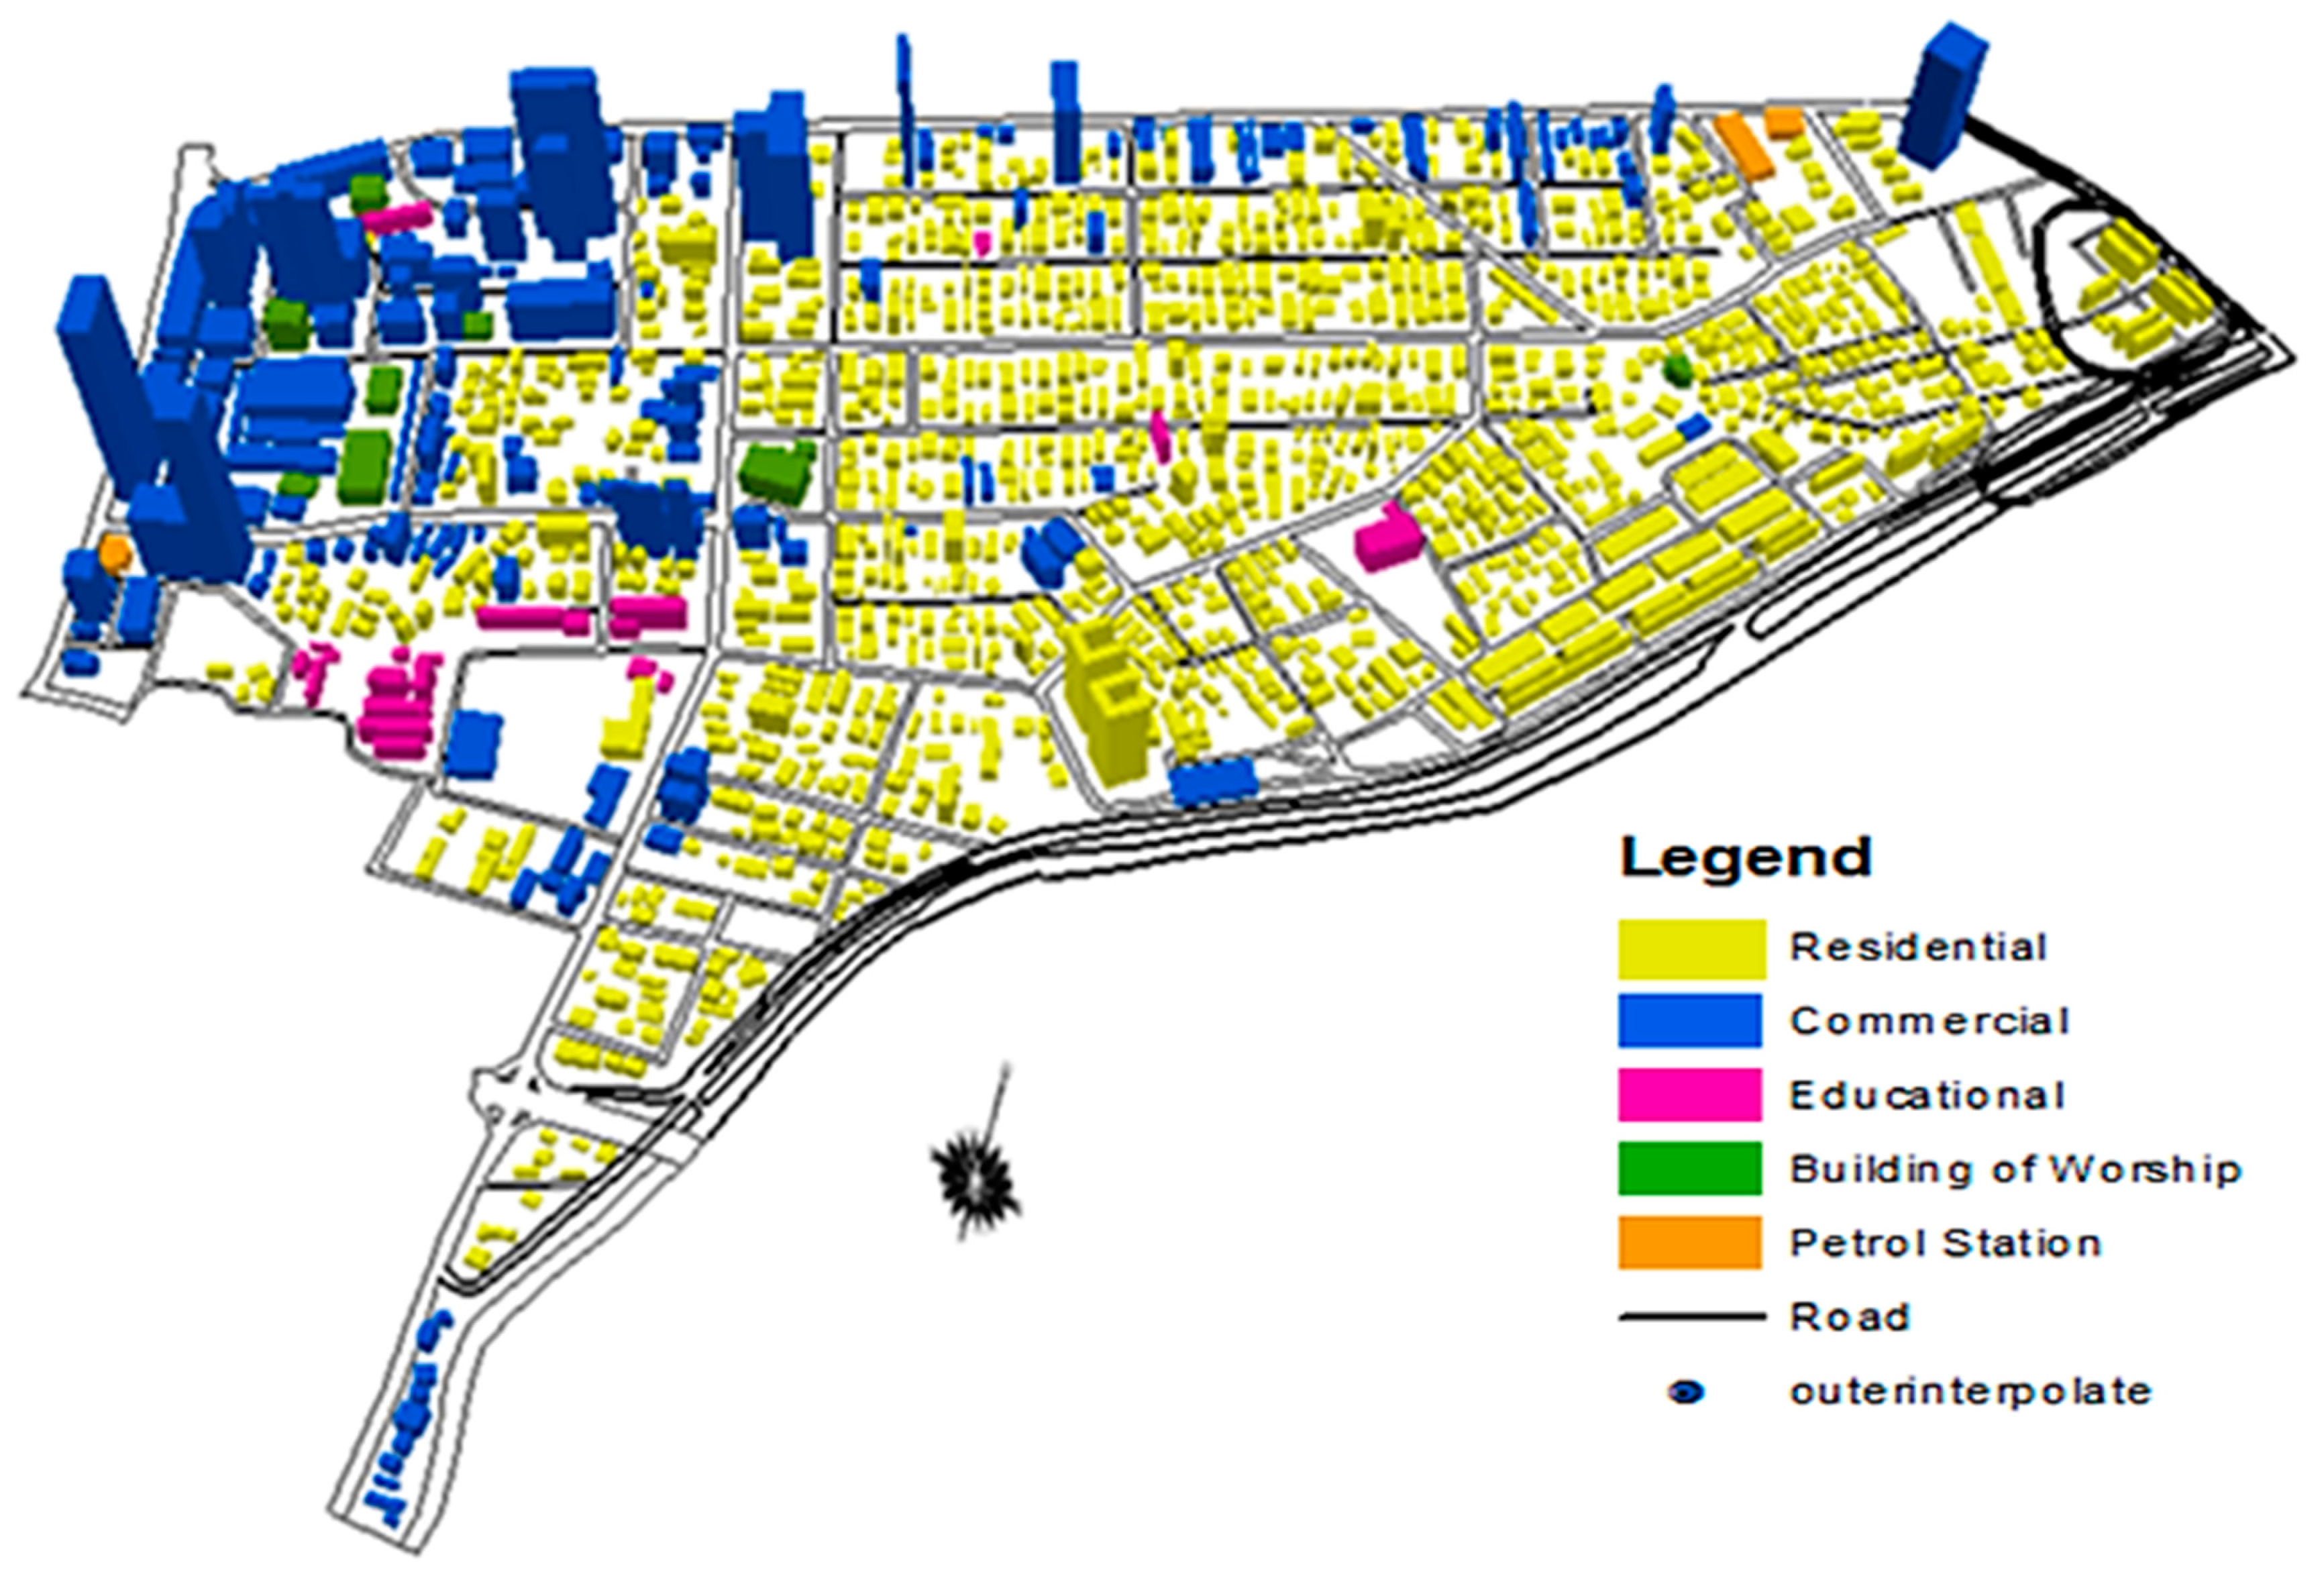
Building data sets were obtained from the satellite image and the field measurement at Kampung Baru. The satellite image, however, does not contain the information of building height. Hence, the footprint must be firstly digitized. The building footprints are represented as 2D polygons in the AutoCAD file as shown in Figure 7, while the 3D buildings, which are the buildings extruded based on their respective heights, are shown in Figure 8, in which the buildings are color-coded based on height. Buildings were manually digitized using aerial photos. The tree canopy data were not included in the analysis of the case study area because the analysis of the urban morphology was only focused on the buildings. Nevertheless, the influence of tree canopy might be inherently present on the field measurement data which is representative of actual data for the environmental settings in Kampung Baru and its surrounding area. The lack of the tree canopy data in the developed GIS database is a limitation that can be addressed and overcome in future studies.
The GIS spatial database of Kampung Baru consists of various types of buildings such as residential, educational, commercial, religious (i.e., building of worship), and petrol station as shown in Figure 7 and Figure 8. The spatial characteristics of Kampung Baru were mapped using GIS to present the current land cover of Kampung Baru. The detailed information of various building types such as building name, building coordinates, building area, and building height were stored and managed in the attribute table.
GIS is a modern application used to store, manage, and geo-spatially analyze various information. This study utilized GIS in managing climatic variables at Kampung Baru in a GIS database. The general workflow of the development of the GIS database is shown in Figure 9.
The first step in handling spatial data information was geo-referencing the various data sources into a single coordinate system. The base map obtained from the Department of Survey and Mapping Malaysia (DSMM) with the projected coordinate system of GDM2000 Malayan Rectified Skew Orthomorphic (MRSO) was used as a reference to geo-reference other data sources such as the WorldView2 satellite image and the topographic map in one coordinate system. Next, the land cover data such as the land-use categories were identified.
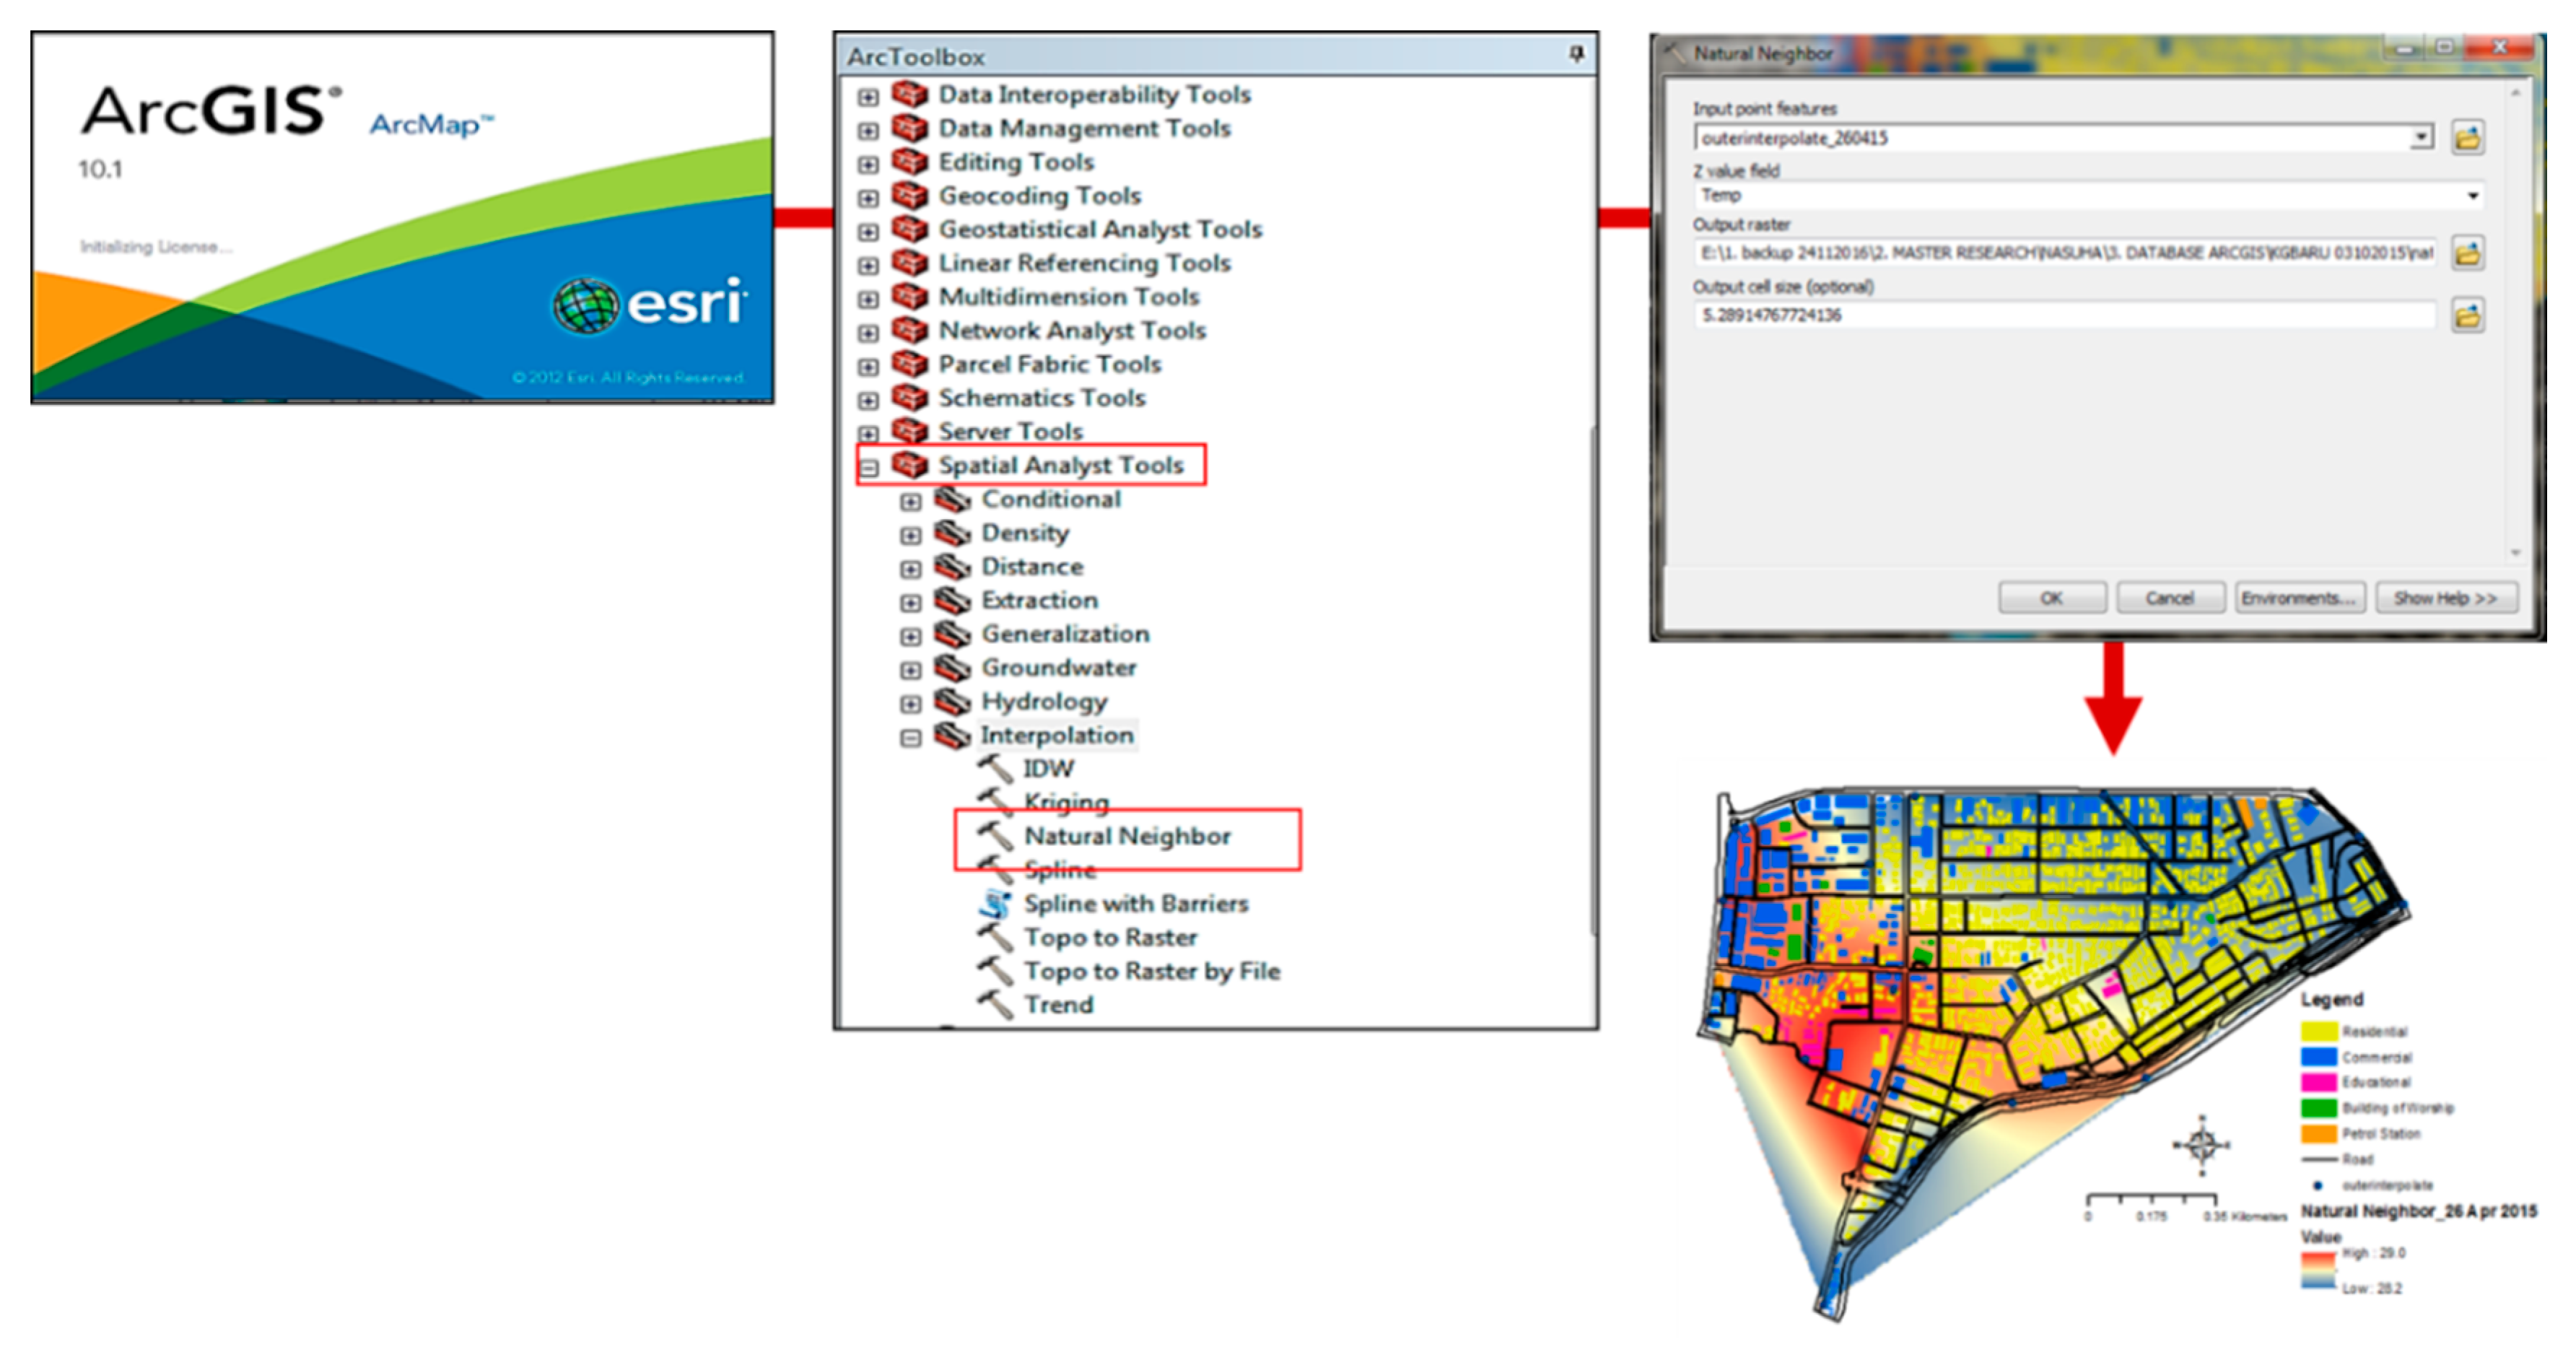
The land cover data were digitized into vectors to produce the map of Kampung Baru which includes different land categories and features. The land cover data were classified based on the feature class. For each feature class, detailed feature information such as the name, location, and area of the block was managed in the attribute table. The characteristics of spatial data were then analyzed using GIS geo-processing tools. Figure 10 shows the workflow in analyzing the temperature distribution in Kampung Baru. In this study, the spatial analyst tool (i.e., the ‘Natural Neighbor’ function) was used to interpolate the data of the measurement days from the selected points in the whole area of Kampung Baru.
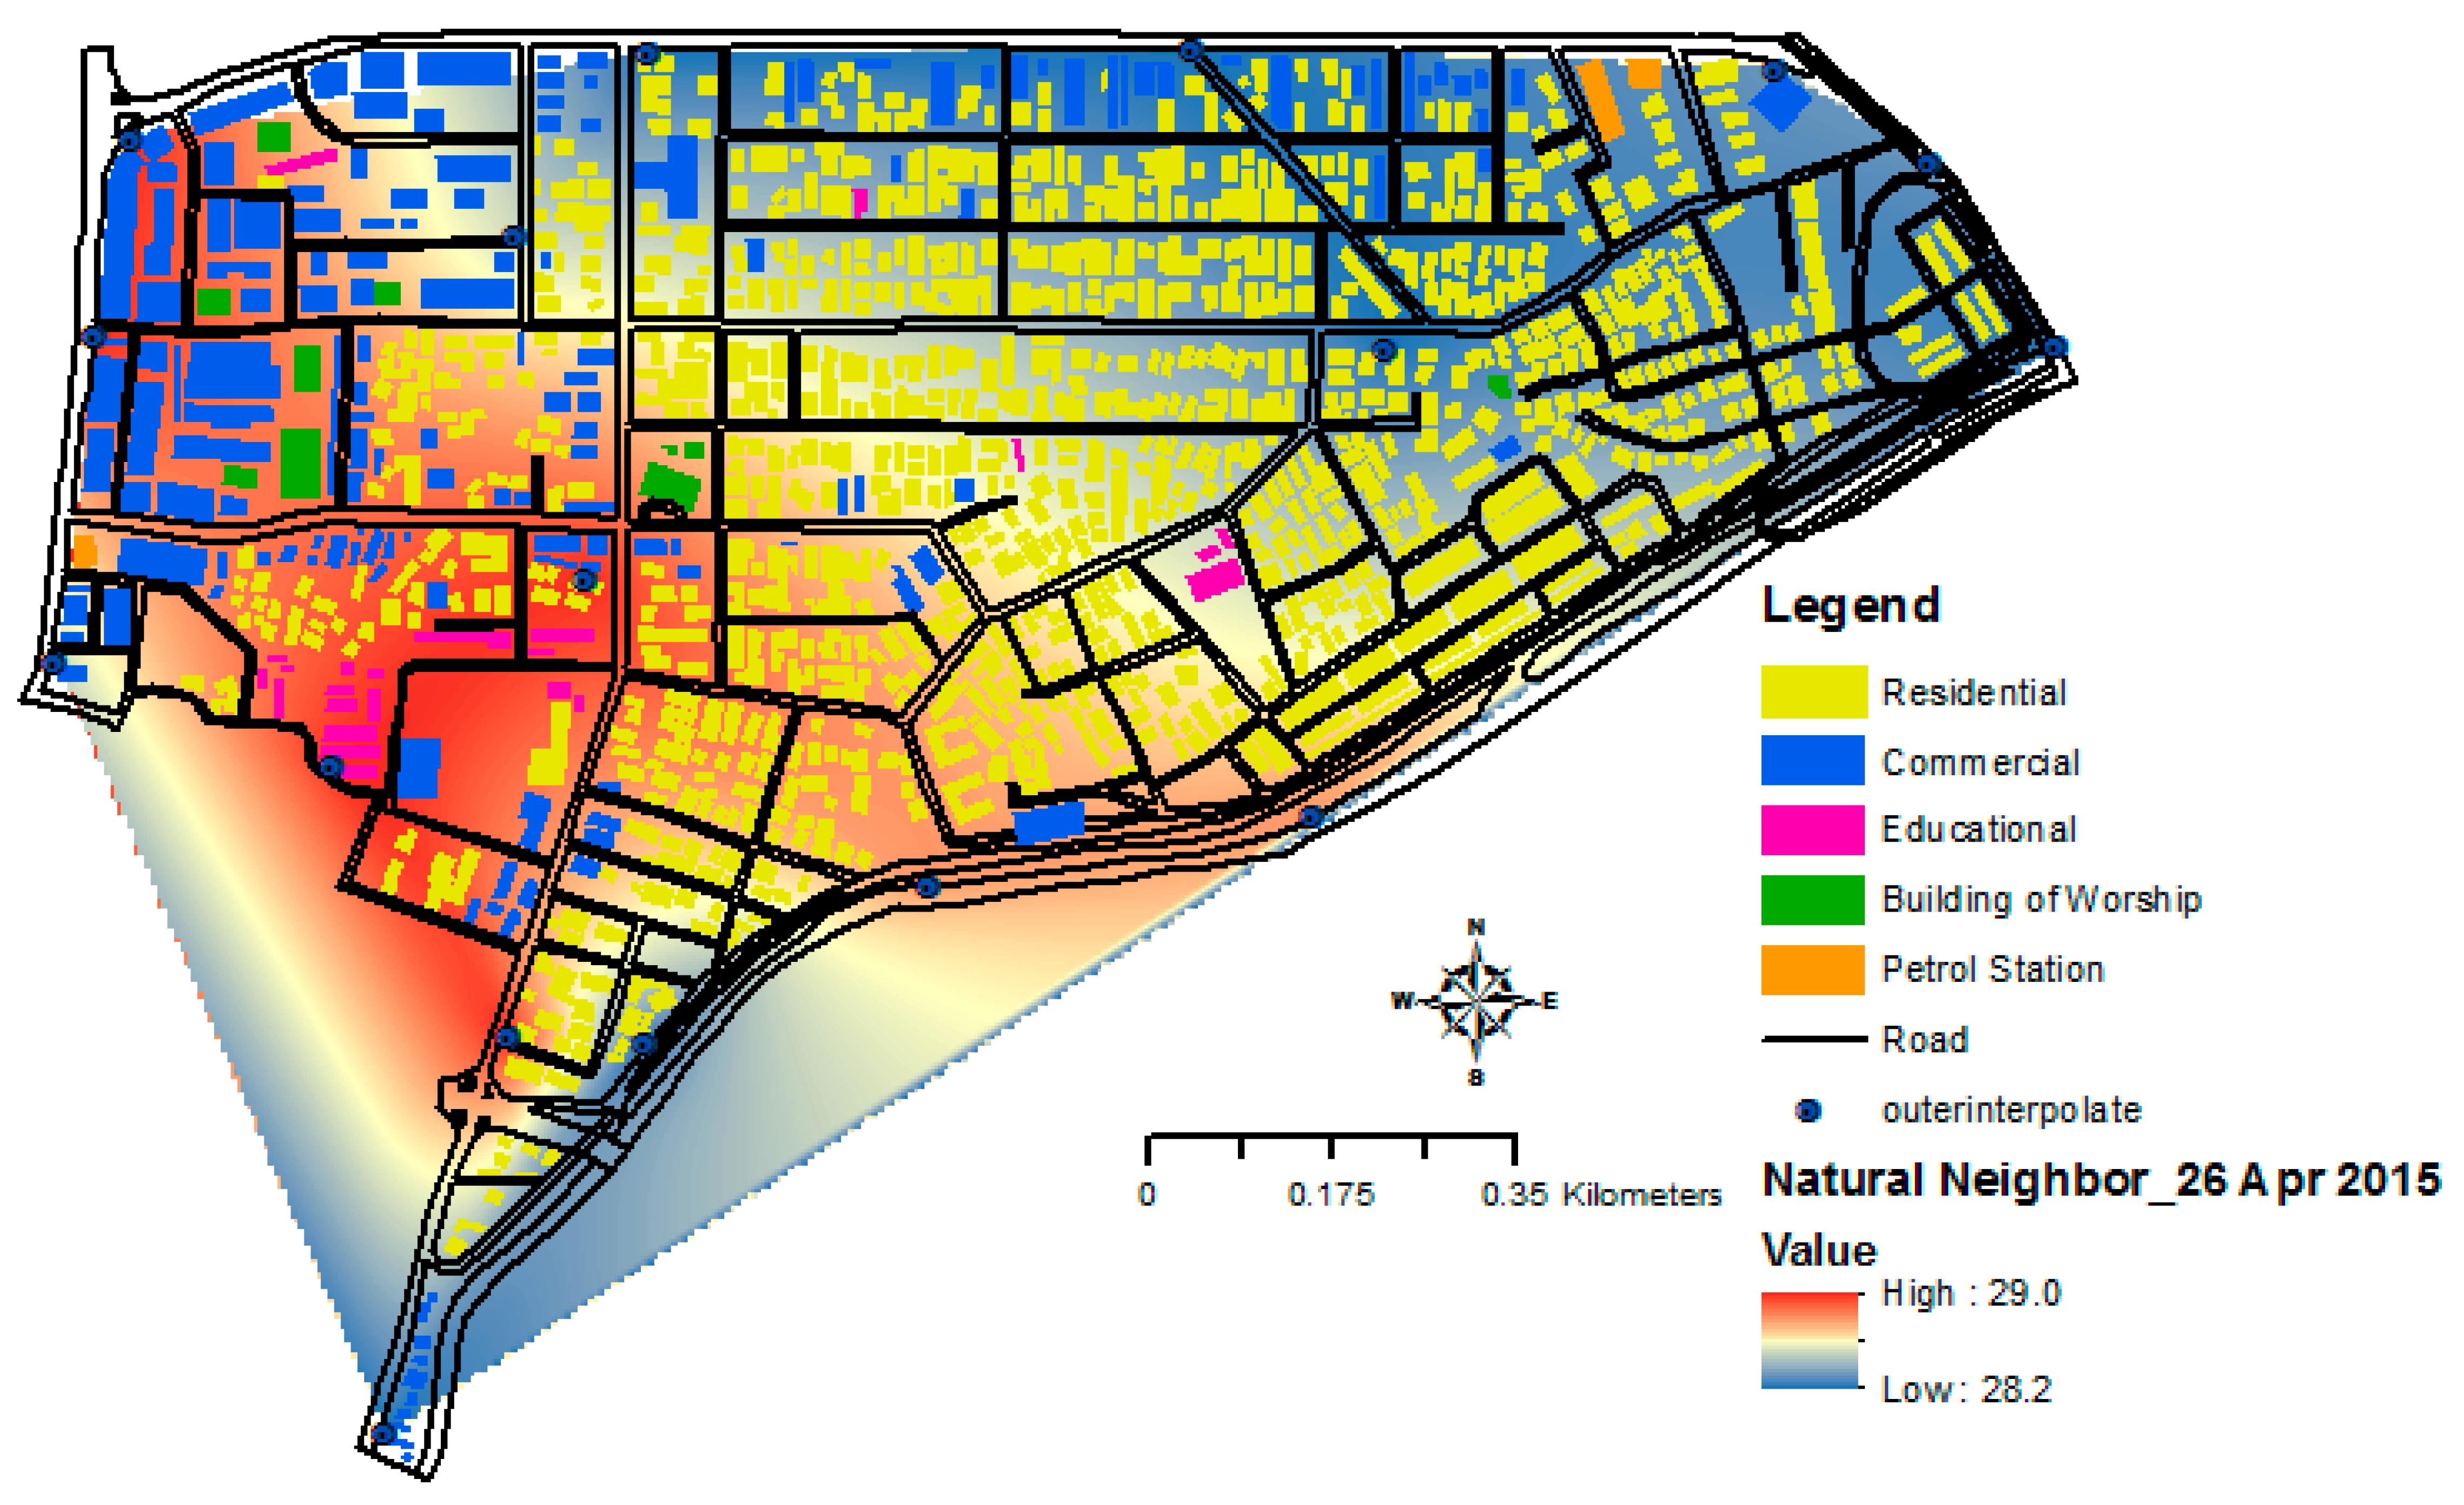
Figure 11 shows an example of the temperature distribution in Kampung Baru developed using ArcGIS. Urban climatic data (i.e., temperature and relative humidity) were imported into ArcGIS 10.1 to create a complete database coupled with the building morphology. The analysis was done to map out areas with a higher risk of UHI in Kampung Baru indicated by high temperatures shown in the figure and analyze the factors affecting UHI based on Land Use Land Cover (LULC). In the GIS environment (ArcGIS 10.1), the analysis of fixed and mobile measurements involved air temperature data. For each station, the daily average air temperatures for seven days were inserted into the attribute table. Further analyses were carried out in the GIS interface using the ArcGIS software. When the building morphology database was ready to be used and the analysis of building statistics was done, the urban climate data was then overlaid on the building morphology database using a 3D analyst function (i.e., Natural Neighbor) in ArcGIS. Figure 11 displays the results of interpolation between these two elements, urban climate data and building morphology. It can be deduced that the spatial variation of the urban morphology has an impact on urban climate and outdoor thermal comfort.
Natural Neighbor is a type of interpolation method to predict weather at locations where measurement was not performed. The interpolation method uses real weather information (e.g., precipitation, elevation or mineral content) obtained from measurements performed at particular locations. The GIS interpolation mapping shows the variation of the average daily air temperature across the Kampung Baru area. The air temperature interpolation affected building morphology which contributed by variation of building shadow, land cover features, sky view factor, and height/width ratio [21,22]. This has a potential application in future research related to the impact of urban development on local weather or climate.
To classify each land-use type, MS1759:2005 (Geographic Information/Geomatics—Feature and Attribute Codes), which is the standard code used to develop a database in Malaysia, was used. Table 5 summarizes the main land-use classifications in MS1759:2005. Currently there are 12 feature categories including X which has been reserved for a special use (dataset-specific) in each classification scheme. In this study, the mostly used category is B-Built Environment. Each category is then divided into many sub-categories depending on the purpose of classification.

3. Results and Discussion

3.1. Temporal Analysis of Urban Temperatures

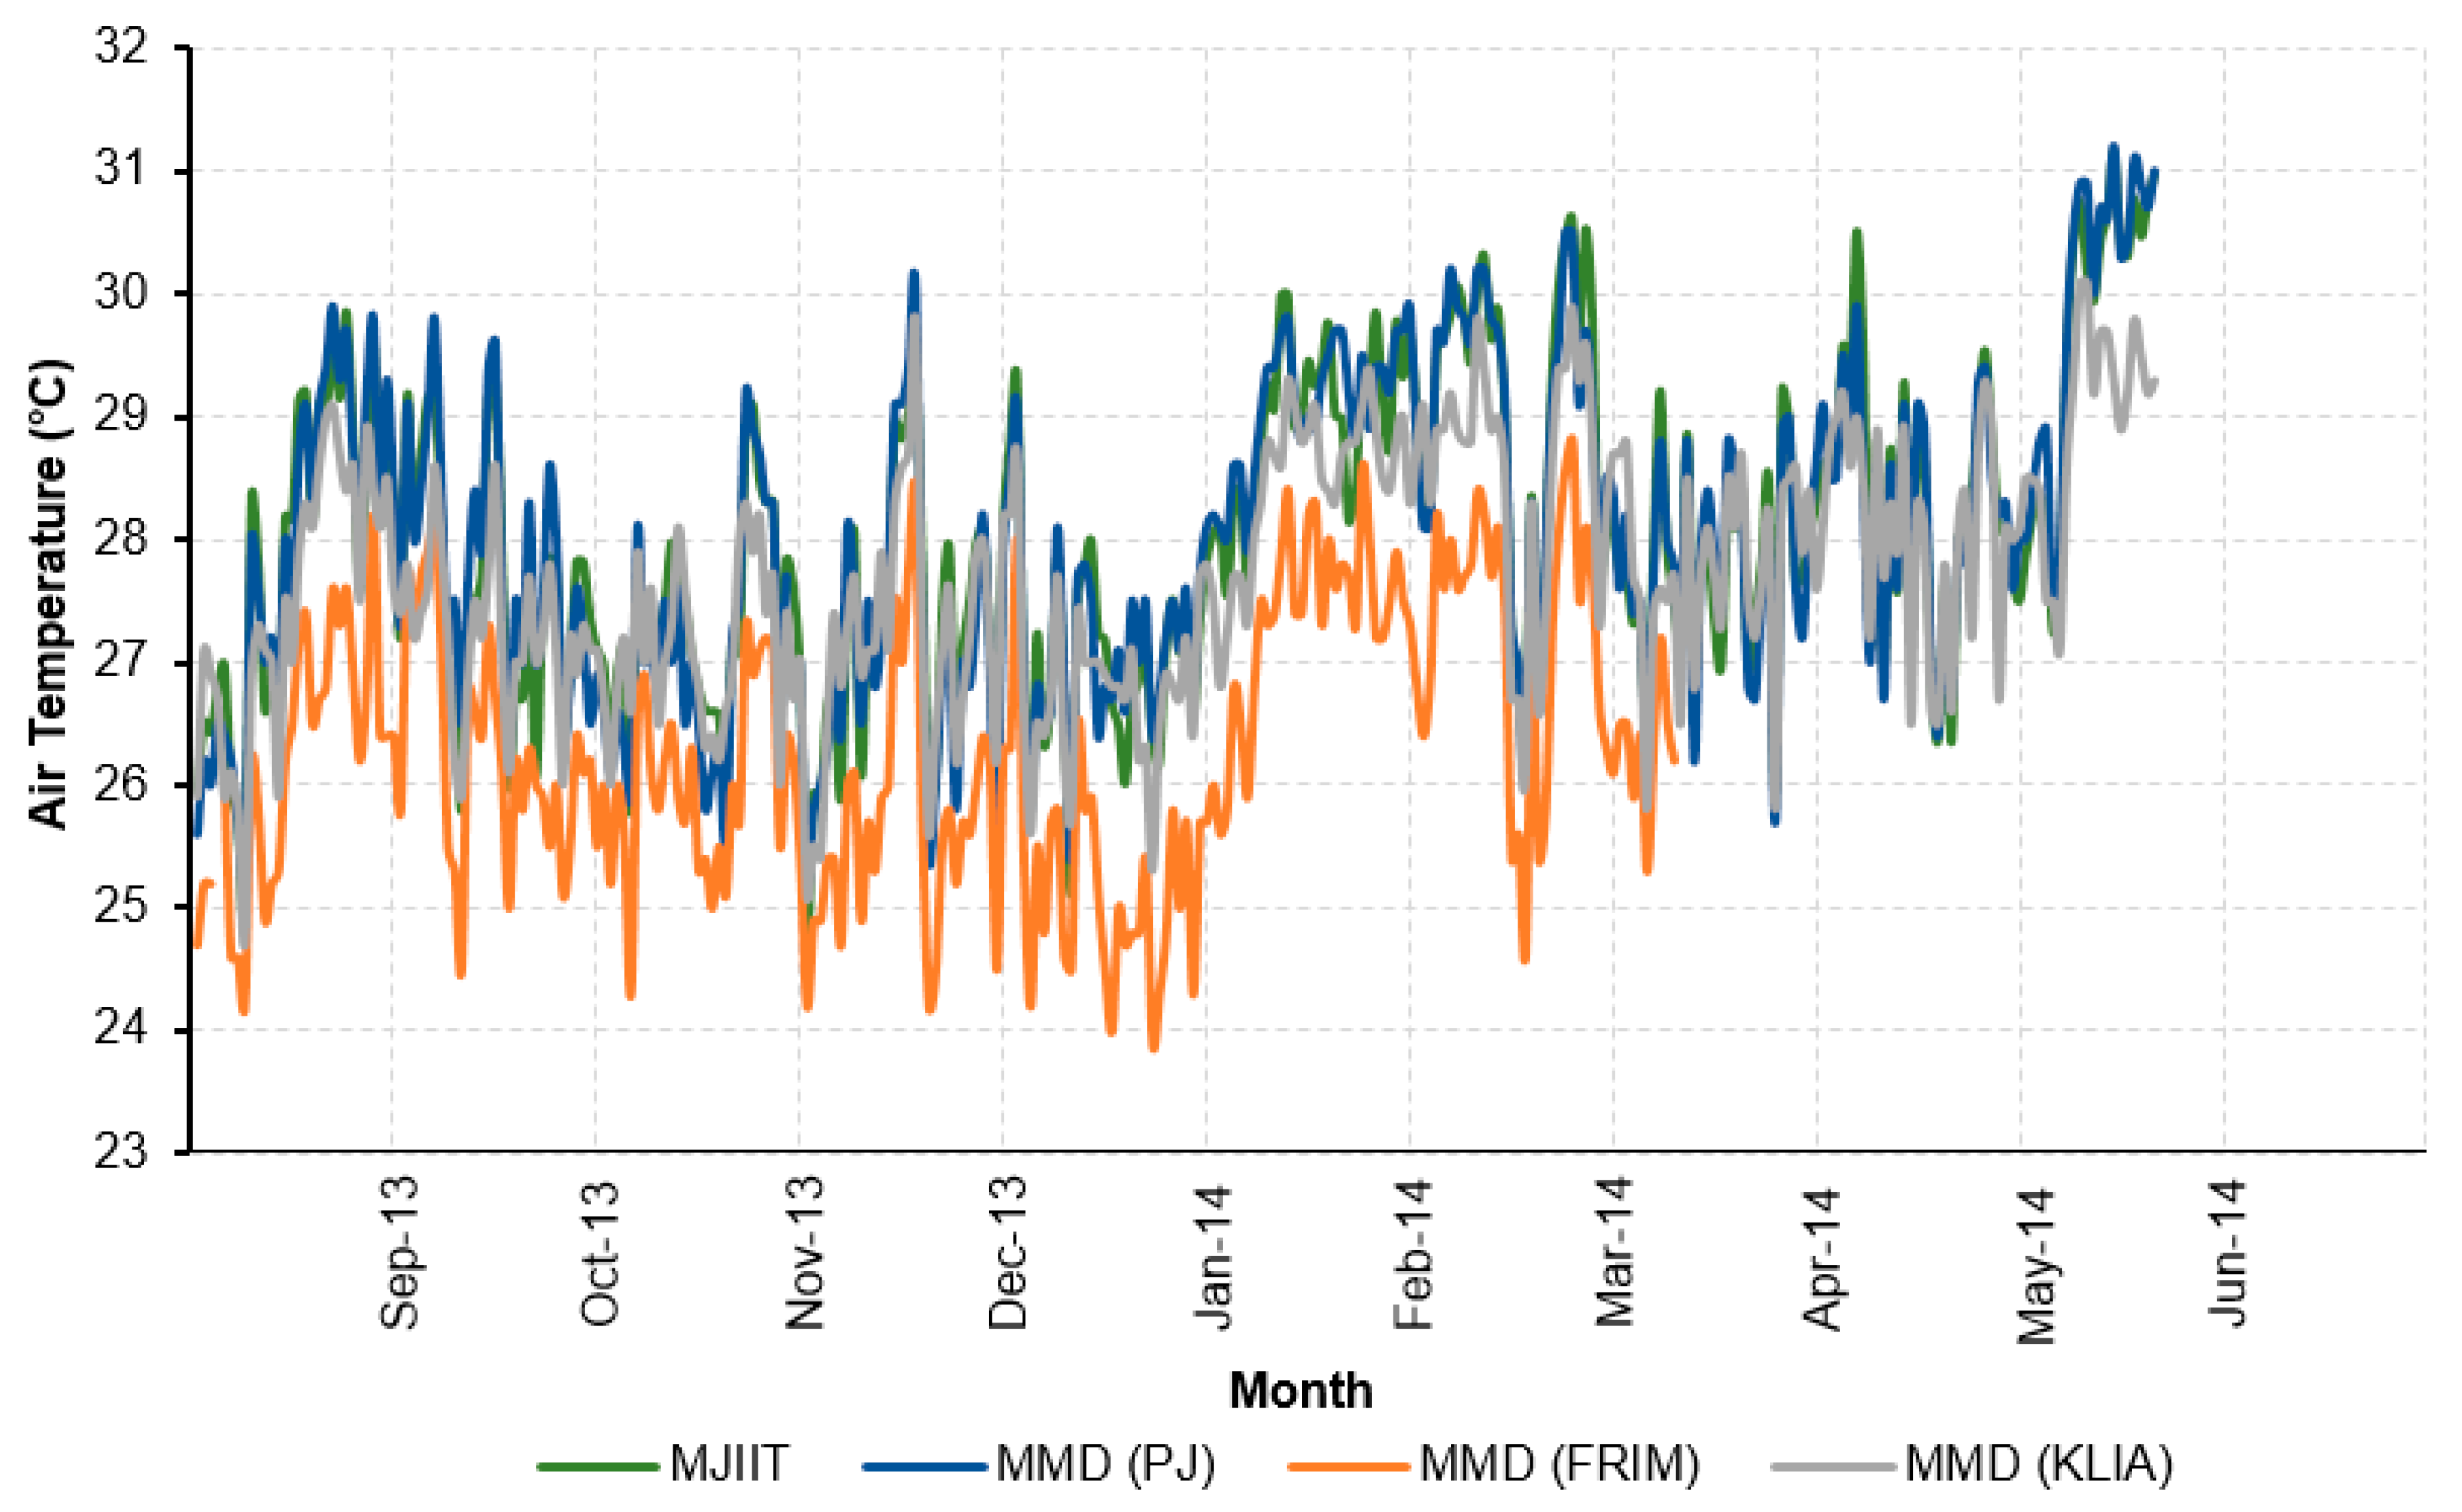
Figure 12 shows the mean temperature profiles of an eight-month observation obtained from MJIIT-CS and three meteorological stations of Malaysia Meteorological Department (MMD). Two meteorological stations are located in Petaling Jaya (3°06′ N, 101°39′ E) and KLIA (2°44′ N, 101°42′ E), whereas one auxiliary station is located in FRIM Kepong (3°14′ N, 101°38′ E) which lies in a rural area. All stations, which were at fixed locations, were analyzed for the weather pattern in Klang Valley. The minimum temperature, which was between 25.2 °C and 27.1 °C, was recorded in January 2014. During this period, there were a few areas all over the country including Sabah and Sarawak that were affected by floods. The maximum temperature, which was between 28.4 °C and 30.0 °C, was recorded in June 2014 and found to be consistent with the recorded values from other stations in the same month.
Additionally, the result also revealed higher temperatures were recorded by MJIIT-CS and the weather stations located in KLIA and PJ, all of which are in urban areas. On the contrary, the lowest temperature was recorded by the weather station located in the Forest Research Institute Malaysia (FRIM) Kepong, which lies in a rural area. In addition, Kampung Baru had a higher temperature, between 1 and 2 °C higher compared to that of FRIM Kepong. According to [1], the annual mean temperature of an urban area varies between 1 and 2 °C greater than that of a rural area, indicating the higher probability of UHI occurrence in an urban area. Based on the findings, many factors, for instance, urban structure, building materials, width of street, sky view factor, and anthropogenic heat contribute to the occurrence of UHI in urban areas [1]. It is remarkably important to evaluate the UHI phenomenon in the study area through spatial and temporal analysis.

3.2. Temperature Variation under Different Environmental Settings

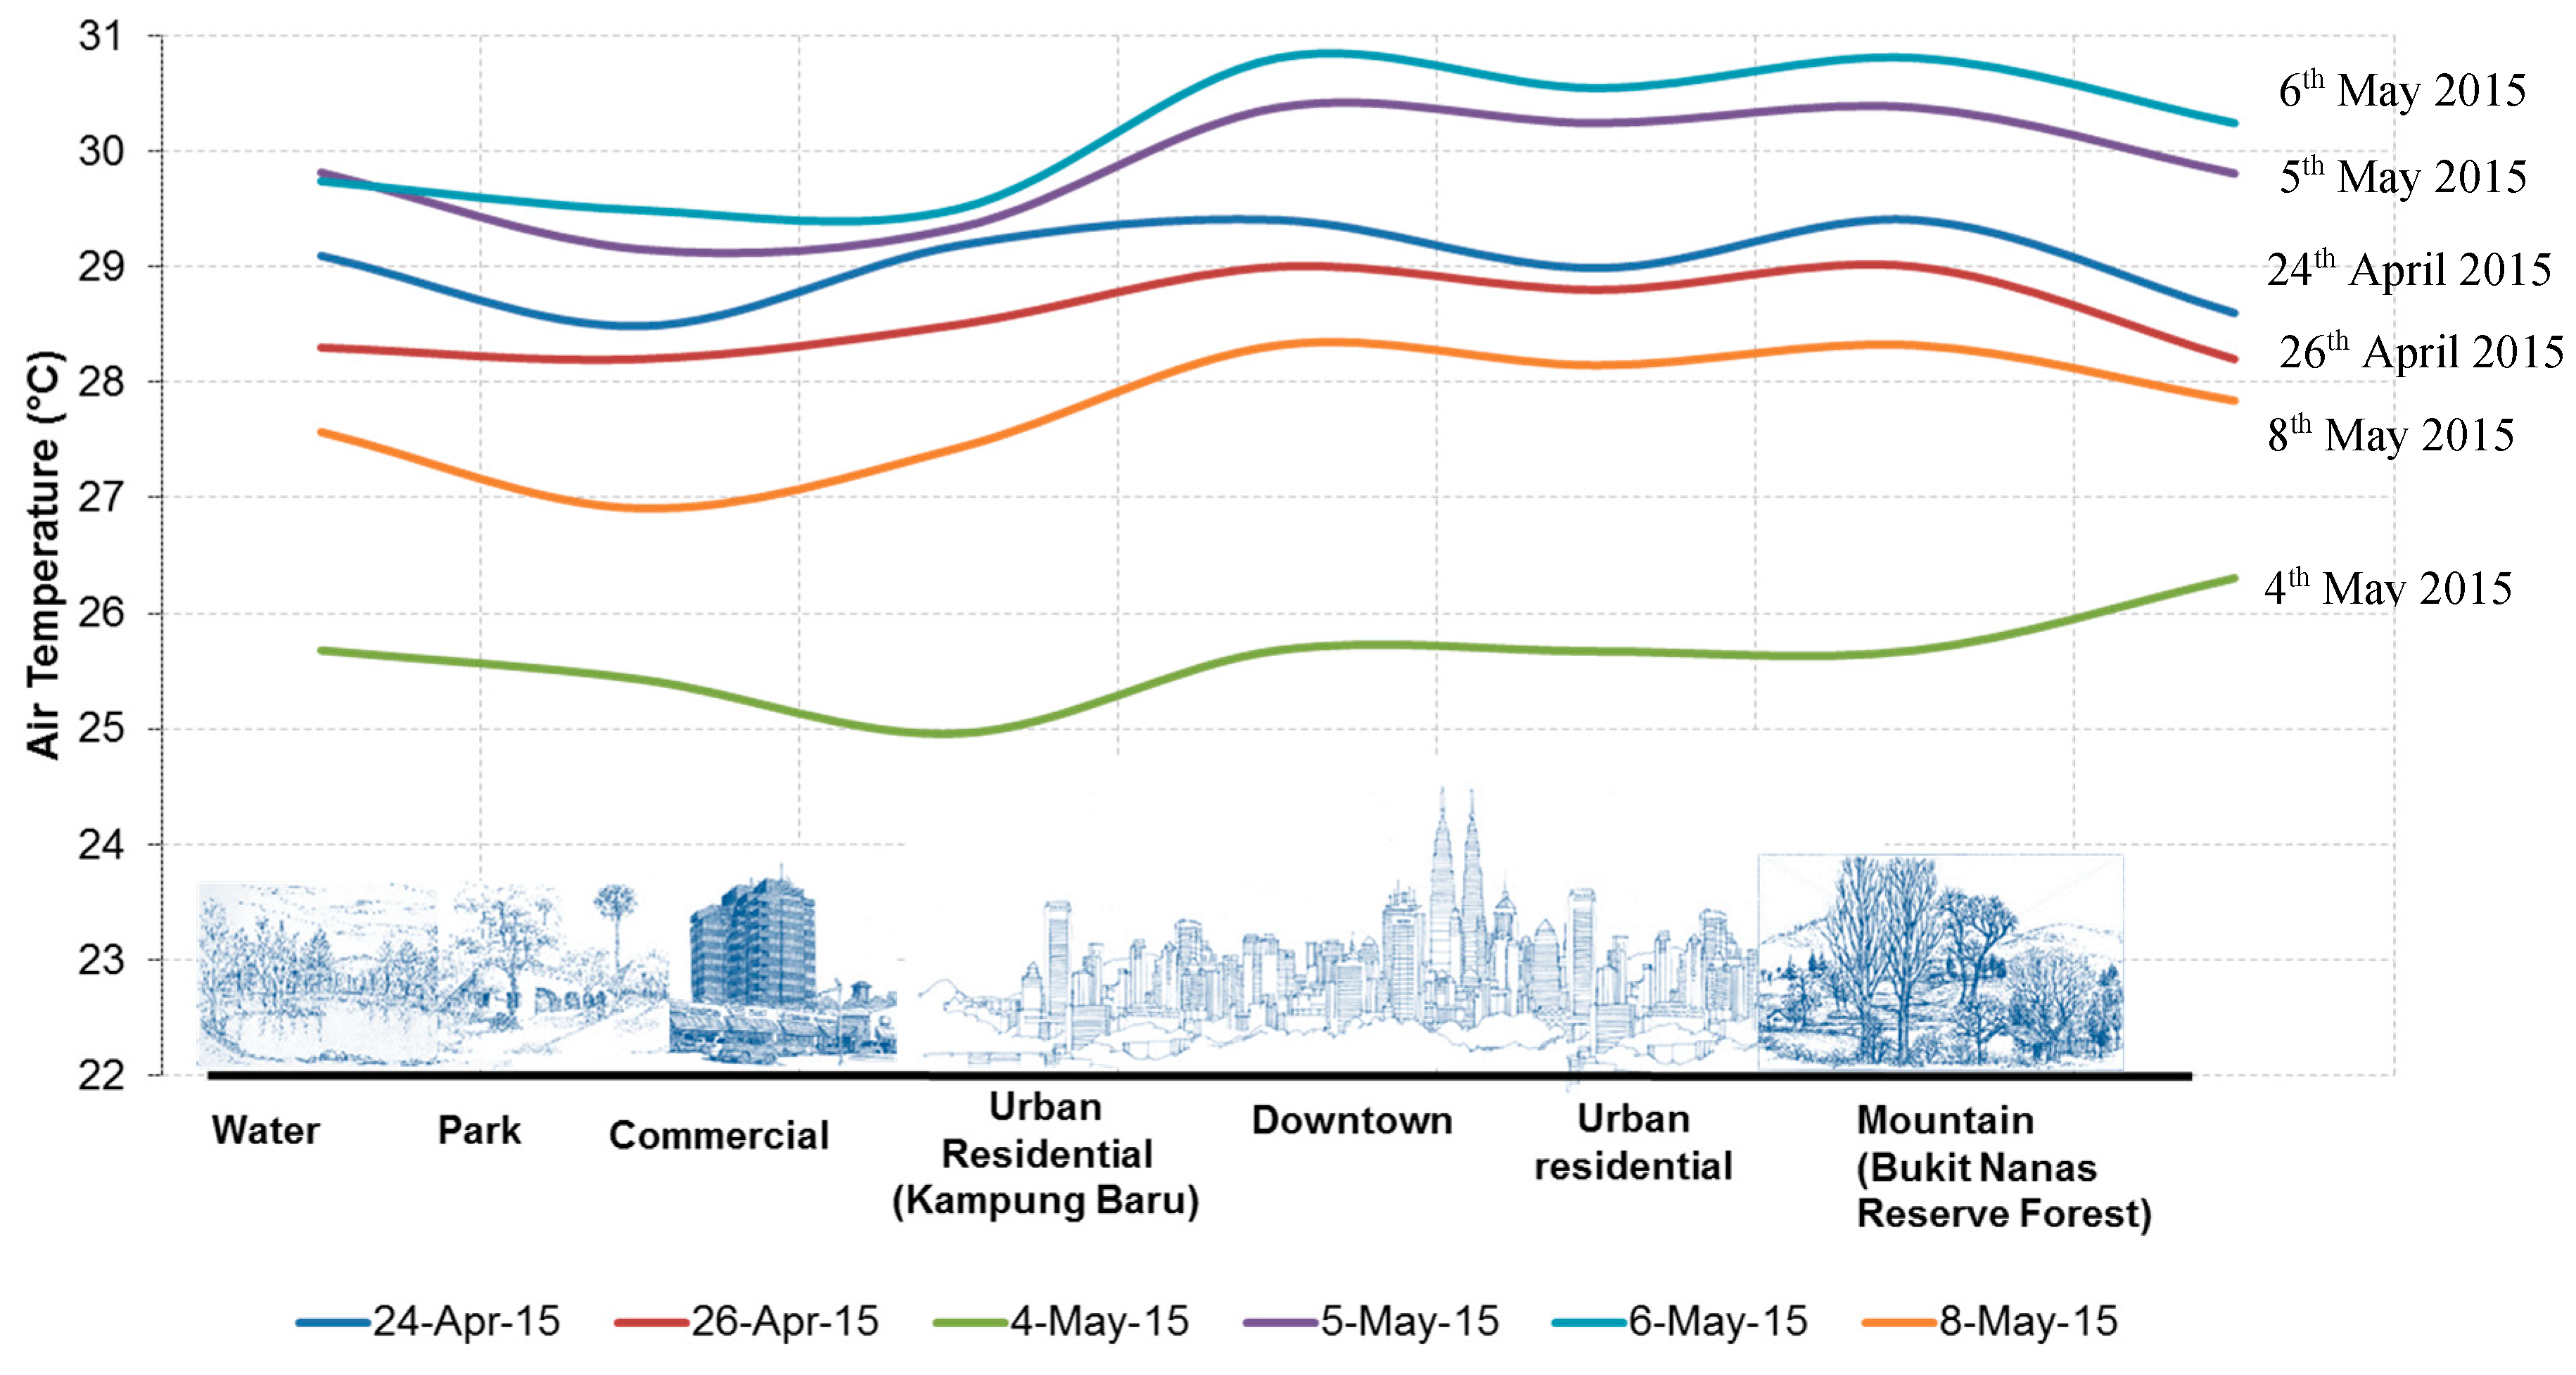
Figure 13 presents air temperature distributions obtained in various types of locations during the mobile measurement. As stated earlier, the route of measurement passed through various types of land use such as pond (water), commercial, park, urban residential (Kampung Baru), downtown, and mountain.
Figure 13 shows that air temperatures at the water area (pond) and mountain (Bukit Nanas Reserve Forest) are mostly low compared to the other areas due to the extensive presence of cooling elements such as water and vegetation. However, the air temperature trend obtained on 4 May 2015 contradict with the aforementioned finding since the measurement on 4 May 2015 was carried out directly after the rain stopped, and this was considered as a wet day. Hence, the effect of UHI is not significant from the air temperature distribution obtained during or after the rain (wet day).
With the exception of the data reported on 4 May 2015, the graph reveals that the urban residential area (Kampung Baru) is the hottest region compared to the other areas on all observation days that were dry days since there was no rain or the environment was fairly bright and sunny. The results clearly show that the study area is much hotter than the downtown area. It is worth noting that this finding is consistent with any day of observation. While the differential is less than 0.4 °C, it is counter to the belief that the downtown area will be the hottest during the night relative to other areas. Nonetheless, Kampung Baru is not seen as a high-rise development zone. Most possibly, the key explanation for the highest temperatures reported in Kampung Baru is the prevalence of nearby infrastructures such as highways (which frequently have heavy traffic) and high-rise buildings, as well as being a very compact area.
The findings also indicate that the green areas with roadside trees were leading to the cooler temperature in the neighboring town. The air temperature in the Titiwangsa Lake Gardens Park is lower on each day of the measurement relative to the air temperature in the Bukit Nanas Reserve Forest. This finding is consistent for every day of observation except 4 May 2015. This is due to the presence of roadside trees in the Titiwangsa Lake Gardens Park, as opposed to the location of Bukit Nanas Reserve Forest which is restricted by the commercial highway zoning. A combination of a green area with a water element will lower the air temperature as opposed to a stand-alone green area.

3.3. Temporal Analysis of UHI Intensity (UHII)

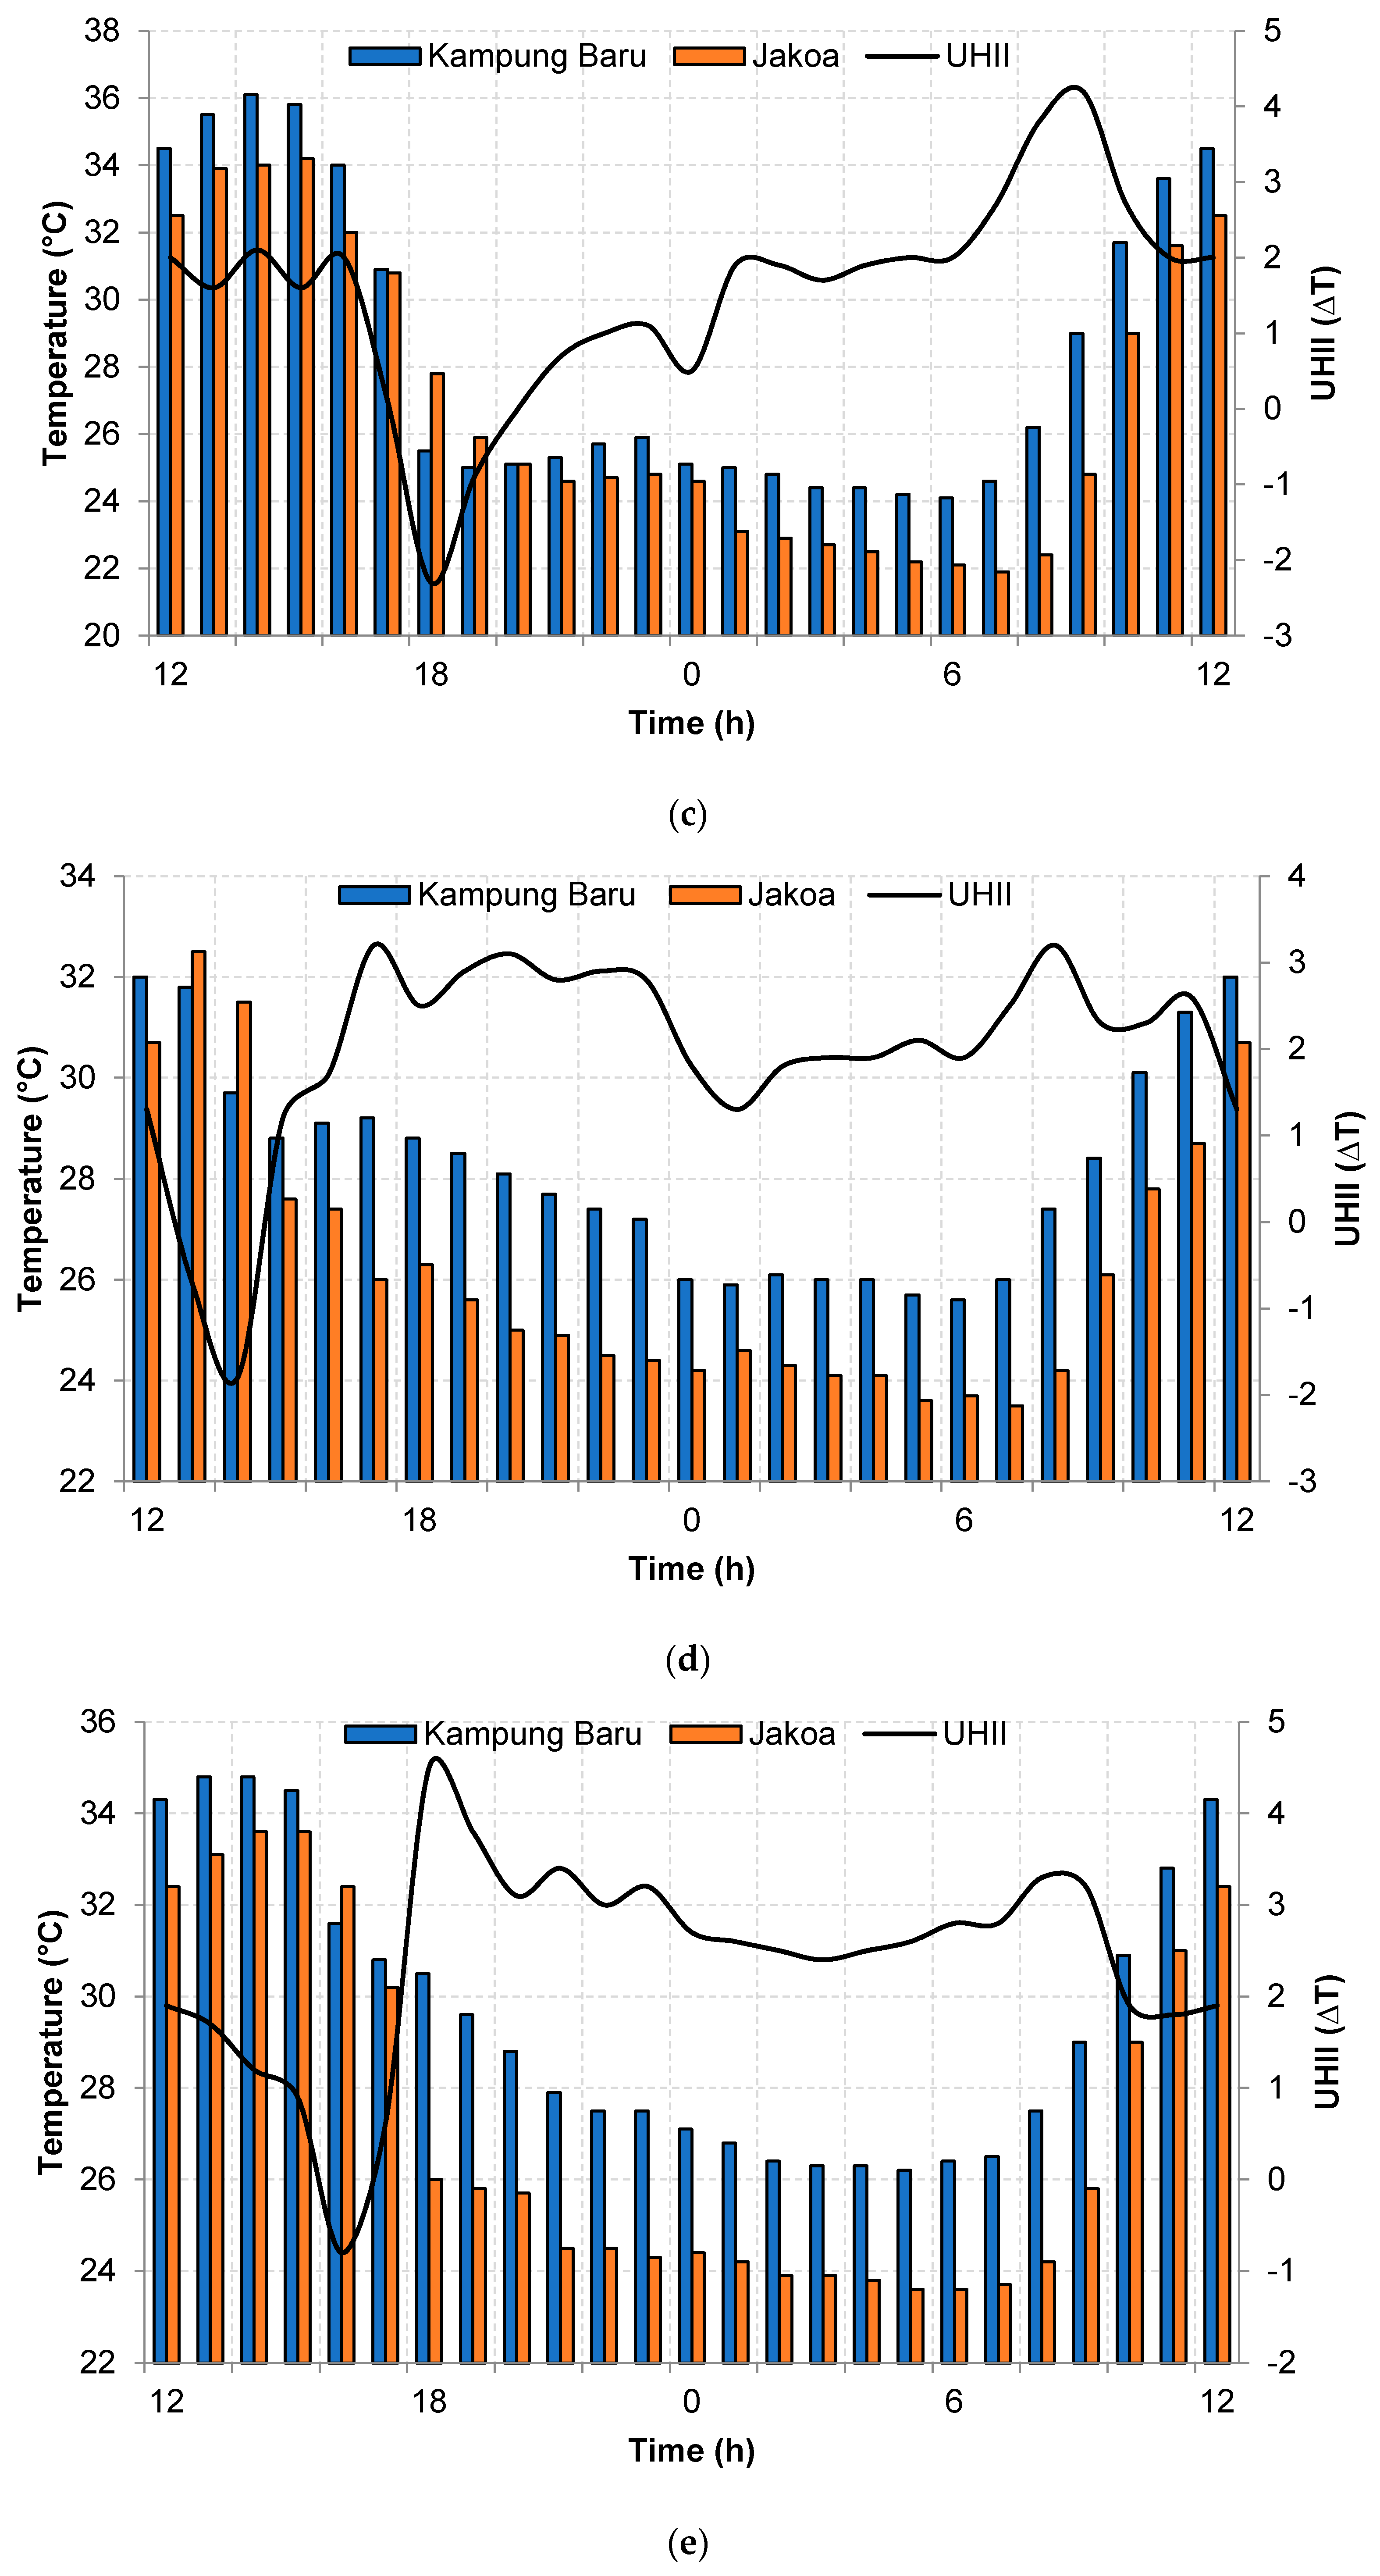
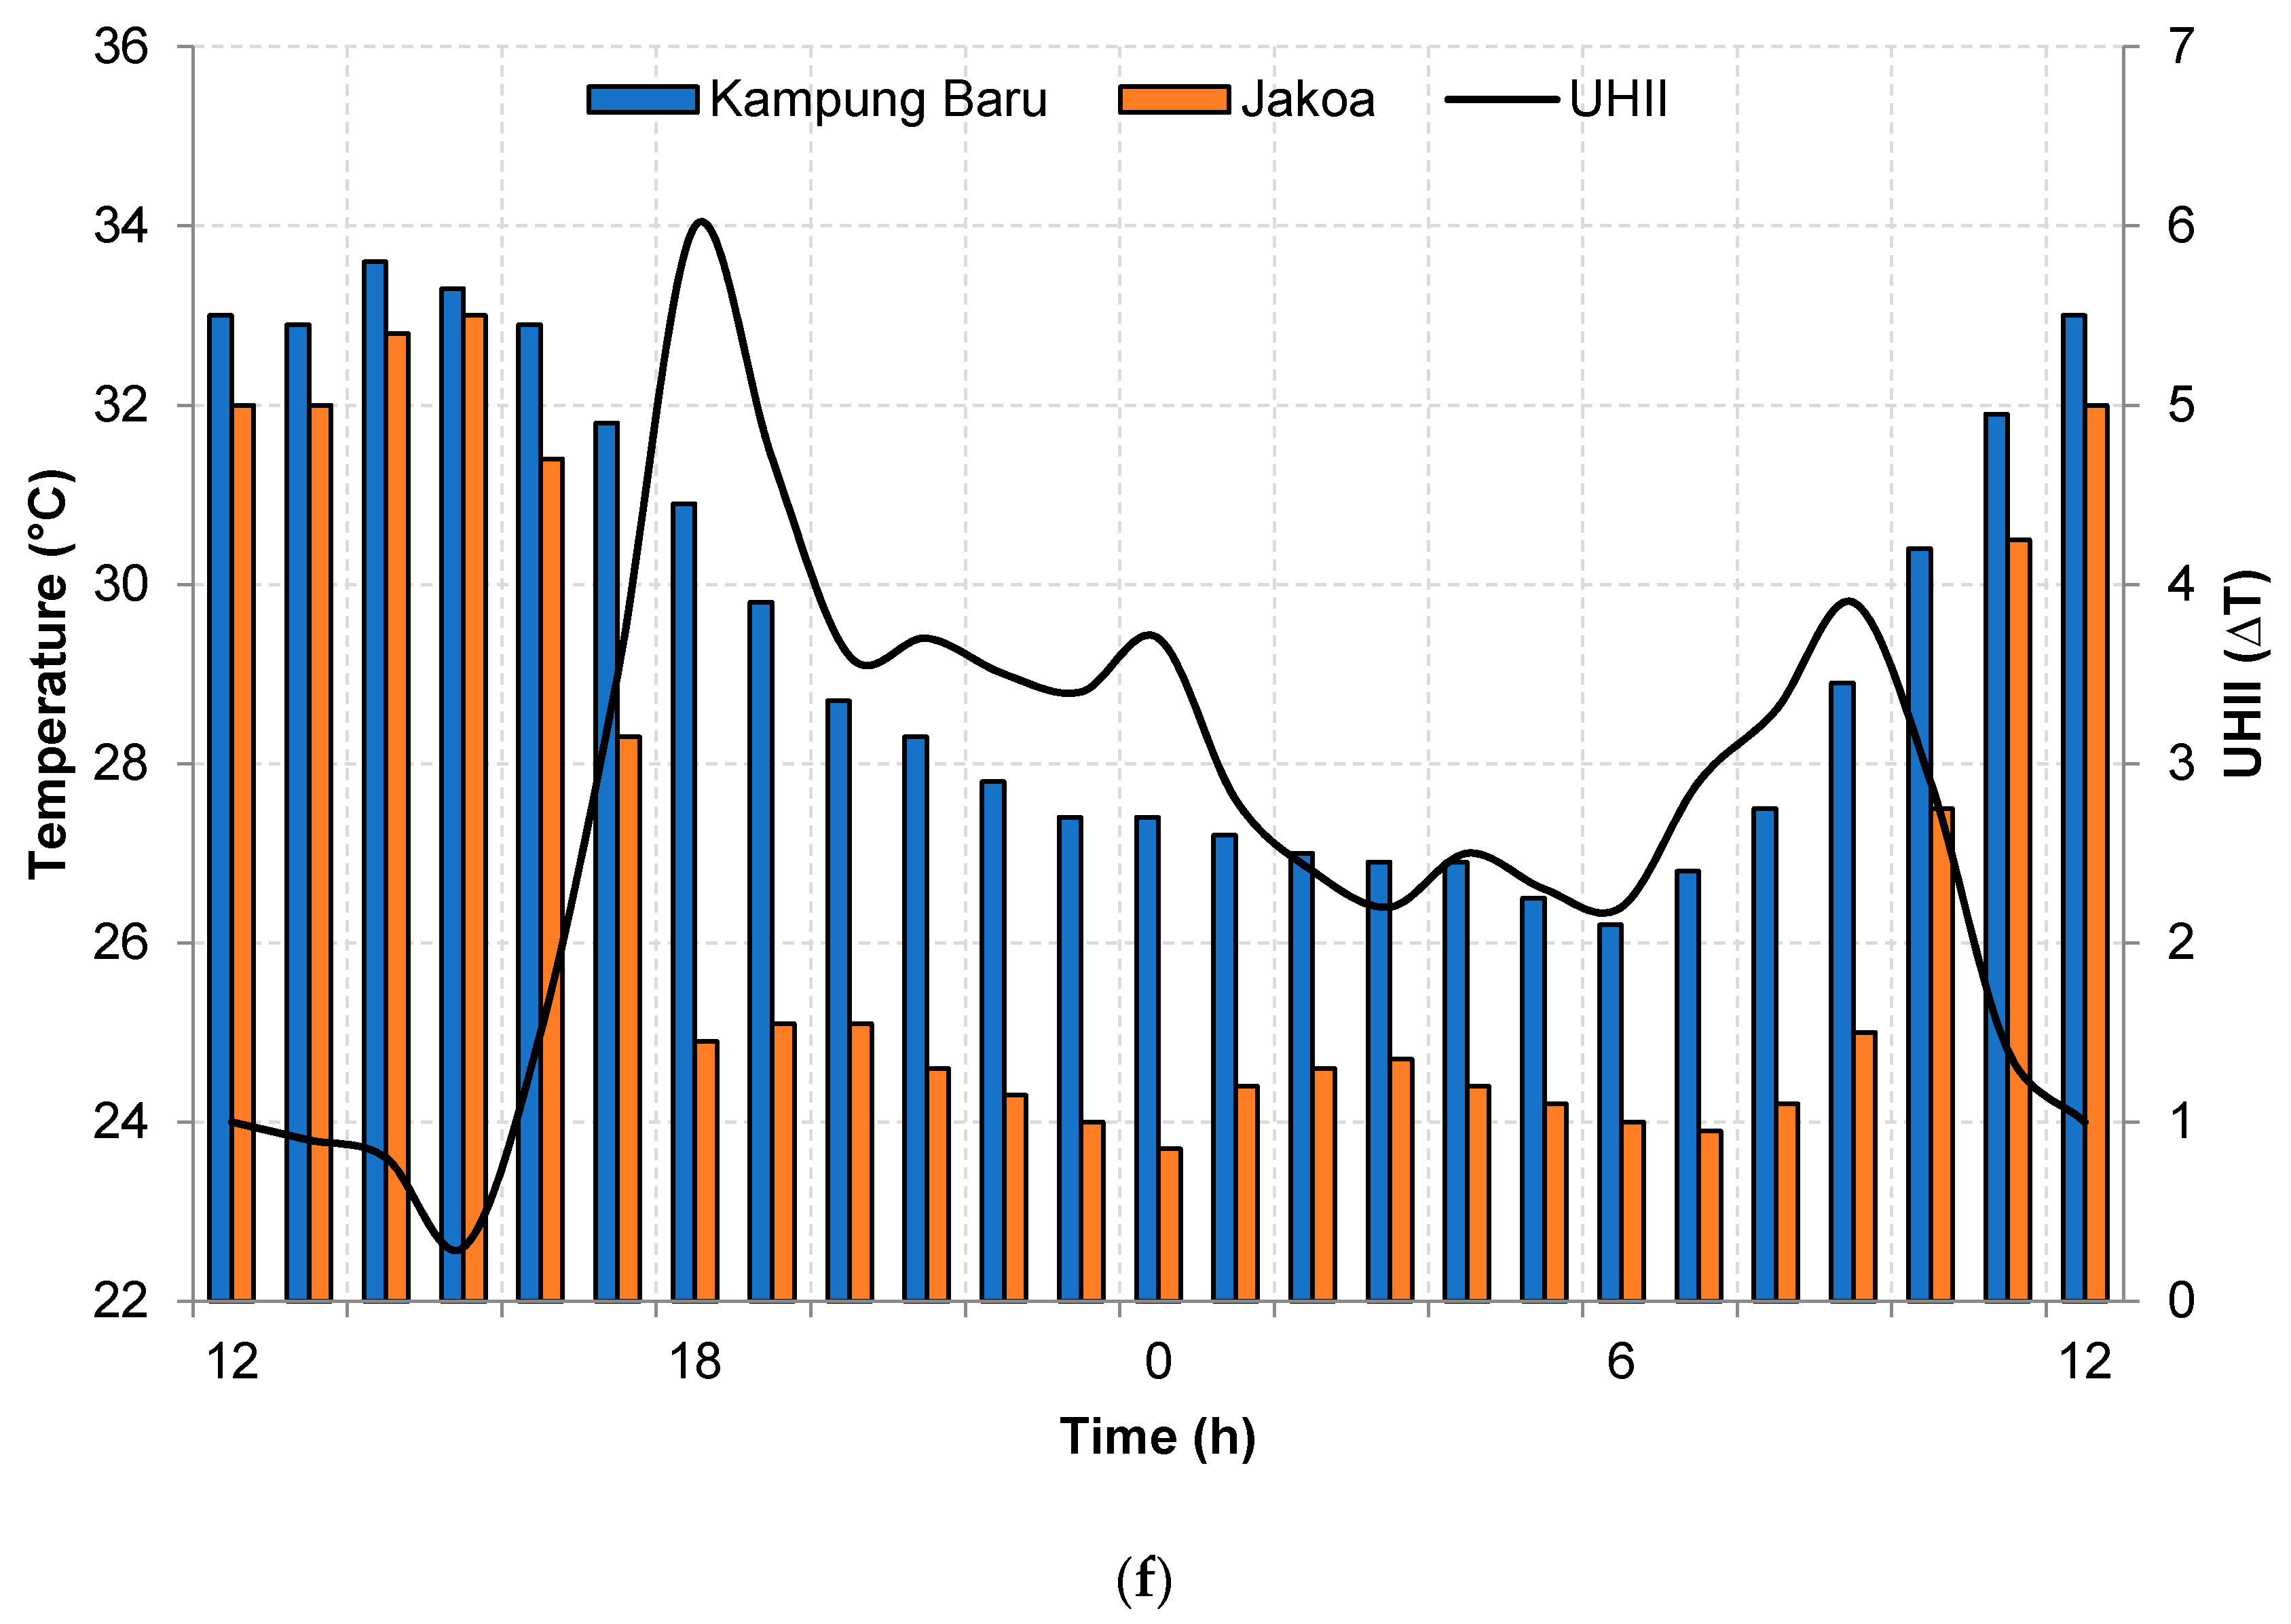
In an attempt to investigate the urban heat island intensity (UHII) in the study area, outdoor air temperature measurements were performed in situ and the measured results were compared with the rural weather station MMD in Jakoa, Gombak, during the same period from 14 to 19 October 2015. The minimum and maximum values of UHII from each day of observation are listed in Table 6. In addition, Figure 14 shows the recorded temperatures at Kampung Baru (urban area) and Jakoa (rural area) and the temperature difference between the two areas.
From the table, the maximum intensity of UHI was 6.0 °C. The negative values indicate that the air temperature at Jakoa, Gombak, is higher compared to Kampung Baru. The negative result only happened for one or two hours in a day. This is because of rainfall at Kampung Baru at that particular time which cooled down the local environment. The minimum air temperature was recorded at 06:00 at the urban station and 07:00 at the rural station. Meanwhile, the maximum temperature at the rural station occurred one hour after the recorded maximum temperature at the urban area on each day of observation. This is because the condition in the urban area, which has a higher density of buildings and pavements, allows the absorption of heat during the daytime. However, the release of heat occurs much slower at the nighttime. In contradiction to the urban area, the rural area is normally surrounded by greenery. From all of the observation days, the UHI intensity was found higher during the nighttime and lowest during the daytime. The UHI intensity continued to increase after 18:00 and peaked at about 06:00, as shown in Figure 14. It can be seen in Figure 14a–c that the UHI peak was found early in the morning due to heavy precipitation that occurred in the evenings of three consecutive days, from 14 to 16 October. This is contrary to the observation in Figure 14d–f in which the UHI peak occurred in the evening as a result of clear sky for the rest of the days.
Figure 15 shows the hourly average of UHI intensity over six (6) days. Overall, the hourly average of UHII ranged between 1.0 °C and 4.0 °C, which was equal between the urban and rural areas. The nighttime temperature in the urban area is higher than in the rural area. The highest value of hourly average UHII was recorded at 09:00 and the lowest value were recorded at 16:00. All calculated values of UHII are positive values, indicating that the high temperature recorded at Kampung Baru contributed to the UHI phenomenon.

3.4. Relationship between Urban Heat Island (UHI) and Building Morphology in GIS Interface

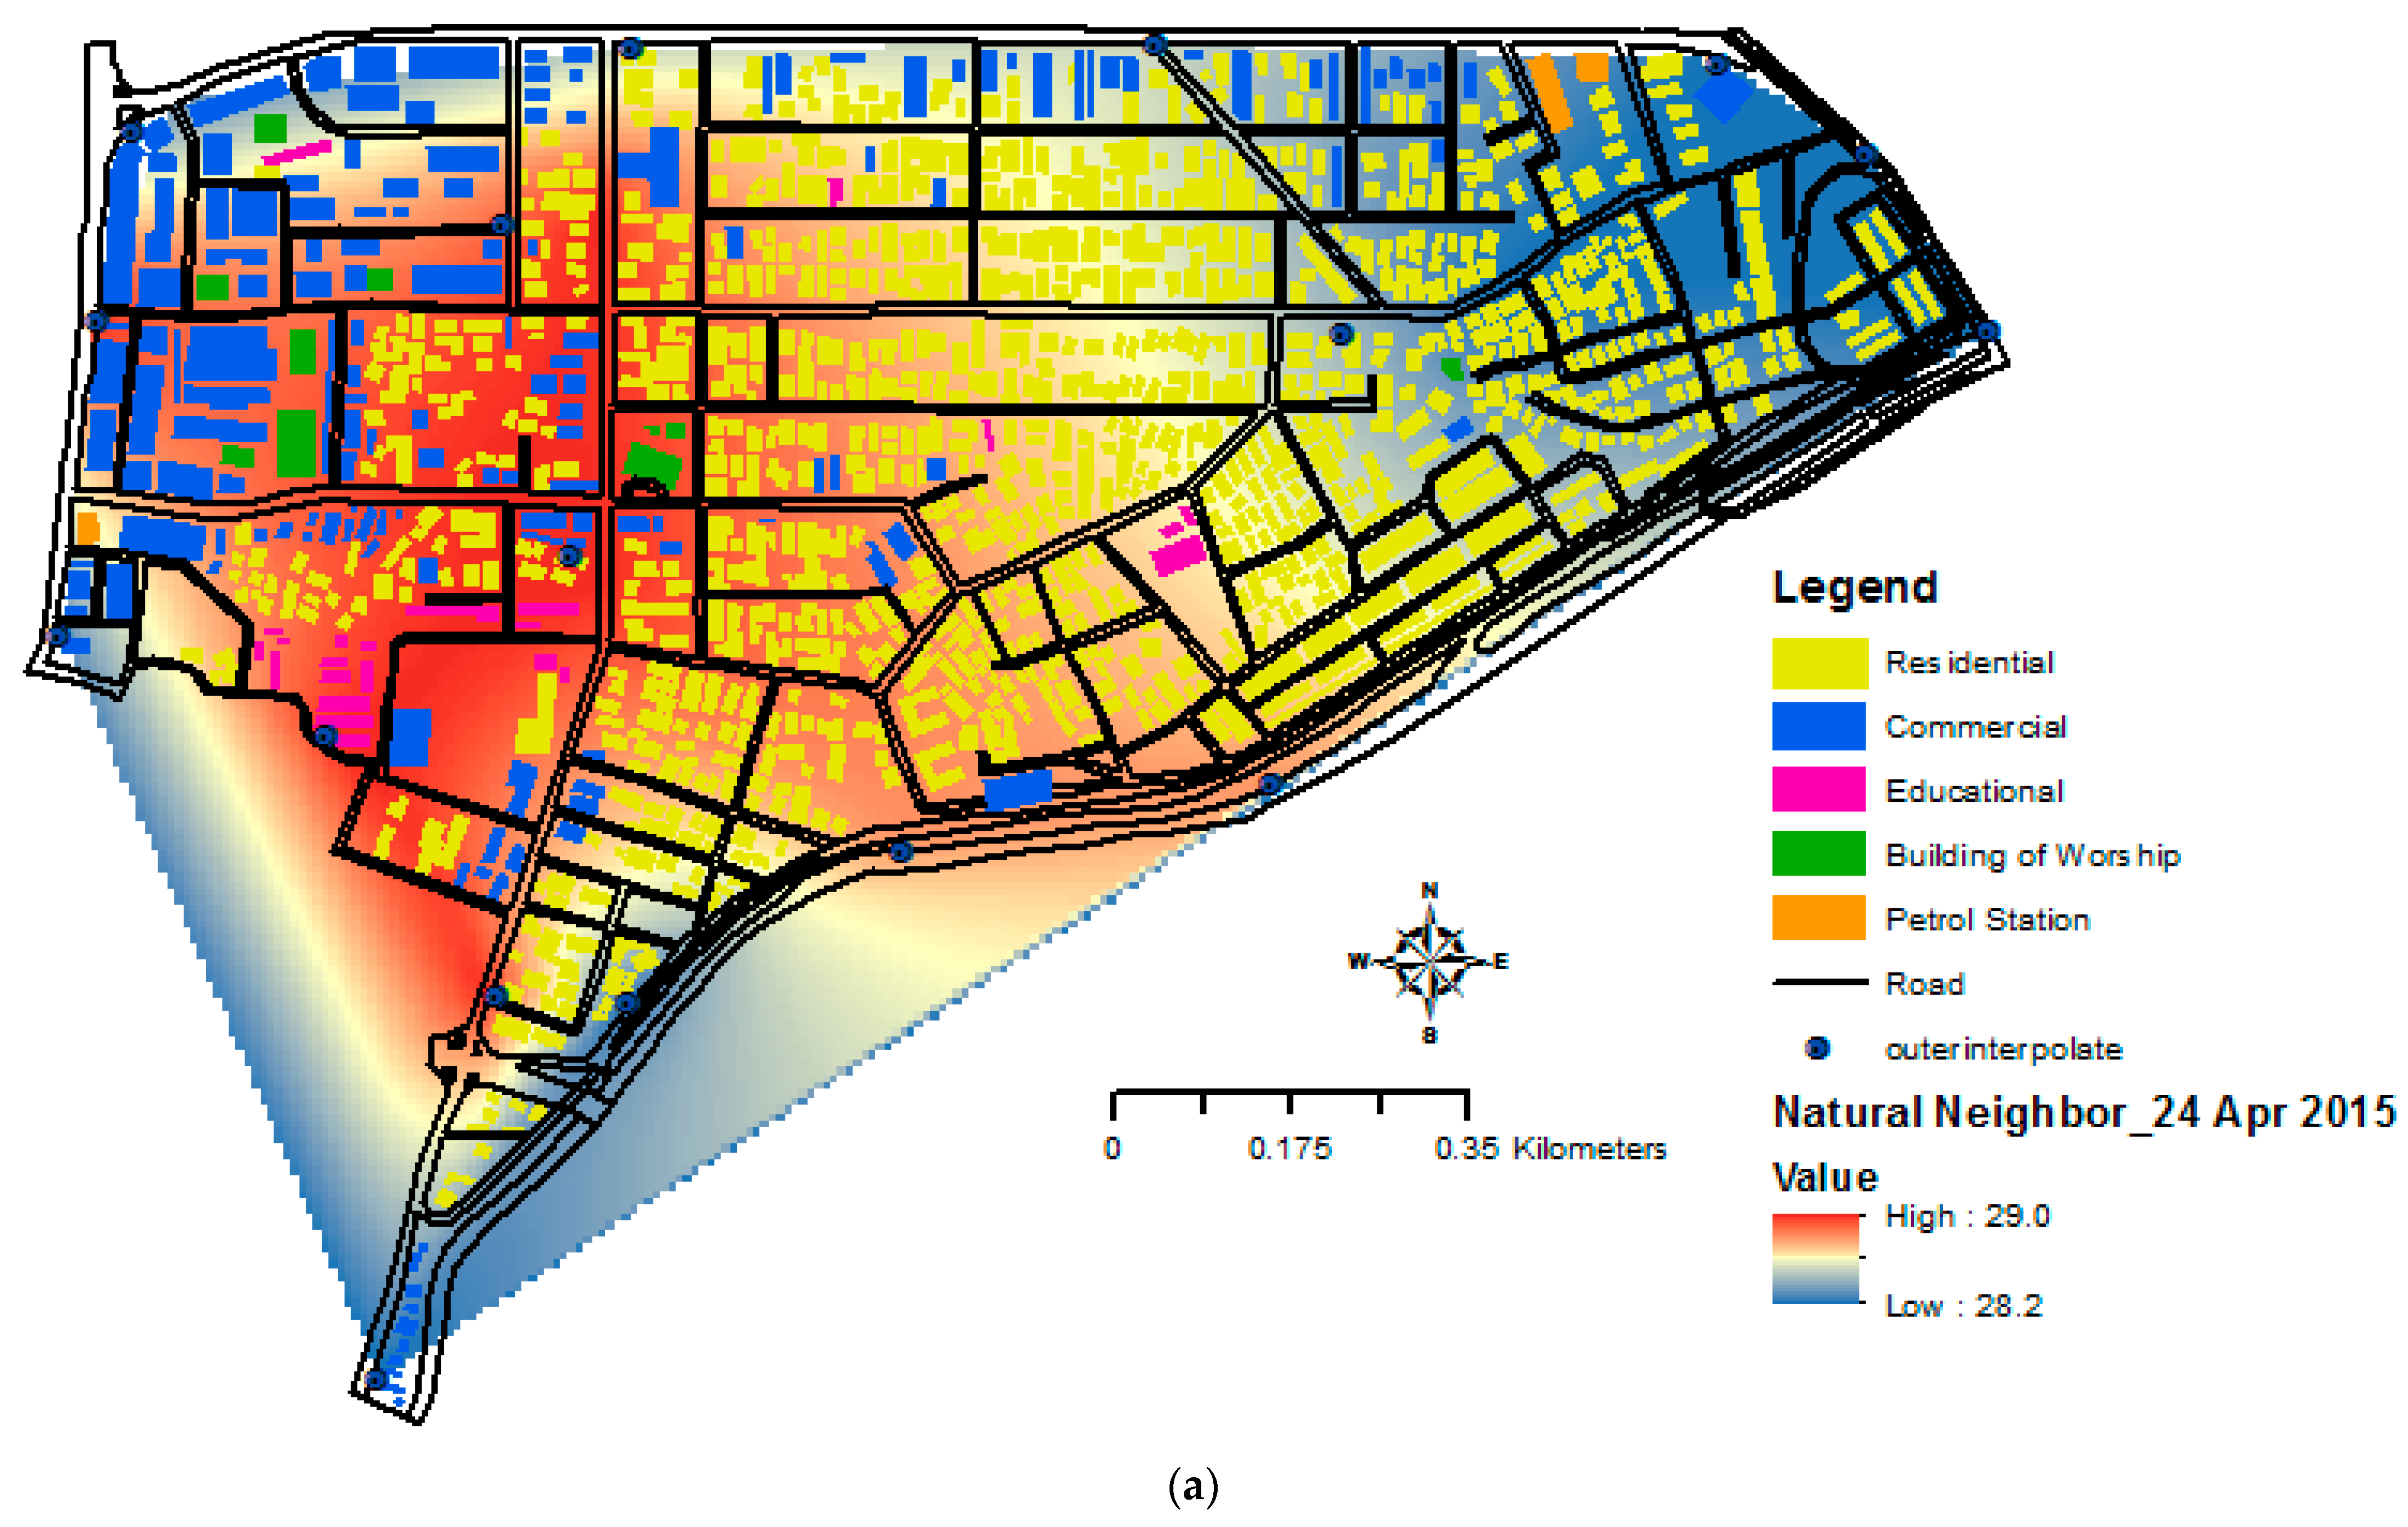
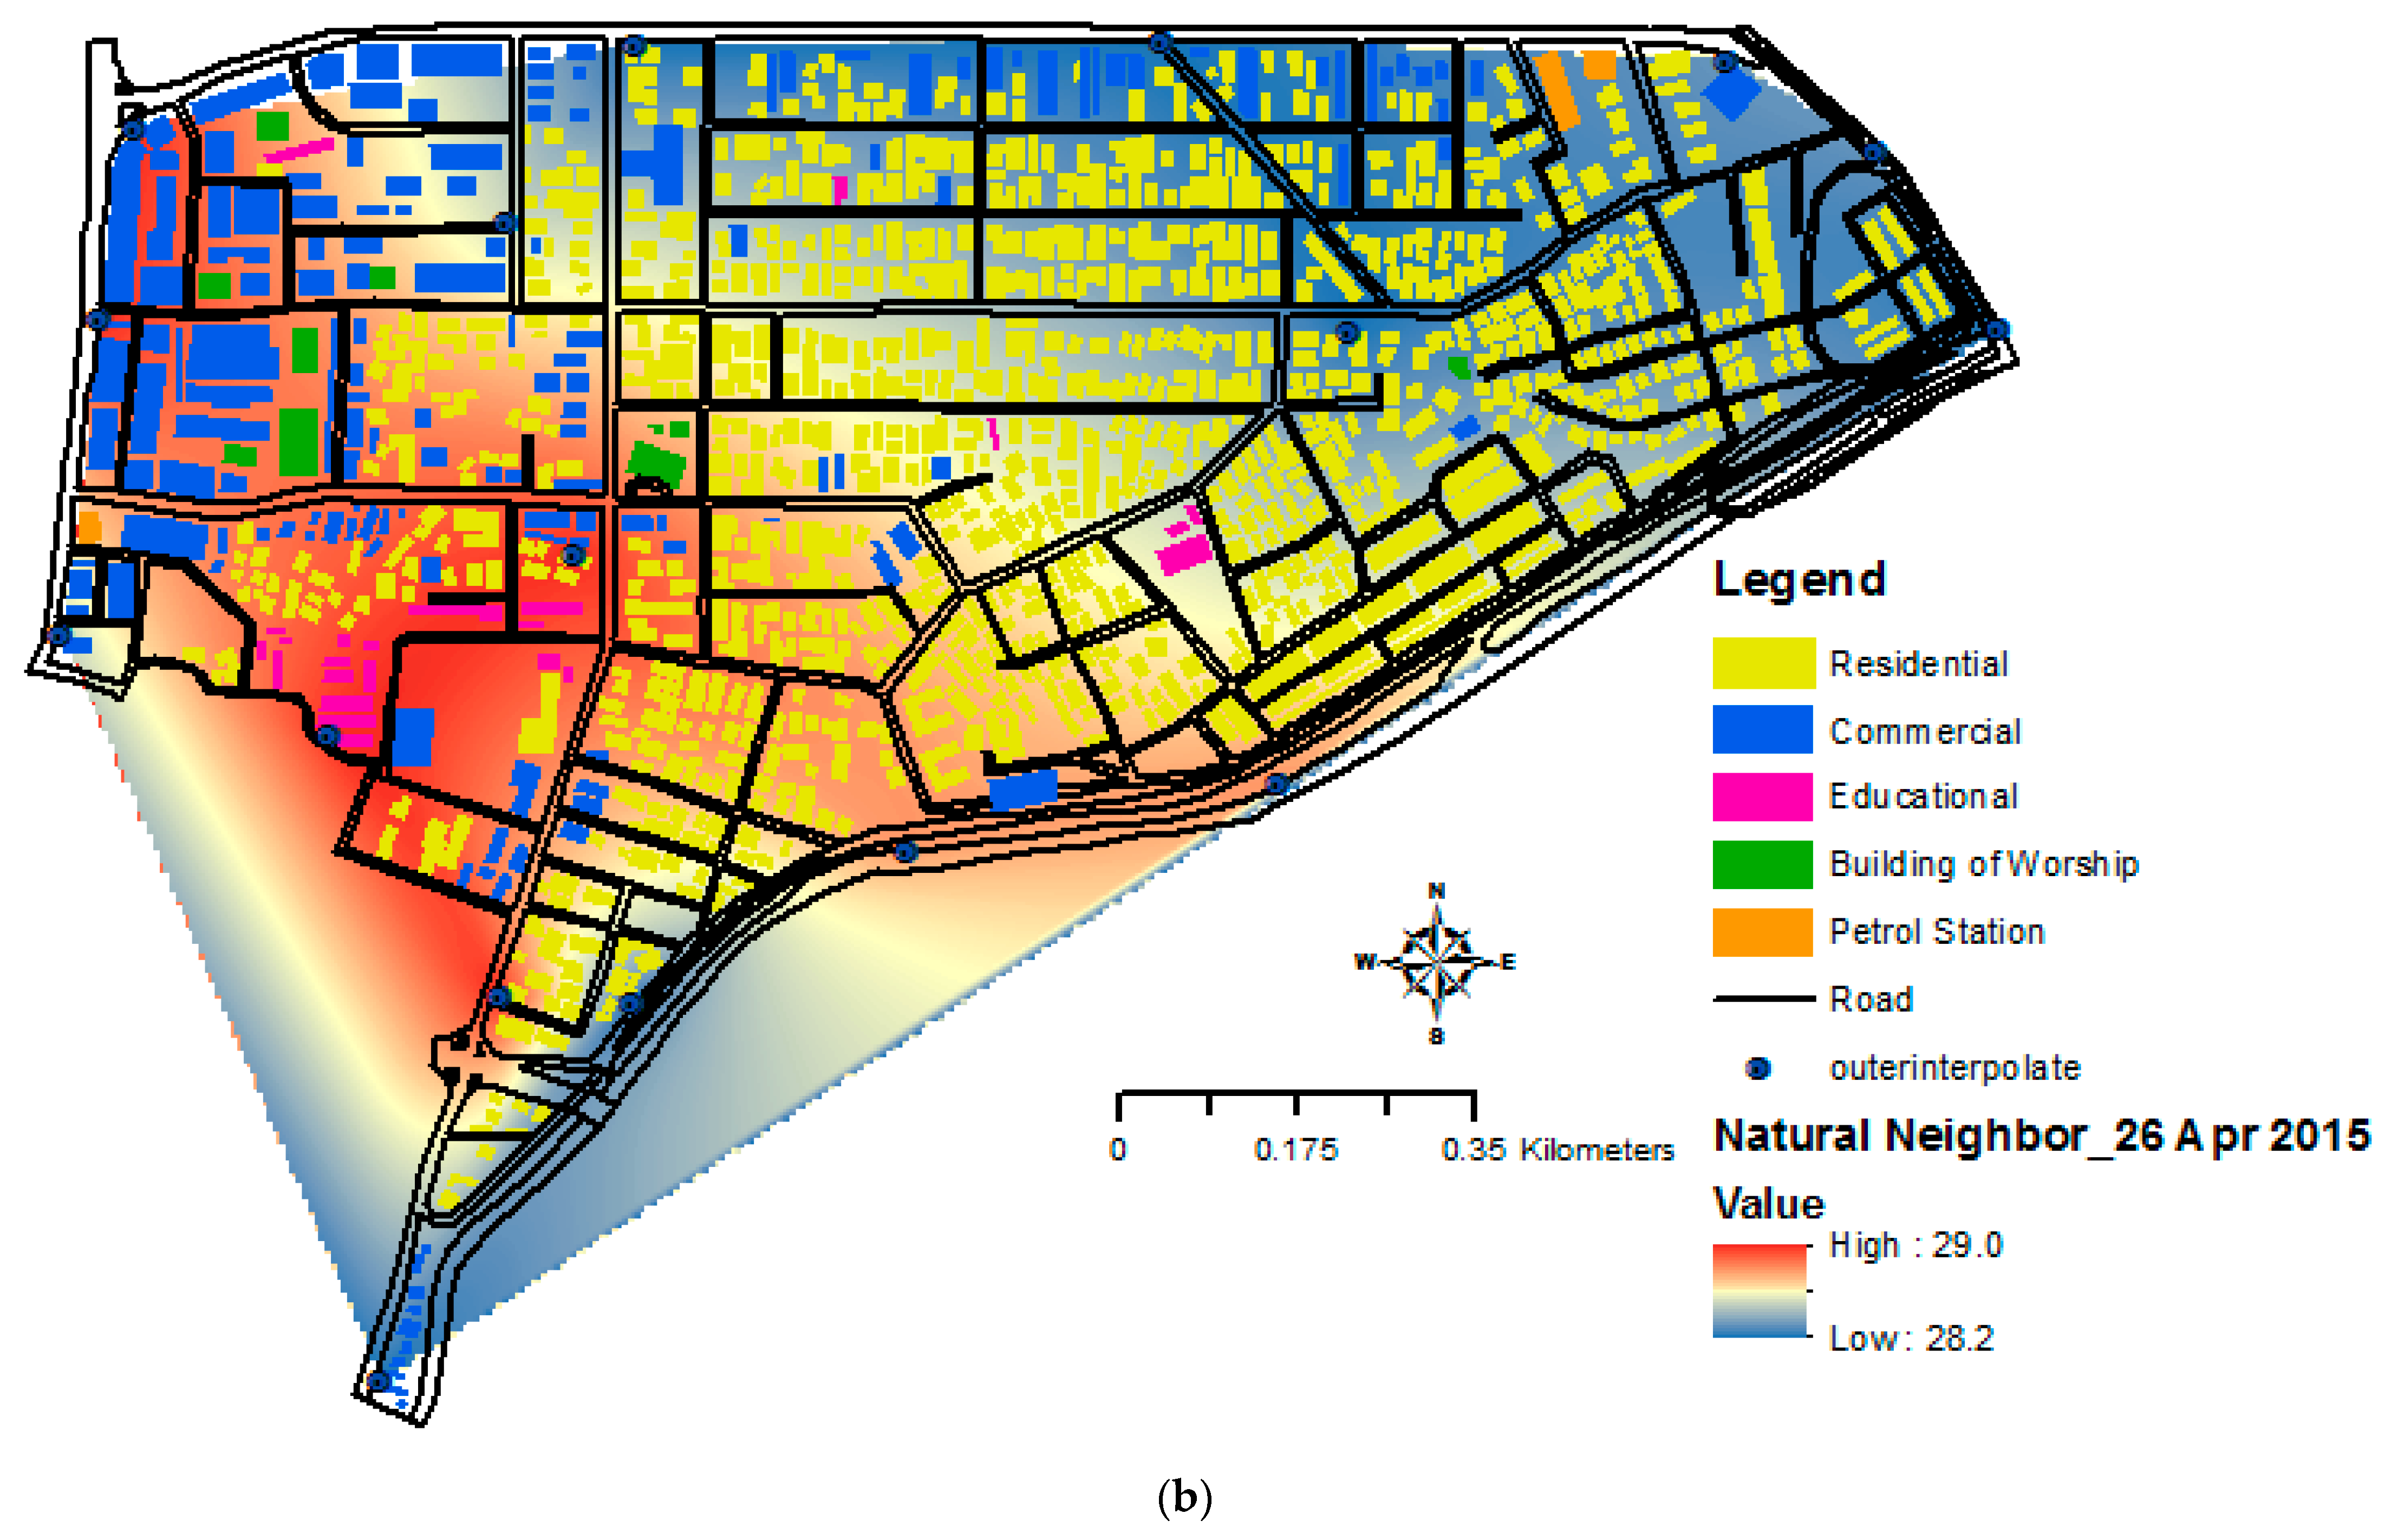
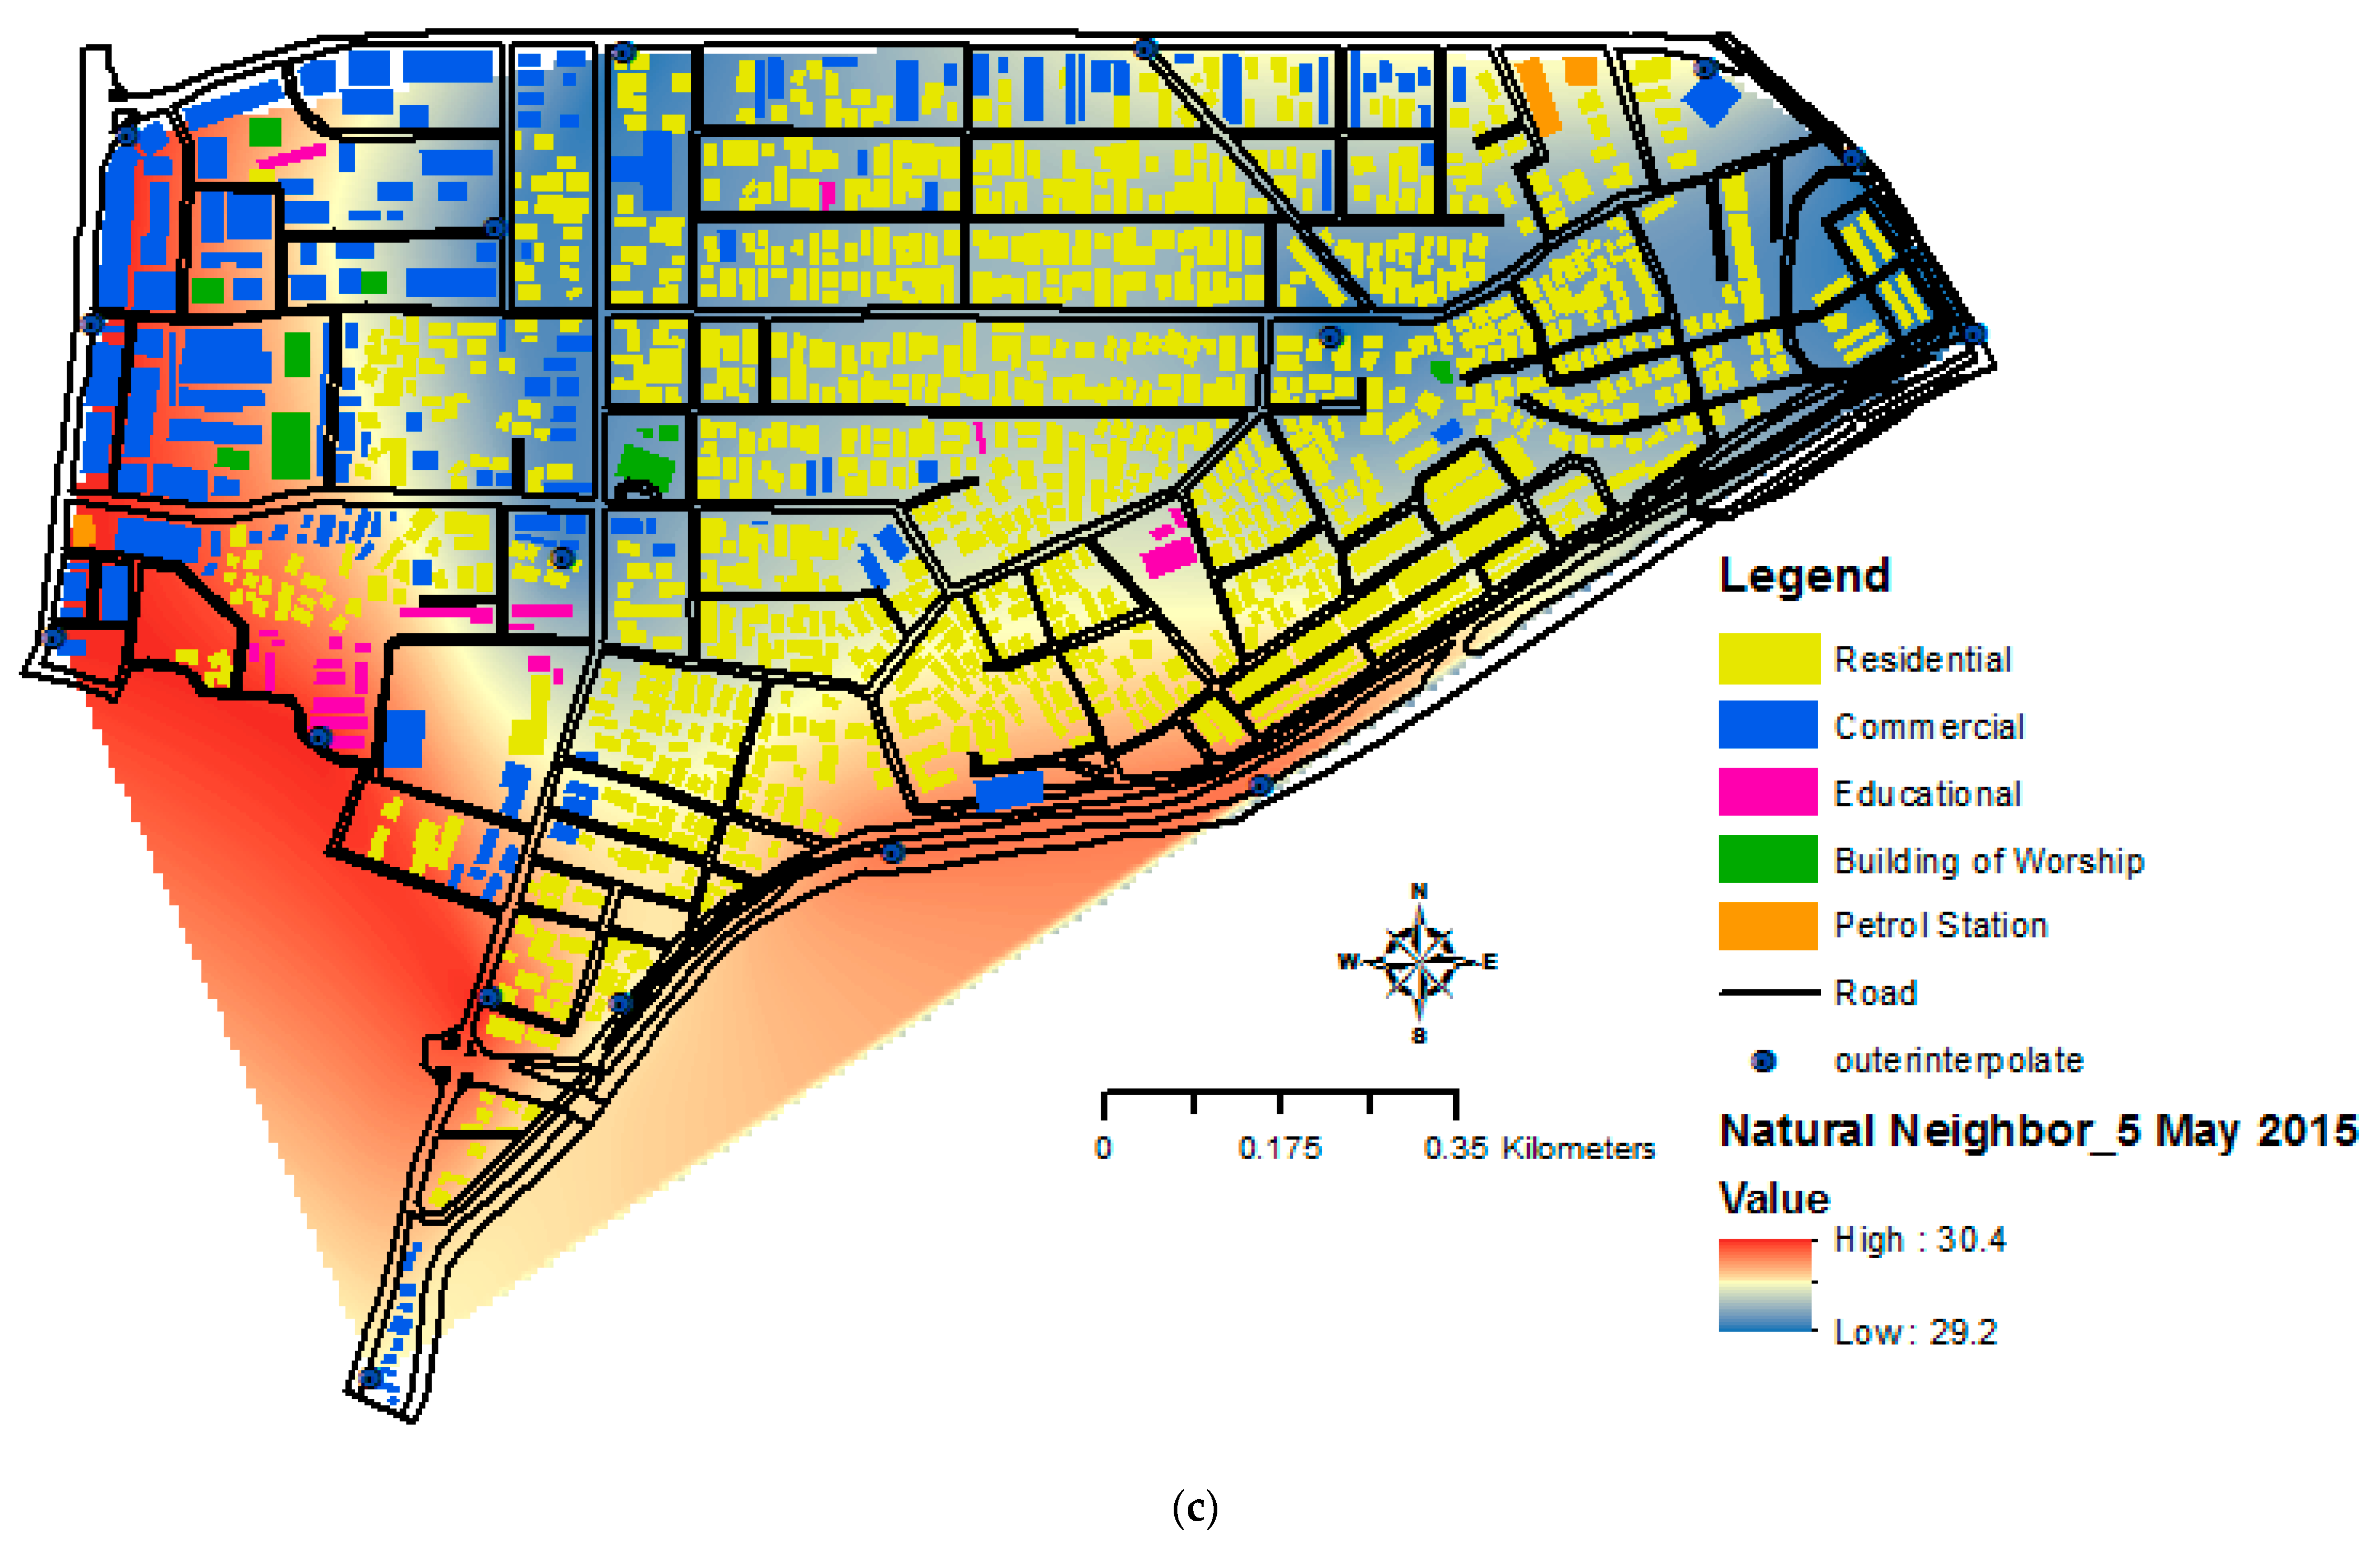
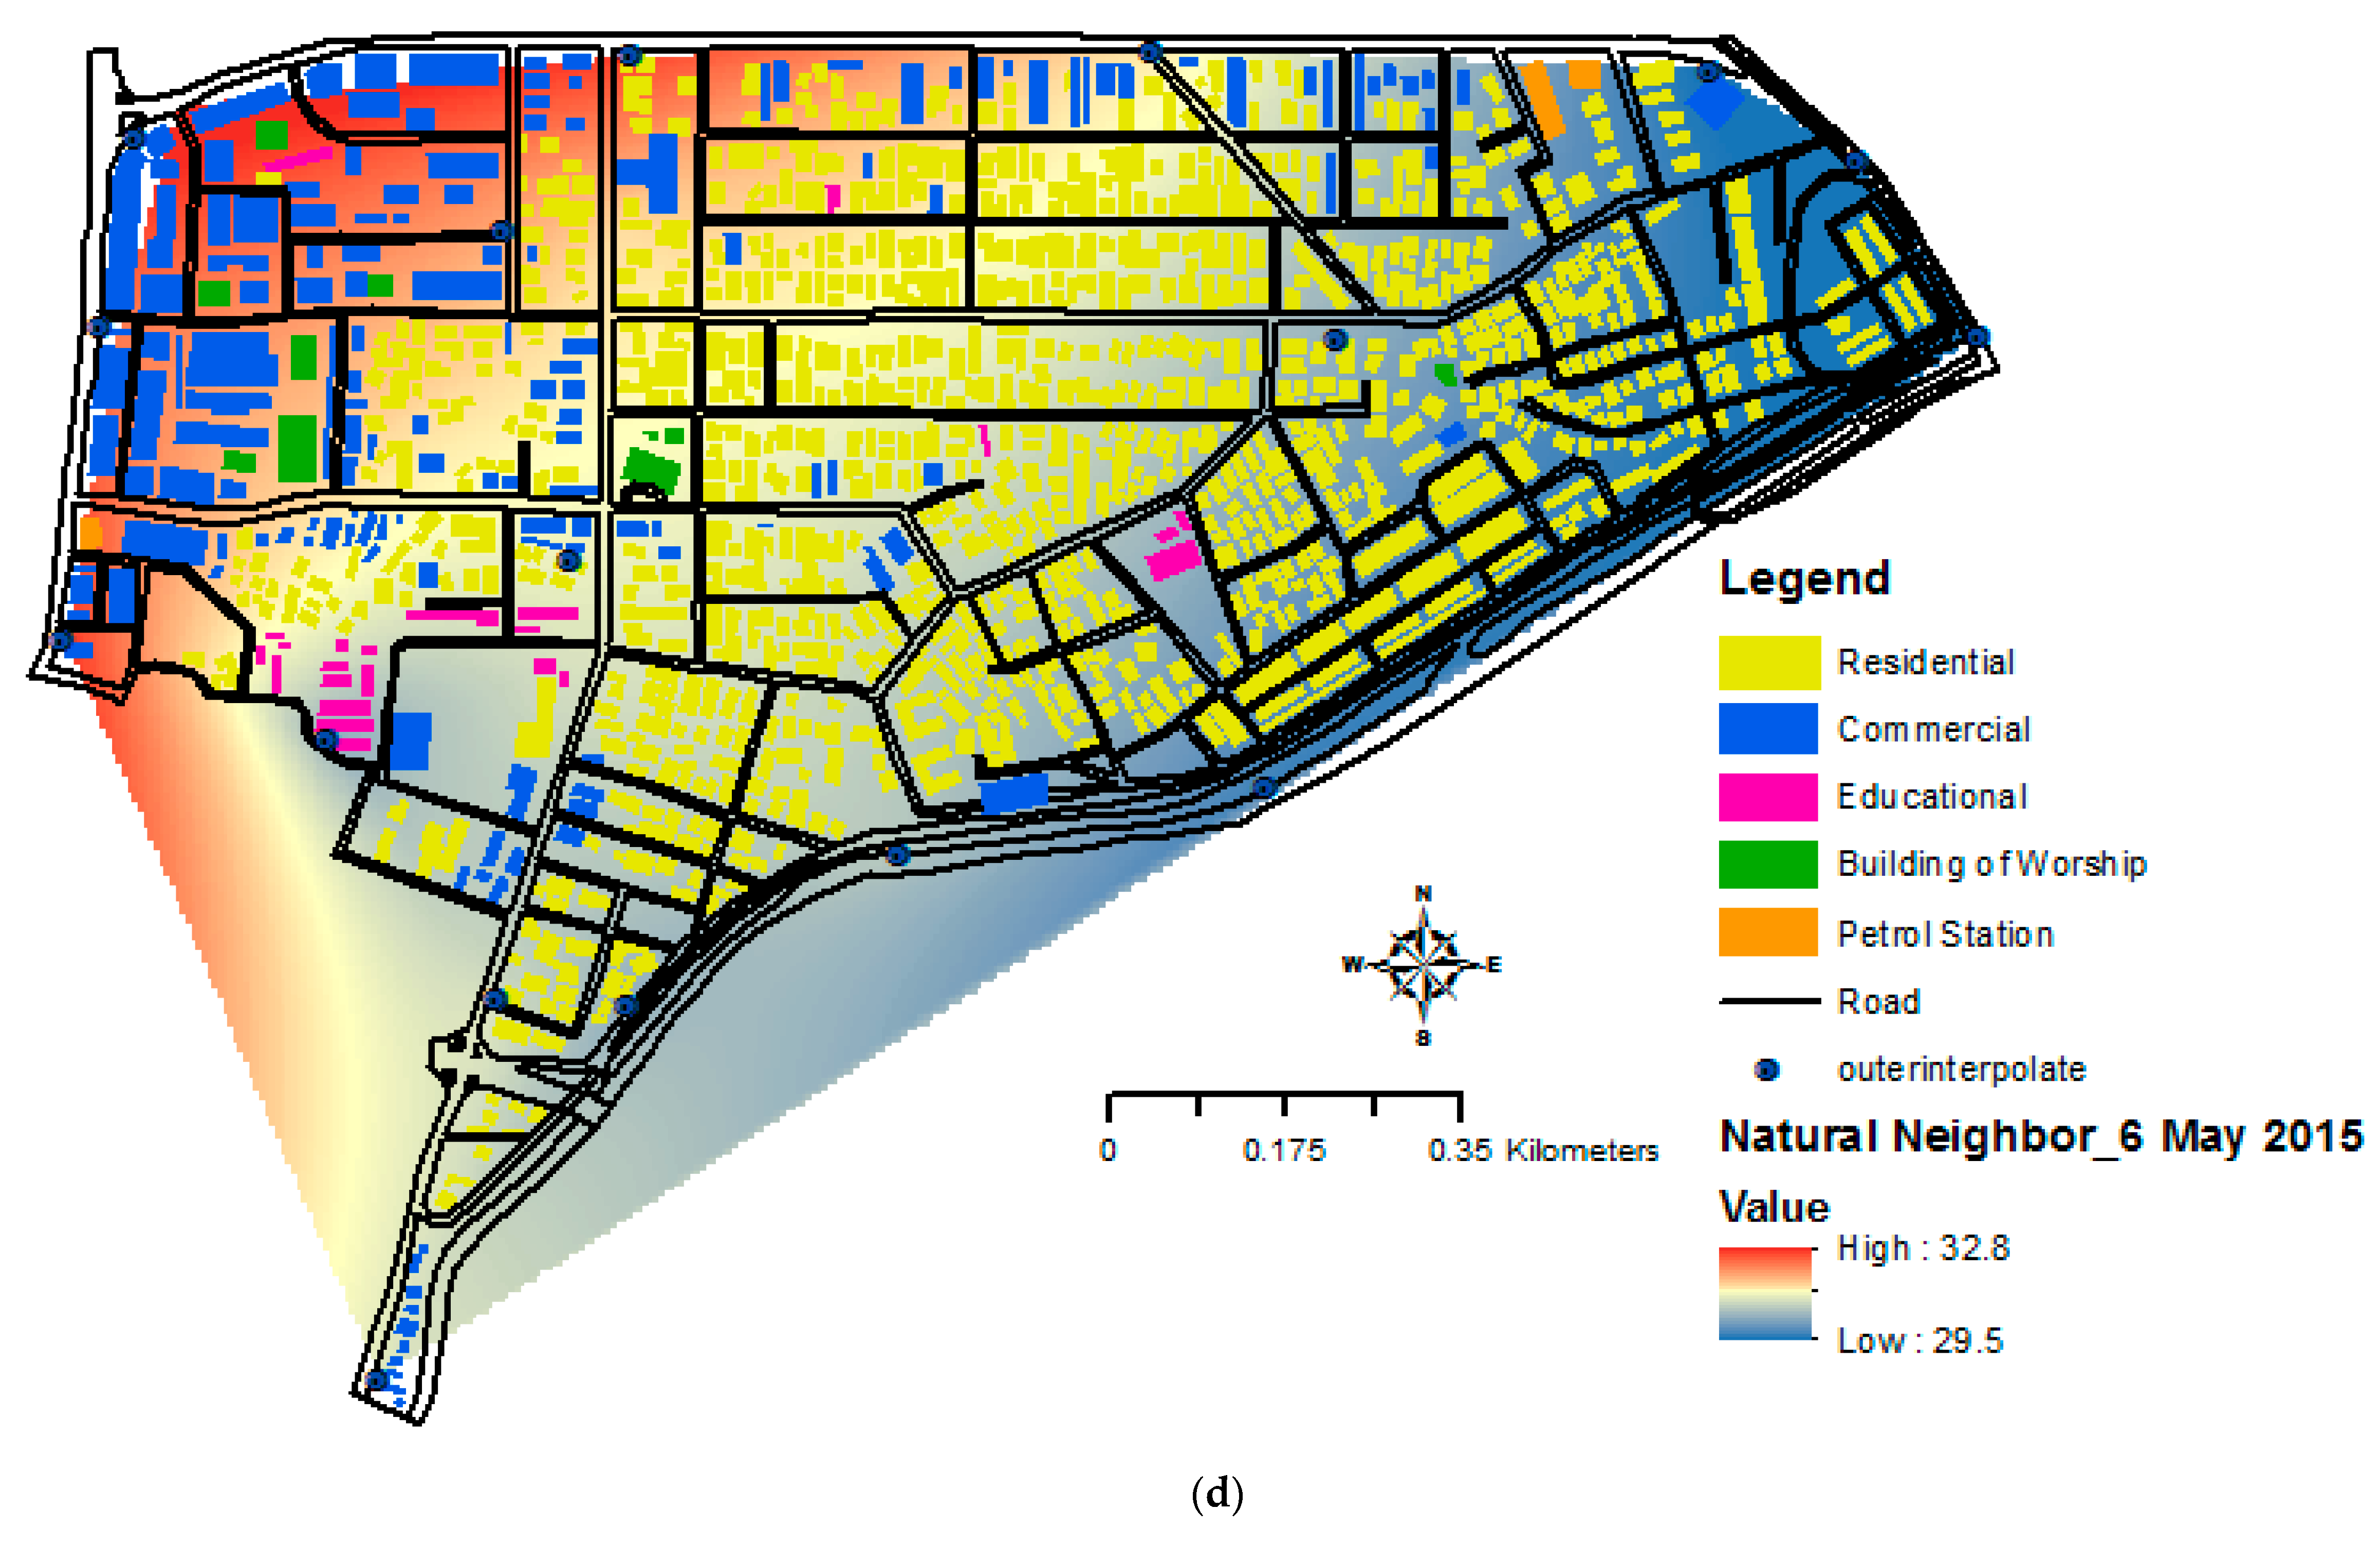
Figure 16 display the interpolation of temperature distributions in the building morphology of Kampung Baru during period of measurements.
From Figure 16a–e, it can be seen that eastern part of Kampung Baru is relatively cooler compared to the west part. This is due to the commercial area residing in the western part where social activities take place. This means that the traffic in this part is regularly congested, as it becomes the target area for many business activities. Besides, many high-rise building such as hotels and hospitals are located in the western part of Kampung Baru. At the eastern and middle part of Kampung Baru, the temperature recorded was lower compared to that of the western part. This is because those two parts are mostly made up of residential buildings where local residents run their daily activities.
In addition, the study found that the lowest temperatures were recorded at parks where the body of water and green element are located, as opposed to the downtown area which lacks the cooling elements. In the period of this study, however, higher temperatures were recorded at Kampung Baru. This shows that despite Kampung Baru being dominated by low-rise and residential buildings, the complexity of building arrangement, such as of staggered array, is one of the leading factors of UHI phenomena in this region. Other factors include direct absorption of heat by the ground, causing the ground to heat faster than other types of land covers. In contrast, other types of features that make up the urban surface such as roads, pavements, buildings, and concrete tend to release the absorbed heat slowly.
Using the GIS application, prediction of weather phenomena can be easily made. For example, in this study, the measured temperature was inserted in the ‘point’ function namely ‘interpolation’. The prediction of a future weather phenomenon can be done by changing the value of ‘interpolation’ in the ArcCatalog. By running the interpolation using the Natural Neighbor function, the analysis can be done directly and easily.

4. Conclusions

There are several concluding remarks pertaining to the current results obtained from the conducted study. Firstly, this study disclosed the urban heat island (UHI) phenomenon in Kampung Baru. The results obtained from the fixed measurement in Kampung Baru and the rural weather station in Jakoa, Gombak, showed the higher temperatures in Kampung Baru. In addition, the collected weather data from the mobile measurement also showed that Kampung Baru had the highest temperature and lower relative humidity compared to other surrounding places including the downtown area. This was primarily due to Kampung Baru being a low-rise compact residential area surrounded by high-rise buildings, and such morphological conditions increase the tendency of the area to trap warmer air during the daytime.
Secondly, the database of building morphology and urban climate was developed using Geographic Information System (GIS) using the ArcGIS software. From the database, building statistics were calculated for each land-use category and the whole study area. Furthermore, the urban climate data was plotted and overlaid in the database to assess the pattern and factors that contributed to changes in air temperature. The importance of this database is remarkable as it records the data of all buildings and urban temperature in a specified area, which is necessary for further analysis and discussion on urban planning and redesigning of the study area. In fact, the data would be crucial for further work on urban heat island mitigation strategies and can be used as a reference in the application of building morphology.
The government has proposed a plan to transform Kampung Baru into a sustainable city in 2035. One of the missions from ‘Pelan Induk Pembangunan Kampung Bharu’ is to develop green township and promote environmental care in Kampung Baru. Therefore, it is essential for the town planner, decision makers, and other parties to comprehensively study and strategize the future development of Kampung Baru. Urban planners, in particular, can utilize the spatial outdoor temperature data in their analysis and decision making associated with the sustainable development of the target area. The development process should focus on maintaining and preserving the nature of Kampung Baru. In addition, the presented findings are limited to the current configuration of this study area, thus, results pertaining to different cities may vary.

Author Contributions

Conceptualization, S.A.Z.; data curation, S.A.Z. and N.S.A.; formal analysis, S.A.Z. and N.S.A.; funding acquisition, S.A.Z., F.Y., M.Z.H., M.Y.M.D. and M.S.M.A.; investigation, S.A.Z. and N.S.A.; methodology, S.A.Z.; project administration, S.A.Z.; resources, S.A.Z.; software, S.A.Z.; supervision, S.A.Z.; validation, S.A.Z. and N.S.A.; visualization, S.A.Z. and N.S.A.; writing—original draft, S.A.Z., N.S.A. and M.F.S.; writing—review and editing, S.A.Z., M.F.S. and N.A.A.B. All authors have read and agreed to the published version of the manuscript.

Funding

This work was supported by the Ministry of Education (MOE) through the Fundamental Research Grant Scheme (FRGS/1/2019/TK07/UTM/02/5), Takasago Thermal Engineering Grant (Vot 4B424), Universiti Teknologi Malaysia (UTM) under UTMER (Vot 18J24) and UTMFR schemes (Vot 18J24).

Conflicts of Interest

The authors declare no conflict of interest. The funders had no role in the design of the study; in the collection, analyses, or interpretation of data; in the writing of the manuscript, or in the decision to publish the results.

References

  1. Oke, T.R. Boundary Layer Climates, 2nd ed.; Methuen Co.: London, UK; New York, NY, USA, 1987; p. 435. [Google Scholar]
  2. Ahmed, A.Q.; Ossen, D.R.; Jamei, E.; Manaf, N.A.; Said, I.; Ahmad, M.H. Urban surface temperature behaviour and heat island effect in a tropical planned city. Theor. Appl. Climatol. 2015, 119, 493–514. [Google Scholar] [CrossRef]
  3. Rosenzweig, C.; Solecki, W.D.; Parshall, L.; Chopping, M.; Pope, G.; Goldberg, R. Characterizing the urban heat island effect in current and future climates in urban New Jersey. Environ. Hazards 2005, 6, 51–62. [Google Scholar] [CrossRef]
  4. Hu, Y.; White, M.; Ding, W. An urban form experiment on urban heat island effect in high density area. Procedia Eng. 2016, 169, 166–174. [Google Scholar] [CrossRef]
  5. Carolis, L. The Urban Heat Island Effect in Windsor, ON: An Assessment of Vulnerability and Mitigation Strategies; City of Windsor: Windsor, ON, Canada, 2012. [Google Scholar]
  6. Lee, K.; Kim, Y.; Sung, H.C.; Jieun, R.; Seong, W.J. Trend Analysis of urban heat island intensity according to urban area change in Asian mega cities. Sustainability 2020, 12, 112. [Google Scholar] [CrossRef] [Green Version]
  7. Magee, N.; Curtis, J.; Wendler, G. The urban heat island effect at Fairbanks, Alaska. Theor. Appl. Climatol. 1999, 64, 39–47. [Google Scholar] [CrossRef]
  8. Wong, N.H.; Yu, C. Study of green areas and urban heat island in a tropical city. Habitat Int. 2005, 29, 547–558. [Google Scholar] [CrossRef]
  9. Jin, H.; Cui, P.; Wong, N.H.; Marcel Ignatius, M. Assessing the effects of urban morphology parameters on microclimate in Singapore to control the urban heat island effect. Sustainability 2018, 10, 206. [Google Scholar] [CrossRef] [Green Version]
  10. Yu, Z.; Chen, S.; Wong, N.H. Temporal variation in the impact of urban morphology on outdoor air temperature in the tropics: A campus case study. Build. Environ. 2020, 181, 107132. [Google Scholar] [CrossRef]
  11. Nieuwolt, S. The urban microclimate of Singapore. J. Trop. Geogr. 1966, 22, 30–37. [Google Scholar]
  12. Emmanuel, R. Assessment of impact of land cover changes on urban bioclimate: The case of Colombo, Sri Lanka. Archit. Sci. Rev. 2003, 46, 151–158. [Google Scholar] [CrossRef]
  13. Sham, S. Observations on the effect of a city’s form and function on temperature patterns: A case of Kuala Lumpur. J. Trop. Geogr. 1973, 36, 60–65. [Google Scholar]
  14. Elsayed, I.S. Mitigation of urban heat island of the city of Kuala Lumpur, Malaysia. Middle-East J. Sci. Res. 2012, 11, 1602–1613. [Google Scholar]
  15. Zakiah, S.M. The Influence of Urban Heat towards Pedestrian Comfort and the Potential Use of Plants and Water as Heat Ameliorator in Kuala Lumpur City Centre Area. Master’s Thesis, Universiti Putra Malaysia, Seri Kembangan, Selangor, Malaysia, November 2004. [Google Scholar]
  16. Giridharan, R.; Lau, S.S.Y.; Ganesan, S. Nocturnal heat island effect in urban residential developments of Hong Kong. Energy Build. 2005, 37, 964–971. [Google Scholar] [CrossRef]
  17. Alves Lima, E.D.; Lopes, A. The urban heat island effect and the role of vegetation to address the negative impacts of local climate changes in a small Brazilian city. Atmosphere 2017, 8, 18. [Google Scholar] [CrossRef] [Green Version]
  18. Wang, K.; Aktas, Y.D.; Stocker, J. Urban heat island modelling of a tropical city: Case of Kuala Lumpur. Geosci. Lett. 2019, 6, 4. [Google Scholar] [CrossRef]
  19. Zambri Harun, Z.; Reda, E.; Abdulrazzaq, A.; Abbas, A.A.; Yusri Yusup, Y.; Zaki, S.A. Urban heat island in the modern tropical Kuala Lumpur: Comparative weight of the different parameters. Alex. Eng. J. 2020. [Google Scholar] [CrossRef]
  20. Givoni, B. Climate Considerations in Building and Urban Design; John Wiley & Sons: Hoboken, NJ, USA, 1998. [Google Scholar]
  21. Zaki, S.A.; Othman, N.E.; Syahidah, S.W.; Yakub, F.; Muhammad-Sukki, F.; Ardila-Rey, J.A.; Shahidan, M.F.; Mohd Saudi, A.S. Effects of urban morphology on microclimate parameters in an urban university campus. Sustainability 2020, 12, 2962. [Google Scholar] [CrossRef] [Green Version]
  22. Zaki, S.A.; Syahidah, S.W.; Shahidan, M.F.; Ahmad, M.I.; Yakub, F.; Hassan, M.Z.; Md Daud, M.Y. Assessment of outdoor air temperature with different shaded area within an urban university campus in hot-humid climate. Sustainability 2020, 12, 5741. [Google Scholar] [CrossRef]
  23. Icaza, L.E.; Dobbelsteen, A.V.D.; Hoeven, F.V.D. Integrating urban heat assessment in urban plans. Sustainability 2016, 8, 320. [Google Scholar] [CrossRef] [Green Version]
  24. Zhou, D.; Xiao, J.; Bonafoni, S.; Berger, C.; Deilami, K.; Zhou, Y.; Frolking, S.; Yao, R.; Qiao, Z.; Sobrino, J.A. Satellite remote sensing of surface urban heat islands: Progress, challenges, and perspectives. Remote Sens. 2019, 11, 48. [Google Scholar] [CrossRef] [Green Version]
  25. Sobrino, J.A.; Irakulis, I. A methodology for comparing the surface urban heat island in selected urban agglomerations around the world from Sentinel-3 SLSTR Data. Sustainability 2020, 12, 2052. [Google Scholar] [CrossRef]
  26. Yassin, K.A.M. Kampung Baru: Organizational Study of an Urban Malay Settlement. Ph.D. Thesis, International Islamic University Malaysia, Jalan Gombak, Selangor, Malaysia, 2009. [Google Scholar]
  27. Di Sabatino, S.; Leo, L.S.; Cataldo, R.; Ratti, C.; Britter, R.E. Construction of digital elevation models for a southern European city and a comparative morphological analysis with respect to Northern European and North American cities. J. Appl. Meteorol. Climatol. 2010, 49, 1377–1396. [Google Scholar] [CrossRef]
  28. Taket, N.D.; Howarth, S.M.; Burge, R.E. A model for the imaging of urban areas by synthetic aperture radar. IEEE Trans. Geosci. Remote Sens. 1991, 29, 432–443. [Google Scholar] [CrossRef]
  29. Burian, S.J.; Brown, M.J.; Linger, S.P. Morphological Analyses Using 3D Building Databases: Los Angeles, California; Rep. LA-UR-02; Los Alamos National Laboratory: Los Angeles, CA, USA, 2002; p. 781. [Google Scholar]
Figure 1. Study area at Kampung Baru, Kuala Lumpur (Google Maps, 2018).
Sustainability 12 07301 g001
Figure 2. Schematic diagram of building height measurement performed using TruPulse 200L. Letters (a and b) refer to the segmented distances measured based on the slope angles, θ1 and θ2, to obtain the height of building, H while c, d, and e represent the measured slope distance.
Sustainability 12 07301 g002
Figure 3. Campbell Scientific weather station: (a) Campbell Scientific CR1000 data logger installed at MJIIT rooftop, (b) CR1000 data loggers and (c) Apogee SP100 pyranometer.
Sustainability 12 07301 g003
Figure 4. Mobile data collection: (a) Set-up of Hobo pro-V2 data logger with a solar radiation shield, (b) fixed station (as a control during survey) installed at SRA Raja Muda Musa, Kampung Baru. The sensors are marked in red rectangles and (c) Location of the fixed station and survey routes during the data collection at the study area.
Sustainability 12 07301 g004
Figure 5. Route of the mobile measurement (red line) which covered the study area of Kampung Baru and 500 m in the vicinity (Source: Google Wikimapia, 2017).
Sustainability 12 07301 g005
Figure 6. Land-use categories along the mobile survey route (Source: Google Wikimapia, 2017).
Sustainability 12 07301 g006
Figure 7. 2D view of Kampung Baru. Buildings are color-coded based on land-use classification.
Sustainability 12 07301 g007
Figure 8. 3D view of Kampung Baru. Buildings are color-coded based on land-use classification.
Sustainability 12 07301 g008
Figure 9. General work flow of the GIS database development.
Sustainability 12 07301 g009
Figure 10. Workflow of analyzing the temperature distribution using Natural Neighbor.
Sustainability 12 07301 g010
Figure 11. Example of the temperature distribution in Kampung Baru.
Sustainability 12 07301 g011
Figure 12. Daily average temperature distributions from the MJIIT-CS weather station and three selected Malaysia Meteorological Department (MMD) weather stations for eight months of observation.
Sustainability 12 07301 g012
Figure 13. Temperature distributions based on mobile measurement at different land-use categories.
Sustainability 12 07301 g013
Figure 14. Temperature distributions obtained from fixed measurement at the study area of Kampung Baru (urban area) and Jakoa, Gombak (rural area) on (a) 14 October 2015, (b) 15 October 2015, (c) 16 October 2015, (d) 17 October 2015, (e) 18 October 2015, and (f) 19 October 2015.
Sustainability 12 07301 g014aSustainability 12 07301 g014bSustainability 12 07301 g014c
Figure 15. Comparison of temperature distributions obtained from fixed measurement for six days.
Sustainability 12 07301 g015
Figure 16. Interpolation of temperature distributions in the building morphology of Kampung Baru on (a) 24 April 2015, (b) 26 April 2015, (c) 5 May 2015, (d) 6 May 2015, and (e) 8 May 2015.
Sustainability 12 07301 g016aSustainability 12 07301 g016bSustainability 12 07301 g016cSustainability 12 07301 g016dSustainability 12 07301 g016e
Table 1. Instrument specifications and settings of the MJIIT-CS weather station.
Data LoggerModelClimatic VariablesAccuracyT.I.H.A.G.
(m)
Period
Campbell Scientific CR1000CSL 215-L Temp/RH ProbeAir Temp.±0.3 °C10.0 min~68.0March 2014–February 2015
Relative Humidity±4.0%
SP 110-L
Apogee Silicon Pyranometer
Solar Radiation±5.0% for daily total radiation
Note: T.I. = time interval and H.A.G. = height above ground.
Table 2. Hobo pro-V2 data logger specifications.
Instruments ModelClimatic VariablesMeasurement RangeInstruments AccuracyResponse Time in Airflow of 1 m/s
Hobo pro-V2 data loggerAir temperature−40° to 70 °C
(−40° to 158 °F)
±0.21 °C from 0° to 50 °C
(±0.38 °F from 32° to 122 °F)
5 min in air moving at 1 m/s
Relative humidity0% to 95% RH±2.5% from 10% to 90% RH (typical), to a maximum of ±3.5%5 min in air moving at 1 m/s with protective cap
Table 3. Different types of land-use categories for urban climate data collection using mobile measurement.
No.ElementLocation PictureLocation
1.Water/pond Sustainability 12 07301 i001Titiwangsa Lake Gardens
2.Park Sustainability 12 07301 i002Titiwangsa Lake Gardens
3.Highway Sustainability 12 07301 i003Along Jalan Tun Razak
4.Urban Residential Sustainability 12 07301 i004Kampung Baru
5.Downtown Sustainability 12 07301 i005Kuala Lumpur City Center
6.Mountain/rural Sustainability 12 07301 i006Bukit Nenas Reserve Forest
Table 4. Details of the mobile measurement.
ItemDescription
Date24–26 April 2015, 4–8 May 2015
TimeNight time (20:30–22:30)
VehicleMotorcycle
Speed of vehicle20–30 km/h
InstrumentsHobo temperature/RH mini data logger with radiation shield
Intervals1 s
Instrument’s height1.4 m
Table 5. Urban land-use classification schemes in MS1759:2005 (Geographic Information/Geomatics—Feature and Attribute Codes).
CodeCategory
AAeronautical
BBuilt Environment
DDemarcation
GGeology
HHydrography
SSoil
TTransportation
UUtility
VVegetation
XSpecial Use (Dataset-specific)
ZGeneral
Table 6. Minimum and maximum values of UHII (urban heat island intensity) at Kampung Baru.
DateMinimumMaximum
14 October 2015−0.74.4
15 October 20150.04.4
16 October 2015−2.34.2
17 October 2015−1.83.2
18 October 2015−0.84.5
19 October 20150.36.0