Abstract
Evacuation shelters are the most important means for safeguarding people in hazardous areas and situations, and thus minimizing losses, particularly those due to a disaster. Therefore, evacuation shelter assignment and evacuation planning are some of the critical factors for reducing vulnerability and increasing resilience in disaster risk reduction. However, an imbalance of shelter distribution and spatial heterogeneity of a population are the critical issues limiting the accessibility of evacuation shelters in real situations. In this study, we propose a methodology for spatial assessment to reduce vulnerability and evaluate the spatial distribution of both shelter demand and resources, considering spatial accessibility. The method was applied to the case study of Mabi, in the context of a disaster caused by the 2018 flooding. We applied this approach to evaluate the area and identified the vulnerability of the evacuation shelters and the residents. The proposed method revealed that 54.55% of the designated evacuation shelters and 59% of the total population were physically vulnerable to the flood. The results highlight, using GIS maps, that the total shelter capacity was significantly decreased to 43.86%. The outcome assessment addressed specific vulnerable shelters and the imbalance between the demand for and resources of each shelter. Accordingly, this study provides practical information and a valuable reference for supporting local governments and stakeholders to improve future disaster planning, prevention, and preparedness.
1. Introduction
Globally, disasters are forecasted to occur more frequently and to be more severe in the near future, due to climate change, increasingly unplanned urbanization, and the rising concentration of people and assets in hazardous areas [1,2]. Over the past decade, extreme climate events have caused an enormous number of fatalities and a significant amount of economic damage. At least 15,490 natural disasters have been reported, since 1990, in the Emergency Management Database (EMDAT-CRED). These disasters, taken together, have caused more than 32.6 million deaths, affected over eight billion people, and caused a total damage of at least USD 3.5 trillion, worldwide [3]. To address these severe issues, in 2015, three global policy frameworks, i.e., the Sendai Framework for Disaster Risk Reduction (DRR), the Sustainable Development Goals (SDGs), and the Paris Agreement on Climate Change, were established by the United Nations. Among these three frameworks, vulnerability reduction is one of the most significant approaches for achieving the goal of preventing the creation of new disaster risks [4].
However, vulnerability is a challenging concept to understand and varies among people in diverse circumstances. It is often considered to be related to predispositions, susceptibilities, fragilities, weaknesses, deficiencies, or a lack of capacities [5,6]. Various disciplines have come to define vulnerability from their own point of view. The concept of vulnerability has been elaborated in social, economic, environmental, and geographic disciplines, and therefore the literature contains several different vulnerability definitions, as well as various methodological approaches for its assessment. According to Birkmann [6], more than 25 different definitions, concepts, and methods relating to vulnerability can be found in previous studies. Although there is no universal definition of vulnerability, regarding the literature and previous studies, the concept of vulnerability has been considered from two main perspectives, that is, in terms of its physical and social dimensions. On the one hand, the physical dimension includes the aspects of geography, location, place, settlement patterns, and physical structures. On the other hand, the social dimension characterizes the inequalities that define the predisposition or susceptibility of social groups in the context of a disaster (e.g., age, gender, and disability). In line with the framework of the United Nations, in this study, vulnerability is defined as the conditions determined by physical, social, economic, and environmental factors or processes that increase the susceptibility of an individual, community, assets, or systems to the impacts of hazards.
Evacuation shelter assignment and evacuation planning are significant components of vulnerability associated with reducing and building resilience to disasters [7,8,9]. When a disaster occurs, evacuation shelters are the most significant means for safeguarding people from hazardous areas and situations. Therefore, they are the key factors for minimizing losses due to calamities. Evacuation shelters not only provide immediate and temporary accommodation for victims of a disaster; they also support those residents in their recovery from the associated trauma and provide them with a base to start the process of coping with and adapting to stresses caused by the situation [10,11]. Moreover, the survival of affected victims depends profoundly on the availability and accessibility of evacuation shelters [12]. However, the challenge of providing and arranging suitable shelters in times of emergencies has become an important part of both government emergency management and scientific disaster research.
Evacuation is commonly acknowledged to be an action that is often required to increase the efficacy of disaster response operations and minimize possible loss of life and risk of physical harm due to disasters. However, evacuations can differ in terms of the scale, objects of relocation, and level of control by authorities. Depending on the disaster type and level of pre-warning in the disaster area, an evacuation can be mandatory, recommended, or optional as a means of moving people away from hazardous zones. Furthermore, since evacuations are specifically concerned with moving people out of hazardous areas, the location of the evacuation shelter and the distance to the evacuation shelter can vary based on how long the threat to human life remains within a particular area.
Therefore, the most important topics for studies on evacuation shelter planning and emergency management include determining the location of evacuation shelters and the allocation of people. Shelters are normally offered and prepared to provide secure places for people who have left or lost their usual accommodation due to an emergency situation or disaster. Previous studies have proposed guidelines for emergency shelters, frequently emphasizing their structural suitability, construction specifications, and function [13,14,15]. However, several studies have revealed that considering site suitability based on physical location is also required in shelter planning and assessment [16,17]. Kar et al. investigated existing shelters in Florida using a geographic information system (GIS) and suggested suitable candidate shelters based on the geographical area outside of the hazardous zone.
Moreover, regarding shelter allocation issues, shelter capacity has also been debated in the literature, in relation to determining and estimating shelter ability through an evacuation simulation, for example, whether or not the availability of shelters could provide enough accommodation to all evacuees in the case of earthquakes in Japan [18,19] and hurricanes in the USA [20,21]. To estimate capacity shortage, the ratio between the amount of demand and the available capacity of designated shelters have commonly been included in the aforementioned studies. However, so far, discussions on demand for shelter capacity have not fit the actual situation due to limited data analysis that capture this in reality [19]. Numerous studies have assumed that 25% of residents would evacuate to emergency shelters; therefore, they have treated it as an input datum using a simple formula (e.g., 25% × the residential population) and estimated the number of people and evaluated the deficiency in terms of shelter capacity [20,21,22]. However, in reality, the evacuation of residents to an emergency shelter is impacted by several factors.
Spatial distribution is one of the significant issues that requires further discussion in relation to the estimation of demand for and the limited supply of emergency shelters. Considering a population in different scenarios, particularly when a disaster occurs, can aid in the estimation of the affected population in terms of evacuation planning and response. Previous studies and proposed models have considered spatial population distribution through urban and community analyses, using GIS, to analyze emergency shelter demand [23,24,25]. Although most research has placed more emphasis on the spatial distribution of a population, only limited research has taken the spatial distribution of existing emergency shelters into consideration [26]. However, both factors of distribution are critical issues. They influence the availability of shelters, and also the accessibility of shelters to a population. An imbalance between the spatial distribution of people and shelters could lead to and become a vulnerability that must be assessed in disaster and evacuation planning.
Furthermore, additional aspects that notably influence the accessibility of emergency shelters are the evacuation route conditions and distance. These are important factors influencing a decision to evacuate and the selection of an evacuation destination for people [27]. Routes inundated by floods or covered by collapsed buildings due to an earthquake decrease the efficiency of an evacuation and impact the travel cost for evacuees. Moreover, traveling along an evacuation route to reach an emergency shelter is considered to be a challenging task, especially for individuals who belong to a vulnerable population group, for example, the elderly [28,29,30]. Previous studies have also investigated the relationship between gender-specific variations in terms of socioeconomic status and evacuation, revealing that women were more likely to evacuate than men [31,32].
To estimate the accessibility of facilities, according to previous literature, there are two common methods for measuring approachability, i.e., a distance-based function such as Euclidean distance or network distance, and a time-based function. According to these methods, several models and optimizations have been developed to deliver the best all-purpose evacuation route by minimizing the total evacuation distance and potential devastating damages caused by a disaster [7,24,33,34]. Ye et al. proposed a mathematical formulation to minimize distance by assuming that shelters become available at different periods [24]. Another mathematic approach was proposed by Zhao et al. which considered the different degrees of house damage to identify the optimal locations for evacuation shelters [7]. However, most simulation models have usually been developed on the basis of different demand circumstances and criteria among the various available candidates. Such methods limit administrators with respect to applying valuable unknown criteria in reality. In addition, most methods have concentrated more on developing a new algorithm to simulate evacuation procedures, rather than considering the feasibility of evacuating residents efficiently in practice. Consequently, several studies have revealed that it is not yet clear how the accessibility of disaster sheltering should be evaluated in practice [10,35].
In this study, we propose a novel methodology for the evaluation of accessibility, integrating the spatial distribution of both a population and the evacuation shelters for assessing and reducing the vulnerability of disaster shelter planning. The objectives of the study are as follows: First, to investigate and evaluate the spatial distributions in the case study area and estimate the deficiency of an evacuation shelter based on the spatial evacuation demand; second, to analyze the spatial accessibility of the evacuation shelters based on the evacuation route conditions and distance, by comparing the real road network of the normal situation with the real disaster situation; and last, to identify the vulnerability of existing evacuation shelters and populations in terms of disaster risk reduction. As a systematic approach for analysis of spatial availability, integrating all aspects of spatial distribution and spatial accessibility, including distance, and evaluating the physical and social vulnerabilities, the proposed methodology is described in Section 2. In Section 3, we demonstrate the evidentiary foundation through a case study using GIS technology. A discussion based on the algorithm, suggestions for future studies, and the summary are presented in Section 4. The overall target of this study is to support decision makers by providing a useful reference for developing policies and strategies to reduce disaster vulnerability.
2. Methodology and Materials
2.1. Methodology
According to the current literature, effective shelter assignment and proficient evacuation planning require an understanding of the suitability of the shelter location and the distribution between the shelter and the population. GIS technology is a significant tool that supports researchers for understanding critical information and visualizing through mapping. However, to analyze and assess the vulnerability of disaster shelter planning, the accessibility of a shelter based on an imbalance in the distribution of the shelter demand and resources is a critical issue that requires further discussion.
Our assumption is that vulnerability during a disaster is caused by the spatial heterogeneity of the imbalance between demand and capacity resources, which could be concealed in summarized statistics and due to limited accessibility. To examine this hypothesis, we structured the method as follows (Figure 1): (1) analysis of the spatial distribution of shelter planning resources and population to assess the spatial availability of shelters; (2) estimation of the accessibility based on the spatial availability and distribution; (3) estimation of the shelter demand to assess the shelter deficiency based on the spatial accessibility of the normal situation as compared with the disaster situation; and (4) analysis of the vulnerability of the evacuation shelters in terms of vulnerability reduction in disaster preparedness and management. We describe the details of the methodology in the following sections.
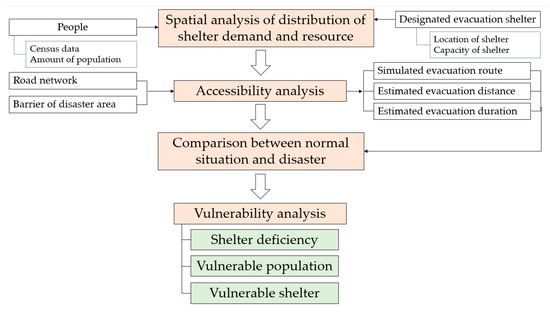
Figure 1.
Flowchart of the methodology.
2.1.1. Spatial Distribution of the Shelter Demand and Resources
Understanding the size, density, and spatial distribution of both a population and designated or existing evacuation shelters is essential to disaster preparation planning and resource allocation. Census data are generally used with specific geographic coverage areas based on units of the census tract scale, such as country-, region-, or municipal-scale units. According to the administrative units, they have a low spatial resolution and do not reflect the dynamic distribution in a practical situation. In addition, the actual population density can fluctuate significantly within an area. The same value for population density could be a feature of an urban area and also a mountain area, where the resident is normally a part of the administrative area [36].
Therefore, in this study, an area-based mapping method, in which the original administrative unit is divided into smaller spatial units, was implemented to obtain the information and estimate the spatial distribution of the case study area. Within the boundaries, the case study area of the city polygon, which represented the shape and location, contained various data features, and the rectangular cell girds were employed to capture the data at the municipal polygon scale into a smaller spatial grid unit, as illustrated in Figure 2.
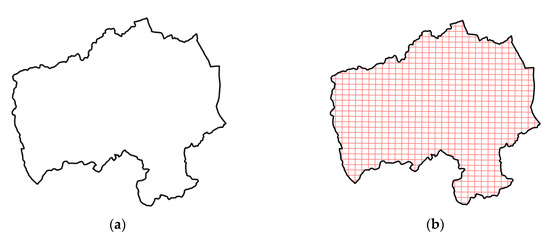
Figure 2.
The boundaries of the case study area. (a) At the municipal polygon scale; (b) Divided into a smaller grid polygon.
Because the development of GIS technology allows us to use digital maps that recombine and process data, this technique was generated and implemented to be combined with and integrated into a spatial GIS environmental system.
2.1.2. Spatial Accessibility Estimation
Regarding an efficient estimation of the evacuation shelter deficiency, the accessibility based on the spatial distribution of both the population and shelters, including the evacuation distance and route, were taken into account in this research. However, several studies have estimated that 25 percent of the total number of census data could evacuate to emergency shelters, and therefore have applied this information as the input data to estimate shelter demand. However, in a real situation of a disaster, where and how people can reach shelters are also critical issues.
In the literature, the concept of spatial accessibility is described as a cumulative opportunity that defines how many potential opportunities there are or how many destinations can be reached from a particular origin within a threshold travel time or distance [37,38]. Thus, previous studies have often applied the Euclidean distance, which focuses on the simple radius as a linear distance from shelters, to measure the accessibility. However, this method is still, impractical for community disaster evacuation in practice. In addition, based on the post-disaster reports and surveys, evacuation route and distance are the significant factors impacting decisions regarding evacuation and the selection of an evacuation route. Additionally, previous research and guidelines have suggested that the desired distance of an evacuation point should be appropriate for residents, particularly vulnerable populations.
Therefore, this study applied the distance-based approach of an actual road network to analyze the actual accessibility of shelters for a population. To present an origin and perform an accessibility calculation, in this study, the centroid point feature or the center of an area from the grid units was generated and represented the population points within each area. At this stage, a road network analysis was conducted, using the GIS platform to generate evacuation routes and the estimated evacuation cost of navigation for each population point. Accordingly, several evacuation guidelines and studies have suggested the creation of suitable shelters at the nearest location as the best solution for all evacuees [39,40]. Hence, the approach in this study employed a “closest facility” analysis to create the travel route between the population points and designated evacuation sites. This application was based on Dijkstra’s algorithm for finding the shortest paths by implementing two types of path-finding algorithms [41]. The first type is the exact shortest path. The algorithm searches for the distance from the starting point to every other vertex, until it reaches the destination point. The second is a hierarchical path solver, which has a faster performance and gives the shortest path possible.
As a starting point, by implementing the “closest-facility” analysis, the population points were applied as the incident features in the GIS application. The location points of the designated evacuation shelters were factored in as facility features using the closest facility analysis technique. Furthermore, according to previous literature, the use of cars or other vehicles was not recommended for evacuation purposes, because they represented a threat to the physical safety of evacuees [42,43]. In addition, during a disaster, in heavy rain or when it is dark, older people generally do not have the confidence to drive; thus, shelters with a convenient location and within walking distance could give the elderly greater encouragement and support for evacuating [44]. Thus, it was assumed, in this investigation, that walking would be the primary method for accessing the closest shelters. The travel mode of walking was applied, with a fixed walking speed of 1.4 m/s, which was considered to be the average rate of a normal adult. In the analysis of the case study area, a two-kilometer network distance was considered to be appropriate for the accessibility measurement, according to the guidelines of each country [45], which suggested that the desirable distance of evacuation on foot should be less than 2 km in all cases.
2.1.3. Shelter Demand Estimation and Deficiency Assessment
While shelters and populations can be mapped within spatial contexts, accessibility, which is impacted by evacuation decisions, is strongly constrained by the road network and other conditions. Therefore, in this step, the travel cost along the evacuation route, which is the distance and duration of the route, was investigated to measure the accessibility of the evacuation shelters. The road network distance between each point, representing residential units and shelters, was computed, including the estimated travel time. Then, each evacuation shelter, represented by a shelter ID, was distinguished from all the population access points, denoted by population IDs, within the threshold distance appropriate for the case study area. As the output of this process, a table of each evacuation shelter, with the population IDs, the size of the population within each grid area, and the travel distance and time was provided (Table 1).

Table 1.
An example of an output table representing each shelter, with the size of the accessed population (Pj,i), travel distance, and travel duration.
Then, the total access area for each shelter was summarized, including the total estimated population demand, which was also calculated by merging the total size of the accessed population points that can reach the evacuation shelter using the following formula:
where Di is the estimated population demand for shelter, i, and Pj,i is the size of the population of each area, j, that can access shelter, i.
Di = Σ Pj,i,
To evaluate the capacity of each shelter, the ratio of the accommodation capacity was also examined by dividing the designated capacity of each shelter by the estimated population demand using the following equation:
where Ri is the ratio of the capacity of shelter i and Ci is the designated capacity of shelter i.
Ri = Ci/ΣPj,i,
2.1.4. Vulnerability Analysis
Since the concept of vulnerability varies among people due to their different circumstances, taking into consideration previous research, the main concepts were classified into two dimensions, i.e., physical and social perspectives. In engineering science research, the physical aspect is usually considered to be a function of a given process intensity towards physical structures. Therefore, physical vulnerability is often associated with the susceptibility of the element at risk, which comprises its geography, location, place, settlement patterns, and physical structures [46,47,48]. Conversely, the social dimension is complex and multifaceted and typically describes the socioeconomic and demographic factors that affect the resilience of communities. It describes a population’s ability to prepare for, respond to, cope with, recover from, and ultimately adapt to environmental hazards [49].
Therefore, for this stage, to analyze the vulnerability of the evacuation shelters in the case study area, the location of previous hazardous areas was taken into account and applied to prevent location from being a barrier feature in the evaluation of the accessibility of the shelter during an actual disaster event in the case study area. Then, the new evacuation route to the closest evacuation shelter was once more generated, and the travel cost was calculated for each evacuation shelter. To evaluate the vulnerability of each shelter, with consideration of a previous actual disaster in the case study area, this study investigated the physical vulnerability in terms of the location, capacity, and travel cost impacted by the disaster. Furthermore, the total size of the access area for each shelter and the estimated population demand after the disaster were also calculated using the following equation:
where is the estimated population demand for shelter i after the disaster, and is the size of the population for each area j that accesses shelter i after the disaster.
2.2. Case Study Area
The case study area is the town of Mabi, which is located in Kurashiki City, Okayama prefecture, in the western region of Japan, as shown in Figure 3. Japan is one of several countries that is vulnerable to natural disasters due to its topography. Japan has experienced numerous types of disaster, and recently, in 2018, it suffered the worst flooding in decades in the western part of the country. The damage affected many people, killing 225 residents and destroying their houses, properties, and livelihoods. In particular, more than 8 million people were required to evacuate across 23 prefectures [50,51,52]. This disaster caused enormous damage and imposed massive operational difficulties on the local government.
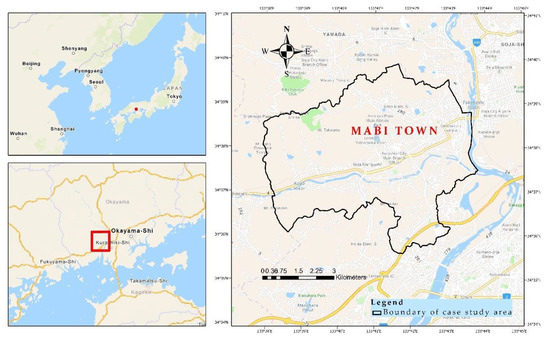
Figure 3.
Location of the case study area, Mabi town, in Japan.
The town of Mabi, one of the most severely affected areas, is geographically enclosed by two large rivers, namely, Oda river and Takahashi river, which overflowed and covered almost one-third of the area of the town, causing 51 deaths [53,54]. The area of Mabi is 44.12 km2, with a total population of 22,594 and a population density of 512.1 people/km2. Historically, Mabi has repeatedly experienced devastating floods due to the overflow of the Oda river; however, the water level has never exceeded 50 cm since the 1970s [55]. Nonetheless, under Japanese law, hazardous maps for disasters are required by the city authority, which considers the area to be high risk. However, by the time the official hazardous map was distributed in 2016, most of the high-risk flooding areas were already occupied due to suburbanization [56]. Due to the heavy rain from the end of June to the beginning of July 2018, the dikes along the Oda and Takahashi rivers were breached on 6 July 2018. The intensity of the 2018 heavy rain was extreme, because it did not last for a short period of one to six hours but continued for an extensive period of more than 24 h. For that reason, a flood was triggered, and the town of Mabi, therefore, was extensively inundated. However, the city office had been preparing for an emergency since the morning of 5 July, and the first evacuation was ordered for the high-risk areas around the Oda river. According to the report [55], it was revealed that the residents did not start evacuating to a safe place in time; therefore, 51 residents died in the water, and 40 of these victims drowned in their own houses. Flood depths exceeding 5 m were found all over areas of Mabi [54]. The flood lasted for 5 days, and the flood depths were very high (exceeding 5 m all over areas of Mabi). More than 4600 families were affected and required immediate temporary accommodations, and numerous residents had to continue to stay at shelters until the end of August. In Japan, the mayors of the municipalities were also required to designate both public and private facilities (e.g., schools, junior high schools, and community centers) as “designated shelters” by the Japanese law. Furthermore, to ensure a smooth and prompt evacuation, these facilities were also designated as “emergency evacuation sites” and “shelters” for temporary stays. Due to the catastrophic loss due to the flood in 2018, an evaluation of vulnerability reduction in an effort to “Build Back Better”, i.e., enhance disaster preparedness for an effective response within the Sendai Framework, is urgently needed.
2.3. Data Collection
2.3.1. GIS-Related Data
The data used in this research and analysis of both spatial and non-spatial data were obtained from several sources. Detailed information about the data, sources, and application in this study is presented in Table 2.
Table 2.
Collected data.
Geographic data on census statistics were obtained from the government statistic portal site of Japan [56]. GIS boundary data for the case study area at the scale of the city area and the 5th-level grids, as the smallest polygon mesh of approximately 250 m grids (7.5 s latitude and 11.25 s longitude), were collected in a shape-file format.
In addition, census data operating with this 250 m grid resolution were also provided for every 5 years. To investigate the base statistics, the latest census data, for 2015, from the e-stat portal of Okayama prefecture were obtained as a CSV file for processing.
People older than 65 years are usually included in the definition of vulnerable groups who are often frail and require regular and continuous health care [57,58]. This case study area, Mabi, has essentially been driven to reduce disaster risk by a considerable increase in the elderly population; therefore, the population of this vulnerable group of residents aged over 65 years old was also investigated in this study.
2.3.2. Data Related to Disaster Preparation
A list of designated evacuation sites in the town of Mabi was collected from data-CRADLE, an organization responsible for promoting the use of open data in Kurashiki. It provides open data based on information released by the official Kurashiki authority website [59]. The list of designated evacuation sites was obtained as a CSV file from the latest update published in March 2018, by the Kurashiki city authority’s department.
Flooding data on the 2018 disaster event area were acquired from the Geospatial Information Authority of Japan (GSI), who published estimated inundation maps from 7 July 2018, for investigation and comparison in this study. These collected data were based on various pieces of information, such as the image on July 7, which confirmed the endpoint of the submerge range and estimated the flooded surface from the height of that point using elevation data [60].
3. Results
In this study, ArcGIS 10.7.1 was used to process, map, and analyze the data. The point location of all emergency centers, i.e., the latitude and longitude (X and Y) coordinates of these designated evacuation sites, were obtained from Google Maps and added to the ArcGIS software.
The census data were merged with areas with the same key code into a 250 m polygon mesh grid layer. Using the Mabi town boundary layer, this grid layer was clipped and joined with the Mabi town feature layer. Within these total grid areas, 337 grids contained a population of at least one resident. The rest (413 grid areas or 45% of the study area) comprised zero population data, which were areas in which mountains, roads, lakes, or rivers were located, as shown in Figure 3.
3.1. Spatial Distribution
In Mabi, more than 30% of the total population is considered to be vulnerable, and 31.68% and 13.06% of the elderly population are over 65 years old and 75 years old, respectively (Table 3). Additionally, within the vulnerable group of elderly people over 65 years old, 54.39% (3893 residents) are female seniors. Previous studies have revealed that the elderly tend to have a higher mortality rate during a disaster [61]. Focusing on age is significant, because the elderly problem is more critical in Japan than in other countries.
Table 3.
Summary of the total population and vulnerable groups compared to the designated capacity of evacuation shelters in the town of Mabi.
For the overall population, 22 facilities were identified as the designated evacuation shelters in Mabi. Table 3 illustrates that all of these designated evacuation shelters have the capacity to accommodate 3110 people, which are available for 13.76% of the total population.
Technical planning according to previous disaster research on emergency shelter planning [18,19] has indicated that 25% of both total populations and vulnerable residents would use public shelters in the case of an evacuation. In the case study area, a shelter capacity of 13.76% for the total population is insufficient. However, for the vulnerable group of residents aged over 65, the shelter capacity of 3110 is accessible for 43.45% of them, which is more than 25%, thus meeting the technical planning standard. However, according to a report on the 2018 flood disaster, many residents could not access the evacuation shelters due to the condition of the evacuation route and a shortage and poor distribution of shelters [55].
Figure 4 illustrates the spatial distribution of both the residential population and the designated evacuation shelters in the study area. The spatial distribution of the population ranges from 1 to 409, with a mean value of the population of 30.12 per grid area. The population density of each grid area is classified by a natural break and shown in a different color, from light yellow to dark red, as shown in Figure 4. The high population density (red) areas are mostly located in the northeastern part of the case study area, while the western part of the town mostly has a low population density (yellow) and areas with no population, such as the areas with mountains, lakes, or rivers. However, the shelter capacity distribution ranges from 20 to 340, with a mean and median value of 141.36 and 150 accommodations, respectively. The size of each shelter capacity is illustrated and distinguished from the others by using blue symbols with different scales. The figure also shows the location of the designated evacuation shelters, where the shelters with greater capacities (larger blue symbols) are mostly located in the center and northeast of the town.
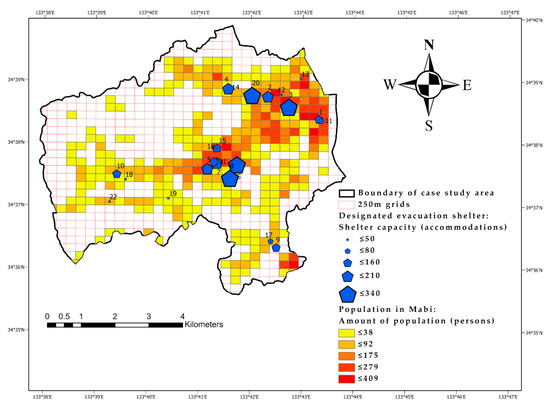
Figure 4.
Spatial distribution of the population and designated evacuation shelters in the case study area of Mabi.
3.2. Accessibility Assessment
In the case study area, during the flood situation in 2018, an evacuation was ordered by the local authorities for the town of Mabi, including areas with no flooding. Accordingly, the study concentrated on the accessibility and shortage of evacuation shelters in terms of the evacuation demand, resources, and evacuation route distance. Therefore, the demand of the population in the areas with no flooding was also investigated to evaluate the availability and accessibility of the evacuation shelter. Figure 5 shows the evacuation routes, along with the actual road network, to the closest designated evacuation shelters, from every population point in each grid area. To determine the accessibility for each population point and conduct a road network analysis, 303 of 337 population points, which constitutes 89.91% of them, are located within a walking distance of 2 km from the designated evacuation shelters, as shown in the brown evacuation route in the figure. However, the blue evacuation routes in the figure illustrate the remaining 34 population points, which are located within a walking distance of 7 km from the evacuation shelters, and 23, 3, 3, and 5 population points are estimated to be within 3, 4, 6, and 7 km, respectively. These long-distance evacuation routes are located in the western part of the town, and most areas are covered by mountains and forests. Particularly at the edge of the boundary in the southwestern part, the evacuation route exceeds the boundary of the case study area due to the unavailability of a road network through the mountain zone within the border.
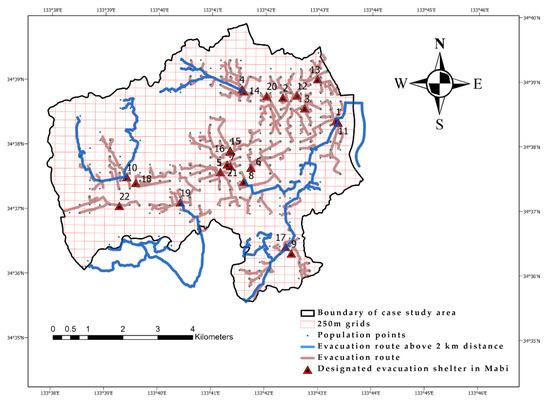
Figure 5.
Spatial distribution of the population points and designated evacuation shelters in Mabi and the evacuation routes.
Table 4 illustrates the accessibility of each designated evacuation shelter in Mabi, showing the total area within a 2 km walking distance from the closest shelter, the points at the longest distance from a shelter, as well as the fastest and longest time durations. Shelter Number 14 is the most accessible for the population points of 29 areas, whereas shelter Number 4 has the lowest accessibility and is accessible for the population points in only two areas. The closest emergency shelters are capable of being reached from the population points in less than 8 min. However, the longest walking duration to an evacuation shelter is almost 24 min, and it is to shelter Number 14, which is also situated at the longest distance from the population points (nearly 2 km). Each designated evacuation shelter is capable of being reached from the population points in less than 8 min.
Table 4.
The accessibility of each designated evacuation shelter, shown by the accessible area within a 2 km walking distance.
3.3. Capacity Assessment
Table 5 outlines the capacity of each designated evacuation shelter in Mabi. The results for the estimated shelter demand (Di) for the closest facilities within a 2 km walking distance using network analysis show that the estimated demand at almost every shelter massively outweighs their capacity; only the lowest estimated demand, at shelter Number 4, with an estimated access area of two population points, displays a high ratio in terms of the shelter capacity (Ri), i.e., 450%. However, the capacity ratios of the other shelters are considerably low, particularly the capacity of shelter Number 13, which was designated for 30 accommodations, while the estimated demand through the closest analysis of this shelter was considered to be 1561 residents.
Table 5.
The accessibility of each designated evacuation shelter, as distinguished by the total estimated population demand (Di), the capacity ratio of each shelter (Ri), and the total estimated demand of the population over 65 years old (Di,O65).
A comparison of the designated capacity and the estimated shelter demand is demonstrated in Figure 6. The result shows that even in the western part, with a low population density, an evacuation shelter space deficit still exists in the area.
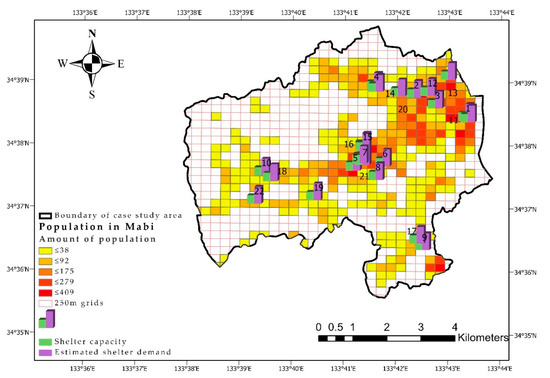
Figure 6.
Comparison of the shelter planning capacity and the estimated shelter demand in Mabi.
3.4. Vulnerability of Shelters
Figure 7 shows the evacuation route for the 2018 flooding disaster in the case study area, including the spatial distribution of the population points and designated evacuation shelters. The evacuation distances of less than 2 km and more than 2 km are illustrated in brown and dark blue, respectively. The figure also demonstrates that, of a total of 22 designated evacuation shelters in the study area, after the flood disaster, only 10 shelters remained available and could be accessed along the road network. Furthermore, in the southern and southwestern parts of Mabi, two designated shelters (shelter Numbers 9 and 17) remained available for the residents after the flood. However, due to the long distance of the evacuation routes (more than 2 km), the residents from this area would have had difficulty accessing these shelters.
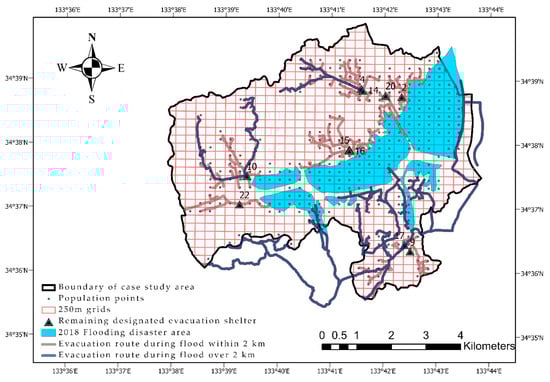
Figure 7.
Evacuation route during the 2018 flood disaster from the population points to the designated evacuation shelters in Mabi for accessibility assessment.
The results also show that there are 269 population points located outside the flooding area, which can access a shelter through the road network. However, 88 of these population points have a long evacuation route of more than 2 km in order to access a shelter, due to the mountainous conditions of their geographical location and the unavailability of a road connection. From all 337 population points within the study area, 68 population points are identified as vulnerable to flood, because they are located in the high hazard zone, and there is no road connection for the flood evacuation.
Because the aim of this study was to evaluate the physical vulnerability of the study area in terms of the location, distance, and accessibility of the shelters, a simulation using GIS was employed, which demonstrated that 12 of 22 (54.55%) designated evacuation shelters were physically vulnerable to flood disaster, because they were located in the flooding area. These emergency shelters were not accessible due to the unavailability of a road network and were isolated by the remaining network (Table 6).
Table 6.
The vulnerability of the shelters.
Furthermore, Table 6 presents the remaining capacity of 10 evacuation shelters after flooding, and shows that capacity was reduced to 1340 (43.86% of the total capacity in Mabi). The demand ratio for accessibility to six of these shelters was significantly increased (shelter Numbers 2, 10, 15, 16, 20, and 22), and they were located near the flooding area (Figure 8). The contrast between the estimated demand and the estimated demand after the flooding, including the planning shelter capacity, is shown in Figure 8.
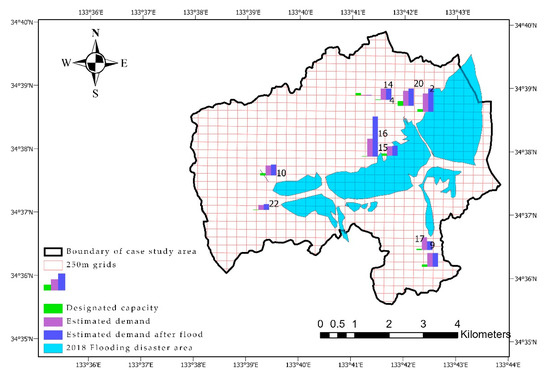
Figure 8.
Comparison of the planning shelter capacity (green), estimated shelter demand (purple), and estimated shelter demand after the flood disaster (dark blue) in Mabi.
Table 7 illustrates the estimated number of vulnerable populations that are directly impacted by the 2018 flooding disaster. The results show that 59% of the total population is vulnerable, because they are located in the flooded area. More than 50% of the elderly population (3976 elderly residents) is located in the inundated area, whereas 2148 and 1828 are female and male seniors, respectively, who are expected to be evacuated to a safe location when flooding occurs. In addition, the results indicate that among the flooded senior population, more than 1500 people are elderly, aged over 75 years old. These residents are the most vulnerable because of their physical incapacity, and also due to their vulnerable location to the flooding and the fact that there is no road network to the shelter. This indicates that this senior group would have the most difficulty evacuating in the case of disaster situations.
Table 7.
The vulnerability of people in the 2018 flooding disaster.
4. Discussion
This study proposed a methodology for evaluating the accessibility of evacuation shelters and assessing the vulnerability of existing evacuation shelters and populations regarding disaster risk reduction. Because vulnerability during a disaster is increased by the spatial heterogeneity of an imbalance between population demand and shelter capacity resources, our approach integrated both spatial distribution of shelter demand and resource into the spatial accessibility estimation and shelter deficiency assessment. The above analysis and results indicate that the proposed method, in this study, can be used to map the spatial distribution, and also provide a statistical estimation of shelter demand and the vulnerability of shelters and populations. In most of the previous researches, a specific population ratio was applied to calculate and evaluate shelter demand [20,21,22]. However, this is not realistic, given the diversity of disaster situations. In actual catastrophe circumstances, several factors can influence the real demand and accessibility of shelters, including where the population and shelters are located. Therefore, the proposed algorithm integrated the aspects associated with the location, particularly the spatial distribution of both shelters and population to evaluate the imbalance between shelter demand and existing resources of shelters in a real disaster situation. Applying this algorithm in the case study area in Japan, the method revealed that the shelter capacity was reduced to 43.86% by the flood. In addition, GIS-based mapping was also an essential tool for the assessment of the spatial distribution of evacuation shelters and was used to further support shelter assignments and evacuation planning. The specific locations of the closest shelters to each population area were identified and visualized, using the appropriate distance, as suggested by the guidelines for the case study area, since it has been reported that the residents in Mabi did not know where to go during the disaster [55]. Therefore, our results indicate the nearest designated evacuation and travel route on the GIS map, which can support and enhance the awareness of location and accessibility of shelters for disaster preparation.
According to previous studies based on statistical planning [18,19], in the case of an evacuation, there should be sufficient public shelters available for 25% of both the total population and vulnerable residents. However, our results, in the case study area, revealed that the total shelter capacity planning was available to 13.76% of the total population and 43.45% of the senior group in the town of Mabi. Without considering spatial distribution, it is possible that planning assessment does not reflect the real situation of where residents and evacuation shelters are located when a disaster occurs, including how people can access the shelters. After applying the method, in the case study area, our findings show the spatial heterogeneity of the diverse distribution of population and evacuation shelters. The numerous areas with high population density are located in the northeastern, middle, and southeastern parts of the town, whereas, the areas with high capacity of evacuation shelters are mostly located only in the northeastern and middle part of the case study area. The visualized results confirm that spatial distribution is the critical issue that impacts the availability of shelter and accessibility of residents.
Moreover, the condition and distance of the evacuation routes were also considered in conjunction with this approach. The distance-based function of the actual road network was taken into account in the study, rather than using the Euclidean distance, to estimate the accessibility of facilities, because, in the real world, travel routes could be covered, collapsed, or disconnected due to a disaster, which could decrease the efficiency and impact the evacuation and accessibility of shelters [25]. By comparing the results with the 2018 flooding situation, we also observed that due to the disconnected road network, the shelter demand around the flooding area, based on our study, was significantly increased and enormously exceeded the designated shelter capacity. However, it is not an easy task to build a new shelter to provide greater accommodation capacity in a city where there is limited space. Moreover, it is challenging for the local authorities to determine the designated capacity of evacuation shelters for all the evacuees in a large-scale disaster. On the basis of the statistical results for the case study area, our findings indicated the shelter demand and the location of the remaining sites due to the flood, especially the locations with a demand that exceeds its capacity. Our findings suggest and offer information that could be used by city authorities and disaster administration for planning and managing essential supplies to meet the demand, such as food and sanitation facilities, for example, toiletries and bathroom supplies. In particular, emergency healthcare or medical support should be provided for those considered to be vulnerable groups in this research, who were directly impacted by the disaster situation. The estimated 3976 seniors who experienced the disaster and survived may have lasting mental health impacts [62,63], which, in this case, could require both urgent care and extended plan support. Therefore, this study provides vital evidence for policymakers and practitioners for long term disaster management.
Furthermore, the method also showed that people located around the area of the border of the case study area had difficulties evacuating due to the mountainous condition of their geographic location and the long evacuation distance to the shelters. The results for these specific areas provide beneficial evidence that the local government needs to manage and prepare for evacuations of these areas, specifically the elderly population in these areas, who tend to hesitate to evacuate if the evacuation distances are long [29,30]. On the basis of our findings, it is recommended that some other options for shelters be arranged in those areas, or cooperation with the neighboring towns should be coordinated. Providing more convenient facilities with easier access, particularly facilities within walking distance, would reduce the risk and stress of evacuation [25,26]. In addition, informal shelters, such as parks, temples, local residences, and community halls, could be used to provide accommodation for evacuees during a disaster.
In the future, this study could be further improved. In this study, only people aged 65 and older, as vulnerable groups, were taken into account, since Japan, as a “super-aging” society, has an extremely high proportion of elderly citizens, both in the rural and urban areas. Therefore, additional vulnerable populations, such as children, adolescents, people living with disabilities, and disabled persons, could be included in future research to make the findings more generalizable. Moreover, this research mainly calculated the evacuation routes based on the evacuation distance, which were suggested as guidelines for evacuation, because the objective of the study was to investigate the primary accessibility of evacuation shelters. Differences in terms of altitude were not taken into the account in this study, and this also constitutes a limitation of this research and an area for future improvement. The evacuation time, considering more real-world aspects, should be calculated in the future. Additionally, the hazardous area data applied in this work were from the previous 2018 flooding disaster and the population data were from 2015. Hence, the population distribution could have been altered by the time of this analysis. Additionally, the assessment of the distribution and shelter accessibility could also be investigated in other disaster scenarios, such as earthquakes or tsunamis. Furthermore, this methodology could be implemented in a wide variety of studies due to the advantage of it being a concise technique and the requirement for a minimum number of data, which are usually available for countries like Japan and other countries. A future study could implement the method to assess the impact of further disaster conditions and identify the vulnerability of another area or at a broader scale.
5. Conclusions
This paper explored a novel approach to evaluate accessibility and shelter deficiency, by integrating both spatial distribution of a population and designated evacuation shelters in a GIS environment. Because the population was unevenly distributed and located in different areas and shelter capacity planning was limited and also unequally allocated, to address these issues and evaluate the vulnerability of shelter and population, evacuation shelter demand based on accessibility was proposed and calculated for the case study area.
By using small spatial units to obtain the spatial distribution of the population and shelters in Mabi, the approach helped to estimate and identify impacted residents, particularly the vulnerable groups when a disaster occurred. In addition, the estimation of shelter demand evidently enhanced the estimation accuracy as compared with using common census data, and based on the accessibility analysis led to identifying the vulnerable shelters regarding insufficient capacity. Additionally, this approach can be conducted using GIS platform technology which provides a practical tool and offers flexibility in terms of data availability for investigating an area to support decision makers and serve as a useful reference for developing and improving emergency management strategies that could reduce disaster vulnerability.
In summary, we believe the assessment in this research could provide a reference for enhancing disaster preparedness, and therefore achieve an effective disaster response in the future. Designated evacuation resources could be reasonably allocated and organized efficiently on the basis of the results from this study. The provision of information regarding vulnerable areas and vulnerable shelters could support local authorities and policymakers in making decisions regarding sustainable reduction of vulnerability.
Author Contributions
Conceptualization, H.S. and H.M.; methodology, H.S. and H.M.; software, H.S.; validation, S.K. and T.H.; formal analysis, H.S. and H.M.; investigation, H.S.; resources, H.M., S.K., and T.H.; data curation, H.S.; writing—original draft preparation, H.S.; writing—review and editing, H.S., H.M., S.K., and T.H.; visualization, H.S. and H.M.; supervision, H.M. and S.K.; project administration, H.S. and H.M.; funding acquisition, H.M. and S.K. All authors have read and agreed to the published version of the manuscript.
Funding
The research leading to these results has received funding from JSPS KAKENHI, grant number 18K19695.
Acknowledgments
The authors gratefully acknowledge the valuable comments and assistance during the data collection and study from Sushila Paudel and Yukiko Nakaie of the University of Kochi, Oshima Masami from the data cradle, and Takagi Masataka of the Kochi University of Technology.
Conflicts of Interest
The authors declare no conflict of interest.
References
- Rosselló, J.; Becken, S.; Santana-Gallego, M. The effects of natural disasters on international tourism: A global analysis. Tour. Manag. 2020, 79, 104080. [Google Scholar] [CrossRef]
- Jha, A.; Brecht, H.; Stanton-Geddes, Z. Building resilience to disasters and climate change in the age of urbanization. In Disaster Risk Reduction for Economic Growth and Livelihood: Investing in Resilience and Development; Davis, I., Yanagisawa, K., Georgieva, K., Eds.; Routledge: Abingdon, UK, 2015; pp. 7–27. [Google Scholar]
- EM-DAT: The International Disaster Database. Available online: https://public.emdat.be/ (accessed on 9 June 2020).
- Djalante, R. Key assessments from the IPCC special report on global warming of 1.5 °C and the implications for the Sendai framework for disaster risk reduction. Prog. Disaster Sci. 2019, 1, 100001. [Google Scholar] [CrossRef]
- United Nations Office for Disaster Risk Reduction (UNDRR) Home Page. Report of the Open-Ended Intergovernmental Expert Working Group on Indicators and Terminology Relating to Disaster Risk Reduction. Available online: https://www.preventionweb.net/files/50683_oiewgreportenglish.pdf (accessed on 5 January 2020).
- Birkmann, J. Measuring vulnerability to promote disaster-resilient societies: Conceptual frameworks and definitions. Inst. Environ. Hum. Secur. J. 2006, 5, 7–54. [Google Scholar]
- Zhao, L.; Li, H.; Sun, Y.; Huang, R.; Hu, Q.; Wang, J.; Gao, F. Planning Emergency Shelters for Urban Disaster Resilience: An Integrated Location-Allocation Modeling Approach. Sustainability 2017, 9, 2098. [Google Scholar] [CrossRef]
- Dostal, P.J. Vulnerability of Urban Homebound Older Adults in Disasters: A Survey of Evacuation Preparedness. Disaster Med. Public Health Prep. 2015, 9, 301–306. [Google Scholar] [CrossRef]
- Cruz, M.A.; Rubens, M.; Garcia, S.J.; Malilay, J.; Levin, K.L.; Williams, O.D. Knowledge of and Preparedness for Use of Environmental Assessments in Shelters during Disasters: Results of the 2013 State and Territorial Use of Shelter Assessments Survey. Disaster Med. Public Health Prep. 2017, 11, 11–14. [Google Scholar] [CrossRef]
- Bashawri, A.; Garrity, S.; Moodley, K. An Overview of the Design of Disaster Relief Shelters. Procedia Econ. Financ. 2014, 18, 924–931. [Google Scholar] [CrossRef]
- United Nations Office for Disaster Risk Reduction (UNDRR) Home Page. Lesson Learned and Way forward for Resilient Shelter Interventions in Rural Myanmar. Available online: https://www.preventionweb.net/files/19769_unhabitatpostnargisinterventionless.pdf (accessed on 20 January 2020).
- Kotani, H.; Yokomatsu, M.; Ito, H. Potential of a shopping street to serve as a food distribution center and an evacuation shelter during disasters: Case study of Kobe, Japan. Int. J. Disaster Risk Reduct. 2020, 44, 101286. [Google Scholar] [CrossRef]
- Pimanmas, A.; Joyklad, P.; Warnitchai, P. Structural design guideline for tsunami evacuation shelter. J. Earthq. Tsunami 2011, 4, 269–284. [Google Scholar] [CrossRef]
- Isahak, A.; Reza, M.I.H.; Siwar, C.; Ismail, S.M.; Sulaiman, N.; Hanafi, Z.; Zainuddin, M.S.; Taha, M.R. Delineating risk zones and evaluation of shelter centres for flood disaster management along the Pahang River Basin, Malaysia. Jamba 2018, 10, 501. [Google Scholar] [CrossRef]
- Gao, J.; He, J.; Gong, J. A simplified method to provide evacuation guidance in a multi-exit building under emergency. Phys. A Stat. Mech. Appl. 2020, 545, 123554. [Google Scholar] [CrossRef]
- Kar, B.; Hodgson, M.E. A GIS-Based Model to Determine Site Suitability of Emergency Evacuation Shelters. Trans. GIS 2008, 12, 227–248. [Google Scholar] [CrossRef]
- Ma, Y.; Xu, W.; Qin, L.; Zhao, X. Site Selection Models in Natural Disaster Shelters: A Review. Sustainability 2019, 11, 399. [Google Scholar] [CrossRef]
- Chou, J.-S.; Ou, Y.-C.; Cheng, M.-Y.; Cheng, M.-Y.; Lee, C.-M. Emergency shelter capacity estimation by earthquake damage analysis. Nat. Hazards 2013, 65, 2031–2061. [Google Scholar] [CrossRef]
- Nguyen, D.-T.; Shen, Z.; Honda, K.; Sugihara, K.; Nishino, T.; Truong, M.-H. A GIS-Based Model for Integrating Risk Estimations of Residential Building Damage and Shelter Capacity in the Case of Earthquakes. Nat. Hazards Rev. 2020, 21, 04019016. [Google Scholar] [CrossRef]
- Karaye, I.M.; Thompson, C.; Horney, J.A. Evacuation Shelter Deficits for Socially Vulnerable Texas Residents during Hurricane Harvey. Health Serv. Res. Manag. Epidemiol. 2019, 6. [Google Scholar] [CrossRef]
- Karaye, I.M.; Thompson, C.; Perez-Patron, M.; Taylor, N.; Horney, J.A. Estimating Evacuation Shelter Deficits in the Houston-Galveston Metropolitan Area. Risk Anal. 2020, 40, 1079–1091. [Google Scholar] [CrossRef]
- Baker, E.J. Hurricane evacuation behavior. Int. J. Mass Emergencies Disasters 1991, 9, 287–310. [Google Scholar]
- Yu, J.; Wen, J. Multi-criteria Satisfaction Assessment of the Spatial Distribution of Urban Emergency Shelters Based on High-Precision Population Estimation. Int. J. Disaster Risk Sci. 2016, 7, 413–429. [Google Scholar] [CrossRef]
- Ye, M.; Wang, J.; Huang, J.; Xu, S.; Chen, Z. Methodology and its application for community-scale evacuation planning against earthquake disaster. Nat. Hazards 2012, 61, 881–892. [Google Scholar] [CrossRef]
- Li, X.; Claramunt, C.; Kung, H.; Guo, Z.; Wu, J. A decentralized and continuity-based algorithm for delineating capacitated shelters’ service areas. Environ. Plan. B Plan. Des. 2008, 35, 593–608. [Google Scholar] [CrossRef]
- Ünal, M.; Uslu, C. Gis-Based Accessibility Analysis of Urban Emergency Shelters: The Case of Adana City. Isprs—Int. Arch. Photogramm. Remote Sens. Spat. Inf. Sci. 2016, XLII-2/W1, 95–101. [Google Scholar]
- Parvin, G.A.; Sakamoto, M.; Shaw, R.; Nakagawa, H.; Sadik, M.S. Evacuation scenarios of cyclone Aila in Bangladesh: Investigating the factors influencing evacuation decision and destination. Prog. Disaster Sci. 2019, 2, 100032. [Google Scholar] [CrossRef]
- Abioye, O.F.; Dulebenets, M.A.; Ozguven, E.E.; Moses, R.; Boot, W.R.; Sando, T. Assessing perceived driving difficulties under emergency evacuation for vulnerable population groups. Socio-Econ. Plan. Sci. 2020. [Google Scholar] [CrossRef]
- Santos-Reyes, J. Factors motivating Mexico City residents to earthquake mass evacuation drills. Int. J. Disaster Risk Reduct. 2020, 49, 101661. [Google Scholar] [CrossRef]
- Horner, M.W.; Ozguven, E.E.; Marcelin, J.M.; Kocatepe, A. Special needs hurricane shelters and the ageing population: Development of a methodology and a case study application. Disasters 2018, 42, 169–186. [Google Scholar] [CrossRef]
- Whitehead, J.C.; Edwards, B.; Van Willigen, M.; Maiolo, J.R.; Wilson, K.; Smith, K.T. Heading for higher ground: Factors affecting real and hypothetical hurricane evacuation behavior. Glob. Environ. Chang. Part B Environ. Hazards 2000, 2, 133–142. [Google Scholar] [CrossRef]
- Bateman, J.M.; Edwards, B. Gender and Evacuation: A Closer Look at Why Women Are More Likely to Evacuate for Hurricanes. Nat. Hazards Rev. 2002, 3, 107–117. [Google Scholar] [CrossRef]
- Li, Z.; Yu, H.; Chen, X.; Zhang, G.; Ma, D. Tsunami-induced traffic evacuation strategy optimization. Transp. Res. Part D Transp. Environ. 2019, 77, 535–559. [Google Scholar] [CrossRef]
- Zhang, W.; Yun, Y. Multi-scale accessibility performance of shelters types with diversity layout in coastal port cities: A case study in Nagoya City, Japan. Habitat Int. 2019, 83, 55–64. [Google Scholar] [CrossRef]
- Faruk, M.; Ashraf, S.A.; Ferdaus, M. An analysis of inclusiveness and accessibility of Cyclone Shelters, Bangladesh. Procedia Eng. 2018, 212, 1099–1106. [Google Scholar] [CrossRef]
- Requia, W.J.; Koutrakis, P.; Arain, A. Modeling spatial distribution of population for environmental epidemiological studies: Comparing the exposure estimates using choropleth versus dasymetric mapping. Environ. Int. 2018, 119, 152–164. [Google Scholar] [CrossRef] [PubMed]
- Ingram, D.R. The concept of accessibility: A search for an operational form. Reg. Stud. 1971, 5, 101–107. [Google Scholar] [CrossRef]
- Ashik, F.R.; Mim, S.A.; Neema, M.N. Towards vertical spatial equity of urban facilities: An integration of spatial and aspatial accessibility. J. Urban Manag. 2020, 9, 77–92. [Google Scholar] [CrossRef]
- Evacuation and Shelter Guidance. Available online: https://www.iaem.org/portals/25/documents/UKEvacuation-ShelterGuidance1.pdf (accessed on 5 January 2020).
- FEMA: Official Website of United States Government. Planning Considerations: Evacuation and Shelter-in-Place, Guidance for State, Local, Tribal, and Territorial Partners. Available online: https://www.fema.gov/media-library-data/1564165488078-09ab4aac641f77fe7b7dd30bad21526b/Planning_Considerations_Evacuation_and_Shelter-in-Place.pdf (accessed on 22 January 2020).
- Dijkstra, E.W. A note on two problems in connexion with graphs. Numer. Math. 1959, 1, 269–271. [Google Scholar] [CrossRef]
- Masuya, A.; Dewan, A.; Corner, R.J. Population evacuation: Evaluating spatial distribution of flood shelters and vulnerable residential units in Dhaka with geographic information systems. Nat. Hazards 2015, 78, 1859–1882. [Google Scholar] [CrossRef]
- Wood, N.; Jones, J.; Peters, J.; Richards, K. Pedestrian evacuation modeling to reduce vehicle use for distant tsunami evacuations in Hawaiʻi. Int. J. Disaster Risk Reduct. 2018, 28, 271–283. [Google Scholar] [CrossRef]
- Nakanishi, H.; Black, J.; Suenaga, Y. Investigating the flood evacuation behaviour of older people: A case study of a rural town in Japan. Res. Transp. Bus. Manag. 2019, 30, 100376. [Google Scholar] [CrossRef]
- United Nations Office for Disaster Risk Reduction (UNDRR) Home page. Flood Hazard Map Manual for Technology Transfer. Available online: https://www.preventionweb.net/files/2708_FHMManual.pdf (accessed on 10 March 2019).
- Fuchs, S.; Heiss, K.; Hübl, J. Towards an empirical vulnerability function for use in debris flow risk assessment. Nat. Hazards Earth Syst. Sci. 2007, 7, 495–506. [Google Scholar] [CrossRef]
- Wilbanks, T.J. Integrating climate change and sustainable development in a place-based context. Clim. Policy 2003, 3, S147–S154. [Google Scholar] [CrossRef]
- Cardona, O.D.; van Aalst, M.K.; Birkmann, J.; Fordham, M.; McGregor, G.; Perez, R.; Pulwarty, R.S.; Schipper, E.L.F.; Sinh, B.T. Determinants of Risk: Exposure and Vulnerability. In Managing the Risks of Extreme Events and Disasters to Advance Climate Change Adaptation. A Special Report of Working Groups I and II of the Intergovernmental Panel on Climate Change; Field, C.B., Barros, V., Stocker, T.F., Qin, D., Dokken, D.J., Ebi, K.L., Mastrandrea, M.D., Mach, K.J., Plattner, G.-K., Allen, S.K., et al., Eds.; Cambridge University Press: Cambridge, UK, 2012; pp. 65–108. [Google Scholar]
- Emrich, C.; Cutter, S. Social Vulnerability to Climate-Sensitive Hazards in the Southern United States. Weather Clim. Soc. 2011, 3, 193–208. [Google Scholar] [CrossRef]
- Bandaru, S.; Sano, S.; Shimizu, Y.; Seki, Y.; Okano, Y.; Sasaki, T.; Wada, H.; Otsuki, T.; Ito, T. Impact of heavy rains of 2018 in western Japan: Disaster-induced health outcomes among the population of Innoshima Island. Heliyon 2020, 6, e03942. [Google Scholar] [CrossRef] [PubMed]
- Asahi Shimbun Digital Newspaper Home page. 51 Deaths by Heavy Rain, 58 People undiscovered, Evacuation Order for 8.63 Million Residents. Available online: https://www.asahi.com/articles/ASL774QS5L77PTIL01H.html (accessed on 8 July 2018).
- BBC Japan Flood: At Least 179 Dead after Worst Weather in Decades. Available online: https://www.bbc.com/news/world-asia-44790193 (accessed on 5 February 2020).
- Shakti, P.C.; Kamimera, H. Flooding in Oda River Basin during Torrential Rainfall Event in July 2018. Eng. J. 2019, 23, 477–485. [Google Scholar]
- Nihei, Y.; Shinohara, A.; Ohta, K.; Maeno, S.; Akoh, R.; Akamatsu, Y.; Komuro, T.; Kataoka, T.; Onomura, S.; Kaneko, R. Flooding Along Oda River Due to the Western Japan Heavy Rain in 2018. J. Disaster Res. 2019, 14, 874–885. [Google Scholar] [CrossRef]
- Sangita, D. Six Months since Western Japan Floods: Lessons from Mabi; CSW Japan: Tokyo, Japan, 2019; p. 16. [Google Scholar]
- Statistics of Japan, e-Stat: Portal Site of Official Statistics of Japan. Available online: https://www.e-stat.go.jp/gis (accessed on 15 February 2019).
- Kako, M.; Steenkamp, M.; Ryan, B.; Arbon, P.; Takada, Y. Best practice for evacuation centres accommodating vulnerable populations: A literature review. Int. J. Disaster Risk Reduct. 2020, 46, 101497. [Google Scholar] [CrossRef]
- Akiyama, N.; Shiroiwa, T.; Fukuda, T.; Murashima, S.; Hayashida, K. Healthcare costs for the elderly in Japan: Analysis of medical care and long-term care claim records. PLoS ONE 2018, 13, e0190392. [Google Scholar] [CrossRef]
- Data-Cradle Data Eye of Kurashiki. Available online: https://kurashiki.dataeye.jp (accessed on 3 March 2019).
- The Geospatial Information Authority of Japan. Available online: https://maps.gsi.go.jp/ (accessed on 2 April 2019).
- Ye, M.; Aldrich, D.P. Substitute or complement? How social capital, age and socioeconomic status interacted to impact mortality in Japan’s 3/11 tsunami. SSM—Popul. Health 2019, 7, 100403. [Google Scholar] [CrossRef]
- Kojima, G.; Iliffe, S.; Taniguchi, Y.; Shimada, H.; Rakugi, H.; Walters, K. Prevalence of frailty in Japan: A systematic review and meta-analysis. J. Epidemiol. 2017, 27, 347–353. [Google Scholar] [CrossRef]
- Okada, Y. Emergency medical services in a hyper-aged society. Nihon Rinsho 2013, 71, 953–963. [Google Scholar]


© 2020 by the authors. Licensee MDPI, Basel, Switzerland. This article is an open access article distributed under the terms and conditions of the Creative Commons Attribution (CC BY) license (http://creativecommons.org/licenses/by/4.0/).