Article

Identification of Factors Affecting the Performance of Rural Road Projects in Colombia

by
Adriana Gómez-Cabrera
1,2,*,
Amalia Sanz-Benlloch
3,
Laura Montalban-Domingo
3,
Jose Luis Ponz-Tienda
1 and
Eugenio Pellicer
3
1
Civil and Environmental Engineering Department, Universidad de los Andes, 111711 Bogotá, Colombia
2
Civil Engineering Department, Pontificia Universidad Javeriana, 111711 Bogotá, Colombia
3
Construction Project Management Research Group, Universitat Politècnica de València, Camino de Vera s/n, 46022 Valencia, Spain
*
Author to whom correspondence should be addressed.
Sustainability 2020, 12(18), 7377; https://doi.org/10.3390/su12187377
Submission received: 11 July 2020 / Revised: 23 August 2020 / Accepted: 25 August 2020 / Published: 9 September 2020
(This article belongs to the Section Sustainable Urban and Rural Development)

Abstract

:
Rural roads play an indispensable role in economic and social well-being, especially in developing countries, contributing to achieving the Sustainable Development Goals. For this reason, it is necessary to plan these projects properly to guarantee their success. In this line, the objective of this research is to identify significant variables generating overruns in time and cost using empirical data of 535 rural road projects in Colombia from 2015 to 2018. Bivariate analysis, with statistical tools like Spearman’s Rho and Kruskal–Wallis, allowed identifying that higher values of variables like budget and project intensity are related to higher deviations in cost and time. Additionally, it was found that projects with shorter durations are reporting higher time overruns. The worst performers are projects executed in the year that council mayors start their terms, those developed in municipalities with more resources, and those awarded using a competitive bidding process. Multivariate analysis, through Random Forest, assessed the effect of considering all variables interacting simultaneously and ranking them in order of importance. The results demonstrated a relationship between cost and time performance, and that numerical variables are more significant than the categorical ones. This study contributes to a better understanding of the causes of delays and cost overruns on rural roads, providing useful insight for researchers and industry practitioners.

1. Introduction

Rural areas comprise vast geographical regions where a significant population faces emerging threats associated with a lack of infrastructure, particularly across developing countries [1]. Rural transport and their infrastructure play an indispensable role in the universal call of the Sustainable Development Goals (SDG), which contribute to more than half of them. Rural roads provide regional connectivity, reducing poverty and facilitating access to essential services. These goals also promote building quality, reliable, sustainable, and resilient infrastructure [2]. Rural road networks in low/middle-income countries are critical for economic and social well-being, and they are mostly unpaved [3]. In developing countries, infrastructure quality deficiencies restrict mobility and overall network connectivity [4]. Rural roads correspond to 69% of the entire network in Colombia, with a total extension of 143,000 km. It is estimated that in the 281 municipalities of Colombia, only 6% are paved. The absence of roads limits the opportunities and development of the regions, increasing poverty [5]. Due to the importance of rural roads, it is essential to plan them properly to guarantee a successful project, defined as one that has achieved its technical performance, maintaining its initial schedule and budget [6]. However, deviations in time and cost are a global phenomenon on five continents and have not decreased over the past 70 years [7].
The literature has included the magnitude and frequency of those deviations. An early study in Hong Kong revealed that the mean percentage of time overrun is 14% for civil engineering projects (infrastructure) [8]. Another study established that over 40% of Indian construction projects are facing time overruns [9]. Regarding cost deviation, it has been found that 9 out of 10 transport infrastructure projects around the world present this deviation [10]. Transportation projects in the United States are identified as underestimated; approximately 50% of them have overrun their initial budgets [11]. These studies show that deviations do not correspond to a particular type of project or region and that there are researchers worldwide interested in this topic.
There are also studies focused on reporting factors causing delays and cost overruns, according to the stakeholders’ perception to indicate the frequency of occurrence, severity, or importance of each possible cause to ranking the most significant factors [12]. Specifically, for road construction projects, the results of a study in Zambia established that bad weather, scope changes, environmental protection, schedule delay, and strikes, are the significant causes of cost escalation. For schedule delays, delays in payments, financial processes, contract modification, economic problems, and materials procurement were found to be the major causes [13]. The most significant causes of delay in road projects in Palestine are the political situation, award project to the lowest bid price, progress payment delay by the owner, and shortage of equipment [14]. Another study identified the causes of delays in road projects in Malawi, including a shortage of fuel, insufficient contractor cash-flow, lack of foreign currency, slow payment procedures, and insufficient equipment as the most significant [15]. Researchers in Cambodia analyzed the delay factors, finding that rain and flood, land acquisition, the awarding of the project to the lowest bidder, and equipment breakdowns are the most significant [16].
Other approaches consisted of identifying the impact of different variables in time and cost overruns. In Taiwan, researchers examined how different causes work together to influence project schedule delays using Structural Equation Modeling. The primary source of information was also the perception of the stakeholders, and the results showed that the class of nonhuman-related causes is the most significant, in which “unforeseen site conditions” is the most worthwhile [17]
Another study used the three-stage least-squares technique to analyze the impact in cost and time overrun of nine variables for highway projects in Indiana (USA). Results identified the contract size, project duration, expected weather conditions, and results of the competitive bidding process as statistically significant and also demonstrated a simultaneous relationship between cost and time overruns [18]. In Hong Kong, a study examined three variables: Project type, size of the project, and length of the project implementation period; and their statistical relationship with cost overruns in mega transport projects. The results showed that rail projects are most prone to cost increase, and road projects are the least vulnerable. Cost overruns have no significant relationship with project size, but for road projects, smaller-scale projects tend to be more prone to more considerable cost overruns [19].
Authors identified gaps like the absence of studies related to cost and time deviations in rural road projects. Besides, most of the methods implemented in other project types, while allowing the comparison of results and identification of significant trends, their primary source of information is the opinion of stakeholders. A new approach is proposed in this research, considering the importance of rural road projects and their contribution to the achievement of sustainable development goals. The goal is to analyze empirical data of rural road construction projects available through the Colombian Government’s open data platform, to identify which are the significant variables causing cost and time deviations in this project type. The database includes projects that have completed their closing phase, all project work is finalized, and the scope has been achieved. The contracting method corresponds to Design–Bid–Build, the traditional delivery method where the agency contracts separately for design and construction services [20], and the research is focused in the construction stage. The structure of the paper is as follows: Section 2 describes the research method, including the data collection and the identification of the variables. Section 3 presents the results indicating the main variables generating cost and time overruns through univariate, bivariate, and multivariate analysis. Section 4 presents an interpretation of the results, citing agreement or disagreement with previous studies. Finally, Section 5 discusses the main conclusions, including the implications of the findings and recommendations for future research.

2. Research Methods and Data Collection

To achieve the goals stated in the previous section, the authors followed the overall research method summarized in Figure 1. The first stage was the data collection, starting with a literature review for identifying the variables considered in previous research related to cost and time overruns. Next, data gathering was performed, including a web search for road construction projects, in the open data platform of the Colombian Government, and filtering rural road projects. Projects awarded through the three types of competitive processes allowed by Colombian law were also chosen. These processes included competitive bidding, in which a contractor is selected in equal opportunities; abbreviated selection, a simplified process carried out after a public tender has been declared void; and minimum contract, the quickest and most straightforward procedure for low contract values [21]. In the second stage, variables in the dataset were analyzed through an exploratory data analysis, identifying their nature and main features. It was also developed the outlier´s identification, and the descriptive statistics were obtained through univariate analysis. Finally, the third stage consisted of the identification of the significant variables causing time and cost deviations in rural road projects, applying bivariate, and multivariate statistical tools. All models developed in this research were built using free software R, and Python. An in-depth explanation of these steps is included in the following paragraphs.
Based on Gransberg and Villarreal [22], the research team defined the dependent variables, time deviation, and cost deviation, identifying projects that required change orders to increase the initial cost or deadline (see Equations (1) and (2)).
T i m e   d e v i a t i o n = F i n a l   d e a d l i n e   o r i g i n a l   d e a d l i n e   o r i g i n a l   d e a d l i n e
C o s t   d e v i a t i o n = F i n a l   c o s t   c o n t r a c t   v a l u e   c o n t r a c t   v a l u e
Later, the research team explored the data included in the platform of the Colombian Government (www.datos.gov.co). Filtering by road projects, and by reviewing the contractual object, it was possible to extract 555 projects related to rural roads in the period 2015–2018. Next, the research team identified variables involved in previous studies related to cost and time deviations and looked for the availability of them in the data. An exploratory analysis allowed obtaining information about the variables and their nature. Table 1 describes these variables, their nature, and description, how they were measured for numerical variables, and the values for the categorical ones. The variables are organized following the life cycle management in infrastructure projects [23]. The project initiation phase contains eight variables: Project type, owner, geographic location, municipality type, period of execution, estimated cost (budget), original deadline, and project intensity; the project planning phase includes four variables: Contract value, award growth, process type, and contractor type; and the project execution and closure phase has four variables: Additional cost, additional time, final cost, and final deadline. Variables related to cost were converted to legal monthly minimum salaries in Colombia; this is an official value established by the Government each year that allows considering the effect of inflation. In this research, this unit is included as Minimum Salaries for variables related to cost.
Then, the sample characterization was developed, obtaining the descriptive statistics for the numerical variables and the frequency and percentage for the different groups of the categorical variables. This characterization also allowed finding trends, outliers, and getting information about variability in the dataset. In this stage, the interquartile range method (IQR) was applied for the numerical variables to identify and eliminate extreme outliers, which are unique values in the dataset. It can bias statistical analyses [27]. This method defined the extreme outliers obtaining the first quartile (Q1), the third quartile (Q3), and the IQR range of the data (See Equation (3)).
IQR= Q3 − Q1
Those pieces of data higher than Q3 + 3IQR and less than Q1 3IQR are considered outliers. Eliminated projects were those with a high estimated cost (more than 2500 minimum salaries) and with a positive award growth (which is also not possible under Colombian laws). Therefore, 535 projects were finally included in the research.
Next, a bivariate analysis established the relationship between the independent variables and the dependent variables time and cost deviation. Different tools were chosen considering the type of the variables, analyzing the hypothesis test of each one, determining the level of significance, and also calculating the p-value. A p-value ≤ 0.05 indicates in this study strong evidence to reject the null hypothesis [28]. Spearman’s Rho, a nonparametric test (because the data do not fit a normal distribution), was calculated to compare time and cost deviations with each numerical variable [29,30]. Spearman’s Rho varies from −1.00 to +1.00, where 1 means a perfect linear positive correlation, and −1 means a perfect linear negative relationship [28]. The null hypothesis, in this case, is that there is no association between the two variables.
On the other hand, the nonparametric test Kruskal–Wallis was implemented to compare each one of the categorical variables with time and cost deviation. The nonparametric behavior between the data corresponding to each category was verified. This test analyzes if there is any difference in the median values of groups or treatments. In this research, those involved in the categorical variables [31]. The null hypothesis, in this case, is that the population medians are equal for all groups. Kruskal–Wallis allows identifying if groups involved in the categorical variables present a different behavior concerning the dependent variables analyzed. However, it does not determine for which groups the difference is statistically significant, so the Wilcoxon test was used to compare paired data and establish it. The null hypothesis, in this case, is that the median difference between pairs of observations is zero, so this allowed the identification of categories with similar behavior that can be grouped [32].
Finally, multivariate analysis, through the Random Forest (RF) technique, assessed the effect of considering all variables interacting simultaneously [33]. Random Forest allows including both numerical and categorical variables in the analysis; therefore, this technique avoids the process of transformation or discretization of variables, which leads to loss of information [34,35] The advantages of Random Forest also include an improvement in the understanding of variables since it classifies them in order of importance considering their interaction, and even analyzes a nonlinear behavior of the variables [36]. RF is an ensemble learning method that creates numerous decision trees. For each decision tree, a random subset of samples (projects for this case study) and a random subset of variables are considered. It aggregates the results and, after multiple iterations, gives the ranking of variable importance [37].
On the other hand, as the dependent variables are numerical, regression trees are implemented. Those are built by recursively partitioning the sample into homogenous groups. Each split is based on the values of a variable, and it is selected according to the maximum reduction of the overall impurity of the node achieved. The impurity is measured as the total sum of squared deviations from node centers [38].
In the Random Forest algorithm, two control parameters are included: The number of trees used in the forest, and the number of random variables used in each tree. One-third of the observations are not used to fit the model and are used to validate it. The Out-of-bag error score (OOB) is the error computed on samples not included during training [39]. An optimal number of trees is obtained by reviewing the model performance, looking for a threshold from which increases in the number of trees would bring no significant performance gain, and would only increase the computational cost. Previous literature suggests that a random forest should have several trees between 64 and 128 [40]. An optimal number of predictors is obtained after running the optimal number of trees and testing how OOB error changes according to the number of random attribute candidates in each tree and selecting which reduces it [39]. After running the models, RF extracts a summary of the importance of each variable, considering how the normalized error increases when it is eliminated. A large value indicates an important predictor [38].

3. Results

3.1. Univariate Analysis

This sub-section includes the sample characterization, describing the main information of the variables involved in the dataset through univariate analysis. A description of the dependent variables, time, and cost deviation is included in Table 2 for the 535 projects. For the time deviation, there is no legal limitation, and there are projects with values up to 4.5. In Colombian public contracts, the cost deviation should not be higher than 0.50 of the estimated cost [41]. However, one project reported 0.53 for cost deviation. Although the average of the data does not indicate a significantly high value, it is essential to note that many projects have no deviation, and the median for both cases is zero.
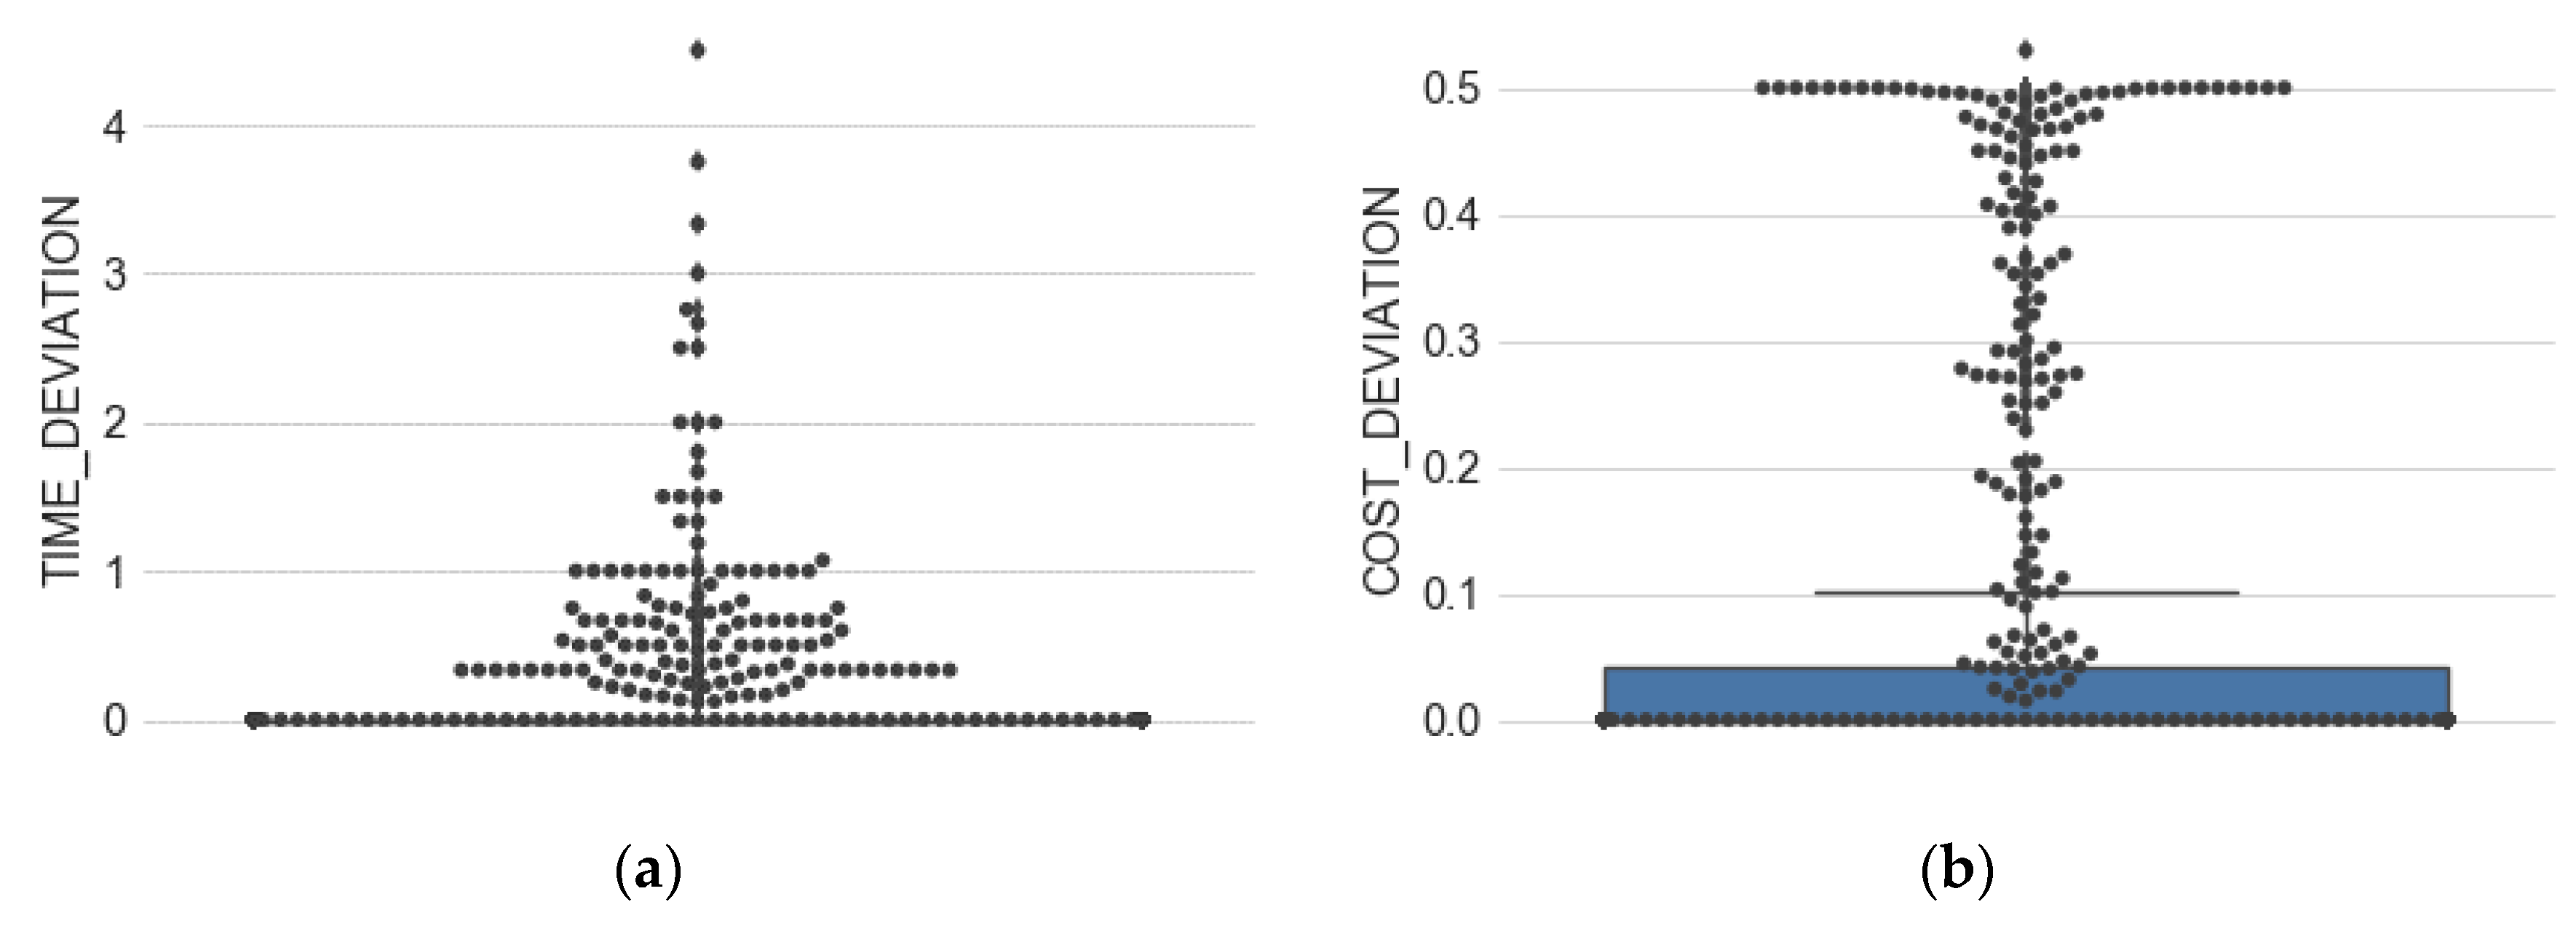
Figure 2 shows a higher variability in cost deviation data; the interquartile range (IQR) is larger. Additionally, a considerable number of projects do not report deviations. Of the 535 projects, 144 (26.92%) report cost deviation, 124 (23.18%) report time deviation, and 82 reports both simultaneously (15.33%).
If only the projects reporting any deviation (186 data) are analyzed, the mean for time deviation is 0.53, and for cost deviation, it is 0.24 (See Table 3). Data are right-skewed for time deviation; the median is less than the mean. For cost deviation, the histogram is close to symmetric; the mean and median are close to each other.
Regarding time deviation (Figure 3a), the boxplot shows that half of the data are between 0.33 and 4.5. For the cost deviation (Figure 3b), half of the data are between 0.25 and 0.53.
A description of the independent numerical variables is included in Table 4. There are projects of different cost and duration, and project intensity also presents a wide range in the values. Data are right-skewed for all variables since the median is less than the mean for all cases except for the award growth. Award growth is a variable that cannot have a value greater than zero; most cases are closer to zero, but it reaches values as low as −0.29.
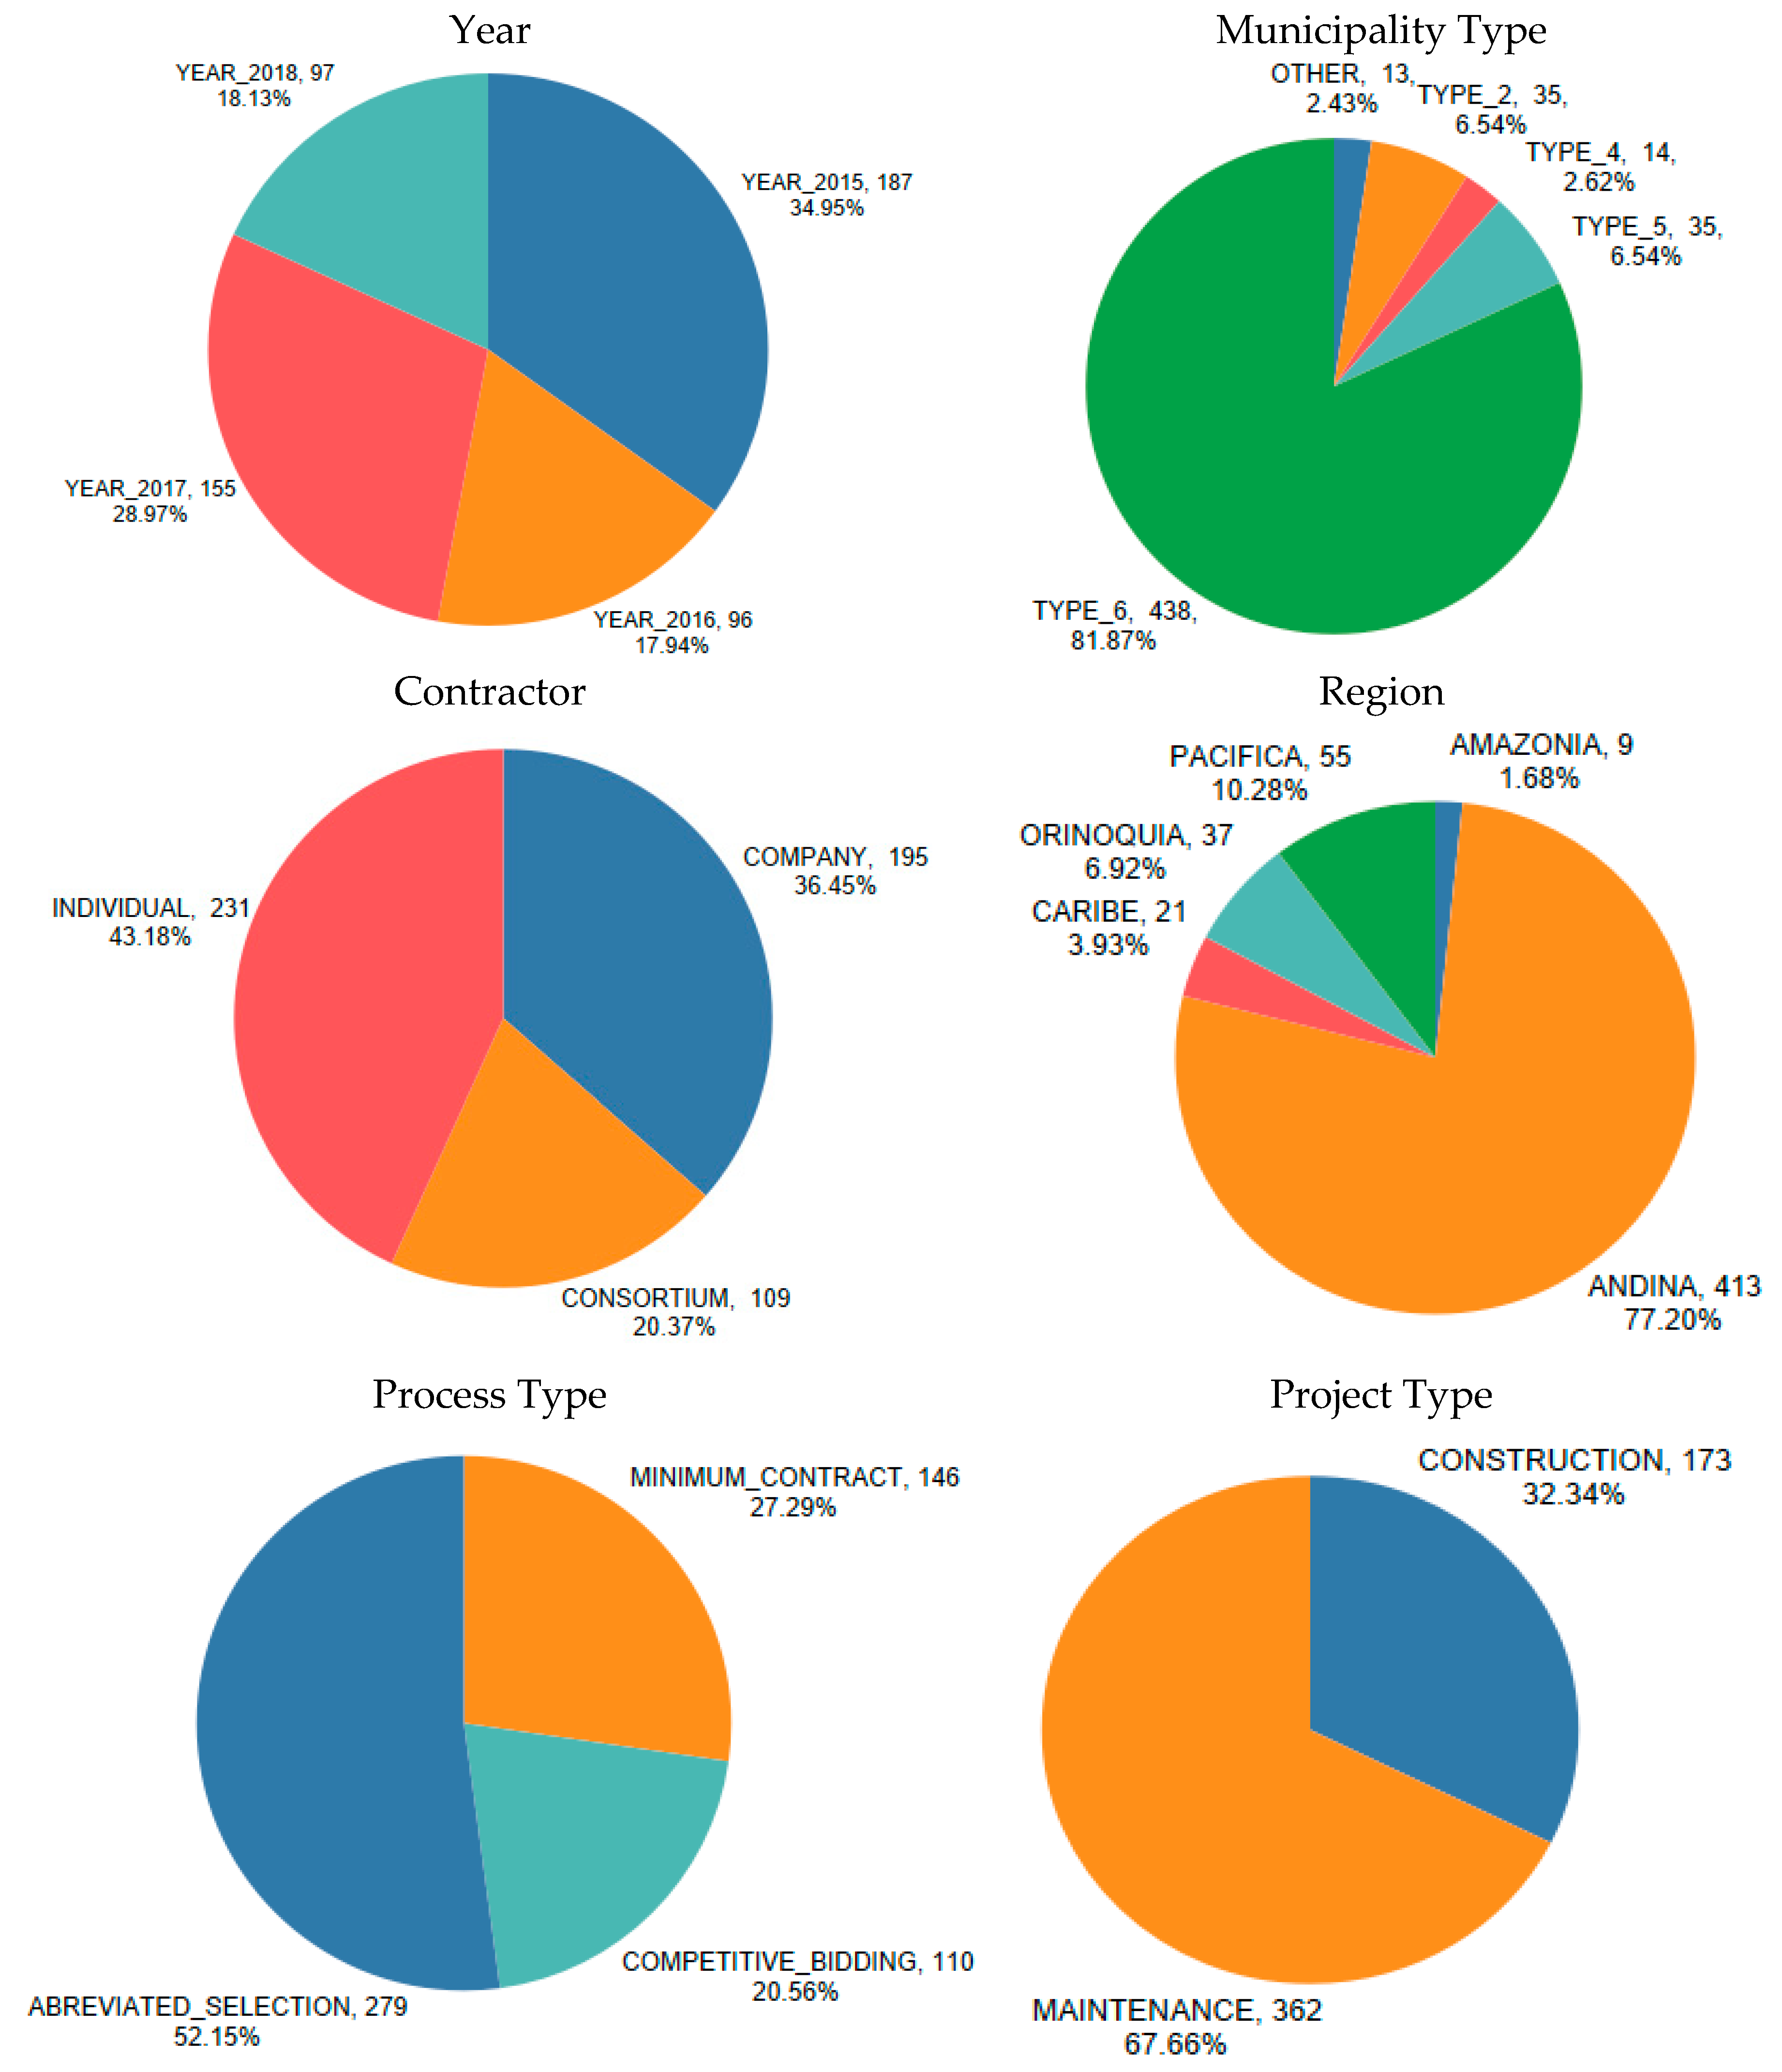
Concerning the categorical variables, the frequency and proportions are included in Figure 4. Regarding the year, information from 2015 to 2018 is considered. For the project owner, the database reports that more than 98% of cases are from a municipality. The rest of the cases are from department governments or public agencies; therefore, this variable “Project owner” is not included in the statistical analysis to avoid bias. In Colombia, municipalities are classified in categories from 1 to 6 depending on the number of inhabitants and the income. Most of the municipalities are type 6 (the lowest). Group “OTHER,” corresponds to Municipality 1 (0.19%), Municipality 3 (0.75%), and project developers that are not municipalities (1.49%). Concerning contractors, most of the projects are carried out by individual contractors, but also companies and consortiums are involved.
Regarding the geographic location, Colombia is divided into five regions, “Andina,” which corresponds to the most populated and economically active area of the country, concentrates the majority of projects with more than 77%. Regarding process type, abbreviated selection has the majority with more than 52%, and competitive bidding has the smallest proportion. In respect of project type, more than 67% corresponds to maintenance projects, those related to existing roads, and others consist of new construction.

3.2. Identification of Significant Variables through Bivariate Analysis

This sub-section includes the results for bivariate analysis comparing time and cost deviations with each one of the independent variables. First, Spearman’s Rho was calculated for the numerical variables. Then, the Kruskal–Wallis test was included for the categorical variables, complemented with the Wilcoxon test for the significant ones.

3.2.1. Matrix Correlation

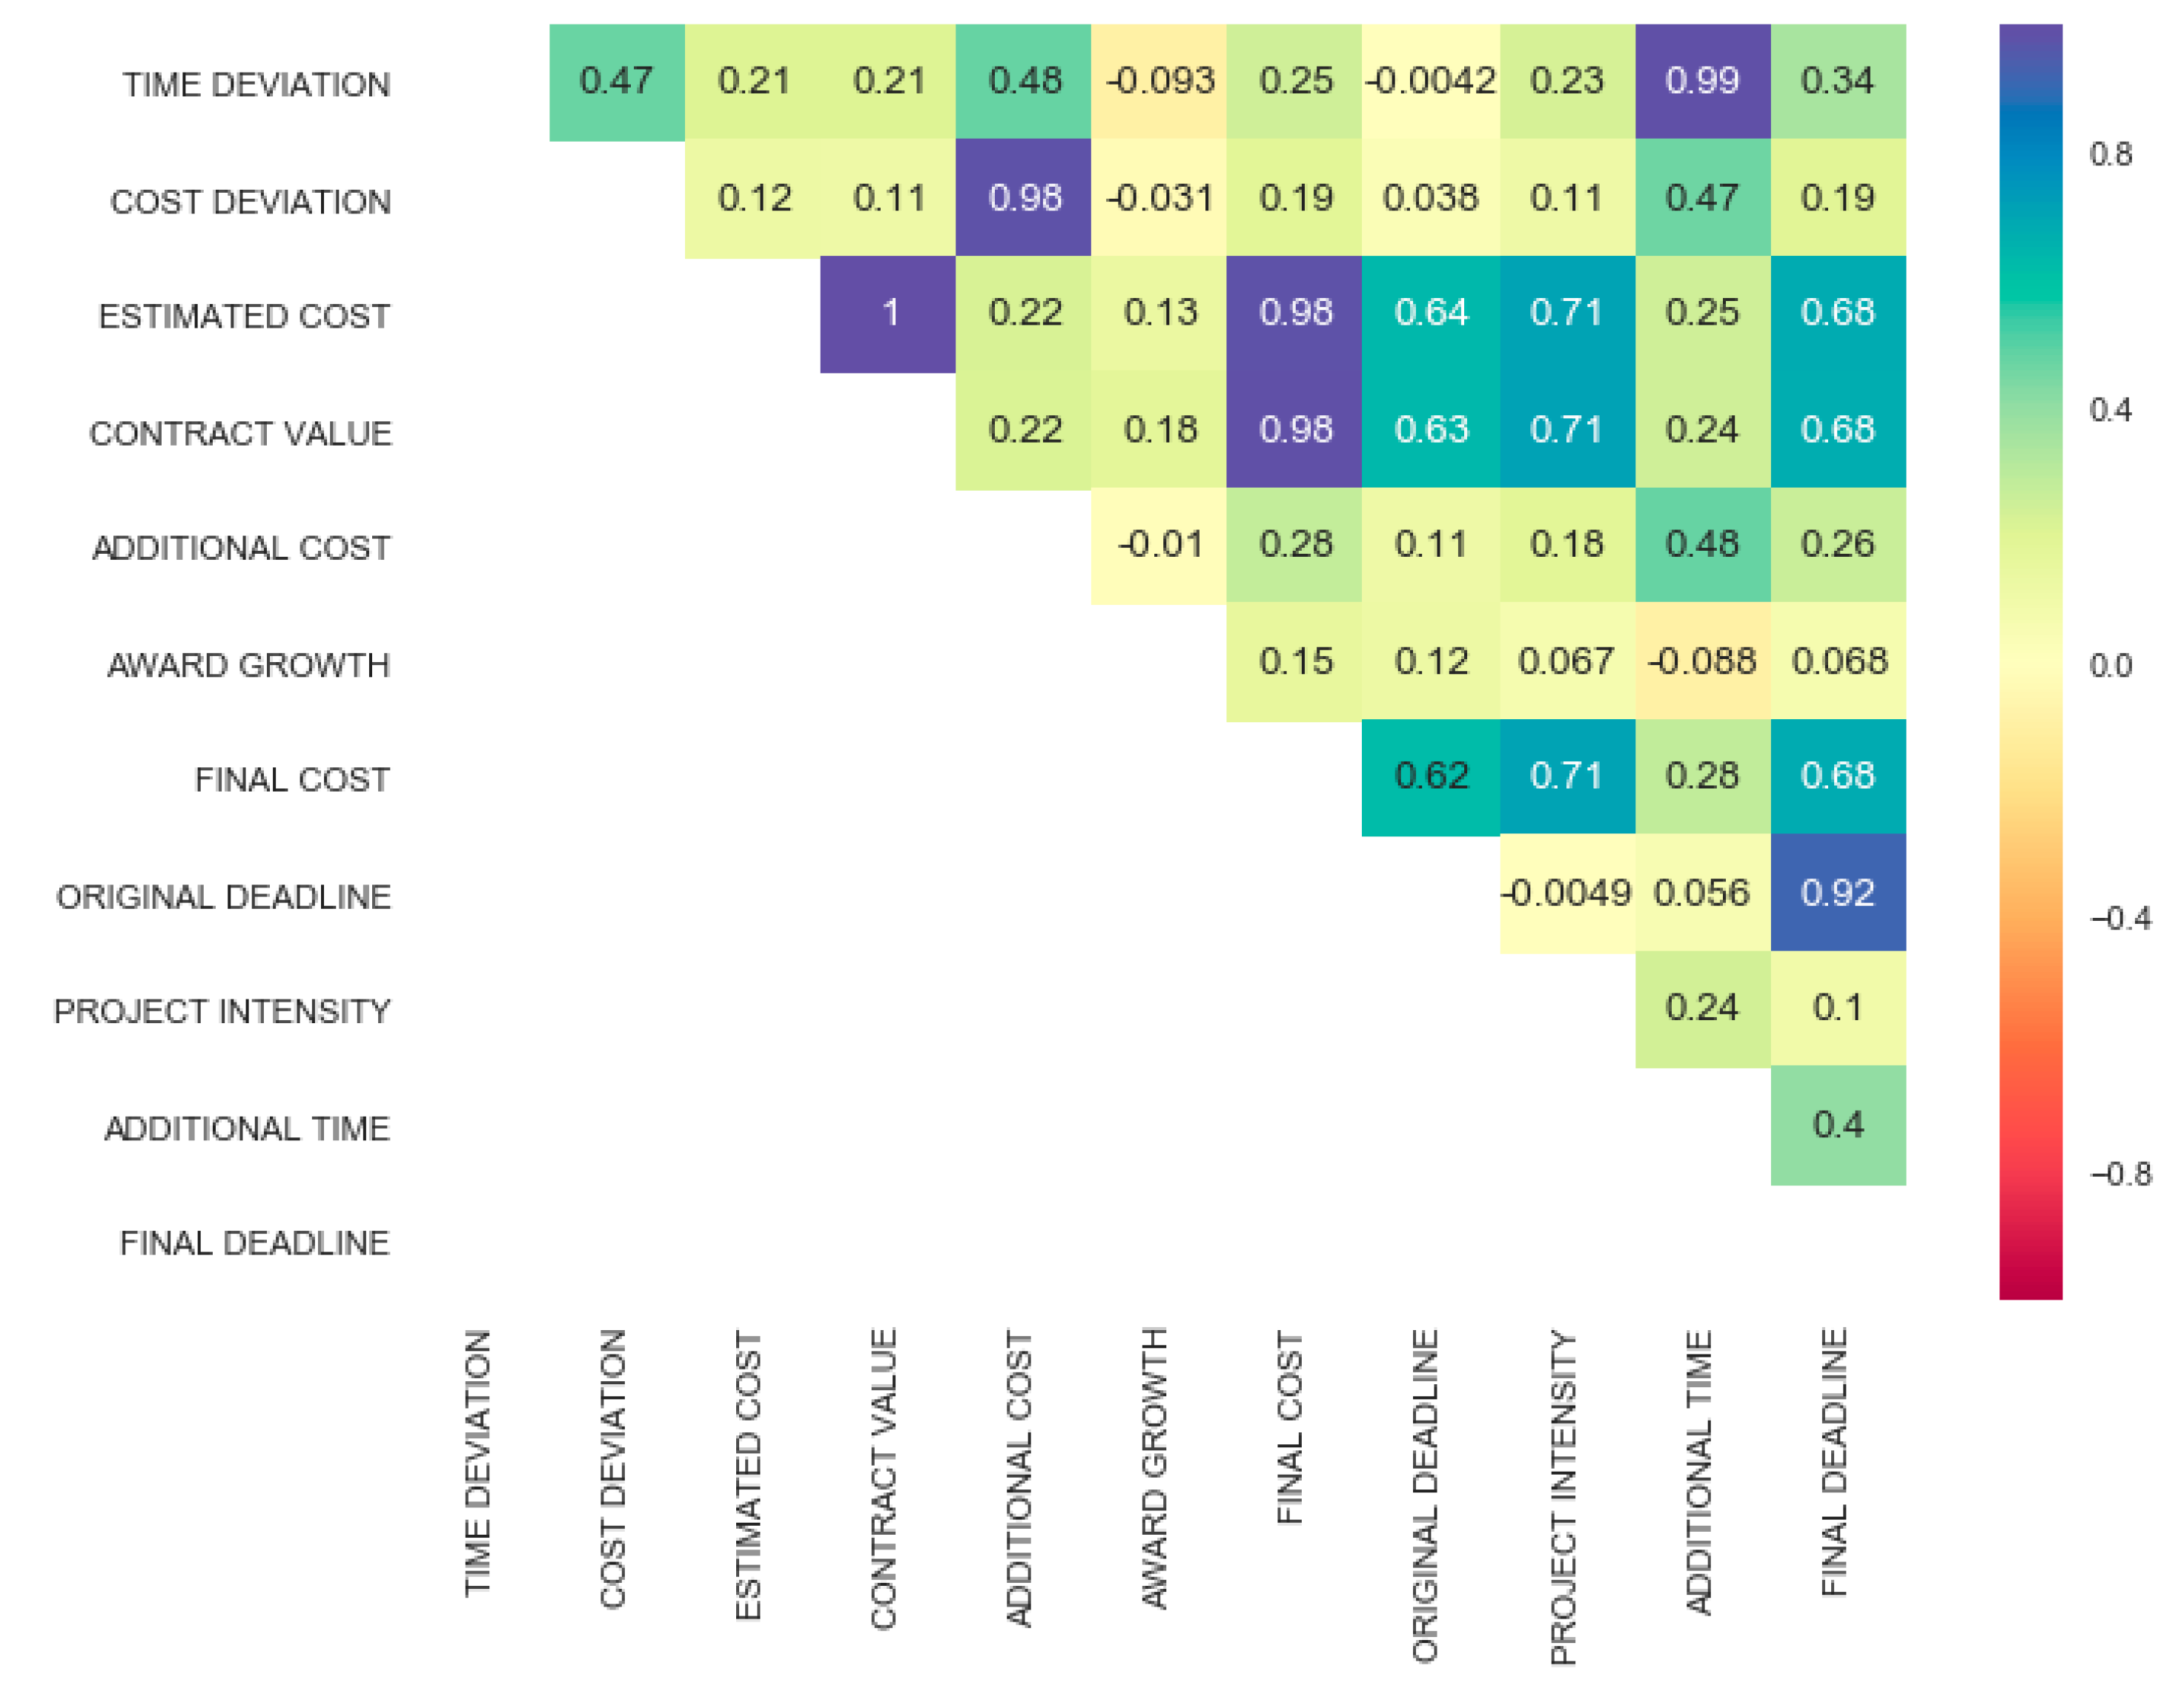
The analysis of the correlation is included in a matrix for the numerical variables, calculating the Spearman’s Rho (See Figure 5). The color blue means a positive relationship, and red negative, the higher the intensity of the color, the higher the correlation. Variables highly correlated (more than 0.90) are time deviation with additional time, cost deviation with additional cost, estimated cost with contract value, estimated cost with the final cost, contract value with the final cost, and original deadline with the final deadline. Highly correlated variables were eliminated for further analysis, taking into account for time deviation: The estimated cost, the additional cost, the award growth, the original deadline, and the project intensity, and for cost deviation taking into account the estimated cost, the additional time, the award growth, the original deadline, and the project intensity. The significance of the correlation was obtained through the p-value, with a threshold of 0.05. A comparison between variables cost and time deviation got a Spearman′s Rho of 0.47 with a p-value less than 0.01, indicating a positive association between cost and time deviation that is statistically significant.

3.2.2. Time Deviation

This section first includes the significant numerical variables regarding the time deviation, according to Spearman’s Rho. Variables belonging to all phases of the project life cycle were identified (See Table 5), and the original deadline was identified as non-significant. The additional cost correlates with a higher value. Project intensity and estimated cost have a similar relationship with the dependent variable and award growth a weaker negative relationship.
For categorical variables, the procedure for implementing the Kruskal–Wallis test allowed the identification of four significant variables belonging to the project initiation and the project planning phases: Year, region, municipality type, and process type. For these variables, the Wilcoxon test was implemented to compare paired data and define new groups, see Table 6. For each group, the minimum, the maximum, and the mean is included. Regarding the year, the behavior of 2016 is significantly different from the others. This year corresponds to that in which the council mayors begin their governments of four years. The mean of the year 2016 is higher than others, and these groups also contained the maximum deviation. This result requires further analysis to determine if it corresponds to the lack of evolution of the learning curve or other factors, as the percentage of projects developed in this year (17.94%) is not significantly different from the others.
Regarding region, “Pacifica” (10.28% of the cases), with a high level of poverty and rurality, shows a better performance in terms of time deviation with a lower value of the mean. Regarding municipalities, “Type 6” (81.87% of the cases) is significantly different from the others. These municipalities with a low budget and limited resources are reporting a better behavior in time deviation, indicating a lower value for the mean. Finally, for process type, competitive bidding is significantly different from the others. Minimum contract and abbreviated selection have a similar behavior regarding time deviation and can be grouped. It was found that competitive bidding (20.56% of the cases) had a higher value of the mean.

3.2.3. Cost Deviation

Significant correlations between cost deviation and the independent numerical variables are included in Table 7. All the correlations are positive, the highest being additional time, explained by the relationship between the two deviations. Estimated cost and project intensity also show that the higher the values of these variables, the greater the differences. Award growth and the original deadline were identified as non-significant.
For the categorical variables, the procedure for implementing the Kruskal–Wallis test allowed the identification of three significant variables: Year, municipality, and process type. For these variables, the Wilcoxon test was performed (see Table 8). The year 2016 (in which the council mayors begin their governments) reports a different behavior. Statistical metrics show that the mean of 2016 is higher from others, and this group also contained the maximum value. These results, similar to time deviation, require further analysis that allows understanding the reasons.
Regarding municipalities, “Type 6” (81.87% of the cases) is significantly different from the others, similar to time deviation. The mean cost deviation has a higher value for municipalities different than “Type 6”. Regarding process type, competitive bidding is significantly different from the others. Competitive bidding has a slightly higher mean of cost deviation and the maximum value.

3.3. Identification of Significant Variables through Multivariate Analysis

This section includes the results for multivariate analysis, through applying Random Forest, to compare time and cost deviation with all the independent variables interacting together.

3.3.1. Time Deviation

This analysis aggregate results from the previous ones, considering only no-highly correlated numerical variables: Estimated cost, additional cost, award growth, original deadline, and project intensity. For categorical variables, there were included: Year, municipality type, process type, project type, region, and contractor. The new confirmed groups for these variables were considered, aggregating results of Kruskal–Wallis and Wilcoxon analysis. In the Random Forest model for time deviation, a comparison of the error reduction and the number of trees determine the optimal number of trees, in this case, 92.
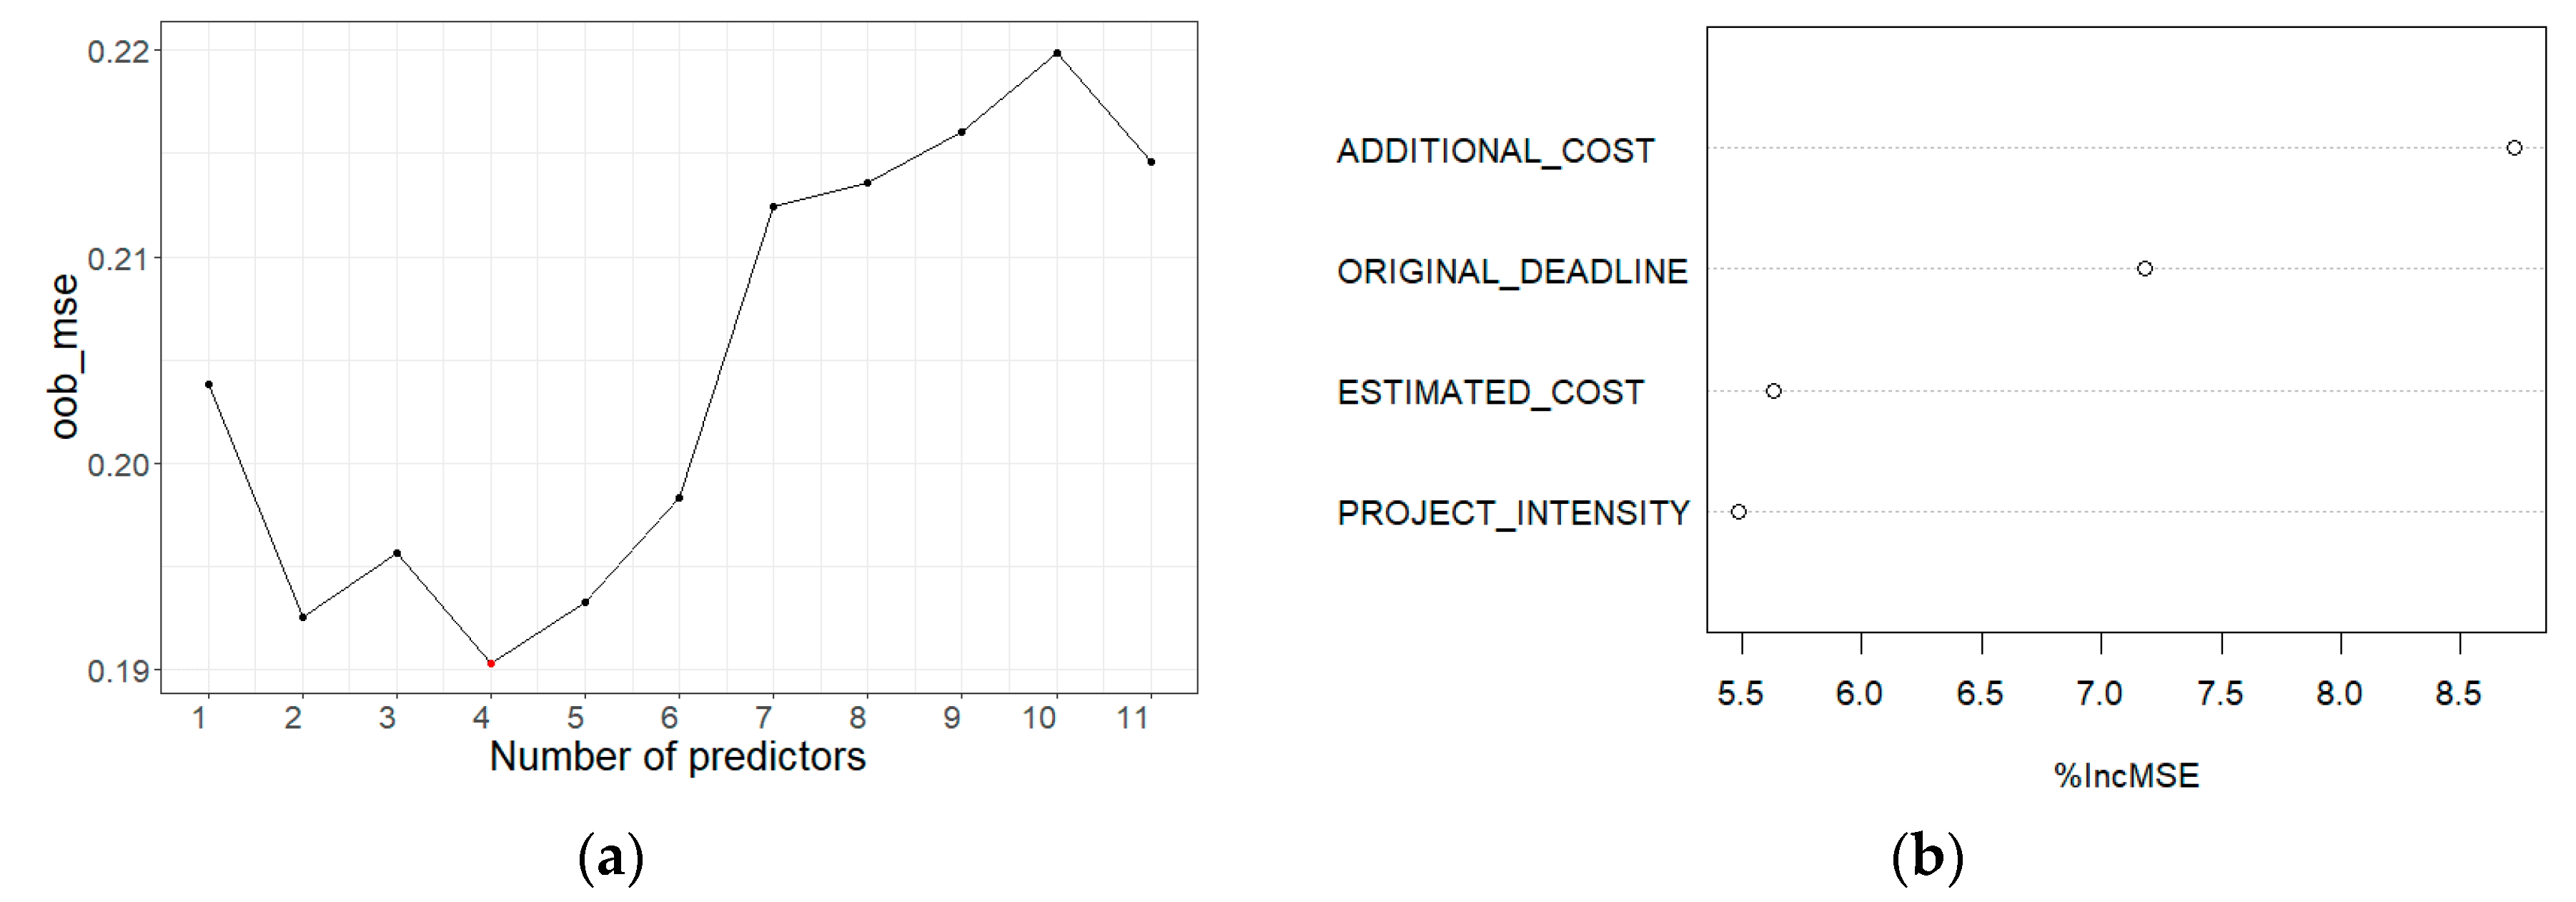
Then, 92 trees were built, selecting variables and data randomly. After running the different models, an optimal number of four predictors is obtained, according to the reduction of the Out-of-bag error (oob_mse), see Figure 6a. After, the most important predictors are ranked, considering the increment in the Mean Squared Error (MSE) if the variable is eliminated (see Figure 6b). In this case, only numerical variables are important being the additional cost in the first place, followed by the original deadline that was not identified in the previous analysis, estimated cost, and project intensity.
The original deadline was not identified as significant in the bivariate analysis, and random forest ranks this variable in the second place of importance. A scatterplot for the original deadline is included in Figure 7. The plot indicates that a partition is a better option for this variable (for more than approximately 50 days of the original deadline, the behavior is different) because this has a nonlinear response.

3.3.2. Cost Deviation

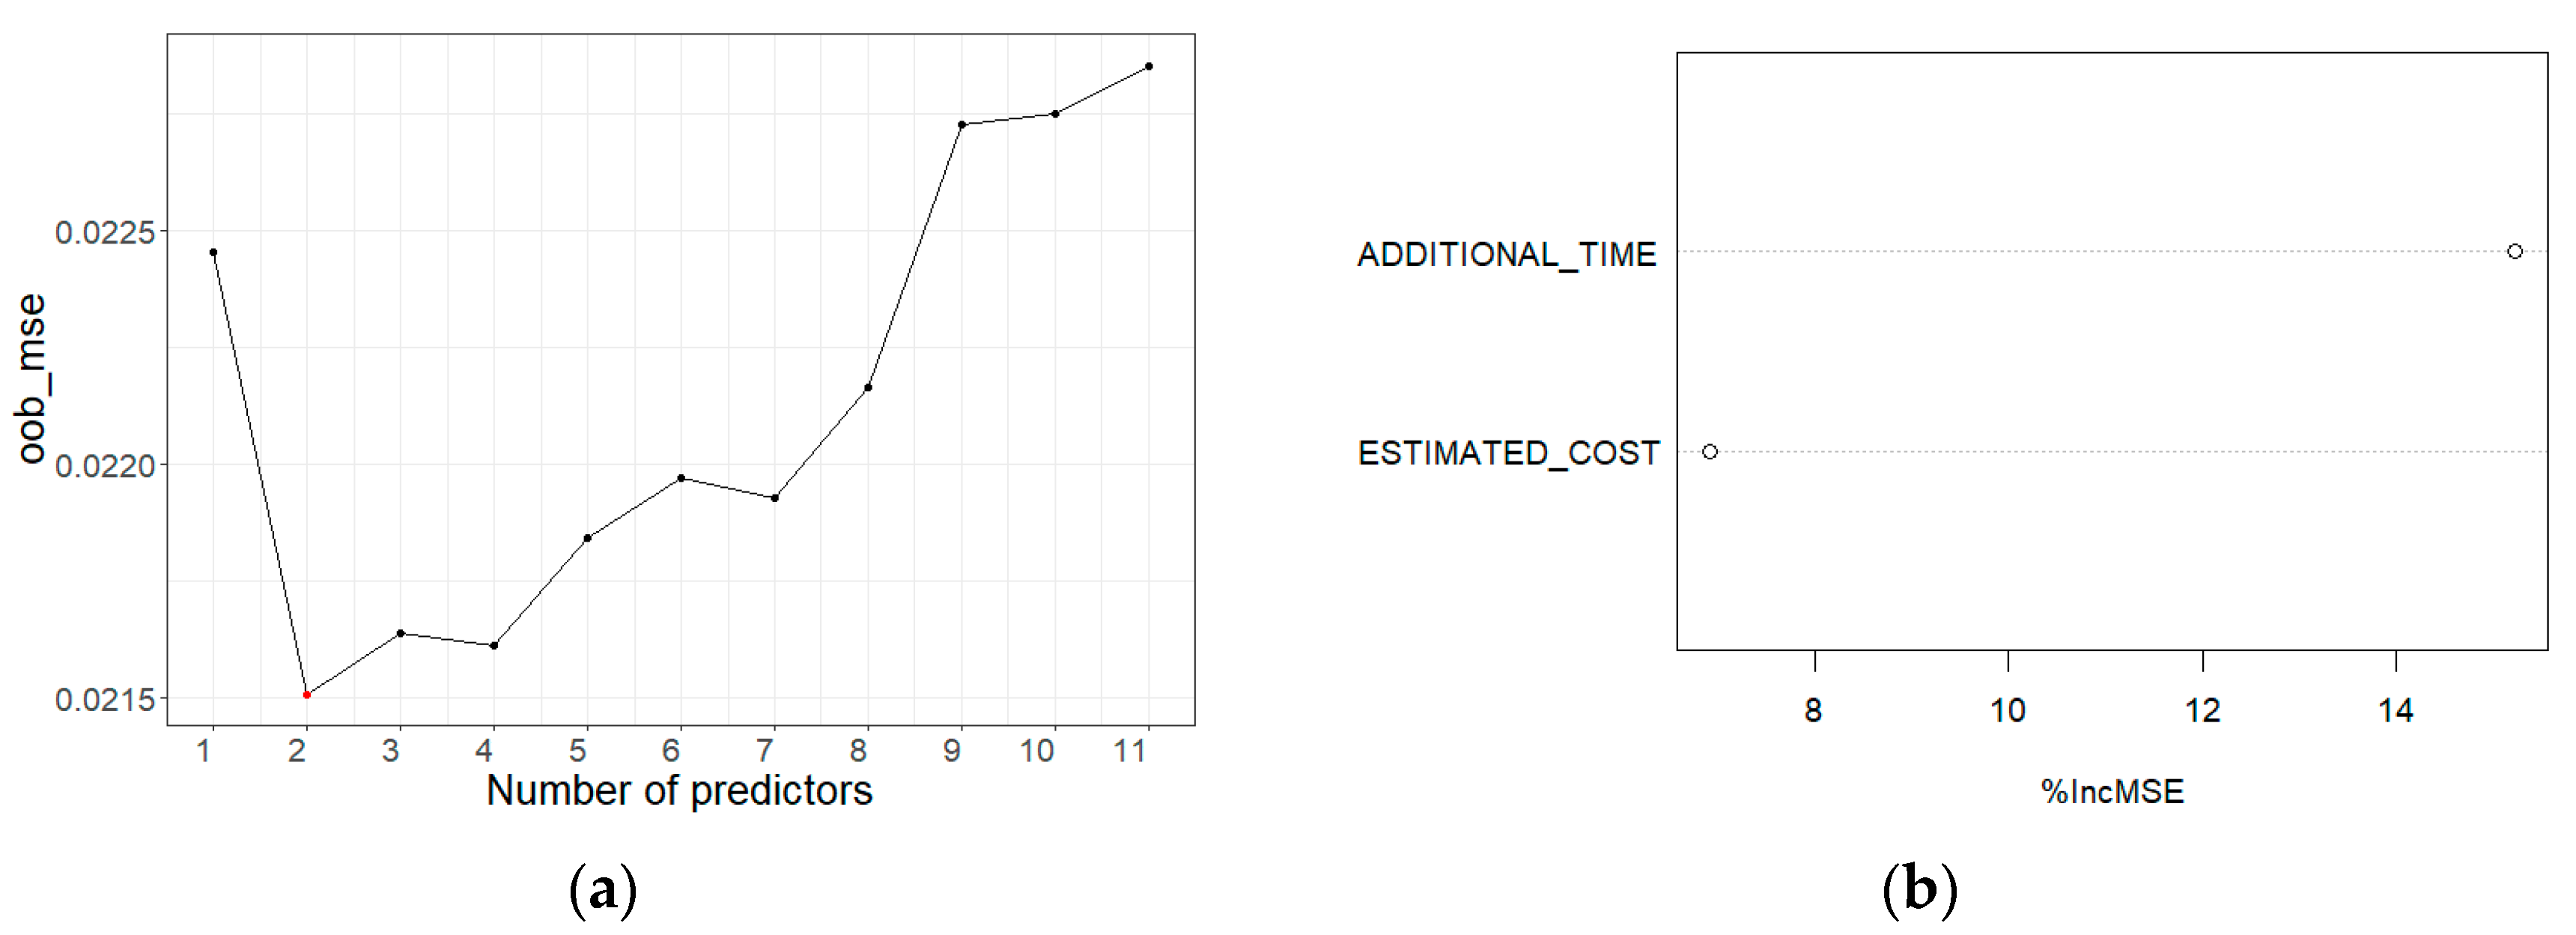
This analysis aggregates the results from the previous ones, considering only no-highly correlated numerical variables: Estimated cost, additional time, award growth, original deadline, and project intensity. For categorical variables, there were included: Year, municipality type, process type, project type, region, and contractor. The new confirmed groups for significant variables were included, aggregating results of Kruskal–Wallis and Wilcoxon analysis. In the Random Forest model for cost deviation, the optimal number of trees was 117, and the optimal number of two predictors is obtained (see Figure 8a). After the most important predictors are ranked (see Figure 8b), in this case, only numerical variables are important being the additional time in the first place, followed by the estimated cost.

4. Discussion

This study shows first that, in Colombia, the magnitude and frequency of delays and cost overruns in rural road construction projects are similar to global findings. However, this study provides insights about cost and time overruns based on publicly available data, as opposed to most previous studies, where results were gathered based on stakeholders’ perception. Notably, the sample of 535 projects used in this research is also higher than previous research, as described below. Regarding time deviation, this study found a mean percentage of 18.55%, considering all projects included in the database. This result is in line with early research in Hong Kong that revealed a time overrun of 14% in infrastructure projects, comparing them with government building projects (9%) and private building projects (17%) with a sample size of 111 projects [8]. Other research reported that 75% of the participating contractors and 70% of the participating consultants indicated that the average delay for road construction projects is between 10 and 30% of the original project duration [14]. For cost overruns, this research found a mean percentage of 8.36%. Previous studies compared three levels of project complexity and the relationship with cost overruns, analyzing data reported in 22 primary articles worldwide. Road projects were included in the medium complexity projects, reporting a mean of cost overrun of 8.97% [42]. Other researchers analyzed data of 258 projects in 20 nations, comparing different project types to determine the magnitude. Results showed that road projects appear to be relatively less predisposed for cost escalation, although actual costs are higher than estimated costs, with an average of 20.40% [7].
Another aspect to consider is that in this research, there are a significant number of projects that do not report overruns. Considering only the projects reporting deviations, the mean percentage of time overrun reaches values of 52.95% with a maximum of 450%. For cost overruns, it is 24.03%, with a maximum of 53%, in this case, for the restriction in the Colombian law. Another study in Colombian public infrastructure also has found delays as high as 342% of the original value [43]. Concerning cost deviation for transport infrastructure projects in Asia, a maximum of 98.23% of the original contract value was reported [44]. Higher values included 164% for the Dutch transport infrastructure project [26] and 337% in infrastructure projects in Hong Kong [19]. However, other authors have reported that there are no values greater than 100% of the original contract duration in road projects [14].
Regarding frequency, this study found 23.18% of projects reported time deviation and 26.92% cost deviation. Other researchers established higher values; a study revealed that 40% of construction projects are facing time overruns in India [9]. Concerning cost escalation, it has been found that 9 out of 10 transportation infrastructure worldwide projects are underestimated [10], and 55% of the Dutch transport infrastructure projects reported actual costs larger than estimated [26]. Although, in general, the average values found in this research are similar to other studies, different project types and sizes have been including, and most of the papers analyze individual countries. More research based on empirical data in the future could help to compare results and determine the reasons for overruns. Some authors mentioned that cost estimates used in decision-making for transport infrastructure development are systematically and significantly deceptive. Cost underestimation is used strategically to make projects appear less expensive than they are to gain approval from decision-makers to build the projects [7,10], which could be determined by analyzing more significant samples. Other authors mentioned that differences between studies could be related to the variation in sample size, by the differences in the geographical area that is covered, and the project types that are included; also, the optimism bias could be a significant cause of unrealistic estimates [26].
This study also identified the significant variables generating delays and cost overruns, among 16 variables. With regards to the project initiation phase, through bivariate analysis, four variables were identified as significant for both deviations: Estimated cost, project intensity, municipality type, and year. The estimated cost (budget) was determined as significant for both overruns in this study through multivariate analysis. The correlation between this variable and the dependent variables is positive, which is in line with other researchers [44], who analyzed transport infrastructure projects in Asia, confirming that greater values of contracts generate higher cost deviations. However, other studies considering different road types reported that larger-scale projects tend to have smaller cost overruns [19]. One possible explanation could be the level of management in larger projects compared to smaller ones [25]. Project intensity was identified as significant through bivariate analysis for both deviations and in the Random Forest model for time deviation. Previous research based on stakeholder’s opinions reported “poor planning and scheduling” as a significant factor generating time and cost deviations in infrastructure projects [45,46,47]. This factor could include project intensity since a higher value represents higher deviations, indicating failures in the project planning.
Regarding territorial planning, this research found that municipalities different than “Type 6”, are the worst performers, being municipalities with more considerable resources. This municipality category is related to the geographical location, for which a previous study also found significant for cost overruns [25]. Concerning the period of time, previous research reported this variable as not significant [10,19,25]; however, in this study, the year in which council mayors begin their term is significant, with weakest project performance. It is a new finding that deserves future research since, in this study, only one of the years considered corresponds to this condition, and it would also be interesting to be able to compare this finding with the situation in other regions or countries.
With respect to the project planning phase, through bivariate analysis, the variable process type is significant for both deviations. The most competitive process is the one with the worst performance, which also deserves further research. Other studies have reported errors or problems in bidding and award as a factor causing overruns [46,48]. Although in this research, only Design–Bid–Build projects are included, other researchers have reported that alternative contracting methods affect and cost growth and schedule growth, which should be explored by project planners [20].
Finally, with respect to the execution phase, additional time is significant for cost deviation and additional cost for time deviation, which demonstrated the relationship between both, in line with early studies that also showed it [49,50,51]. The results of the multivariate analysis also demonstrated this relationship between cost and time performance, being the additional cost is the most important predictor for the time overruns and the additional time for cost overrun. Besides, the multivariate analysis also allowed identifying the original deadline as a significant variable for time deviation; in line with previous studies that also found this, developing models to estimate time and cost overruns [52].

5. Limitations of the Research

This research is an empirical study that only includes rural road projects in Colombia. Although further investigation in different countries or regions is necessary, the findings provide information that should contribute to review the existing practices and compare results. This research evaluated two aspects included in the triple constraint of cost, time, and scope, as stated in the project management literature, in which a successful project has been defined as one that “has achieved its technical performance, maintaining its initial schedule and budget” [6]. The project scope was not included as an independent variable. However, all the projects are finalized and closed. It implies that the object of the contract has been fulfilled.
This research has identified significant variables generating time and overruns included in previous research, but also available in the database. However, project managers must also consider other factors not included in this analysis regarding the nature of each project with practices like risk analysis.

6. Conclusions

This research included empirical research on the performance of rural road projects in Colombia. These projects are significant in meeting sustainable development objectives. On the positive side, there is an important number of projects that have been developed within the time and cost initially established. Still, the reported deviations are considerable. This study provides information on the factors that generated them, contributing to projects developers and decision-makers in the existing practices. The transparency in the publication of public procurement in Colombia facilitated the development of this research, allowing for the analysis of real data on all public procurement.
Based on the statistical analysis, for the project initiation phase, it can be concluded that the estimated cost (budget), project intensity, year, and municipality are the significant variables for both deviations. Additionally, for time deviation, the original deadline is also a significant variable. Project planners should consider the estimated cost and project intensity as critical factors in the initial stages of the project life cycle; hence, higher values of them are related to more considerable deviations. In contrast, projects with shorter durations are reporting higher time deviations in percentage. Projects executed in the year that council mayors start their periods and those developed in municipalities with more significant resources have the weakest performance. Therefore, project owners must ensure permanent supervision in these cases, and an analysis of the documents generating change orders for these conditions would be needed.
For the project planning phase, the results show that projects awarded using the competitive process have the worst performance. This finding requires further research that analyzes the bidding requirements and the qualification process to determine factors that explain it through new efforts and in-depth investigation.
Moreover, for the project execution and closure phase, results confirm a relationship between cost and time performance that is also identified considering all variables interacting together.
The authors’ contribution consists of a better understanding of the causes of delays and cost overruns in rural road projects, by using statistical techniques and using real data sources, helping to enhance the body of knowledge within the subject area. The results provide a useful understanding to researchers and industry practitioners to focus on few factors and take proactive measures for the timely delivery of public construction, especially for crucial projects such as rural roads in isolated territories that contribute significantly to achieve the Sustainable Development Goals.
Further research should focus on groups that show different behavior like competitive bidding, including additional variables as bidding requirements, qualification systems, and the number of bidders.
Another aspect that requires further analysis is the fact that in the year in which council mayors start their terms, the project performance is weakest. Specific studies with the stakeholders could help to identify the reasons and determine mitigation measures. The evaluation of quality projects and the verification of the need identified in the initial stage was satisfied, and also could be analyzed in further research. It implies applying research methods such as site visits, evaluation of technical documents, and interviews with stakeholders like project users.

Author Contributions

Conceptualization, A.G.-C., A.S-B., E.P., and J.L.P.-T.; Methodology A.G.-C., A.S.-B., E.P., L.M.-D. and J.L.P.-T.; Software, A.G.-C. and L.M.-D; Validation, A.G.-C., A.S.-B., L.M.-D. and E.P.; Formal Analysis, A.G.-C., A.S.-B., E.P., L.M.-D. and J.L.P.-T.; Investigation A.G.-C. and J.L.P.-T.; Resources A.G.-C. and J.L.P.-T.; Data Curation, A.G.-C.; Writing—Original Draft Preparation, A.G.-C. A.S.-B. and L.M.-D.; Writing—Review & Editing, A.G.-C., A.S.-B., E.P., L.M.-D. and J.L.P.-T.; Visualization, A.G.-C.; Supervision, A.S.-B., E.P., and J.L.P.-T.; Project Administration, A.G.-C. and J.L.P.-T.; Funding Acquisition, A.G.-C. and J.L.P.-T. All authors have read and agreed to the published version of the manuscript.

Funding

This research was funded by Pontificia Universidad Javeriana grant number DJE-010-2016 and Universidad de los Andes, Faculty of Engineering.

Conflicts of Interest

The authors declare no conflict of interest.

References

  1. Mihai, F.-C.; Iatu, C. Sustainable Rural Development under Agenda 2030. In Sustainability Assessment at the 21st Century; IntechOpen: London, UK, 2020. [Google Scholar]
  2. Cook, J.; Huizenga, C.; Petts, R.; Visser, C.; Yiu, A. The Contribution of Rural Transport to Achieve the Sustainable Development Goals: Research Community for Access Partnership (ReCAP). Partnership on Sustainable, Low Carbon Transportation; Oxford, UK, 2017. Available online: http://www.slocat.net/wp-content/uploads/legacy/u15/contribution_of_rural_transport_to_the_sustainable_development_goals_paper_final.pdf (accessed on 6 June 2017).
  3. Burrow, M.P.N.; Evdorides, H.; Ghataora, G.S.; Petts, R.; Snaith, M.S. The Evidence for Rural Road Technology in Low-Income Countries. Proc. Inst. Civ. Eng. Transp. 2016, 169, 366–377. [Google Scholar] [CrossRef] [Green Version]
  4. Muzira, S.; de Díaz, D.H.; Mota, B.F.J. Rethinking Rural Road Infrastructure Delivery. Transp. Res. Rec. J. Transp. Res. Board 2015, 2474, 195–202. [Google Scholar] [CrossRef]
  5. Fundación Paz y Reconciliación. FUNDACION PAZ Y RECONCILIACION. Available online: https://pares.com.co/2016/07/28/las-vias-terciarias-del-postconflicto/ (accessed on 6 June 2017).
  6. Frimpong, Y.; Oluwoye, J.; Crawford, L. Causes of Delay and Cost Overruns in Construction of Groundwater Projects in a Developing Countries; Ghana as a Case Study. Int. J. Proj. Manag. 2003, 21, 321–326. [Google Scholar] [CrossRef]
  7. Flyvbjerg, B.; Skamris holm, M.K.; Buhl, S.L. How Common and How Large Are Cost Overruns in Transport Infrastructure Projects? Transp. Rev. 2003, 23, 71–88. [Google Scholar] [CrossRef]
  8. Kumaraswamy, M.M.; Chan, D.W.M. Contributors to Construction Delays. Constr. Manag. Econ. 1998, 16, 17–29. [Google Scholar] [CrossRef]
  9. Iyer, K.C.; Jha, K.N. Critical Factors Affecting Schedule Performance: Evidence from Indian Construction Projects. J. Constr. Eng. Manag. 2006, 132, 871–881. [Google Scholar] [CrossRef]
  10. Flyvbjerg, B.; Holm, M.S.; Buhl, S. Underestimating Costs in Public Works Projects: Error or Lie? J. Am. Plan. Assoc. 2002, 68, 279–295. [Google Scholar] [CrossRef] [Green Version]
  11. Shane, J.S.; Molenaar, K.R.; Anderson, S.; Schexnayder, C. Construction Project Cost Escalation Factors. J. Manag. Eng. 2009, 25, 221–229. [Google Scholar] [CrossRef]
  12. Gómez-Cabrera, A.; Ponz-Tienda, J.L.; Pellicer, E.; Sanz, A. Factors Generating Schedule Delays and Cost Overruns in Construction Projects. In Proceedings of the VIII Encuentro Latinoamericano de Gestión Y Economía de la Construcción, Londrina, Brasil, 23–25 October 2019. [Google Scholar]
  13. Kaliba, C.; Muya, M.; Mumba, K. Cost Escalation and Schedule Delays in Road Construction Projects in Zambia. Int. J. Proj. Manag. 2009, 27, 522–531. [Google Scholar] [CrossRef]
  14. Mahamid, I.; Bruland, A.; Dmaidi, N. Causes of Delay in Road Construction Projects. J. Manag. Eng. 2012, 28, 300–310. [Google Scholar] [CrossRef]
  15. Kamanga, M.; Steyn, W. Causes of Delay in Road Construction Projects in Malawi. J. S. Afr. Inst. Civ. Eng. 2013, 55, 79–85. [Google Scholar]
  16. Santoso, D.S.; Soeng, S. Analyzing Delays of Road Construction Projects in Cambodia: Causes and Effects. J. Manag. Eng. 2016, 32, 05016020. [Google Scholar] [CrossRef]
  17. Yang, J.-B.; Ou, S.-F. Using Structural Equation Modeling to Analyze Relationships among Key Causes of Delay in Construction. Can. J. Civ. Eng. 2008, 35, 321–332. [Google Scholar] [CrossRef]
  18. Bhargava, A.; Anastasopoulos, P.C.; Labi, S.; Sinha, K.C.; Mannering, F.L. Three-Stage Least-Squares Analysis of Time and Cost Overruns in Construction Contracts. J. Constr. Eng. Manag. 2010, 136, 1207–1218. [Google Scholar] [CrossRef]
  19. Huo, T.; Ren, H.; Cai, W.; Shen, G.Q.; Liu, B.; Zhu, M.; Wu, H. Measurement and Dependence Analysis of Cost Overruns in Megatransport Infrastructure Projects: Case Study in Hong Kong. J. Constr. Eng. Manag. 2018, 144, 05018001. [Google Scholar] [CrossRef]
  20. Federal Highway Administration. Alternative Contracting Method Performance in US Highway Construction; Federal Highway Administration: Washington, DC, USA, 2018.
  21. Congreso de la República. Ley 1150 de 2007; Congreso de la República: Bogotá, Colombia, 2007.
  22. Gransberg, D.; Villarreal Buitrago, M. Construction Project Performance Metrics. In AACE International Transactions; EBSCO Publishing: Ipswich, MA, USA, 2002; p. CSC.02. [Google Scholar]
  23. Westland, J. The Project Management Life Cycle: A Complete Step-by-Step Methodology for Initiating, Planning, Executing & Closing a Project Successfully; Kogan Page Publishers: London, UK, 2007. [Google Scholar]
  24. Flyvberg, B.; Skamris, H.; Buhl, S. What Causes Cost Overrun in Transport Infrastructure Projects? Transp. Rev. 2004, 24, 3–18. [Google Scholar] [CrossRef] [Green Version]
  25. Odeck, J. Cost Overruns in Road Construction—What Are Their Sizes and Determinants? Transp. Policy 2004, 11, 43–53. [Google Scholar] [CrossRef]
  26. Cantarelli, C.C.; Molin, E.J.E.; Van Wee, B.; Flyvbjerg, B. Characteristics of Cost Overruns for Dutch Transport Infrastructure Projects and the Importance of the Decision to Build and Project Phases. Transp. Policy 2012, 22, 49–56. [Google Scholar] [CrossRef] [Green Version]
  27. Larose, D.; Larose, C.D. Data Mining and Predictive Analytics. In Data Mining and Predictive Analysis; Wiley: Hoboken, NJ, USA, 2015; pp. 31–48. [Google Scholar]
  28. Alvarado, J.; Obagi, J.J. Fundamentos de Inferencia Estadística; Editorial Pontificia Universidad Javeriana: Bogotá D.C., Colombia, 2008. [Google Scholar]
  29. Hauke, J.; Kossowski, T. Comparison of Values of Pearson’s and Spearman’s Correlation Coefficients on the Same Sets of Data. Quaest. Geogr. 2011, 30, 87–93. [Google Scholar] [CrossRef] [Green Version]
  30. de Winter, J.C.F.; Gosling, S.D.; Potter, J. Comparing the Pearson and Spearman Correlation Coefficients across Distributions and Sample Sizes: A Tutorial Using Simulations and Empirical Data. Psychol. Methods 2016, 21, 273–290. [Google Scholar] [CrossRef]
  31. Gatignon, H. Statistical Analysis of Management Data; Springer: New York, NY, USA, 2010. [Google Scholar] [CrossRef]
  32. Goos, P.; Meintrup, D. Statistics with JMP; Wiley: Hoboken, NJ, USA, 2016. [Google Scholar]
  33. Breiman, L. Random Forests. Mach. Learn. 2001, 45, 5–32. [Google Scholar] [CrossRef] [Green Version]
  34. Kotsiantis, S.; Kanellopoulos, D. Discretization Techniques: A Recent Survey. GESTS Int. Trans. Comput. Sci. Eng. 2006, 32, 47–58. [Google Scholar]
  35. Mooi, E.; Sarstedt, M. A Concise Guide to Market Research: The Process, Data, and Methods Using IBM SPSS Statistics; Springer: Berlin, Germany, 2011; ISBN 9783642125416. [Google Scholar]
  36. Auret, L.; Aldrich, C. Interpretation of Nonlinear Relationships between Process Variables by Use of Random Forests. Miner. Eng. 2012, 35, 27–42. [Google Scholar] [CrossRef]
  37. Chakure, A. Random Forest Regression-Towards Data Science. Available online: https://towardsdatascience.com/random-forest-and-its-implementation-71824ced454f (accessed on 3 April 2020).
  38. Grömping, U. Variable Importance Assessment in Regression: Linear Regression versus Random Forest Linked. Am. Stat. 2009, 63, 308–319. [Google Scholar] [CrossRef]
  39. James, G.; Witten, D.; Hastie, T.; Tibshirani, R. An Introduction to Statistical Learning; Springer: New York, NY, USA, 2013. [Google Scholar] [CrossRef]
  40. Oshiro, T.M.; Perez, P.S.; Baranauskas, J.A. How Many Trees in a Random Forest? In Machine Learning and Data Mining in Pattern Recognition; Elsevier: Amsterdam, The Netherlands, 2012; Volume 7376 LNAI, pp. 154–168. [Google Scholar] [CrossRef]
  41. Congreso Republica Colombia, Ley 80 De 1993; Bogotá, Colombia; 1993. Available online: http://www.suin-juriscol.gov.co/viewDocument.asp?ruta=Leyes/1790106 (accessed on 3 April 2020).
  42. Bohórquez, J.; Mejía, G. Relationship Between Cost Overruns and Complexity in Engineering Projects: A Mixed Approach. In Proceedings of the Viii Encuentro Latinoamericano de Gestión Y Economía de la Construcción, Londrina, Brasil, 23–25 October 2019. [Google Scholar]
  43. Vallejo-Borda, J.A.; Gutierrez-Bucheli, L.A.; Pellicer, E.; Ponz-Tienda, J.L. Behavior in Terms of Delays and Cost Overrun of the Construction of Public Infrastructure In. Sibragec Elagec 2015, 2015, 66–73. [Google Scholar] [CrossRef]
  44. Park, Y.I.; Papadopoulou, T.C. Causes of Cost Overruns in Transport Infrastructure Projects in Asia: Their Significance and Relationship with Project Size. Built Environ. Proj. Asset Manag. 2012, 2, 195–216. [Google Scholar] [CrossRef]
  45. Assaf, S.A.; Al-Khalil, M.; Al-Hazmi, M.; Odeh, A.M.; Battaineh, H.T.; Elinwa, A.U.; Joshua, M.; Gündüz, M.; Nielsen, Y.; Özdemir, M.; et al. Causes of Delay in Construction Projects in the Oil and Gas Industry in the Gulf Cooperation Council Countries: A Case Study. Int. J. Proj. Manag. 2006, 31, 171–181. [Google Scholar] [CrossRef]
  46. Bagaya, O.; Song, J. Empirical Study of Factors Influencing Schedule Delays of Public Construction Projects in Burkina Faso. J. Manag. Eng. 2016, 32, 05016014. [Google Scholar] [CrossRef]
  47. Batool, A.; Abbas, F. Reasons for Delay in Selected Hydro-Power Projects in Khyber Pakhtunkhwa (KPK), Pakistan. Renew. Sustain. Energy Rev. 2017, 73, 196–204. [Google Scholar] [CrossRef]
  48. Lo, T.Y.; Fung, I.W.; Tung, K.C. Construction Delays in Hong Kong Civil Engineering Projects. J. Constr. Eng. Manag. 2006, 132, 636–649. [Google Scholar] [CrossRef]
  49. Kaka, A.; Price, A.D.F. Relationship between Value and Duration of Construction Projects. Constr. Manag. Econ. 1991, 9, 383–400. [Google Scholar] [CrossRef]
  50. Kumaraswamy, M.M.; Chan, D.W.M. Determinants of Construction Duration. Constr. Manag. Econ. 1995, 13, 209–217. [Google Scholar] [CrossRef]
  51. Chan, A.P.C. Time-Cost Relationship of Public Sector Projects in Malaysia. Int. J. Proj. Manag. 2001, 19, 223–229. [Google Scholar] [CrossRef]
  52. Anastasopoulos, P.C.; Labi, S.; Bhargava, A.; Mannering, F.L. Empirical Assessment of the Likelihood and Duration of Highway Project Time Delays. J. Constr. Eng. Manag. 2012, 138, 390–398. [Google Scholar] [CrossRef]
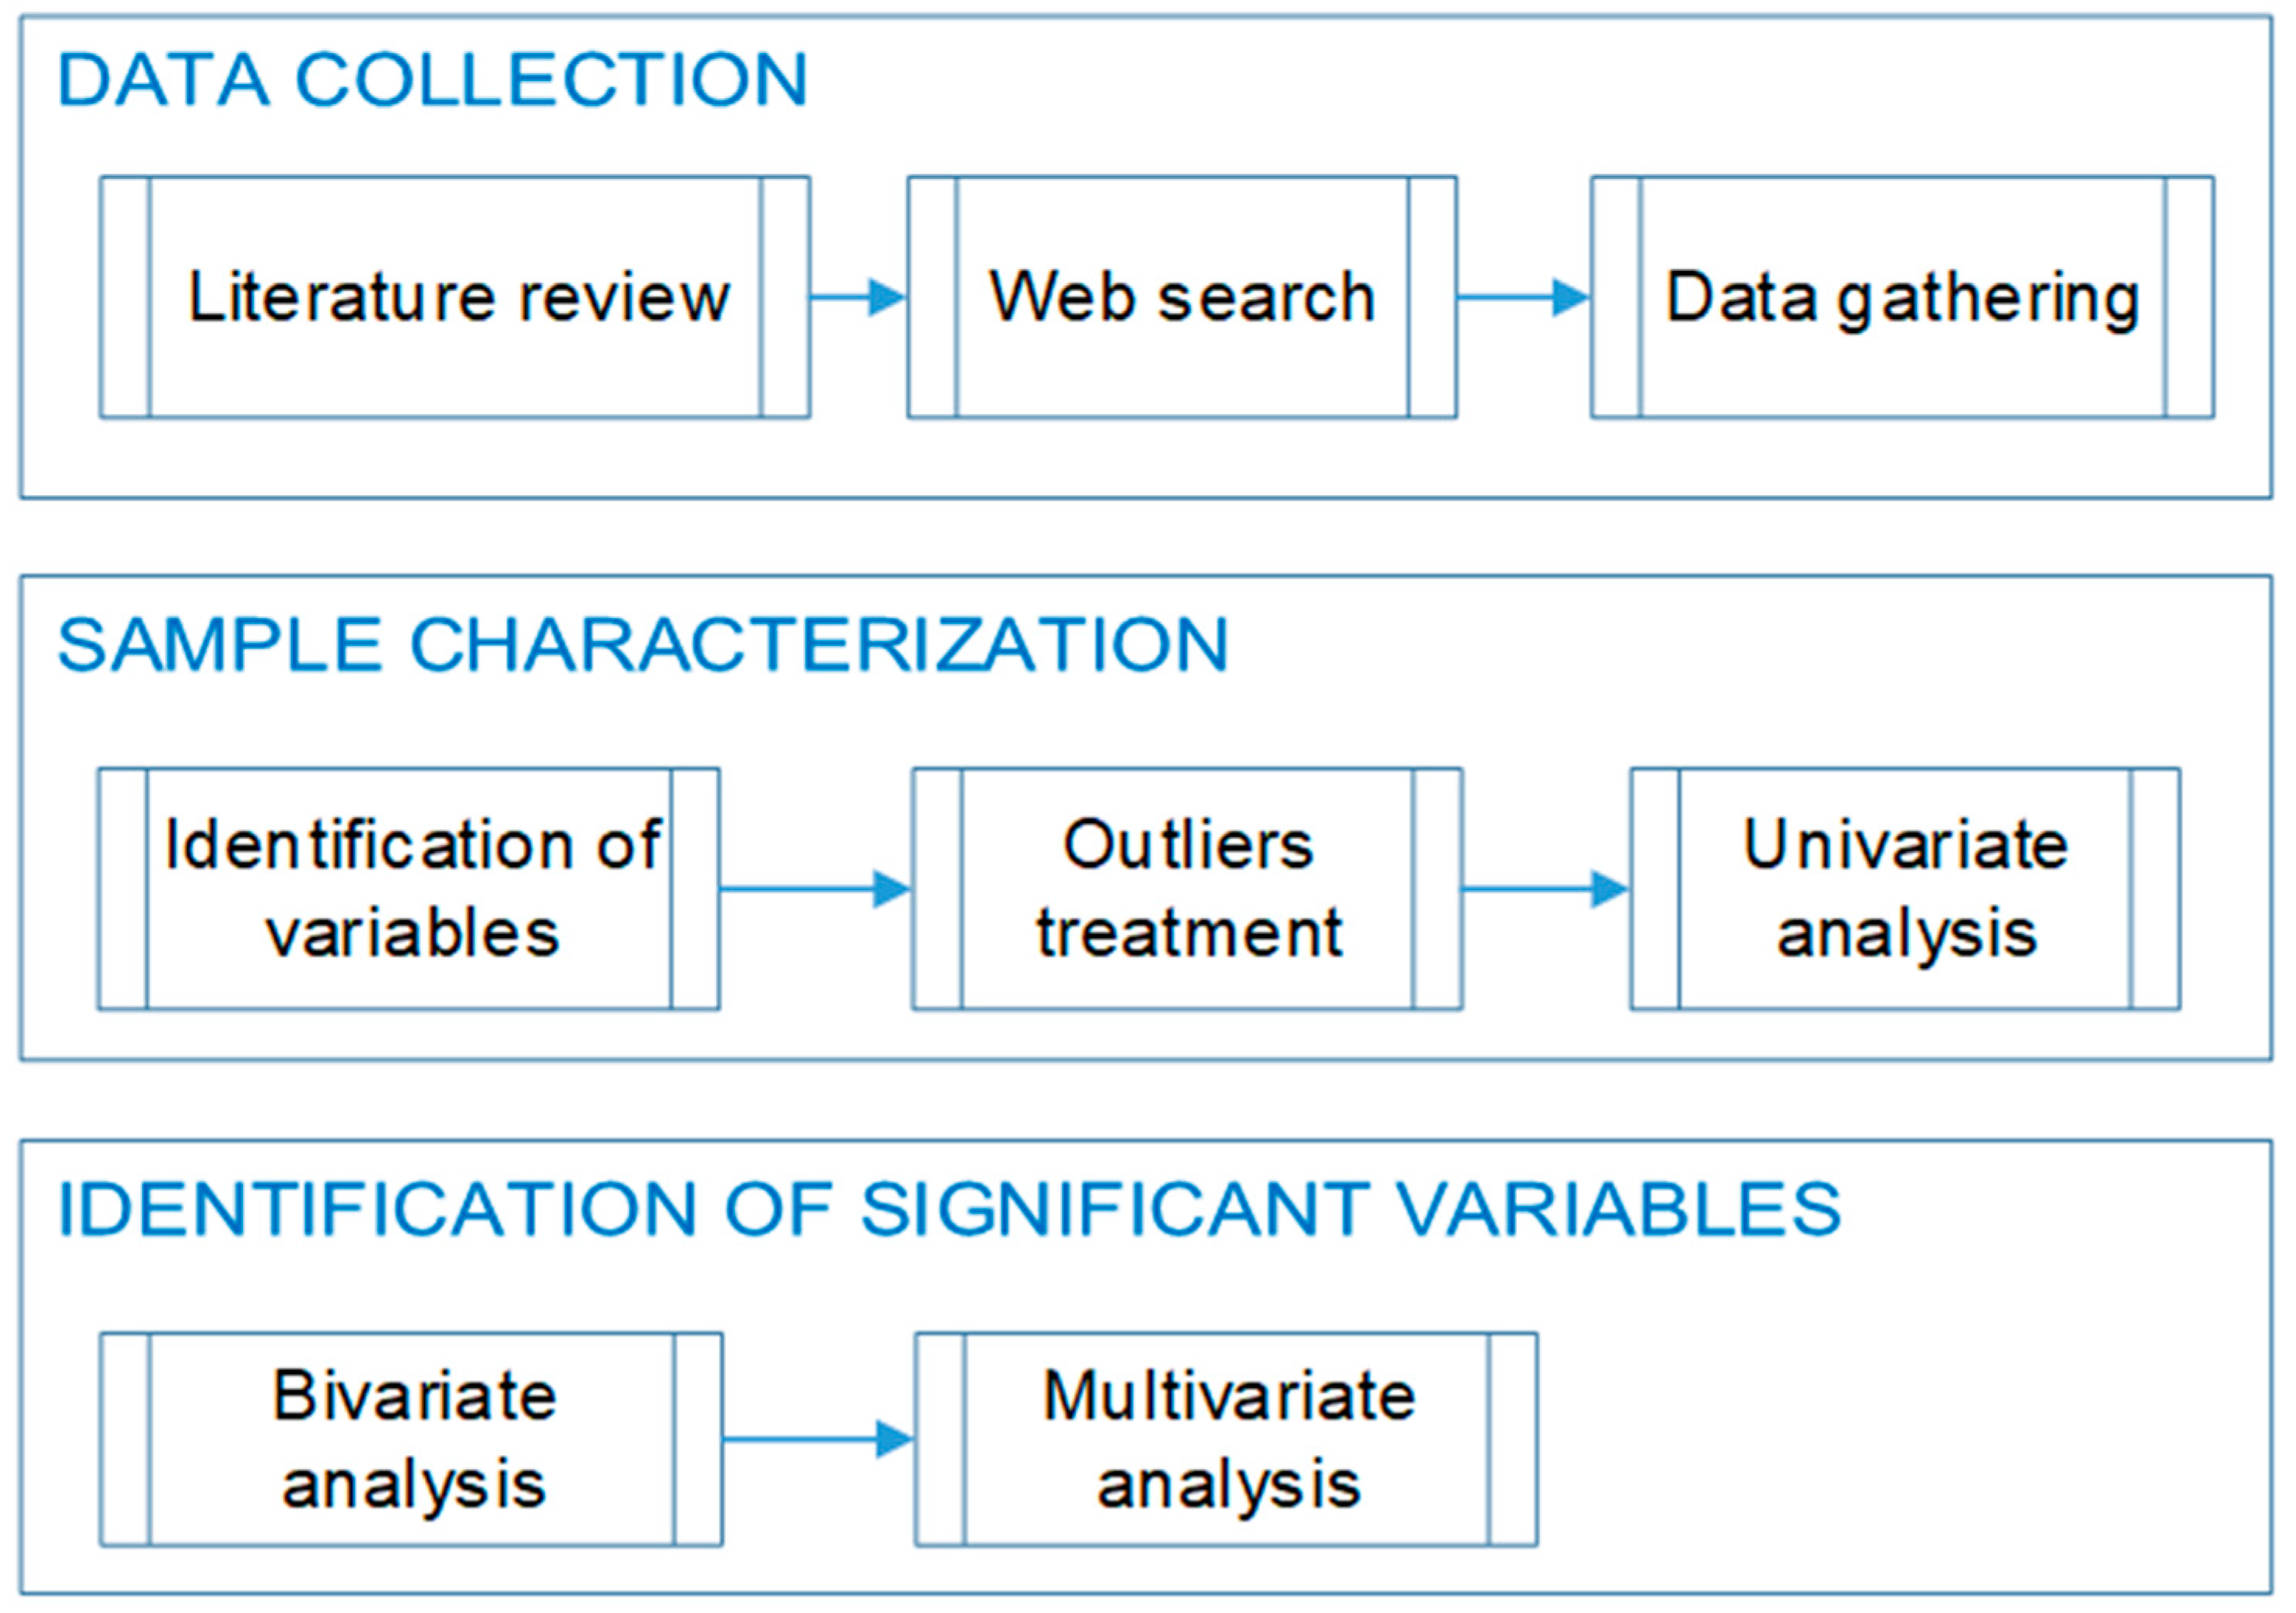
Figure 1. Research method.
Sustainability 12 07377 g001
Figure 2. Boxplot for (a) time deviation and (b) cost deviation.
Sustainability 12 07377 g002
Figure 3. Boxplot for projects reporting (a) time deviation and (b) cost deviation.
Sustainability 12 07377 g003
Figure 4. Univariate analysis of categorical variables.
Sustainability 12 07377 g004
Figure 5. Matrix correlation for numerical variables.
Sustainability 12 07377 g005
Figure 6. Optimal number of predictors (a) and significant variables (b) for time deviation.
Sustainability 12 07377 g006
Figure 7. Scatterplot for time deviation and the original deadline.
Sustainability 12 07377 g007
Figure 8. Optimal number of predictors (a) and significant variables (b) for cost deviation.
Sustainability 12 07377 g008
Table 1. Independent variables.
PhaseVariable (Type)DescriptionUnit/ValuesSource
Project initiationProject type (Categorical)The main project object.Construction or Maintenance[7,18,19]
Owner (Categorical)The entity, or stakeholder, responsible for contracting the project.Municipality or Other[24]
Geographic Location (Categorical)Colombian regions where the project takes place.Amazonia, Andina, Caribe, Orinoquia, or Pacifica[10,25]
Municipality Type (Categorical)Class stated by Colombian law. (According to their number of inhabitants and income).Type 1 to 6, 1 being the highest category
Period
(Categorical)
The period of project execution, in this case, it was established in years.Years: 2015, 2016, 2017, or 2018[10,25]
Estimated Cost (Budget) (Numerical)Budgeted construction cost, determined at the time of procurement by the owner.Minimum salaries[7,19,25,26]
Original Deadline (Numerical)The project planned duration, determined at the time of procurement by the owner.Days[18,24,25]
Project Intensity (Numerical)The ratio between the estimated cost and the original deadline.Minimum salaries/days[20]
Project planningContract Value (Numerical)The contract awarded amount.Minimum salaries[18,20]
Award Growth (Numerical)The ratio between the difference of contract value and the estimated cost.Percentage (%)[20]
Process Type (Categorical)Modality chosen for the contractor procurement and selection.Competitive Bidding, Abbreviated Selection, Minimum Contract
Contractor (Categorical)Stakeholder responsible for executing the project.Individual, Consortium, or Companies
Project execution and closureAdditional Cost (Numerical)The difference between the contract value and the final contract cost. Minimum salaries[20,26]
Additional Time (Numerical)Difference between the original deadline and the final contract deadline.Days[20]
Final Cost (Numerical)Final contract cost.Minimum salaries[26]
Final Deadline (Numerical)Final contract deadline.Days[25]
Table 2. Descriptive statistics of independent numerical variables.
VariableMinMaxMeanMedianStandard
Deviation
Time deviation0.004.500.190.000.50
Cost deviation0.000.530.080.000.16
Table 3. Descriptive statistics of independent variables for projects reporting deviation.
VariableMinMaxMeanMedianStandard
Deviation
Time deviation0.004.500.530.330.72
Cost deviation0.000.530.240.250.20
Table 4. Descriptive statistics of independent numerical variables.
Variable (Unit)MinMaxMeanMedianStandard
Deviation
Estimated Cost (* MS)25.602420.45258.84126.31387.20
Contract Value (* MS)19.692415.74257.35126.31385.88
Additional Cost (* MS)0.00828.9821.400.0071.80
Final Cost (* MS)21.443244.72278.75128.57419.06
Original Deadline (Days)5.00240.0063.1860.0038.38
Additional Time (Days)0.00196.009.280.0022.50
Final Deadline (Days)5.00361.0072.4660.0047.11
Project Intensity (* MS/Day)0.2369.164.052.245.79
Award Growth (%)−0.290.00−0.010.000.03
* MS: Minimum Salaries.
Table 5. Significant correlations for time deviation.
PhaseVariableSpearman′s Rhop-Value
Project initiationProject intensity0.23<<0.01
Estimated cost0.21<<0.01
Project planningAward growth−0.090.00
Project execution and closureAdditional cost0.48<<0.01
Table 6. Significant categorical variables for time deviation.
PhaseVariableNew CategoriesMinMaxMean
Project initiationYear20160.004.500.37
Other0.003.000.15
RegionOther0.004.500.20
Pacifica0.001.500.05
Municipality typeOther0.003.000.35
Type 60.004.500.15
Project planningProcess typeCompetitive bidding0.003.000.28
No competitive bidding0.004.500.16
Table 7. Significant numerical variables for cost deviation.
PhaseVariableSpearman′s Rhop-Value
Project initiationProject intensity0.110.01
Estimated cost0.120.00
Project execution and closureAdditional time0.47<<0.01
Table 8. Significant categorical variables for cost deviation.
PhaseVariableNew CategoriesMinMaxMean
Project initiationYear20160.000.530.16
Other0.000.500.07
Municipality typeOther0.000.530.14
Type 60.000.500.07
Project planningProcess typeCompetitive bidding0.000.530.09
No competitive bidding0.000.500.08