Article

Acoustic Emission Wave Velocity Attenuation of Concrete and Its Application in Crack Localization

1
College of Traffic & Transportation, Chongqing Jiaotong University, Chongqing 400074, China
2
School of Civil Engineering, Chongqing Jiaotong University, Chongqing 400074, China
*
Author to whom correspondence should be addressed.
Sustainability 2020, 12(18), 7405; https://doi.org/10.3390/su12187405
Submission received: 7 July 2020 / Revised: 14 August 2020 / Accepted: 6 September 2020 / Published: 9 September 2020

Abstract

:
The accurate localization of an acoustic emission (AE) source is a vital aspect of AE nondestructive testing technology. A model of wave velocity attenuation caused by the extension of transmission distance is established to analyze the attenuation of AE wave velocities in concrete and thus improve the acoustic source localization accuracy from the perspective of modified velocity. In combination with the exhaustive and region localization methods, a region exhaustive localization method is established based on the modified wave velocity. The results indicate that the smaller the water–cement ratio, the larger the reference wave velocity, and the spatially dependent attenuation of wave velocity increase. Moreover, the larger the aggregate particle size, the larger the reference wave velocity, and the greater the attenuation of wave velocity with distance. For a propagation distance of 1000 mm, the AE wave velocity attenuation exceeds 50% compared with the AE velocity. The optimized localization method reduces the number of nodes calculated, thus improving the method’s accuracy when used for localization.

1. Introduction

Acoustic emission (AE) is a dynamic nondestructive testing method used to monitor structural status [1]. AE refers to the physical phenomenon of instantaneous elastic waves emitted by the rapid release of energy aimed at material defects. As an accompanying phenomenon of the material failure process, its signal contains a lot of information about the material and its damage. By analyzing the AE signal, the location and the properties of the AE source, the stress history of the material, and the degree of material damage can be determined. For example, Zhou [2] identified the fatigue crack AE signal of railway vehicle axle from the residuals obtained from intrinsic mode functions and empirical mode decomposition. Noorsuhada [3] reviewed the fatigue of reinforced concrete structures, fatigue test configurations, the effects of fatigue amplitude on Reinforced concrete structures, and the correlation between AE techniques and fatigue damage on RC structures. Paul [4] used AE to analyze crack propagation in strain-hardening cement-based composite (SHCC) under tensile and flexural loads, and to characterize the cracking behavior in SHCC under direct tensile and flexural tests. Damage identification [5,6,7,8] and target damage localization [9,10,11] are focus points in the field of AE nondestructive testing technology.
The principle of AE source localization defines wave velocity and arrival time as the two main factors affecting localization accuracy. Wave velocity depends on the uniformity of the measured material. Arrival time depends on the precision of the AE signal sensor and the accuracy of the waveform analysis.
Kundu [12] reviewed the existing novel acoustic source localization technologies, compared the available techniques, determined the source localization technique that would be most effective for specific structure types, and defined the current research needs. Methods used for source localization in isotropic plates include triangulation technologies with a known wave speed [13], triangulation technology with unknown wave speeds [14], optimization-based technologies with unknown wave speeds [15,16,17,18], beamforming technologies [19,20], strain rose techniques with unknown wave speeds [21,22,23,24], and source localization through modal AE [25,26,27,28]. In the research on the AE source localization of concrete materials, studies and applications of the triangulation and beamforming technologies with known wave velocity are relatively mature. Among these, the triangulation technologies with known wave velocities form the primary localization method of AE detectors, whereas other methods are typically used as auxiliary methods or for scientific research.
Acoustic attenuation can be challenging when performing acoustic source localization for heterogeneous materials. Acoustic attenuation is a physical phenomenon wherein AE waves propagate through heterogeneous materials; it is the attenuation of propagation velocity and energy when acoustic waves propagate in non-ideal media [29]. Studies have reported that the mixing ratio of concrete, aggregate type and size, cement quantity, and water–cement ratio (w/c), significantly affect the propagation velocity and energy attenuation of AE waves [30]. The amplitude of acoustic wave attenuation in concrete is positively correlated with the propagation distance, i.e., a larger propagation distance results in a more significant attenuation [31,32]. In addition, the wave velocity affects the accuracy of the source location determination. For various stress levels, the deviation in the localization of the initial and measured wave velocities is in the range of 15.9–18.9% [33]. Therefore, when AE technology is used to detect and locate the damage in cement concrete structures, the accuracy of the AE source location can be improved by defining the attenuation law of sound in cement concrete, particularly the attenuation law of wave velocity.
AE wave velocity and arrival time are the key indicators when AE technology is used to detect the damage of concrete structures. The attenuation characteristics of acoustic wave propagation in concrete lead to unsteady AE wave velocities. That is, when locating cracks in concrete structures, the wave velocity in the localization algorithm should not be a constant value, but rather, a variable that decreases with distance.
In this study, we used pencil lead break (PLB) test data to analyze the effects of water–cement ratio, sand ratio, and maximum aggregate size on attenuation of standard AE wave velocities. Based on the degree of impact of each factor on the amplitude and wave velocity, a distance attenuation model was developed for AE wave velocity. The optimized exhaustive localization algorithm and the modified concrete velocity were combined to establish the region exhaustive localization method based on the modified wave velocity. Finally, the constant and modified wave velocities were used to compare the localization accuracy on the concrete samples, and the localization effect of the new method was analyzed. The results show that the new algorithm can improve the localization accuracy and reduce the amount of calculation.

2. Materials and Methods

2.1. Materials

To analyze variations in the propagation velocity of AE signals in cement concrete and the attenuation law of AE wave velocity for various material compositions, a three-factor, two- or three-level indoor simulation test was designed with the following parameters: w/c = 0.3, 0.33, and 0.36; sand ratio (S) = 0.47, 0.5, and 0.55, maximum aggregate size (dmax) = 10 and 20 mm. The dimensions of the test specimen were 100 × 100 × 1800 mm (see Figure 1). The strength grade of the cement used in this test was 4.25 MPa. The mold was made of hard wood board and fixed with angle steel. After pouring, the concrete was placed in a room at 20 °C ± 5 °C for 24 h. The samples were cured immediately after mold removal. PLB tests were carried out after 28 days.

2.2. Test System

The AE monitoring system employed the SAEU3H16 high-speed digital AE detector with 16 channels (see Figure 2). This system was capable of recording continuous 0–2.5 MHz waveform signals and more than 20 characteristic parameters. A 16-bit analog-to-digital converter was used to record data for analyses and signal processing. This converter could record the flow of waveforms in real time. In the test, the predischarge gain of the AE system was set at 40 dB, and the threshold was set at 45 dB.

2.3. TEST SCHEME

The AE wave velocity measurement test was carried out in accordance with the PLB testing recommendations of the American Society for Testing and Materials (ASTM). The PLB test that was used to produce the standard AE signal employed a hard black (HB) lead core with a diameter of 0.5 mm and a pen core extension length of 2.5 mm. The lead core was broken at a selected point, at a 30° angle to the surface of the specimen to complete the PLB testing.
The procedure employed in the test to measure the AE wave velocity was as follows:
(1)
Sensor installation. First, a coupling agent was applied to the receiving surface of the sensor, and then adhered to the surface of the concrete sample; the sensor is installed at an equal spacing of 10 cm. The PLB point and the sensor’ locations are exhibited in Figure 3.
(2)
Sensor debugging. Three PLB pre-tests were conducted near the break point of each sensor to verify their accuracy.
(3)
PLB testing. Five PLB tests were performed at 2 s intervals at the break point to emulate five AE sources. Seventeen sensors were used to record the signal.
(4)
Signal arrival time extraction. Waveform information was analyzed, and the transmission time was extracted.
(5)
Wave velocity calculation. Using the signal arrival time to Sensor #1 as the origin of the PLB signal and the signal arrival time to Sensors #2–16 as the receiving time, the AE wave velocities were calculated for the propagation distances of 100, 200, 300, …, and 1500 mm.

3. Fundamental Concepts

3.1. Datum AE Velocity

To observe the attenuation of AE wave velocity with respect to propagation distance, an appropriate datum AE velocity ( V d ) should be selected. The wave velocities for different propagation distances should be compared with V d to determine the degree of attenuation. In this study, the AE wave velocity measured with the PLB test for a propagation distance of 100 mm was used as the datum AE velocity.

3.2. Attenuation Rate of AE Wave Velocity

The attenuation rate of AE wave velocity (Ra) was used to evaluate the attenuation of AE wave velocity with respect to distance. The attenuation rate of wave velocity, which is expressed as a percentage, is the ratio of AE wave velocity to the reference wave velocity ( V d ) for various propagation distances. It is expressed as follows,
R a = V x V d ,
where Vx is the wave velocity (m/s) of the P wave at various distances on the propagation path, x is the propagation distance of the P wave on the propagation path (m), and Vd is the datum AE velocity (m/s).

3.3. Region Exhaustive Localization Method Based on the Modified Wave Velocity

The exhaustive method, also known as the enumeration method, tests all possible situations to solve the problem without omission and identifies the solutions that meet all requirements. Although, the enumeration method generates comprehensive results, it is time-consuming. However, higher localization accuracy can only be achieved when the number of nodes is sufficiently high. Therefore, for identical node spacing, reducing the exhaustive range and performing thorough searches only within the possible region of the acoustic source can effectively reduce the calculation time. Moreover, in this study, the modified wave velocity corrected using distance attenuation is adopted over the conventional constant wave velocity to reduce the influence of the difference between the calculated and actual wave velocities on localization accuracy in instances where AE is transmitted through heterogeneous materials.
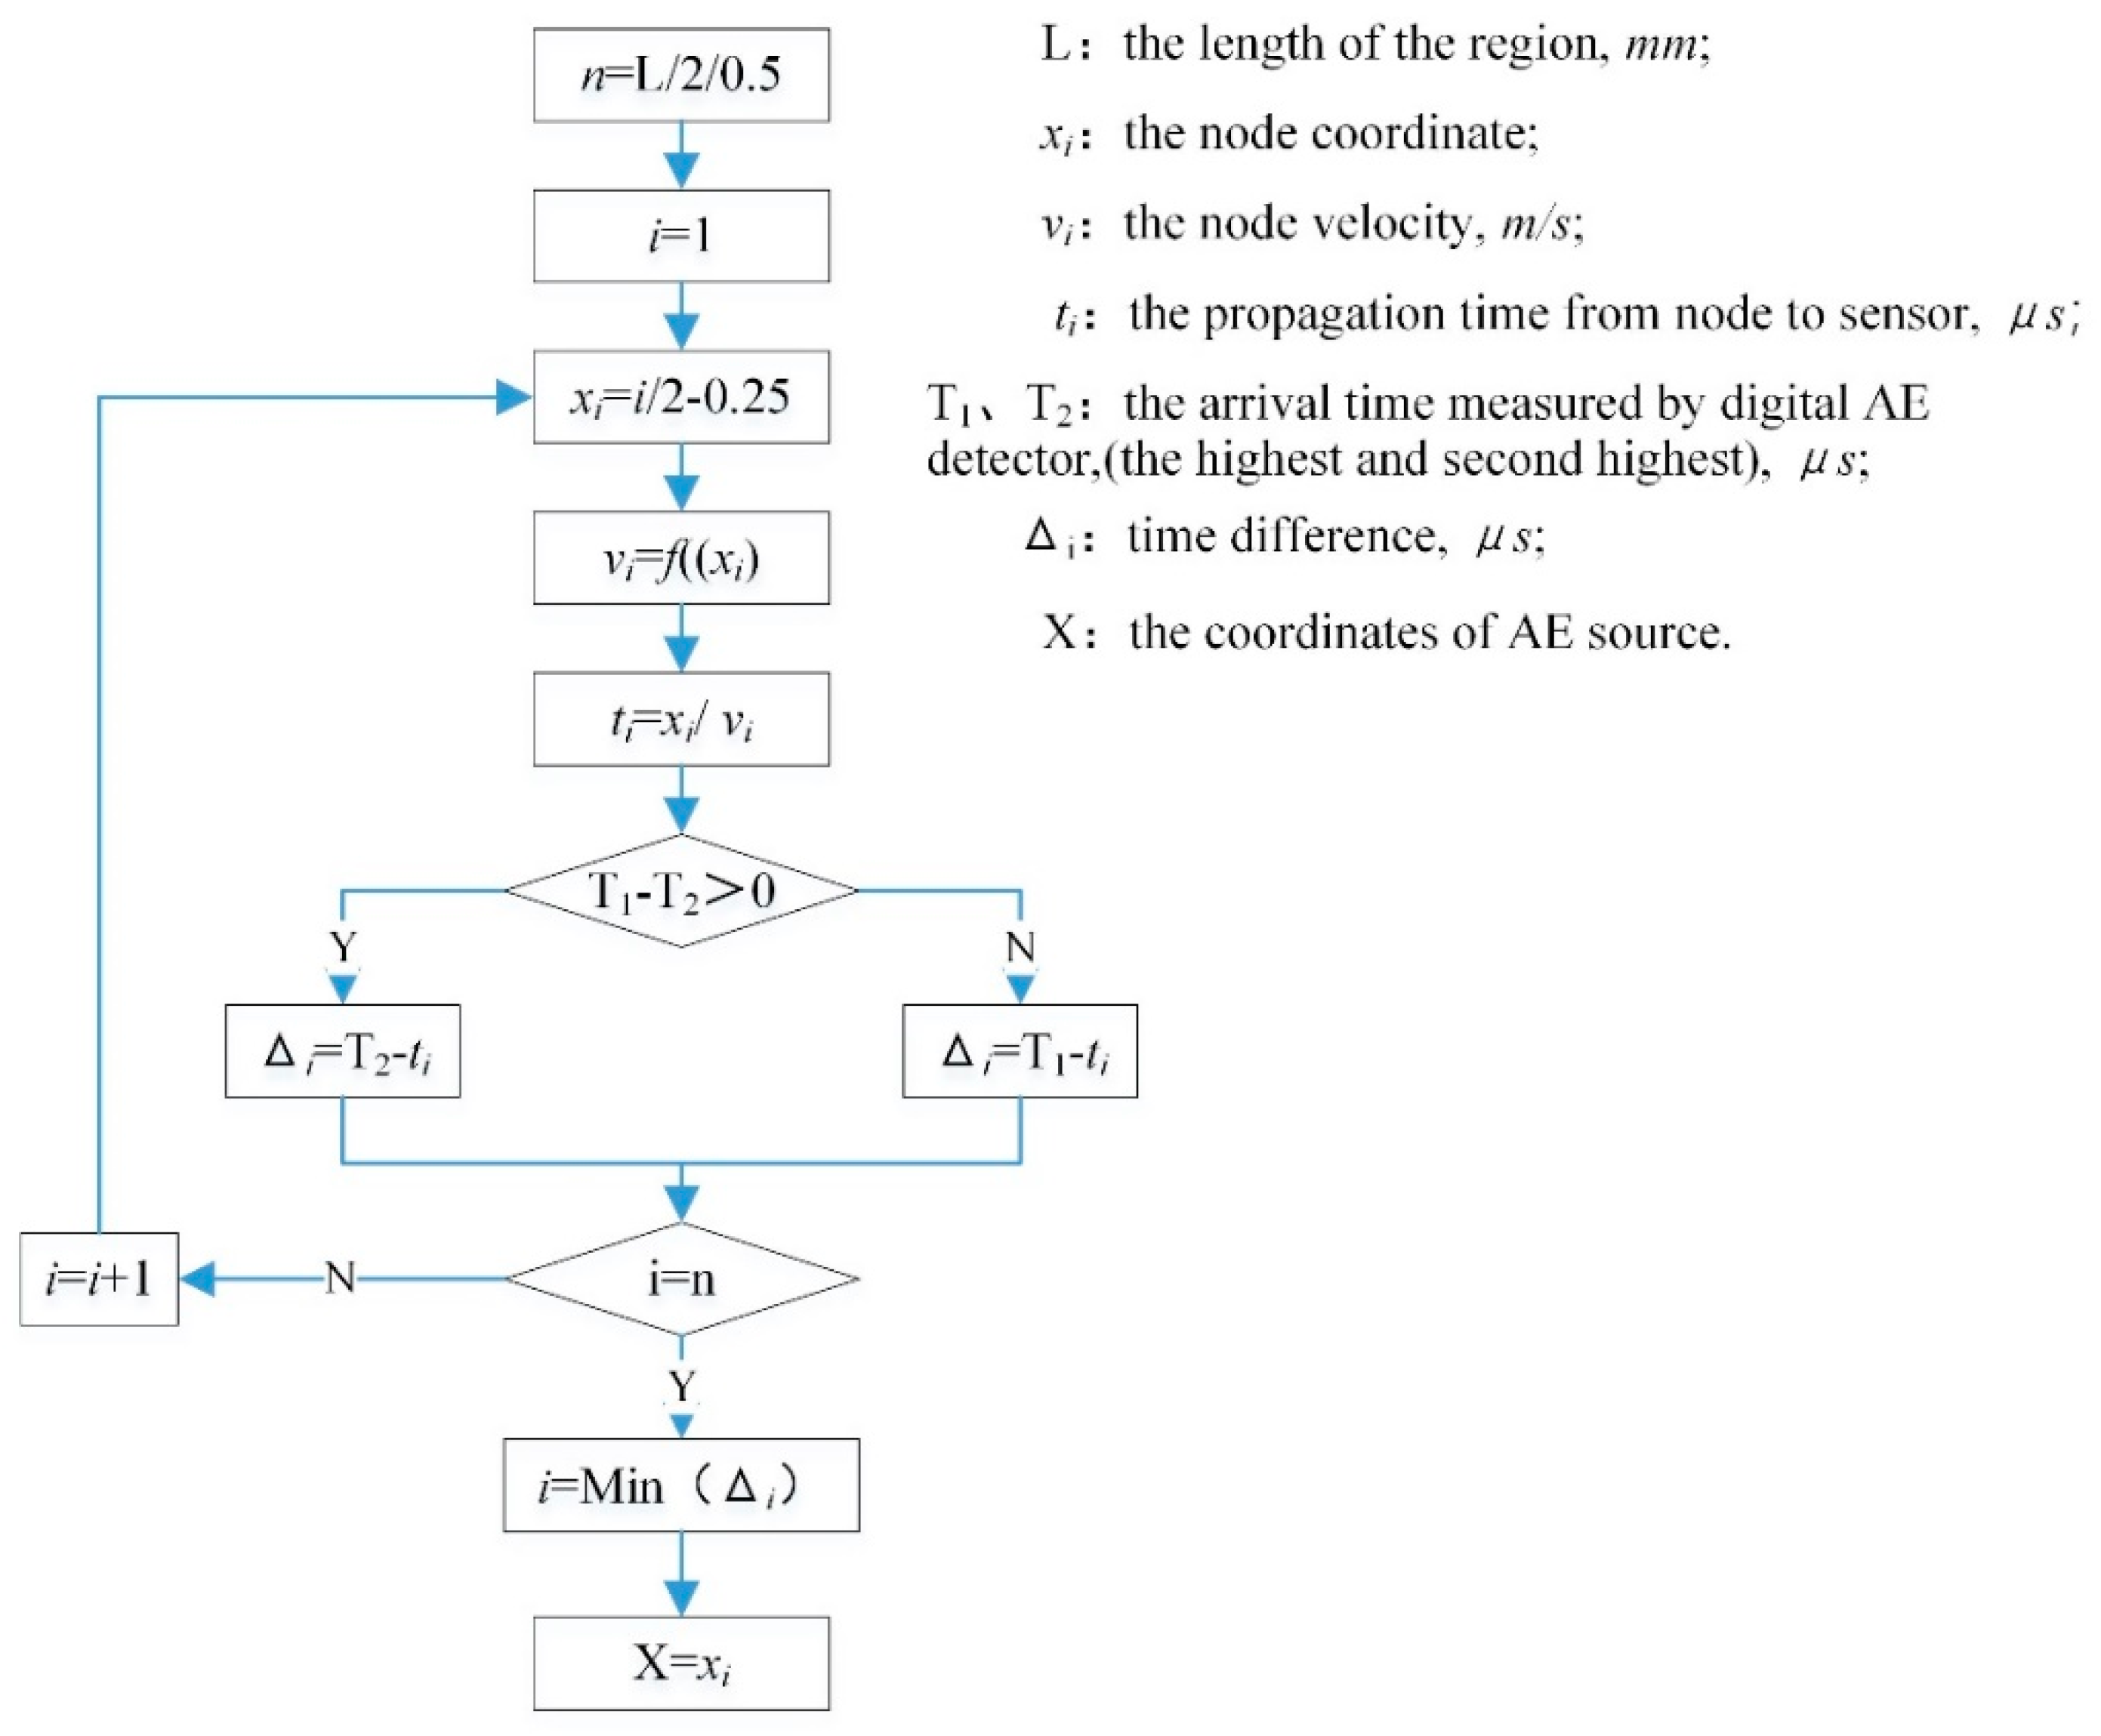
The algorithm of the region exhaustive localization method based on the modified wave velocity is divided into seven steps (see Figure 4).
Possible region of the acoustic source: The possible region location is determined based on the use of the excitation sequence and sensor energy. The attenuation decreases as the distance between the sensor probe and the AE source decreases. Therefore, the probe that detects the maximum amplitude of the AE signal will be closest to the AE source. Furthermore, considering the detection of the second largest amplitude signal, the possible region where the AE source exists can be reduced further. The region is determined according to the highest and second highest primary output signals (see Figure 5).
Nodal division: Each node is a virtual AE source to be tested. The midpoint coordinates of the node represent its position. If the node spacing is divided according to the short side of the specimen, the spacing is 0.5 mm. Considering the lower left corner of the specimen as the origin, the coordinates of the node are xi, where i = 1,2,3, …, (see Figure 6).
Nodal wave velocity: The modified wave velocity model can be used to calculate the wave velocity between the nodes and the maximum signal output. Assuming that the AE signal received by the sensor is emitted from a specific nodal position, the node wave velocity indicates the speed of the signal propagated by the virtual acoustic source to the sensor with the highest output.
Propagation time from node to sensor: The propagation time from node to sensor indicates the time required for the transmission of the signal from the node position to the maximum signal sensor. This time t is expressed as the ratio of the distance to the velocity,
t = x v ,
where x is the shortest distance (m) between the node coordinates and the sensor with the maximum signal output and v is the node wave velocity (m/s).
Time difference: The time difference indicates the difference between the propagation time from node to sensor and the actual AE signal arrival time,
Δ = T t ,
where t is the propagation time from the node to the sensor (calculated value, μs), and T is the arrival time measured by the digital AE detector (measured value, μs).
Source coordinates: When determining the coordinates of the acoustic source, if the time difference between the node and the signal is less than the judgment error (the proposed judgment error is 0.1 ms), the node coordinate corresponds to the location of the acoustic source. By contrast, when the time difference exceeds the decision error, the cycle is recalculated to the next node. When the one-dimensional line is located, the coordinates of the node corresponding to the minimum value can be considered as the coordinates of the acoustic source after the calculation of the total node time difference given that the number of nodes is relatively small. When two-dimensional (2-D) and three-dimensional (3-D) localizations are outperformed, the source coordinates are determined based on judgment error.

4. Results and Discussion

4.1. Waveform and Parameters of PLB

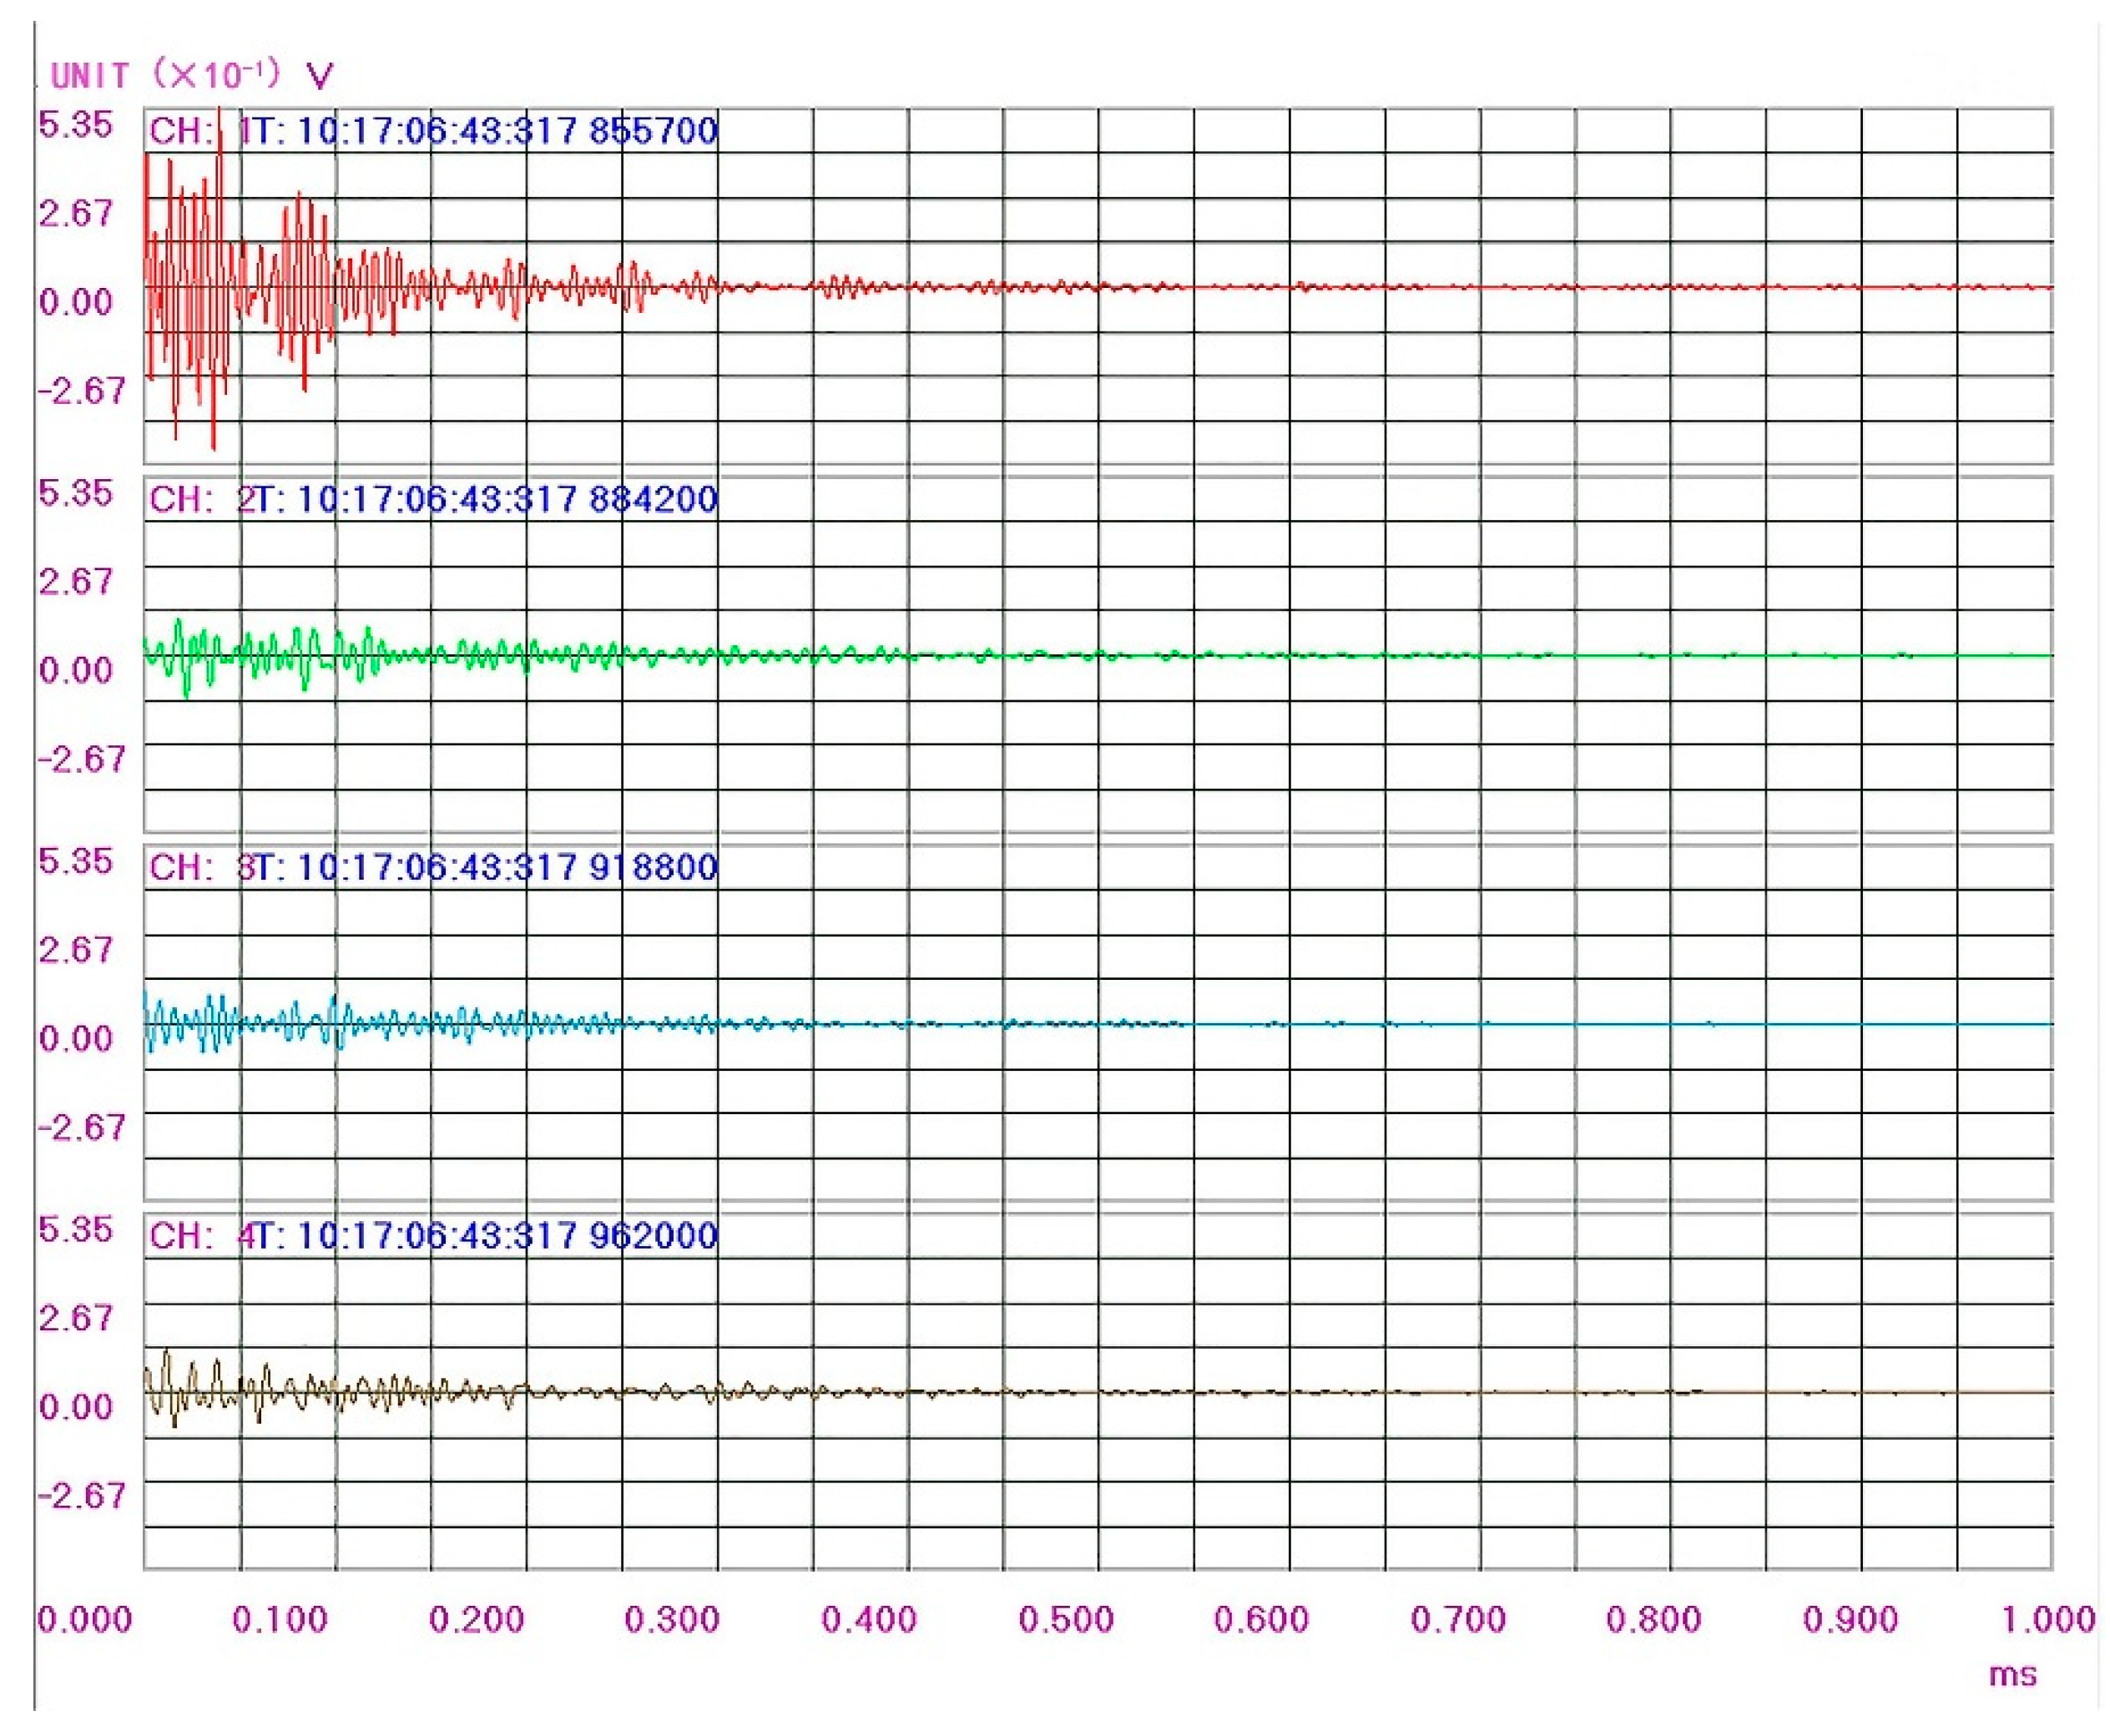
According to the method proposed in the Test scheme section, each PLB experiment can obtain a set of waveforms which are depicted in Figure 7. In the experiment, the channel numbers are used to represent different sensors and then the corresponding AE waveforms are collected to extract the relevant parameters, such as (AE) arrival time, AE amplitude, AE count, AE duration and AE energy (as summarized in Table 1). It can be seen from the waveform diagram and parameters that the acoustic energy decays rapidly with the increase of the distance between the sensor and the break point. The AE amplitude and duration shows a pattern similar to that of the acoustic energy.

4.2. Effect of Material Composition

4.2.1. Water-Cement Ratio (w/c)

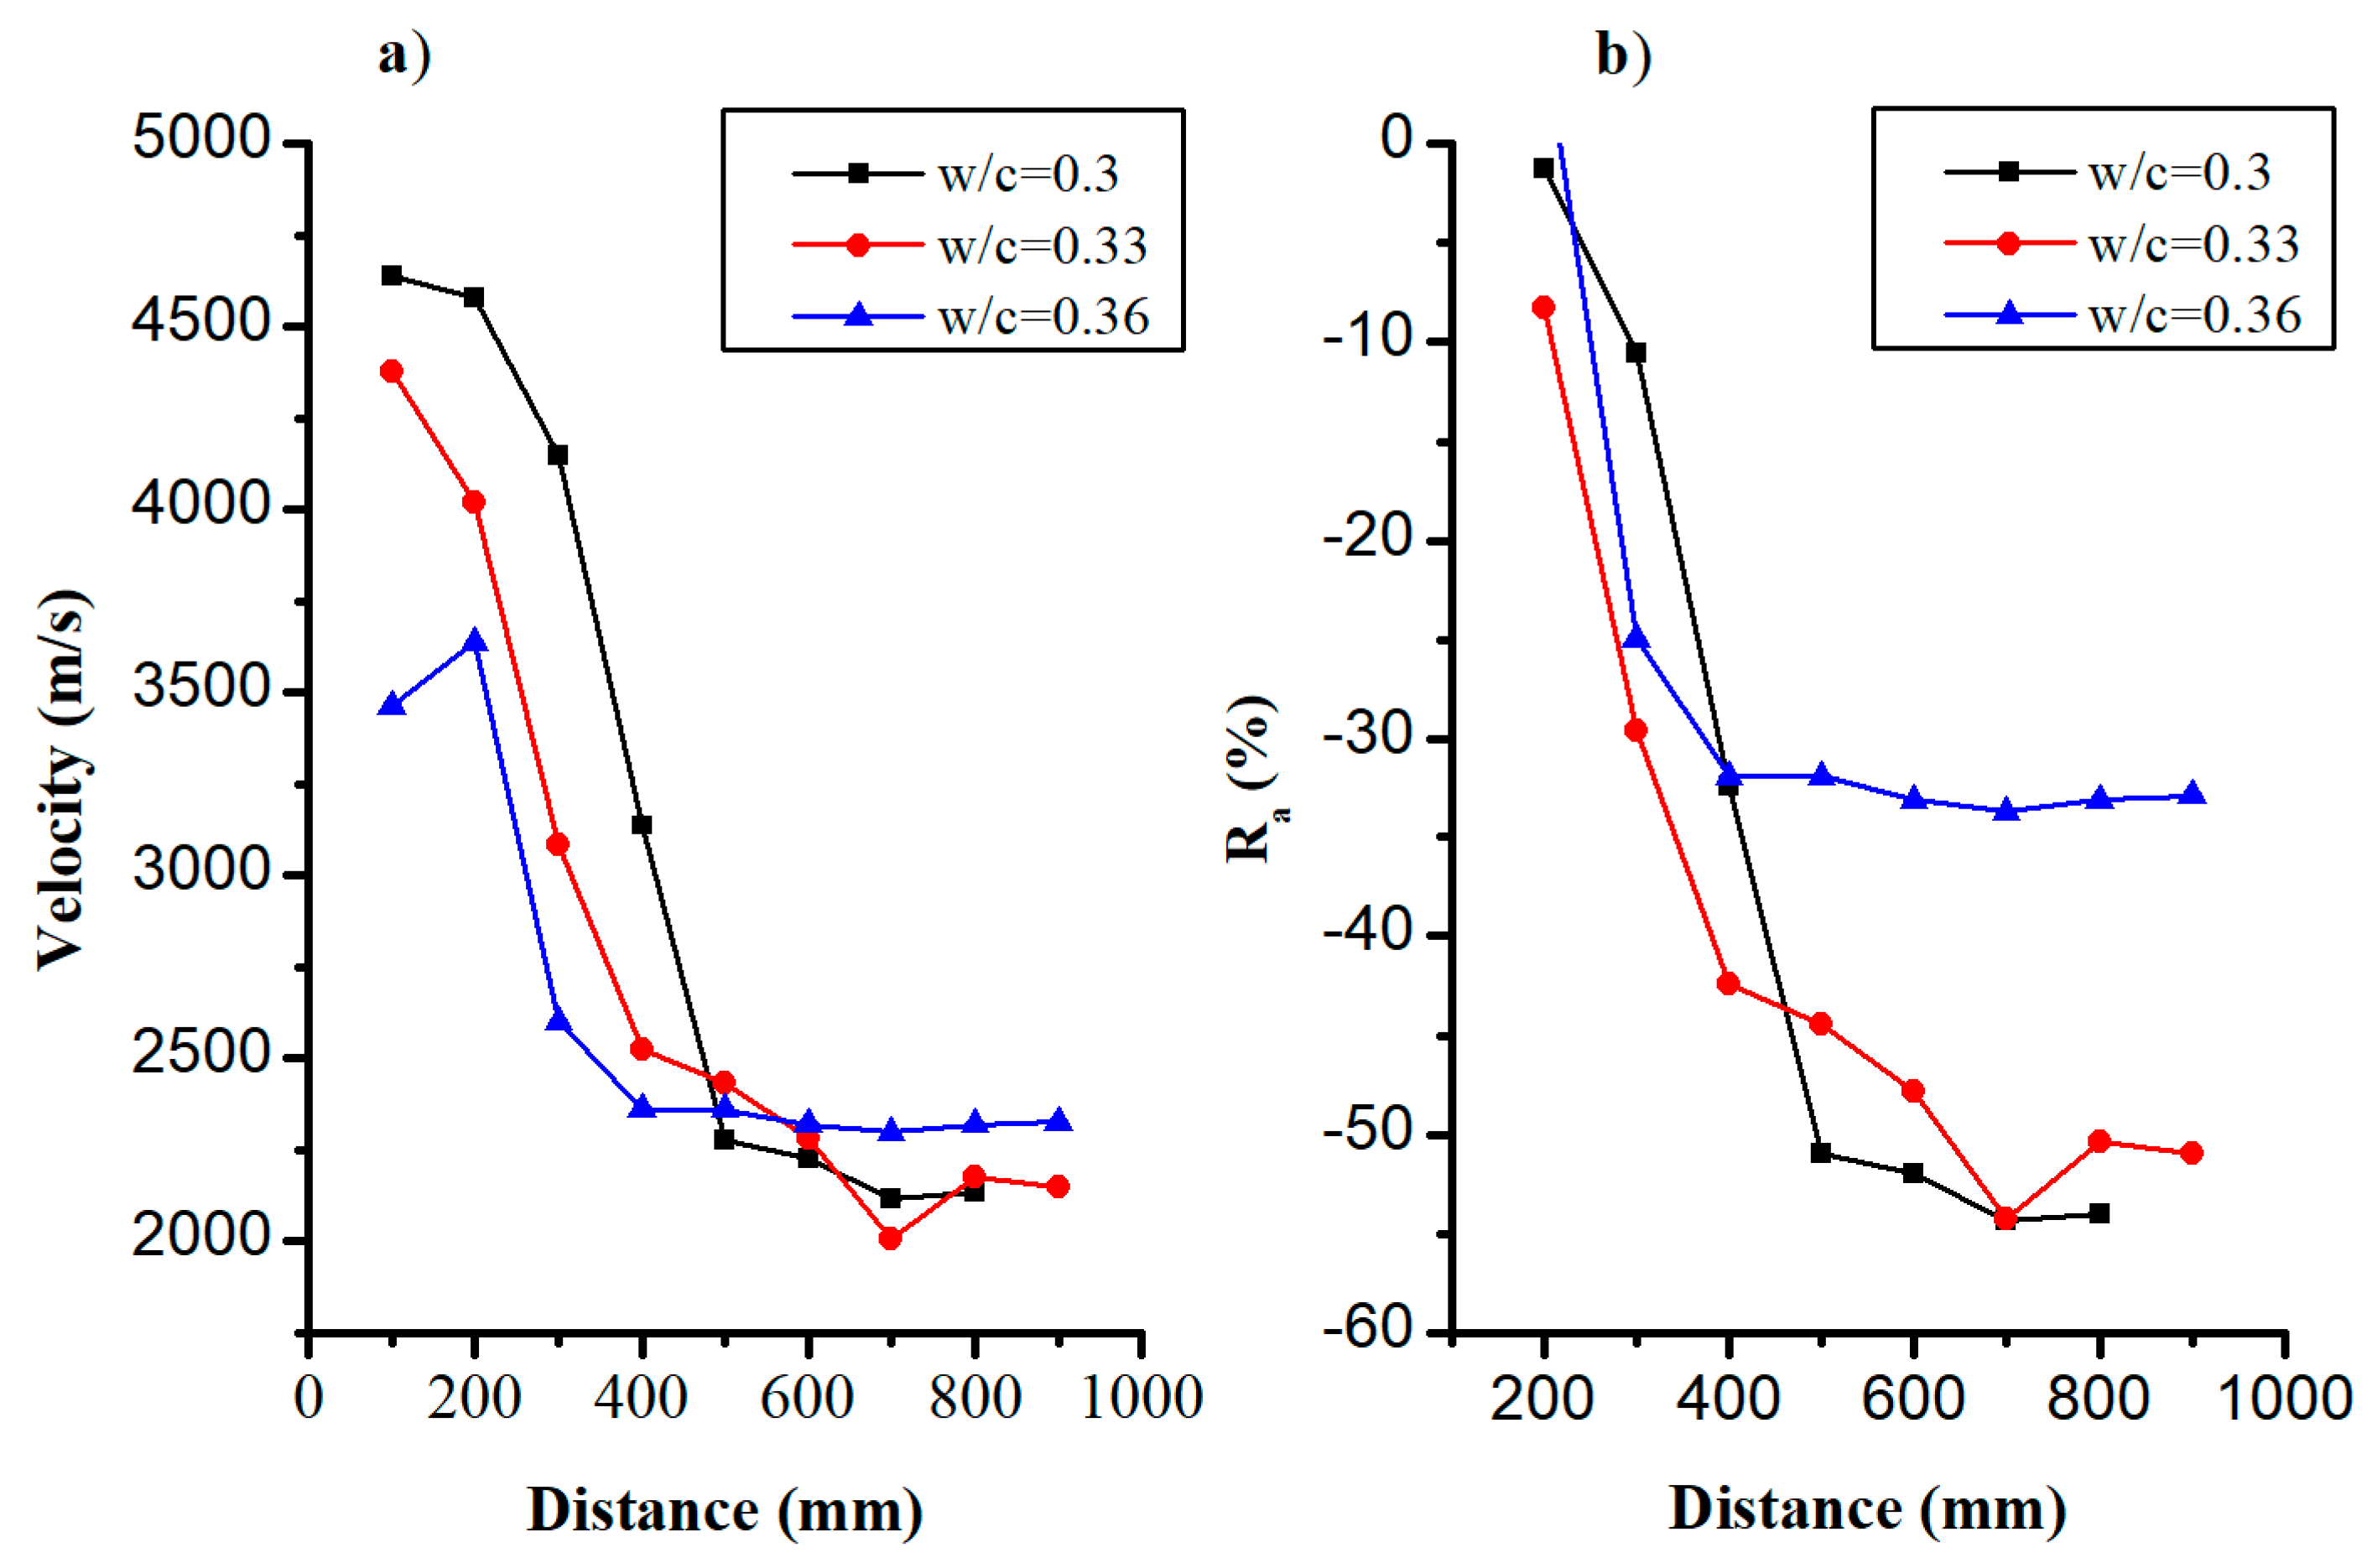
The results of the AE wave velocity tests for a constant sand ratio and aggregate size for various water–cement ratios are plotted in Figure 8. The results indicate the following.
For a constant sand ratio and aggregate size, the larger the water–cement ratio, the smaller the reference wave velocity of the standard AE signal. The V d values were found to be 4639, 4378, and 3465 m/s when w/c was 0.30, 0.33, and 0.36, respectively (see Figure 8a).
All the AE wave velocities in cement concrete exhibited a decreasing trend with increasing distance, (see Figure 8b). When w/c was 0.30, 0.33, and 0.36, the Ra values were −1% to −54%, −8% to −54%, and 5% to −34% and the coefficients of variation were 0.57, 0.35, and 0.09, respectively. These results indicate that the larger the water–cement ratio, the lower the attenuation of AE wave velocity with distance.

4.2.2. Sand Ratio

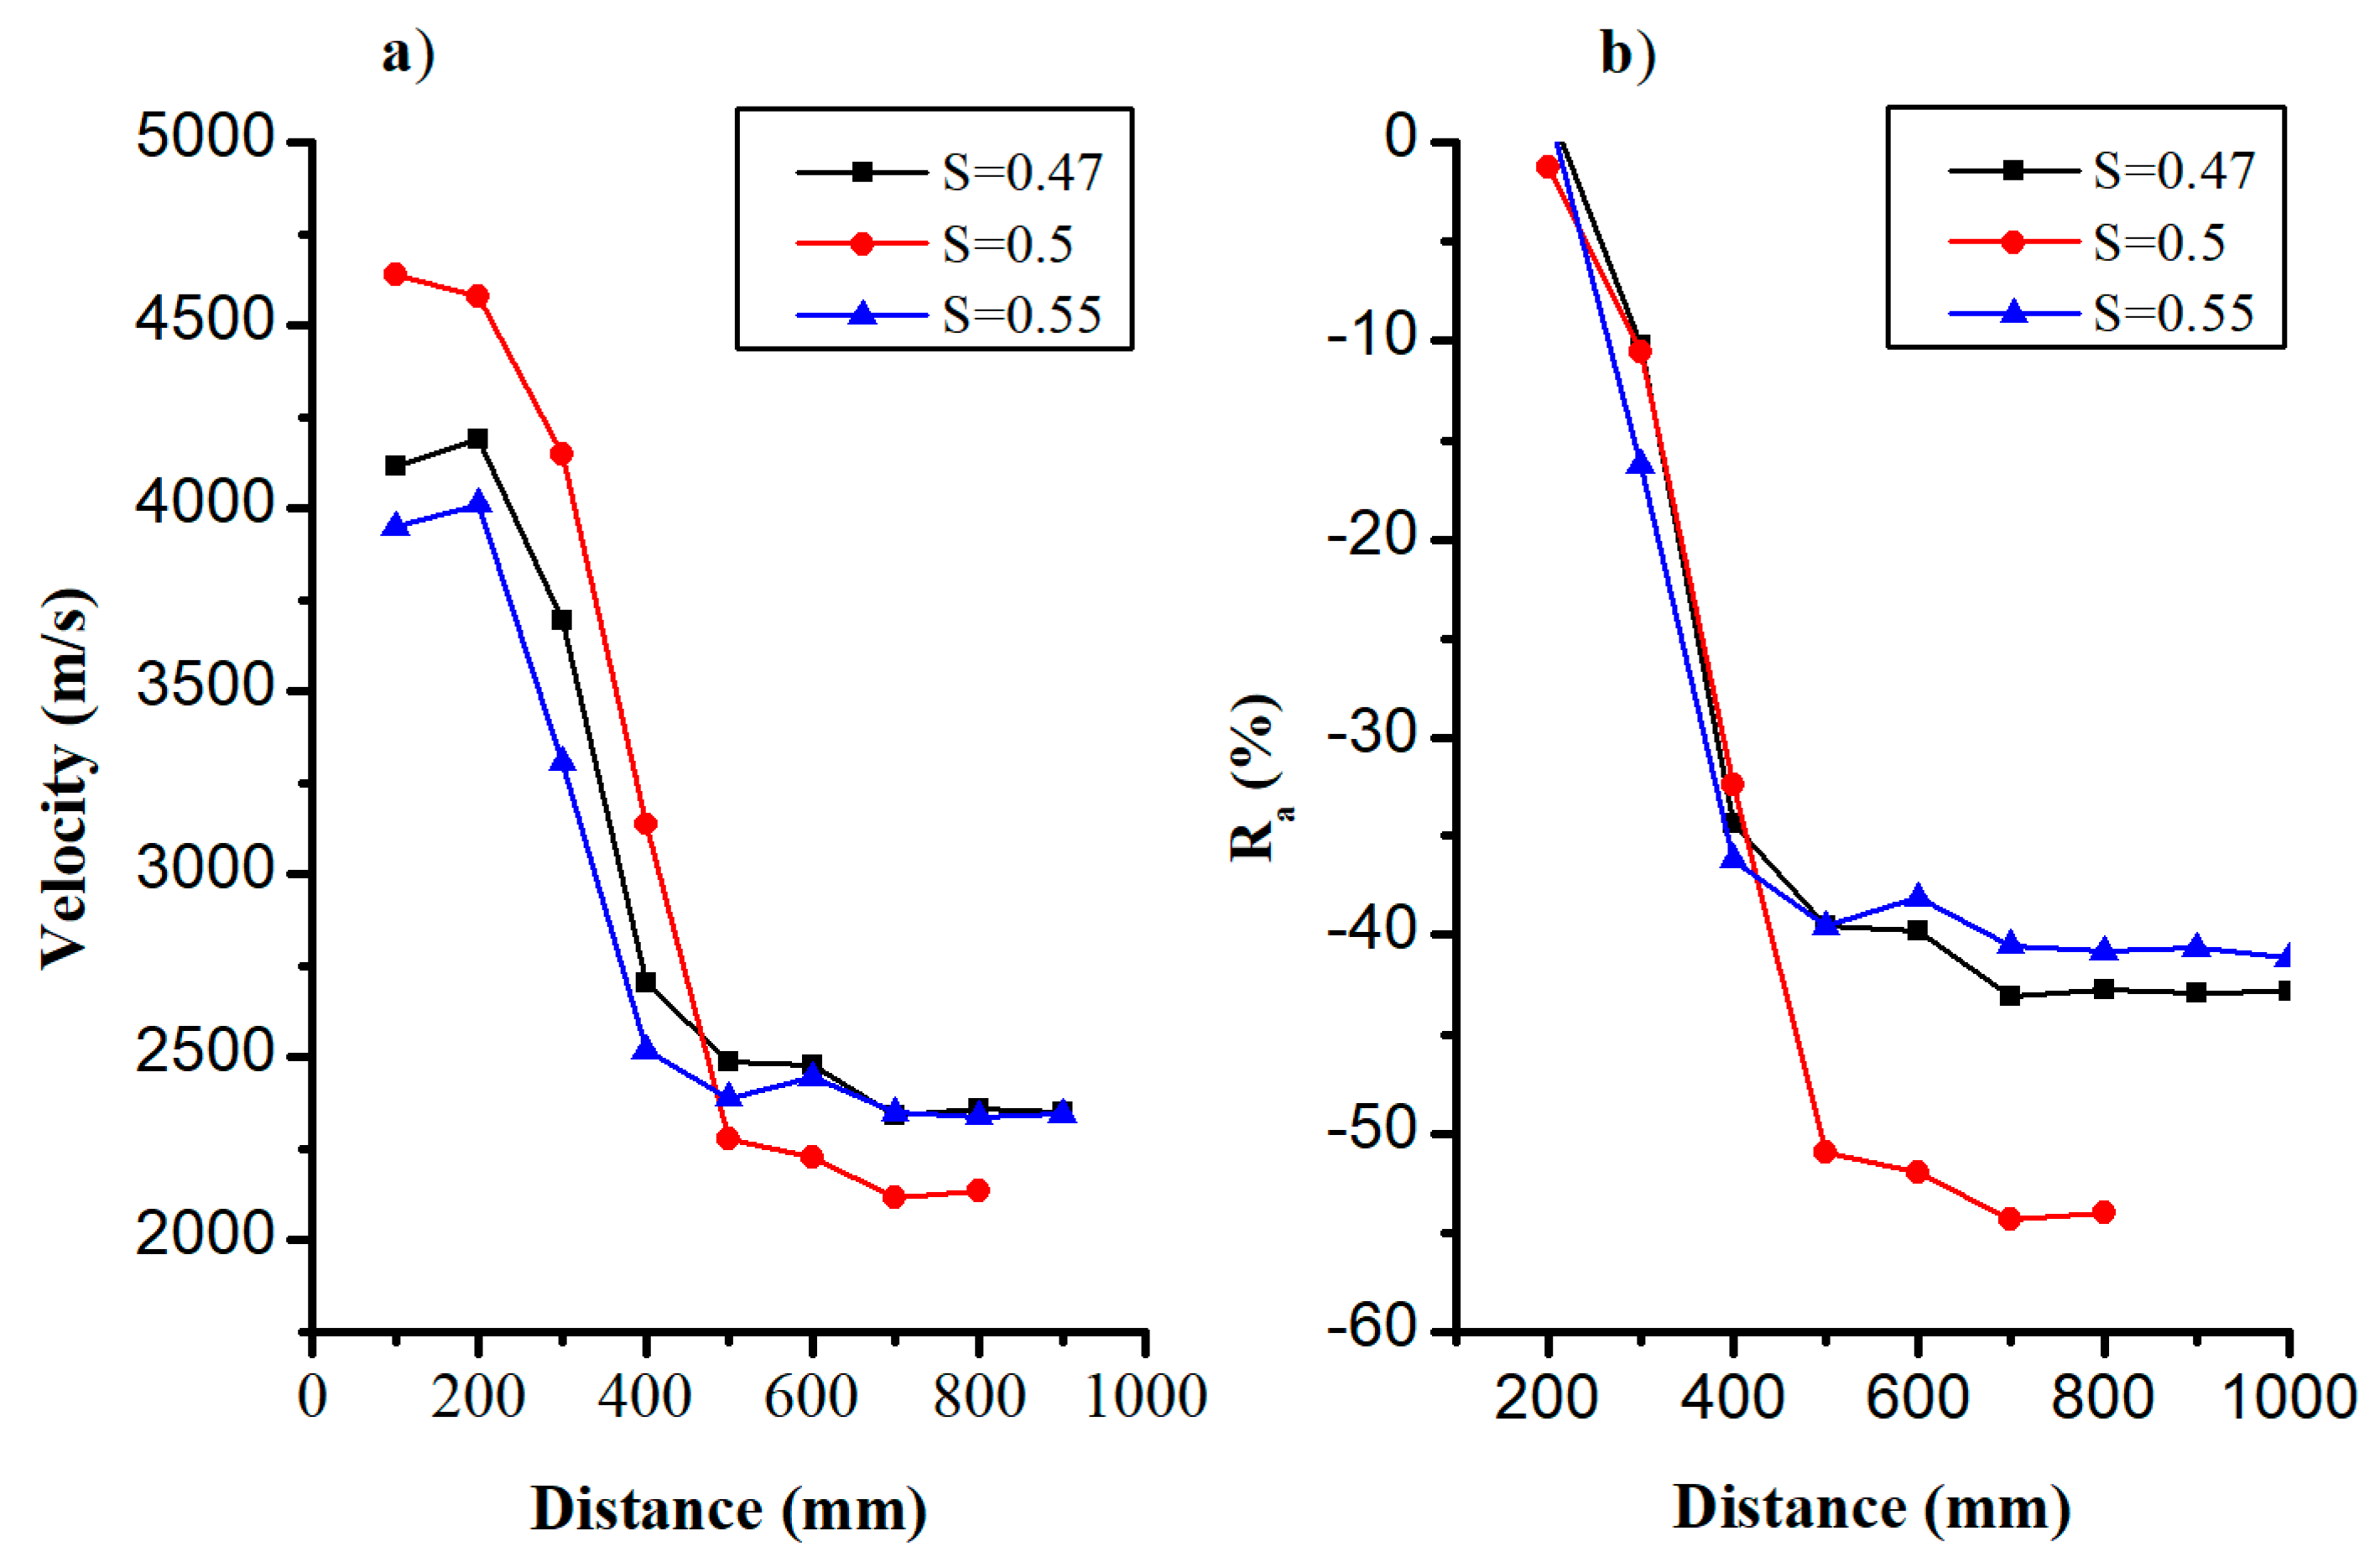
The results of the AE wave velocity tests for various sand ratios and a constant particle size and water–cement ratio are plotted in Figure 9. The results show the following.
When the sand ratio increases, the variation of the standard AE reference wave velocity in cement concrete is minimal. When the sand ratio values were 0.47, 0.50, and 0.55, the V d values were 4114, 4639, and 3950 m/s, respectively (see Figure 9a).
When a standard AE was propagated in cement concrete for various sand ratios, all the wave velocities exhibited a tendency to decay with increasing distance (see Figure 9b). When the sand ratio values were 0.47, 0.50, and 0.55, the Ra values were 2% to −43%, −1% to −54%, and 2% to −41% and the coefficients of variation were 0.48, 0.57, and 0.44, respectively. Therefore, the effect of sand ratio on wave velocity attenuation was insignificant.

4.2.3. Maximum Aggregate Size

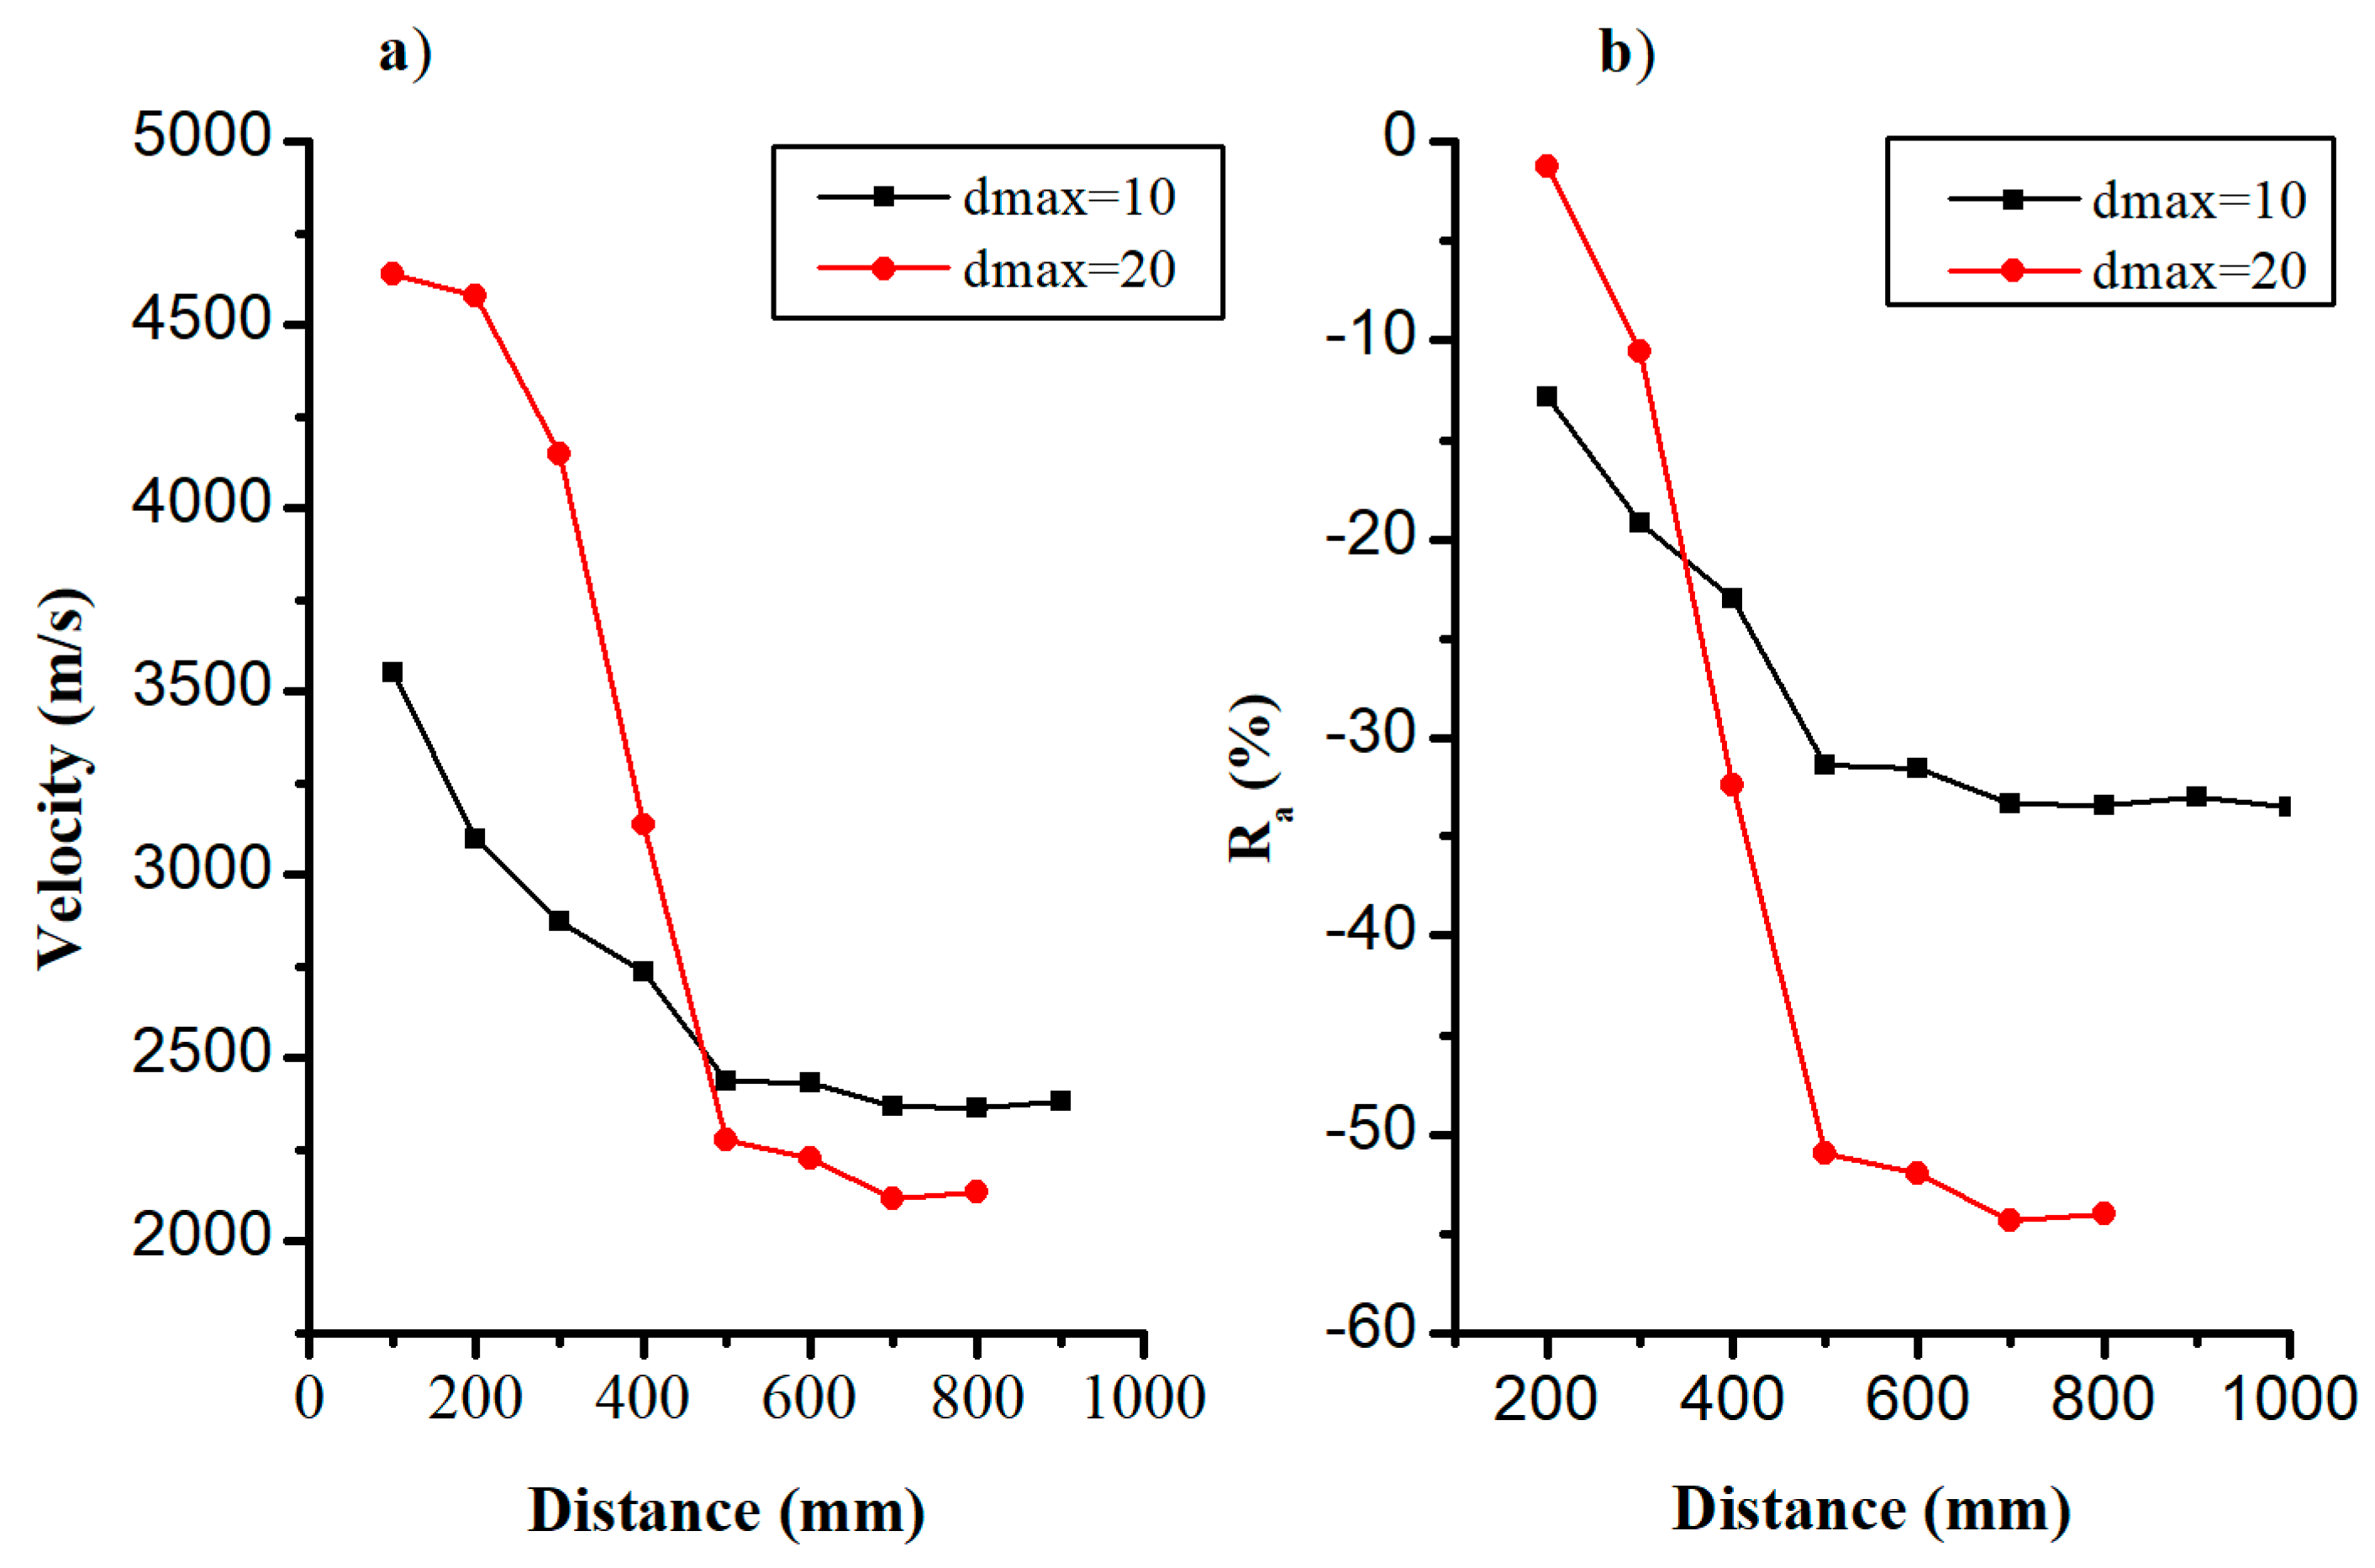
The experimental results of the AE wave velocity of cement concrete specimens with constant water–cement and sand ratios for various maximum aggregate sizes are plotted in Figure 10. The results indicate the following.
For constant water–cement and sand ratios, the reference wave velocity of the standard AE signal increases when the aggregate size increases. For maximum aggregate sizes of 10 and 20 mm, V d was 3551 and 4639 m/s, respectively (see Figure 10a).
The standard AE wave velocities for two aggregate sizes exhibited a decreasing trend with increasing distance (see Figure 10b). When the maximum aggregate sizes were 10 and 20 mm, the Ra values were −13% to −34% and −1% to −54%, and the coefficients of variation were 0.26 and 0.57, respectively. Hence, as the aggregate size increased, the attenuation of the AE wave velocity increased as a function of distance.

4.3. Wave Velocity Correction Model

Based on the variation of acoustic wave velocity with distance in concrete for various material compositions, a logarithmic function was used to fit the experimental data. Correspondingly, the distance correction model is expressed as follows:
V x = a l n ( x ) + b ,
where Vx is the wave velocity of P at various distances on the propagation path (m/s), and x is the propagation distance of P on the propagation path (m). The regression parameters a and b can be expressed as a function of material composition (water–cement ratio, sand ratio, and maximum aggregate size), as shown in Equation (5).
a = 1111 + 2898.8 ( w c ) + 255.3 S 42.6 d m a x b = 9691 18726.5 ( w c ) 1521.6 S + 264.6 d m a x   , }
where dmax is the maximum aggregate size.

5. Localization Examples

5.1. Test Scheme

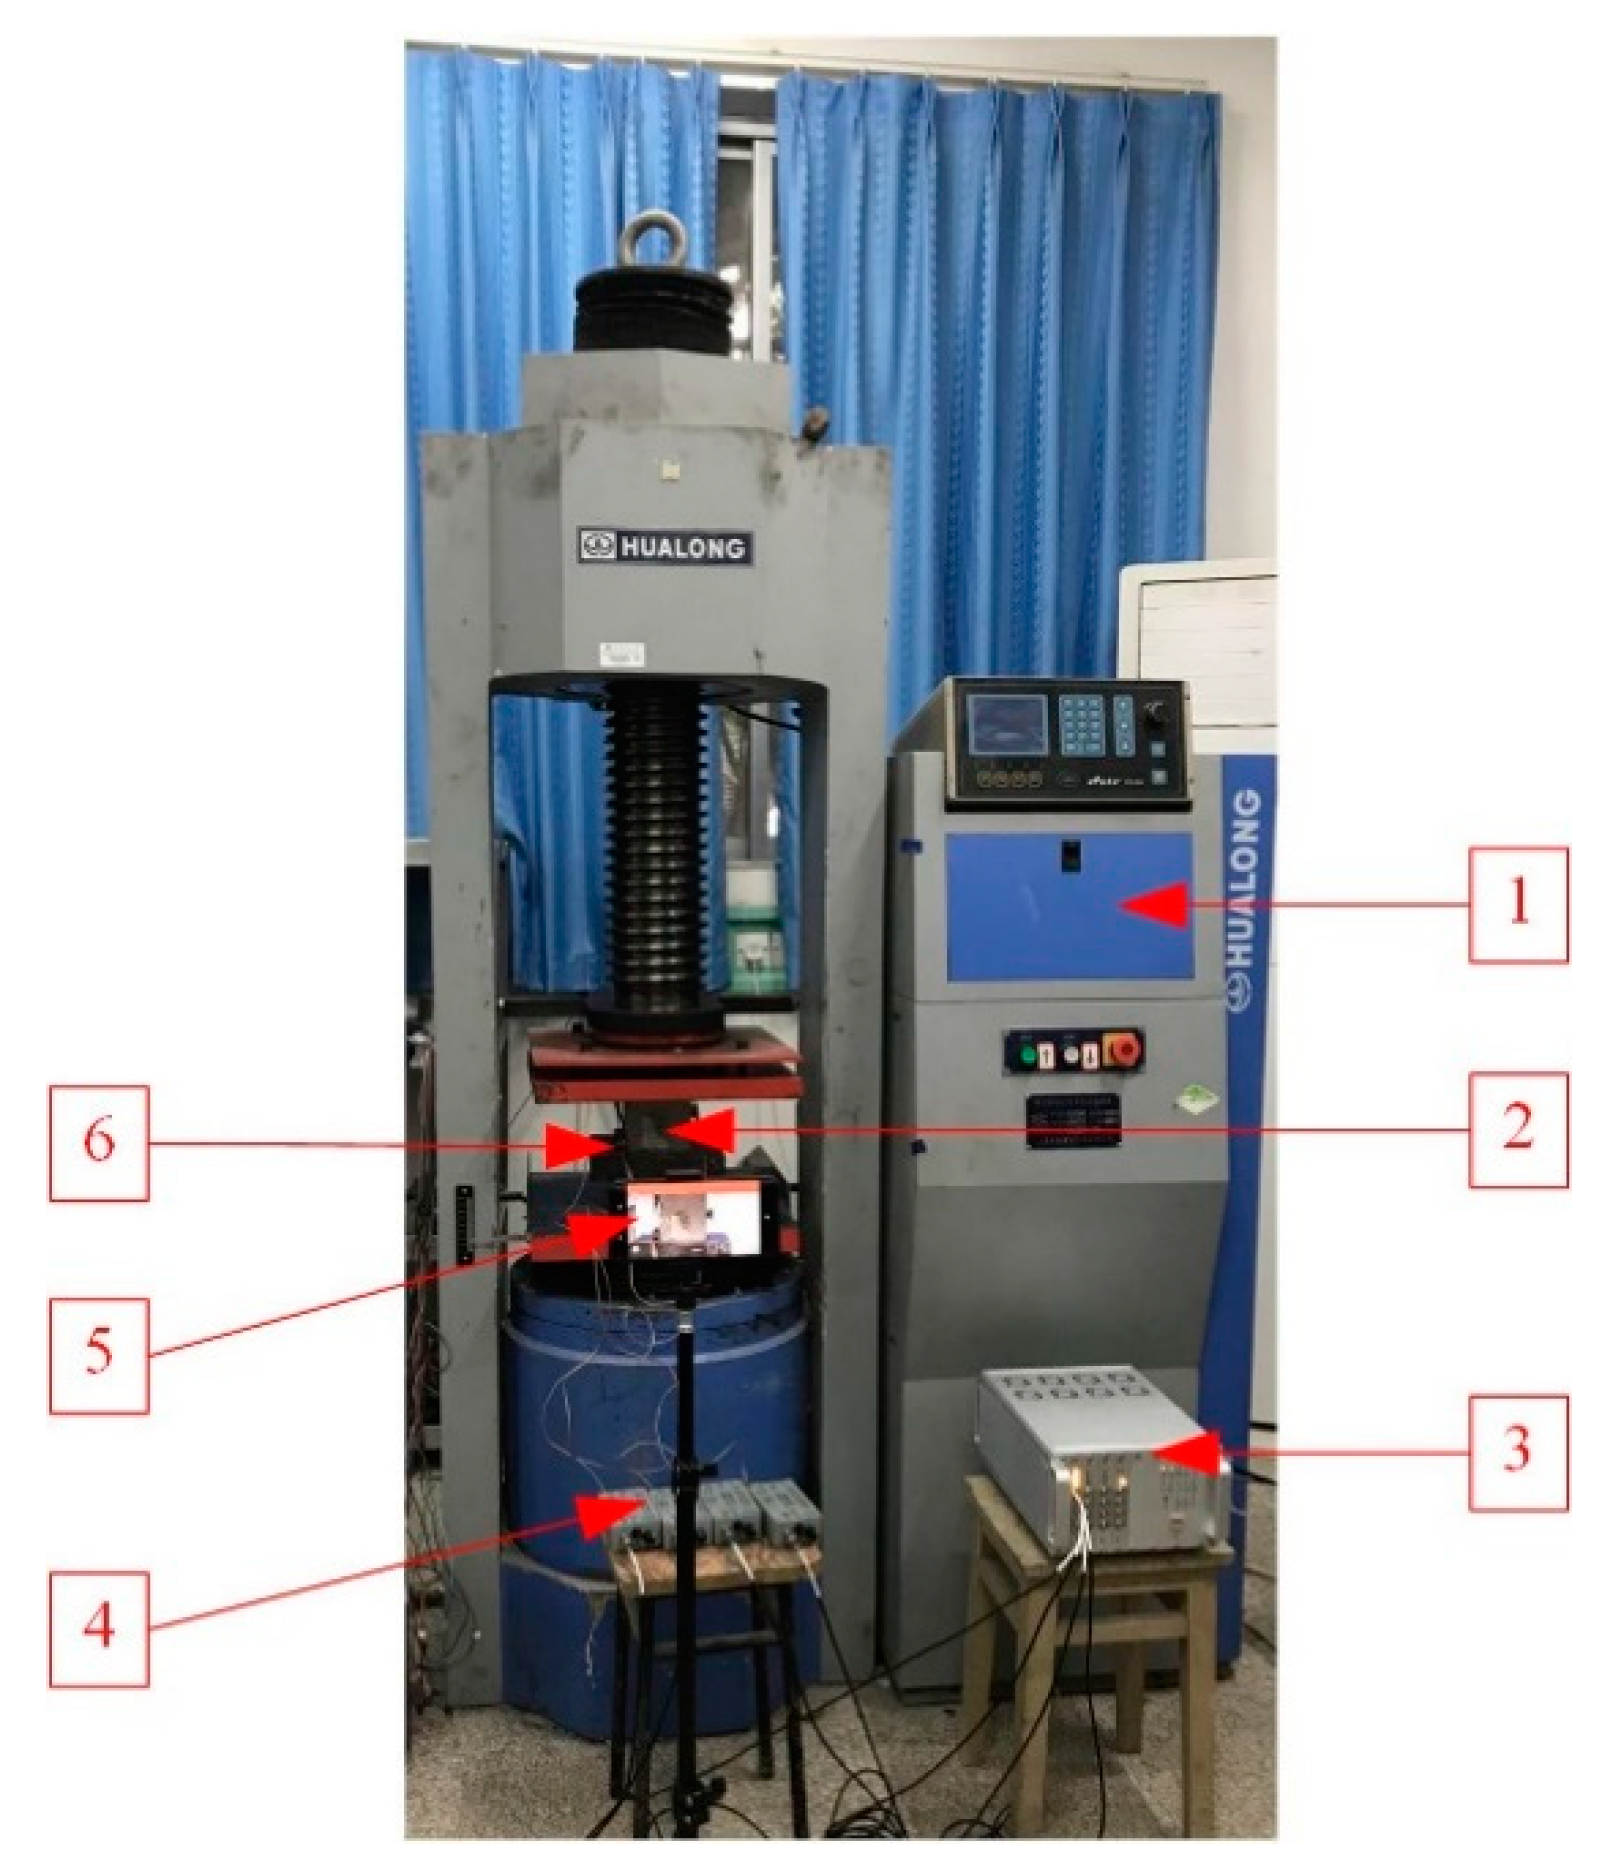
In order to verify the accuracy of the localization method, we carried out line localization test and concrete cracking localization tests. The line localization test method was to locate the PLB signals on 100 ×100 × 700 mm concrete samples (see Figure 11). The concrete cracking localization test method was to locate the crack AE signals while carrying out uniaxial compression tests (see Figure 12). The constant and modified wave velocities calculated with Equations (4) and (5) were used to locate the acoustic source.

5.2. Material and Wave Velocity

The cement concrete material composition for the localization test is listed in Table 2. The modified and constant wave velocities for each group are summarized in Table 3.

5.3. Localization Results

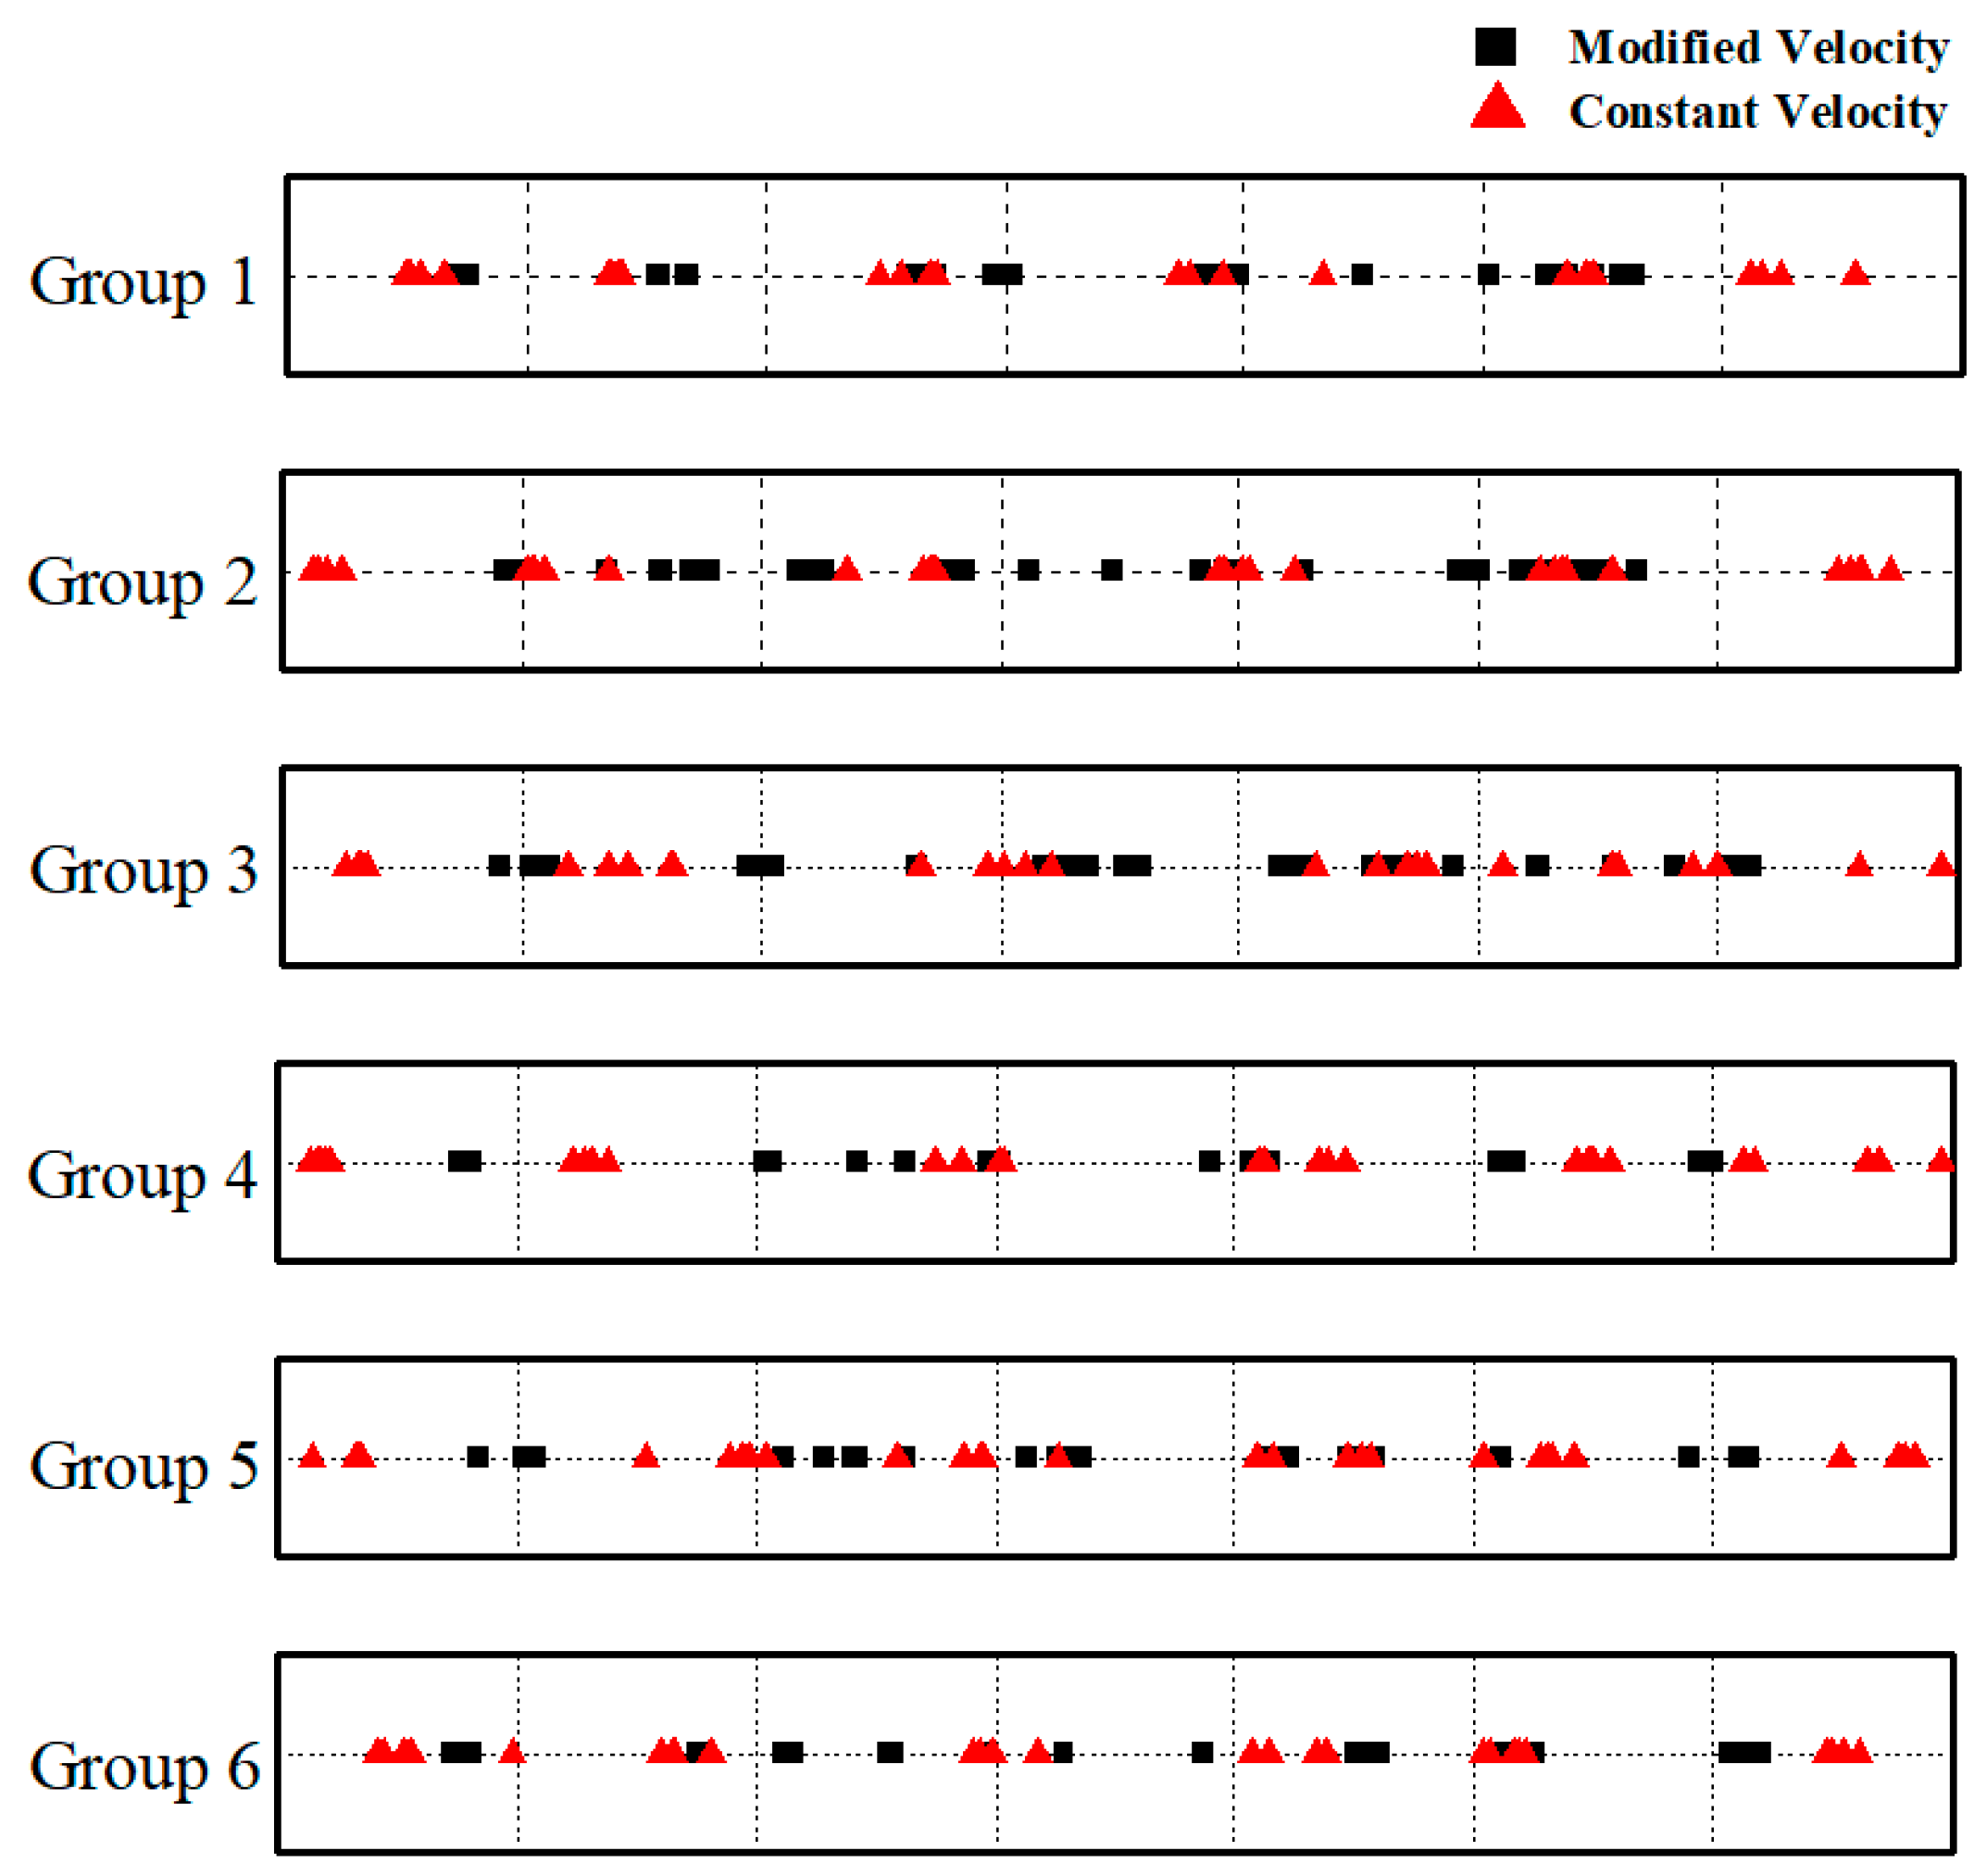
The localization results of PLBs based on the modified and constant wave velocities in the six groups are plotted in Figure 13.
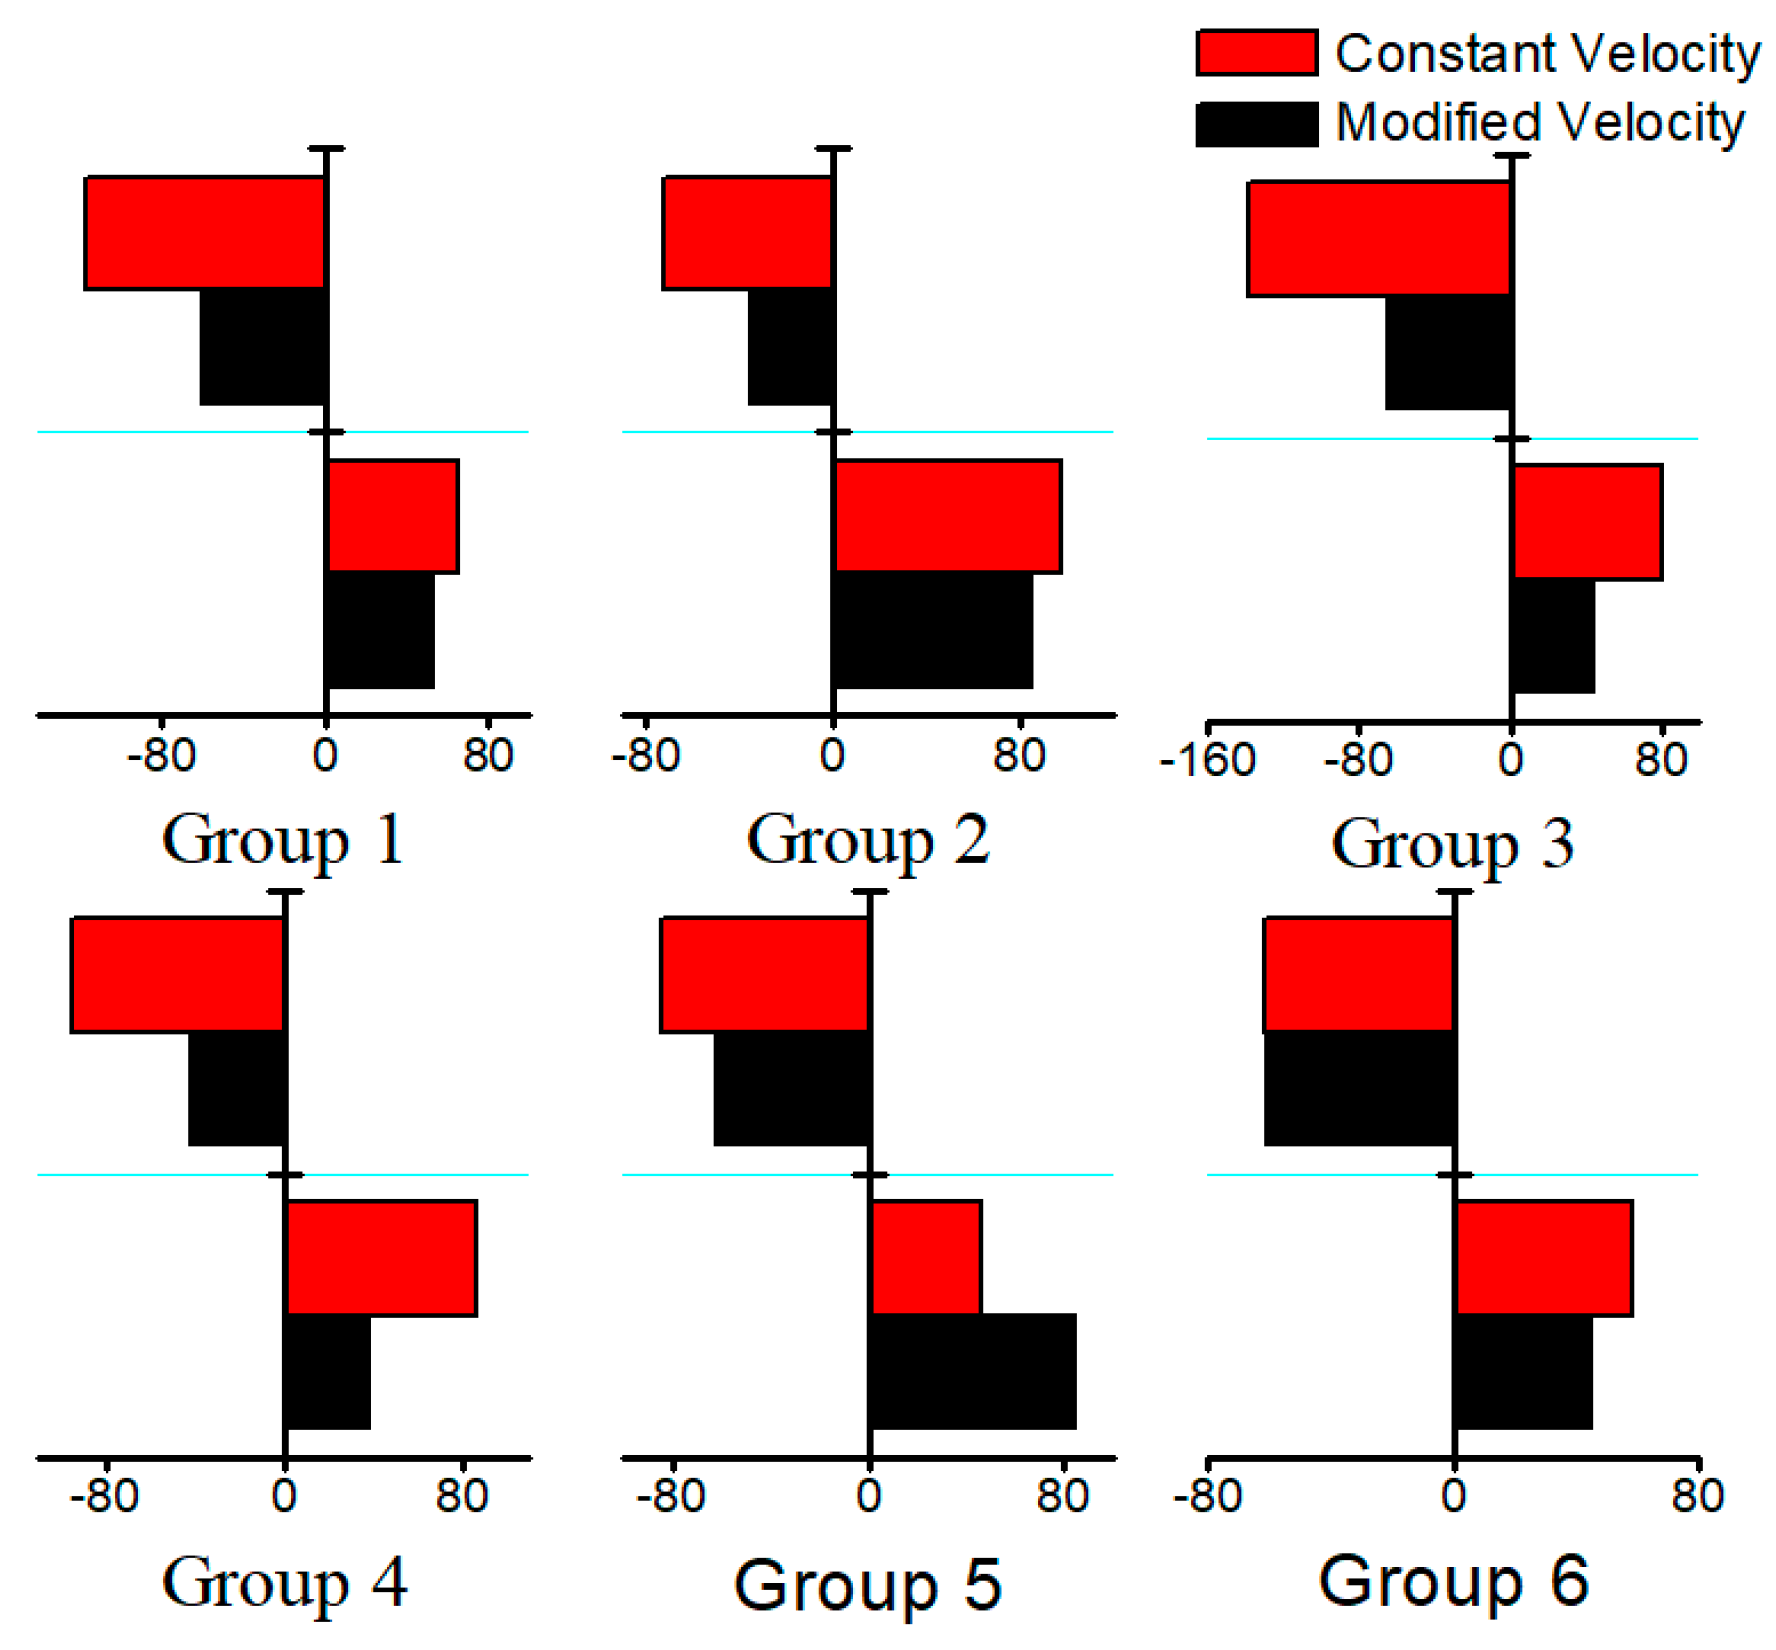
After subtracting the localization coordinates from the PLB point coordinates, the localization error of each group was plotted (see Figure 14). Comparisons indicate that the localization error of the constant wave velocity ranged from 28.5 to 61.1 mm, and that of the modified wave velocity ranged from 13.5 to 29.7 mm.
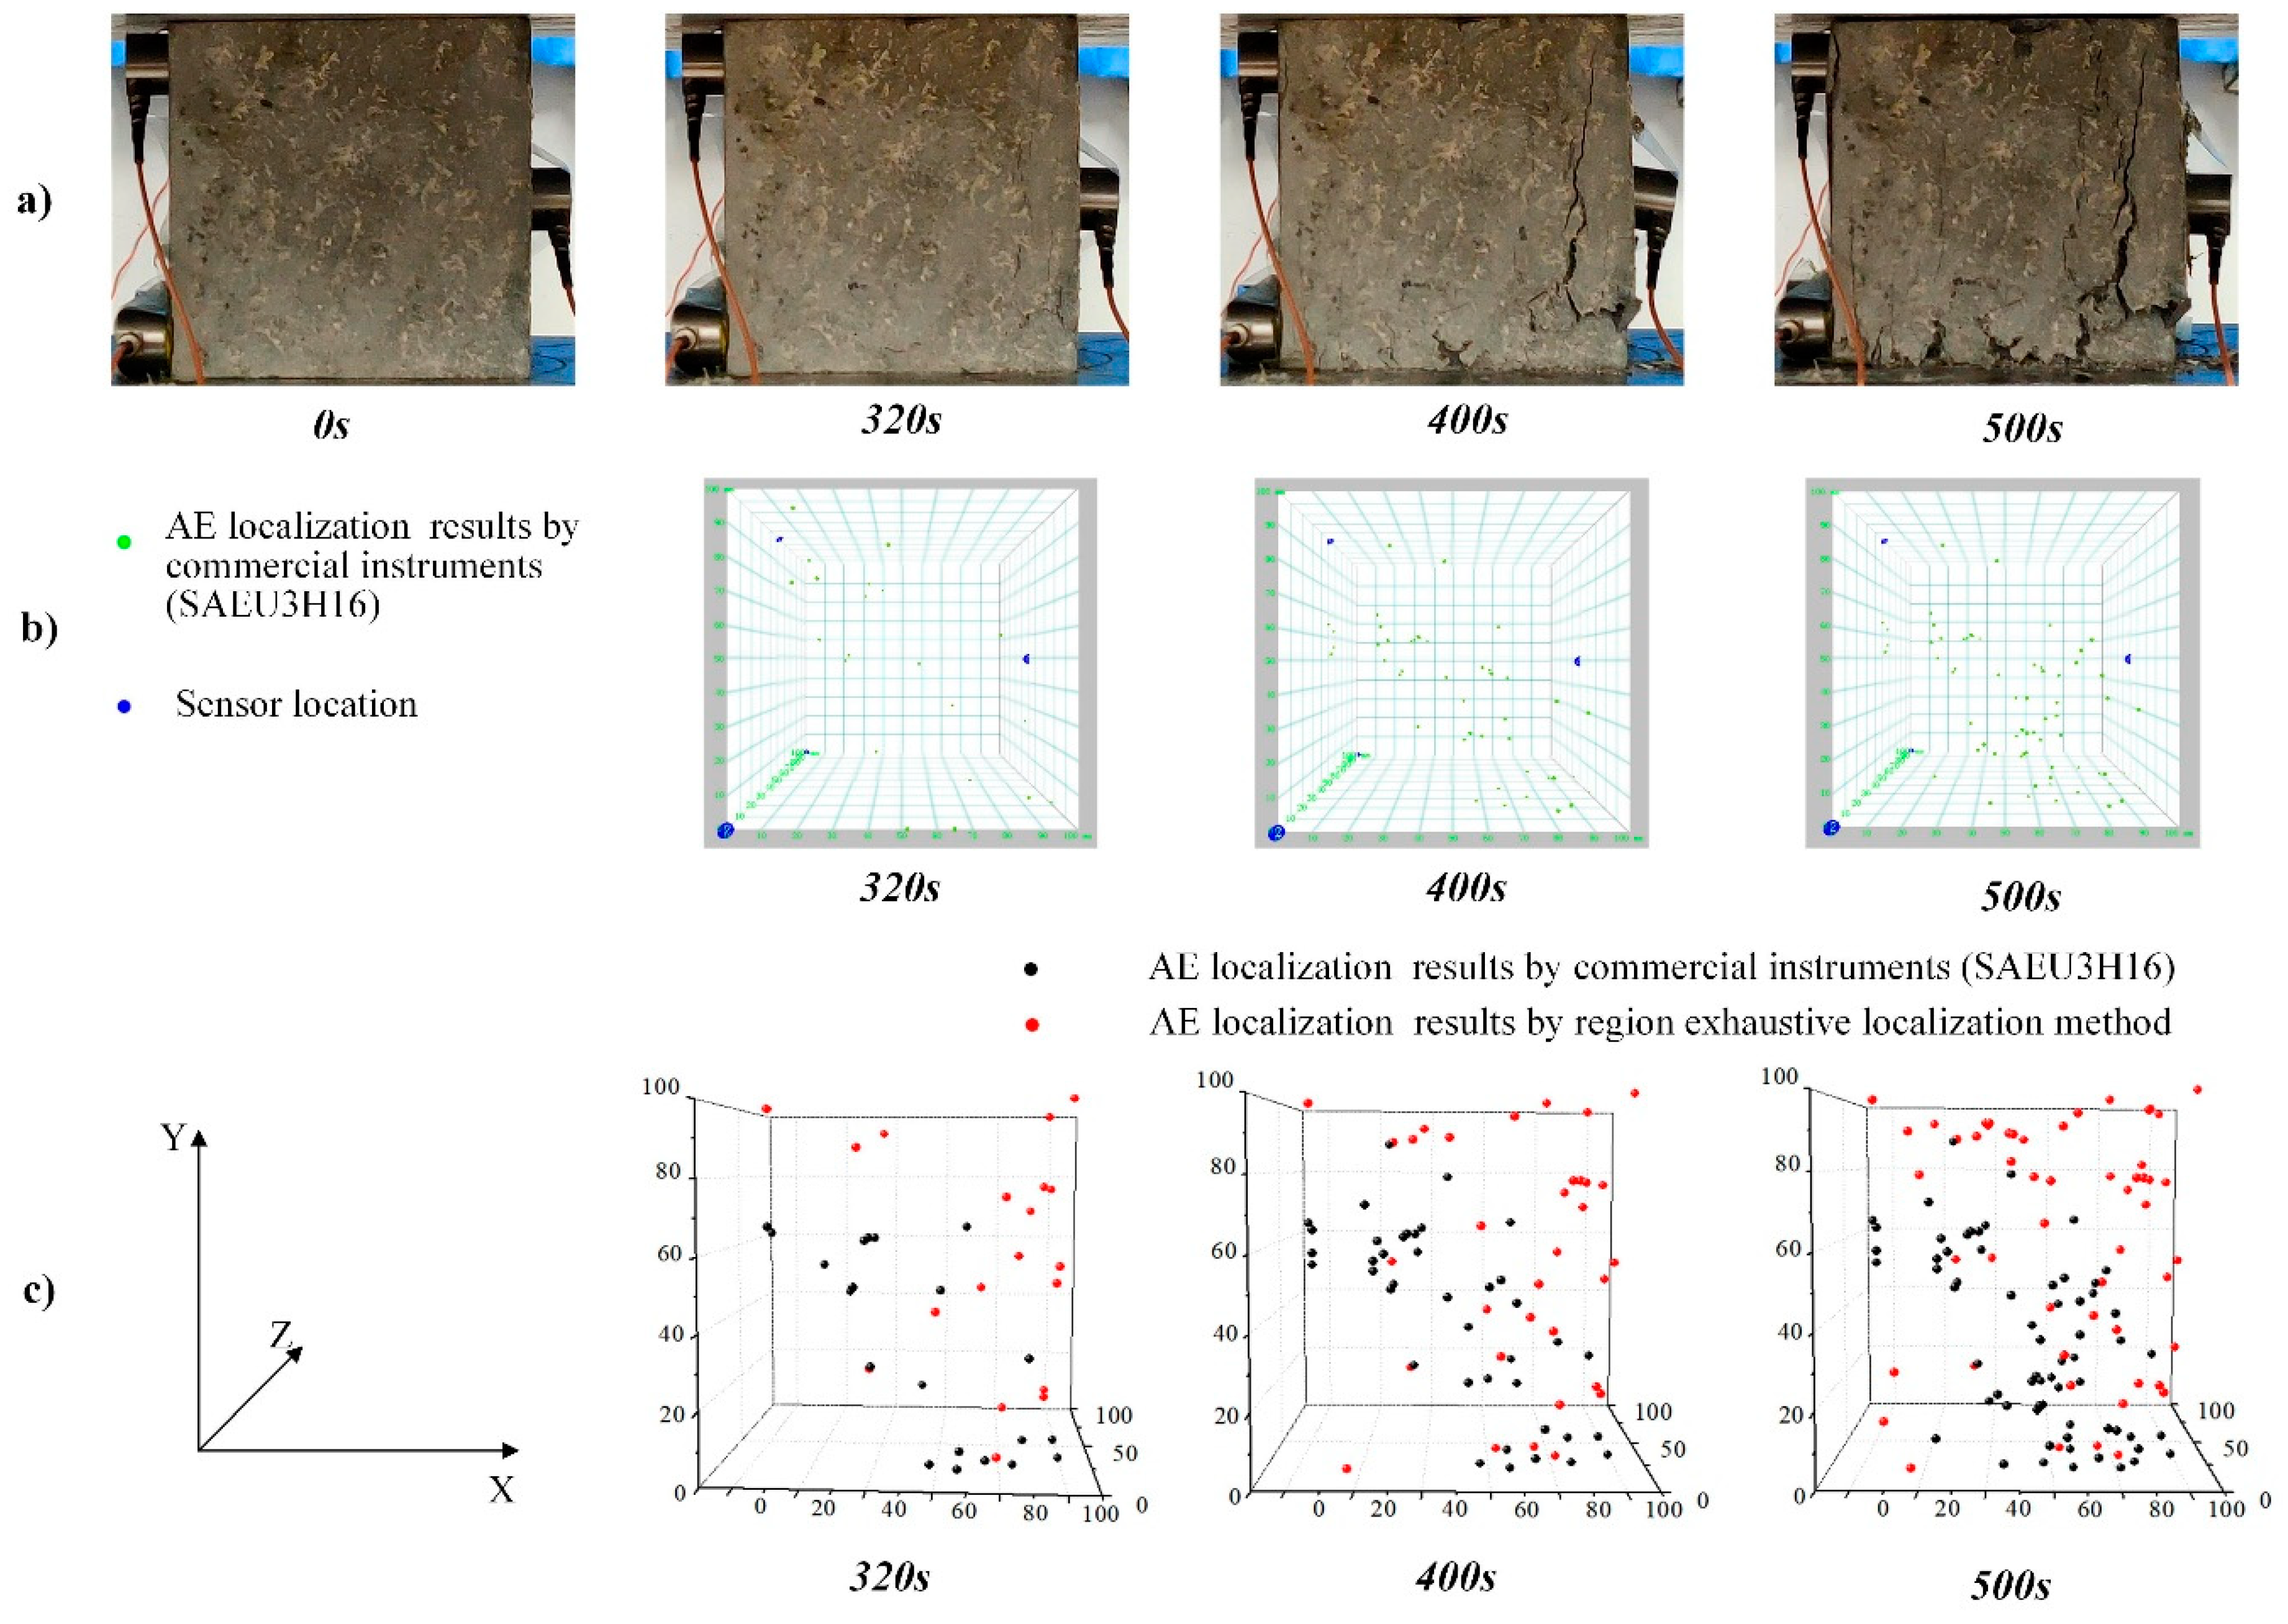
The concrete crack localization results are shown in Figure 15. Figure 15a shows the crack images in the concrete X-Y plane at 0 s, 320 s, 400 s, and 500 s taken with the high-definition camera during the loading test. Figure 15b shows the results of the AE event localization output using commercial AE detection equipment (SAEU3H16). This commercial equipment uses a 3-D time-difference-of-arrival (TDOF) localization method. Figure 15c shows the localization results obtained with the newly established method presented in this paper, which uses the same arrival time data as the SAEU3H16 location.
Most of the AE signals produced during the concrete uniaxial compression test come from within the concrete samples, and currently the localization of these acoustic sources cannot be determined accurately. Judging from the X-Y plane projection, the localization results of the newly developed method were closer to the actual concrete crack locations (see Figure 15a). This shows that the velocity correction method can considerably improve the acoustic source localization accuracy. However, this is only a qualitative conclusion and the true value of acoustic source localization is unknown; the localization accuracy cannot be evaluated quantitatively.

6. Conclusions

The effects of the water–cement ratio, sand ratio, and maximum aggregate size on acoustic wave velocity attenuation in concrete were studied based on acoustic wave velocity attenuation tests on 36 concrete specimens divided in 12 groups (i.e., six groups for the wave velocity attenuation tests and six groups for the positioning tests). The following are the main conclusions inferred.
Compared with the sand ratio, the influences of the water–cement ratio and aggregate size were considerably significant. The smaller the water–cement ratio, the larger the reference wave velocity and the greater the attenuation of the wave velocity with distance. Moreover, the larger the aggregate size, the larger the reference wave velocity and the greater the attenuation of wave velocity with distance. When the propagation distance reached 1000 mm, the wave velocity attenuation exceeded 50% as compared with the reference wave velocity. Therefore, the influence of wave velocity attenuation should be considered for long-distance acoustic source localization. A logarithmic function can be used to describe the attenuation law of wave velocity with distance, and the regression parameters can be calculated using three material mix parameters: Water–cement ratio, sand ratio, and maximum aggregate size. The wave velocity correction model developed in this study could enhance wave velocity accuracy in AE localization tests.
Using the addition of the possible acoustic source region, the region exhaustive localization method could potentially reduce the detection range to 50% of the original range. This range can be reduced further at the same nodal spacing thereby effectively improving the localization speed. The value of the modified wave velocity required to improve localization accuracy was quantitatively analyzed using the line localization results of the control group. Based on the uniaxial compression test results, the localization accuracy of the newly developed method and the TDOF method are qualitatively analyzed. The results indicate that the positioning error of the modified wave velocity is lesser than that of the constant wave velocity.
In this study, AE wave velocity was the primary factor in establishing a new AE source location algorithm. A main contributions of this study is that it demonstrates that when the AE sensor system is installed on the longitudinal edge of the concrete structure for 24-h structural health monitoring, the localization error due to signal transmission distance can be corrected. The region exhaustive localization method can quickly screen the localization signals, thereby reducing the localization time. This correction could improve the localization accuracy of concrete cracks. Further experiments are being carried out to extend the applicability of the regional exhaustive method in 3-D structures. Considering the importance of having a correct threshold and waveform trigger algorithm, we are preparing making the proper arrangements to add the arrival time when expanding the 2-D and 3-D algorithm to further improve the localization accuracy.

Author Contributions

Conceptualization, D.L.; funding acquisition, D.L. and Z.H.; investigation, K.Y., H.Z. and J.L.; methodology, D.L.; software, K.Y.; writing–original draft, K.Y. and H.Z.; writing—review & editing, D.L. All authors have read and agreed to the published version of the manuscript.

Funding

The financial support for this research was provided by the National Key R&D Program of China (2018YFB1600200) and the National Natural Science Foundation of China (Project 51908095).

Conflicts of Interest

The authors declare no conflict of interest.

Data Availability

The data used to support the findings of this study are included within the article.

References

  1. Ohtsu, M. Prospective applications of AE measurements to infradock of concrete structures. Constr. Build. Mater. 2018, 158, 1134–1142. [Google Scholar] [CrossRef]
  2. Zhou, Y.; Lin, L.; Wang, D.; He, M.; He, D. A new method to classify railway vehicle axle fatigue crack AE signal. Appl. Acoust. 2018, 131, 174–185. [Google Scholar] [CrossRef]
  3. Noorsuhada, M.N. An overview on fatigue damage assessment of reinforced concrete structures with the aid of acoustic emission technique. Constr. Build. Mater. 2016, 112, 424–439. [Google Scholar] [CrossRef]
  4. Paul, S.C.; Pirskawetz, S.; Van Zijl, G.P.A.G.; Schmidt, W. Acoustic emission for characterising the crack propagation in strain-hardening cement-based composites (SHCC). Cem. Concr. Res. 2015, 69, 19–24. [Google Scholar] [CrossRef]
  5. Carpinteri, A.; Xu, J.; Lacidogna, G. Reliable onset time determination and source location of acoustic emissions in concrete structures. Cem. Concr. Compos. 2012, 34, 529–537. [Google Scholar] [CrossRef]
  6. Lu, Y.; Li, Z.; Qin, L. Signal-based acoustic emission monitoring on mortar using cement-based piezoelectric sensors. ACI Mater. J. 2011, 108, 178–186. [Google Scholar] [CrossRef]
  7. Soulioti, D.; Barkoula, N.M.; Paipetis, A.; Matikas, T.E.; Shiotani, T.; Aggelis, D.G. Acoustic emission behavior of steel fibre reinforced concrete under bending. Constr. Build. Mater. 2009, 23, 3532–3536. [Google Scholar] [CrossRef] [Green Version]
  8. Lin, X.; Chen, G.; Li, J.; Lu, F.; Huang, S.; Cheng, X. Investigation of acoustic emission source localization performance on the plate structure using piezoelectric fiber composites. Sens. Actuators A Phys. 2018, 282, 9–16. [Google Scholar] [CrossRef]
  9. Salinas, V.; Vargas, Y.; Ruzzante, J.; Gaete, L. Localization algorithm for acoustic emission. Phys. Procedia 2010, 3, 863–871. [Google Scholar] [CrossRef] [Green Version]
  10. Yun, H.D.; Choi, W.C.; Seo, S.Y. Acoustic emission activities and damage evaluation of reinforced concrete beams strengthened with CFRP sheets. NDT E Int. 2010, 43, 615–628. [Google Scholar] [CrossRef]
  11. Marec, A.; Omas, J.H.; Guerjouma, R.E. Damage characterization of polymer-based composite materials: Multivariable analysis and wavelet transform for clustering acoustic emission data. Mech. Syst. Signal Process. 2008, 22, 1441–1464. [Google Scholar] [CrossRef]
  12. Kundu, T. Acoustic source localization. Ultrasonics 2014, 54, 25–38. [Google Scholar] [CrossRef]
  13. Tobias, A. Acoustic emission source location in two dimensions by an array of three sensors. Nondestruct. Test. 1976, 9, 9–12. [Google Scholar] [CrossRef]
  14. Liang, D.; Yuan, S.; Liu, M. Distributed coordination algorithm for impact location of preciseness and real-time on composite structures. Measurement 2013, 46, 527–536. [Google Scholar] [CrossRef]
  15. Kundu, T.; Das, S.; Martin, S.A.; Jata, K.V. Locating point of impact in anisotropic fiber reinforced composite plates. Ultrasonics 2008, 48, 193–201. [Google Scholar] [CrossRef]
  16. Nelder, J.A.; Mead, R. A simplex method for function minimization. Comput. J. 1965, 7, 308–315. [Google Scholar] [CrossRef]
  17. Barricelli, N.A. Symbiogenetic evolution processes realized by artificial methods. Methods 1957, 143–182. [Google Scholar]
  18. Fraser, A.; Burnell, D. Computer Models in Genetics; McGraw-Hill: New York, NY, USA, 1970; ISBN 0-07-021904-4. [Google Scholar]
  19. McLaskey, G.C.; Glaser, S.D.; Grosse, C.U. Beamforming array techniques for acoustic emission monitoring of large concrete structures. J. Sound Vib. 2010, 329, 2384–2394. [Google Scholar] [CrossRef]
  20. He, T.; Pan, Q.; Liu, Y.; Liu, X.; Hu, D. Near-field beamforming analysis for acoustic emission source localization. Ultrasonics 2012, 52, 587–592. [Google Scholar] [CrossRef]
  21. Matt, H.M.; Lanza di Scalea, F. Macro-fiber composite piezoelectric rosettes for acoustic source location in complex structures. Smart Mater. Struct. 2007, 16, 1489–1499. [Google Scholar] [CrossRef]
  22. Salamone, S.; Bartoli, I.; di Leo, P.; Lanza di Scalea, F.; Ajovalasit, A.; D’Acquisto, L.; Rhymer, J.; Kim, H. High-velocity impact location on aircraft panels using macro-fiber composite piezoelectric rosettes. J. Intell. Mater. Syst. Struct. 2010, 21, 887–896. [Google Scholar] [CrossRef]
  23. Salamone, S.; Bartoli, I.; Rhymer, J.; di Scalea, F.L.; Kim, H. Validation of the Piezoelectric Rosette Technique for Locating Impacts in Complex Aerospace Panels. Available online: https://www.spiedigitallibrary.org/conference-proceedings-of-spie/7984/79841E/Validation-of-the-piezoelectric-rosette-technique-for-locating-impacts-in/10.1117/12.880293.short?SSO=1 (accessed on 31 March 2011).
  24. Betz, D.C.; Thursby, G.; Culshaw, B.; Staszewski, W. Structural damage location with fiber Bragg grating rosettes and lamb waves. Struct. Health Monit. 2007, 6, 299–308. [Google Scholar] [CrossRef]
  25. Jiao, J.; He, C.; Wu, B.; Fei, R.; Wang, X. Application of wavelet transform on modal acoustic emission source location in thin plates with one sensor. Int. J. Press. Vessel. Pip. 2004, 81, 427–431. [Google Scholar] [CrossRef]
  26. Surgeon, M.; Wevers, M. One sensor linear location of acoustic emission events using plate wave theories. Mater. Sci. Eng. 1999, 265, 254–261. [Google Scholar] [CrossRef]
  27. Toyama, N.; Koo, J.H.; Oishi, R.; Enoki, M.; Kishi, T. Two-dimensional AE source location with two sensors in thin CFRP plates. J. Mater. Sci. Lett. 2001, 20, 1823–1825. [Google Scholar] [CrossRef]
  28. Gorman, M.R. AE source orientation by plate wave analysis. J. Acoust. Emiss. 1991, 9, 283–288. [Google Scholar]
  29. Du, G. Acoustic BASIS; Nanjing University Press: Nanjing, China, 2012. (In Chinese) [Google Scholar]
  30. Dong, L.; Li, B.; Zhou, L. Three-dimensional analytical solution of acoustic emission source location for cuboid monitoring network without pre-measured wave velocity. Trans. Nonferrous Met. Soc. China 2015, 25, 293–302. [Google Scholar] [CrossRef]
  31. Li, J.; Qin, L. Study on Acoustic Emission Localization of Concrete Using Modified Velocity. Adv. Civ. Eng. 2019, 1–11. [Google Scholar] [CrossRef]
  32. Men, J.; Guo, C.; Wang, Y.; Zhu, L. Tests for AE Wave Propagation Characteristic in RC Slabs. J. Vib. Shock 2019, 38, 270. [Google Scholar] [CrossRef]
  33. Xu, J.; Li, Y.; Tian, A.; Qu, J.M. Experimental Research on Size Effect of Acoustic Emission Location Accuracy. Chin. J. Rock Mech. Eng. 2016, 35, 2826–2835. [Google Scholar] [CrossRef]
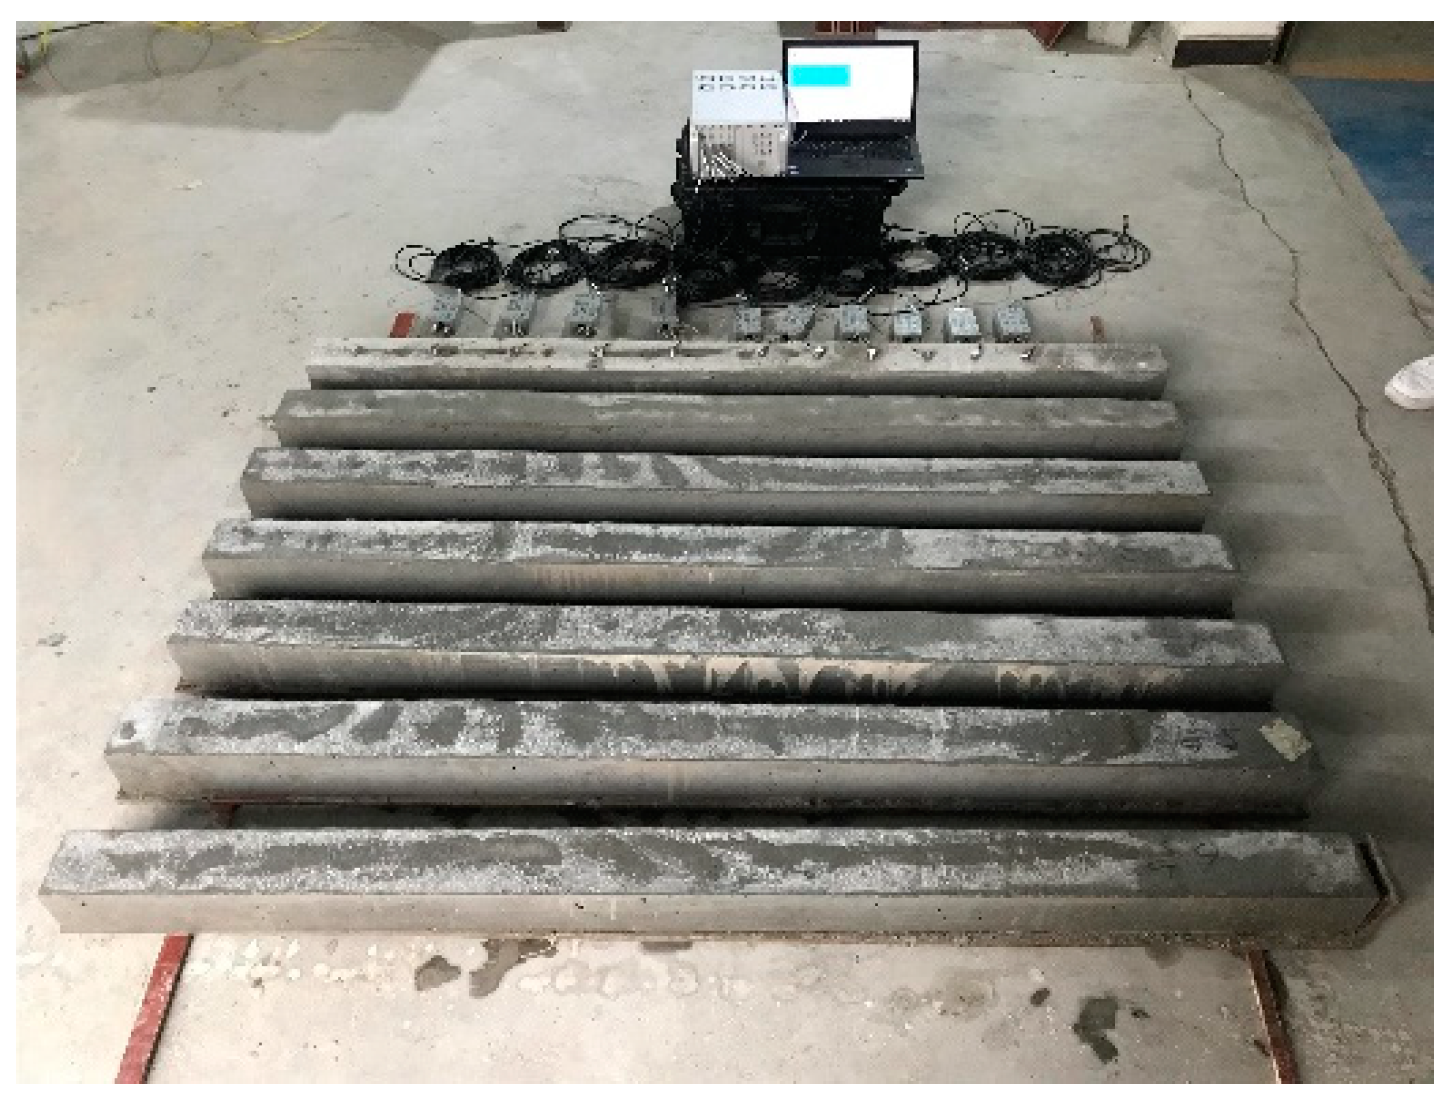
Figure 1. Test sample.
Sustainability 12 07405 g001
Figure 2. AE testing equipment. 1-Monitor; 2-High-speed digital AE detector with 16 channels; 3-Preamplifier; 4-SR 150M AE Sensor.
Sustainability 12 07405 g002
Figure 3. PLB break point and 16 sensor locations in the wave velocity attenuation test.
Sustainability 12 07405 g003
Figure 4. Technological process of the region exhaustive localization method.
Sustainability 12 07405 g004
Figure 5. Acoustic emission (AE) source region based on the highest and second highest output signals.
Sustainability 12 07405 g005
Figure 6. Principle of nodal division.
Sustainability 12 07405 g006
Figure 7. AE signal waveforms of a PLB (w/c = 0.3; S = 0.5; dmax = 10).
Sustainability 12 07405 g007
Figure 8. Influence of water–cement ratio on wave velocity; (a) velocity vs distance; (b) Ra vs distance.
Sustainability 12 07405 g008
Figure 9. Influence of sand ratio on wave velocity; (a) velocity vs distance; (b) Ra vs distance.
Sustainability 12 07405 g009
Figure 10. Influence of maximum aggregate size on wave velocity; (a) velocity vs distance; (b) Ra vs distance.
Sustainability 12 07405 g010
Figure 11. Break point and sensor positions in the localization test.
Sustainability 12 07405 g011
Figure 12. AE localization test during concrete uniaxial compression. 1-Load system; 2-Concrete specimen; 3-High-speed digital AE detector with 16 channels; 4-Preamplifier; 5-High-definition camera; 6-SR 150M AE Sensor.
Sustainability 12 07405 g012
Figure 13. AE source localization results of PLBs.
Sustainability 12 07405 g013
Figure 14. AE source localization error of PLBs.
Sustainability 12 07405 g014
Figure 15. AE source crack localization results; (a) actual concrete crack taken with camera; (b) AE localization results by SEU3H16; (c) AE localization results by region exhaustive localization method. (w/c = 0.36, S = 0.5; dmax = 20).
Sustainability 12 07405 g015
Table 1. AE Waveform Characterization Parameters (w/c = 0.3; S = 0.5; dmax = 10).
ChannelAE AmplitudeAE CountAE DurationAE EnergyAE Arrival Time
197.119814815.95210:17:06:43:316:855700
281.314813880.19010:17:06:43:316:884200
373.614513250.04410:17:06:43:316:918600
468.712713520.03510:17:06:43:316:962000
556.95210600.00310:17:06:43:317:027200
657.8319920.00210:17:06:43:317:068600
759.9249610.00210:17:06:43:317:106700
953.9179600.00110:17:06:43:317:192400
1051.3129410.00110:17:06:43:317:232300
1150.999830.00110:17:06:43:317:273500
1345.9222010:17:06:43:317:361600
Table 2. Material composition.
Groupw/cSdmax [mm]Mixture
10.30.5101:0.3:1.47:1.47
20.30.5201:0.3:1.47:1.47
30.30.47201:0.3:1.4:1.56
40.30.55201:0.3:1.61:1.32
50.330.5201:0.33:1.66:1.66
60.360.5201:0.36:1.86:1.86
Table 3. Measured constant wave velocity and modeled modified wave velocity (groups 1–6).
Coordinate of Break Point
[mm]
Constant Velocity
[m/s]
Modified Velocity
[m/s]
10026592797–6706
20027062640–8580
30029063158–10,224
40027973021–9302
50027822980–11,397
60026312742–7441