Article

Seasonal Variation Analysis Method of GHG at Municipal Solid Waste Incinerator

1
Climate Change Research Center, Sejong University, Seoul 05006, Korea
2
Department of Earth and Environmental Sciences, Sejong University, Seoul 05006, Korea
*
Author to whom correspondence should be addressed.
Sustainability 2020, 12(18), 7425; https://doi.org/10.3390/su12187425
Submission received: 23 July 2020 / Revised: 8 September 2020 / Accepted: 8 September 2020 / Published: 9 September 2020

Abstract

:
The greenhouse gas emissions of the waste incineration sector account for approximately 43% of the total GHG emissions and represent the majority of the CO2 emissions from waste in Korea. Improving the reliability of the GHG inventory of the waste incineration sector is an important aspect for the examination of global GHG emission management according to the Paris Agreement. In this study, we introduced a statistical approach to analyze seasonal changes through analysis of waste composition and CO2 concentration in Municipal Solid Waste incinerators and applied the methodology to one case study facility. The analysis results in the case study showed that there was no seasonal variation in waste composition and CO2 concentrations, except for wood. Wood is classified as biomass, and the GHG emissions caused by biomass incineration are reported separately, indicating that the effect of an MSW incinerator on GHG emissions is not significant. Therefore, the seasonal effect of CO2 concentration or waste composition may not be an impact when calculating GHG emissions from case study facilities’ MSW incinerators. This study proposed an approach for analyzing factors that affect the GHG inventory reliability by analyzing seasonal characteristics and variation through the statistical analysis, which are used for the calculation of the GHG emissions of an MSW incinerator.

1. Introduction

Waste can be treated using various methods. In Korea, waste treatment methods include recycling, landfilling, and incineration. The amount of waste treated in Korea was 404,812 tons/day in 2018 [1]. Recycling represented the highest proportion with 83.9% (319,579 tons/day), followed by landfilling 9.4% (35,604 tons/day), incineration 6.0% (22,918 tons/day), and sea dumping 0.7% (2608 tons/day) [1]. Among them, landfilling and incineration are the waste treatment methods related to greenhouse gas (GHG) emissions. Since 2013, the GHG emissions from landfills have been slowly decreasing, while those from incineration have remained constant. Therefore, the importance of the waste incineration sector is increasing in terms of GHG inventory management.
The GHG emissions from waste in Korea were estimated to be 16.8 million ton CO2 eq in 2017. In particular, the GHG emissions of the waste incineration sector were 7.2 million ton CO2 eq, accounting for approximately 43% of the total GHG emissions and representing the majority of the CO2 emissions from waste in Korea [2]. Improving the reliability of GHG inventory of the waste incineration sector is an important aspect for the examination of global GHG emission management according to the Paris Agreement, and for the measurement, reporting, and verification (MRV) of the GHG inventory related to GHG/energy target management and emission trading scheme.
The GHG emission of the waste incineration sector can be calculated using two methods. First, in most countries, it is calculated using the dry matter fraction, carbon fraction, and fossil carbon fraction (FCF) based on the waste composition. Therefore, it is important to identify the characteristics related to the waste composition.
Second, it is calculated using the CO2 concentration, FCF, and flow rate of the exhaust gas during the incineration of waste, based on the incineration gas analysis. This method has a simpler procedure than the composition-based emissions calculation method and can reduce the uncertainty involved in composition analysis [3,4,5]. However, recent studies have still been conducted on greenhouse gas emissions based on waste compositions [6]. Therefore, studies related to CO2 concentration are required, and studies on whether there are additional factors (seasonality) to consider in relation to waste compositions are also required. This study attempted to analyze the necessity of considering the characteristics of CO2 concentration and waste composition, as well as seasonal differences, as it was judged to be necessary to analyze the main factors (CO2 concentration, waste composition) applied to the two methods when measuring emissions.
Generally, waste generation characteristics can be different depending on the living environments of people, such as city sizes and regions. In particular, they are known to be affected by seasonal factors. The seasonality of municipal solid waste (MSW) can be affected by weather conditions, such as heavy rainfall, heavy snowfall, and droughts. Explicitly, MSW in Korea is affected because the country experiences four seasons (spring (March–May), summer (June–August), autumn (September–November), and winter (December–February)) [7].
Studies related to the seasonal characteristics of household waste composition have been conducted in Korea, Mexico, and Eastern Europe (entire household waste). In the case of research related to waste characteristics conducted in Korea, the relationship between changes in social activities and changes in waste discharge was conducted, and another study was conducted on the composition of household waste according to housing type and living standard, and seasonal characteristics. In the case of the Mexican study, the characteristics of household waste were identified in consideration of the socio-economic level. The seasonality of waste properties has been identified mainly in April, August, and January, and Eastern European studies have analyzed the characteristics of waste properties using statistical data. However, although these studies were referring to seasonality, they were generally targeted for a short year (one year), or there were not many analyses on seasonal characteristics by detailed waste. In addition, the analysis was not conducted properly on waste incineration facilities subject to the calculation of greenhouse gas emissions [8,9,10,11]. On the other hand, this study conducted an analysis based on data for two years and conducted a study on the detailed characteristics of Intergovernmental Panel on Climate Change (IPCC) considered in the emission calculation. This study introduces a statistical approach that can analyze seasonal characteristics through the analysis of the waste composition and the measurement of the CO2 concentration of incineration gas for MSW incinerators. In addition, a case study was conducted for an incinerator to examine seasonal variation through the application of this methodology.

2. Methods

In this study, the waste composition was analyzed, and the CO2 concentration was measured in real-time at an MSW incinerator in Korea to investigate seasonal characteristics and variations. Waste composition analysis was conducted based on the waste compositions presented by the Korean Waste Process Test Method and IPCC, and CO2 concentration analysis was conducted in real-time based on the United States Environmental Protection Agency (US EPA) Method 3A method. The waste compositions and CO2 concentration analysis data were collected for two years to confirm seasonal characteristics, and seasonal differences were confirmed using a statistical method (average distribution comparison).

2.1. Selection of Objective Facilities

The Gyeonggi region, which is treating the largest amount of MSW in Korea, was selected as the target facility. An MSW incinerator, that incinerates more than 150 tons a day on average, was selected as the target facility. The target facility is equipped with a stoker-type combustion facility, which is one of the most used methods for incineration facilities in Korea.

2.2. Analysis of CO2 Concentration from Flue Gas at MSW Incinerator

In this study, the CO2 concentration was continuously measured to secure more representative data. A non-dispersive infrared analyzer (NDIR) that corresponds to EPA Method 3A was used for the measurement of CO2 concentration.
The analyzer performed measurement using MCS 100 E (SICK Maihak, Freiburg, Germany). Figure 1 presents the system configuration related to the measurement of CO2 concentration, which was measured by connecting a sampling tube to the final outlet of the MSW incinerator. A heat line was used to maintain the temperature of the exhaust gas until it reached the measuring device. A gas cooler was installed at the front end of the measuring device to remove moisture from the exhaust gas. The measurement period was conducted for 2 years, and a total of 24 samples could be obtained using monthly average data.

2.3. Analysis of Waste Composition at MSW Incinerator

The waste composition was analyzed based on the waste composition presented by the waste test method of Korea and IPCC [12,13]. Figure 2 shows the procedure for the analysis of the waste composition, where 200 kg MSW samples were collected using a crane and then reduced to 20 kg using conical quartering. They were divided into the waste components (based on IPCC 2006 G/L) used for the calculation of GHG emissions. The weight of each component was measured, and its proportion was calculated. In addition, the sampling was conducted once a month for two years, and 24 data were secured for each waste composition and analyzed.

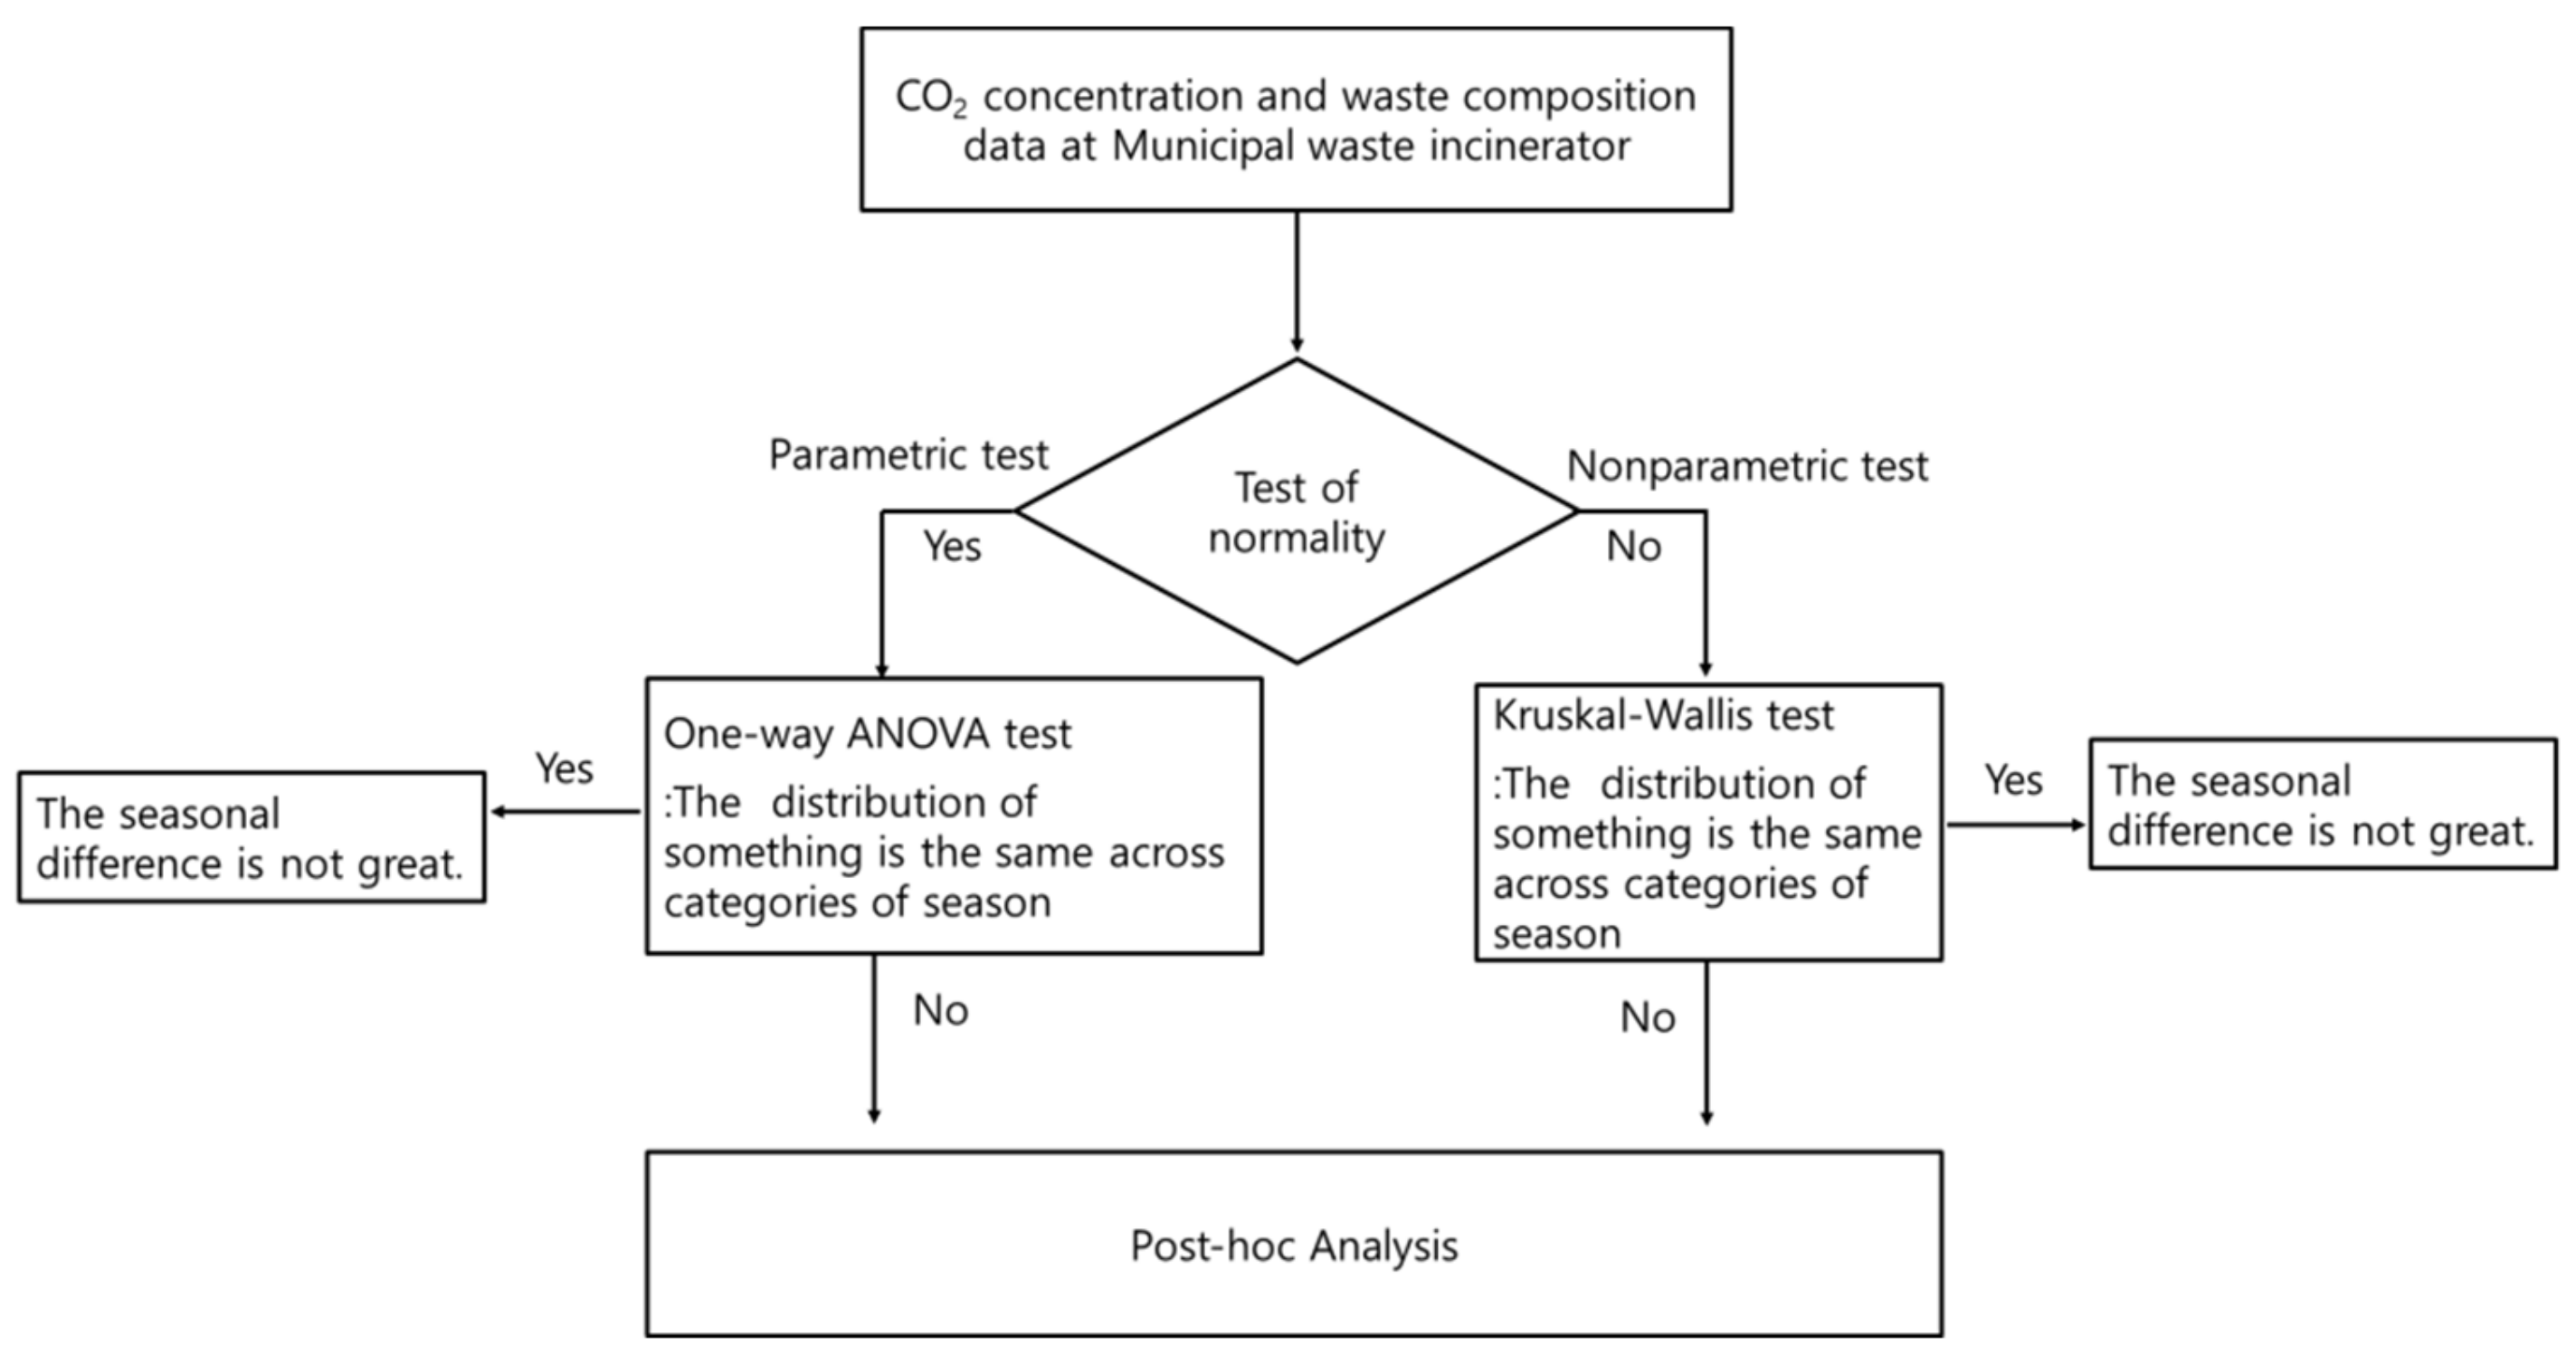
2.4. Statistical Method for Seasonal Variation Analysis

To analyze the seasonal variation of an MSW incinerator, the method of dividing data (CO2 concentration, waste composition) into seasonal items and statistically comparing them can be used in addition to the simple comparison of differences according to the season. Thus, there was a study conducted in which the measured data were divided into months, quarters, half years, and years, and these groups were compared using the mean distribution comparison analysis method to apply the appropriate measurement time, even though the study was not on seasonal variation. Therefore, in this study, this method was referred to, and seasonal variation was analyzed through the mean distribution comparison analysis method based on the monthly waste composition analysis and monthly average CO2 concentration measurement data. The SPSS, version 21 (IBM, New York, NY, USA) software was used for statistical analysis.
For the statistical analysis of the waste composition and CO2 concentration measurement data, the normality of the data had to be tested first. The Q-Q plot, chi-square test, Kolmogorov-Smirnov (K-S) test, and Shapiro-Wilks test are mainly used as normality test methods; the K-S test and Shapiro-Wilks test are performed using the sample size of the population [14,15,16,17,18,19].
The Shapiro-Wilks and K-S tests are used when the sample sizes of the population are less than and more than 2000, respectively [20,21,22]. In these tests, normality and non-normality are tested through the significance probability. Normality tests assume a normal distribution as a null hypothesis. A normal distribution is determined if the significance probability is higher than 0.05, and non-normality is determined by rejecting the null hypothesis if the significance probability is lower than 0.05.
The mean distribution comparison analysis method is performed differently depending on the normality test results. When the CO2 concentration and waste composition data are normally distributed, one-way ANalysis Of VAriance (ANOVA) analysis must be conducted. When the data are not normally distributed, the Kruskal-Wallis test, which can compare the distributions of three or more groups, is used among nonparametric methods. Therefore, in this study, a seasonal comparison method was determined according to the normality test results. Figure 3 presents the procedure of the statistical approach for seasonal variation analysis.

3. Results and Discussion

3.1. Seasonal Characteristics of Flue Gas CO2 Concentration

Herein, seasonal variations in waste composition and GHGs emitted during the incineration of waste were analyzed, and CO2 was selected as the target GHG (Table 1).
When the CO2 concentration data were analyzed, the average CO2 concentration of waste incinerator A was found to be 7.3%. The average seasonal concentration was highest (7.5%) in summer, but there was no significant seasonal variation when the overall trend was observed. This was found to correspond to the lowest value among the 7–9% CO2 concentration range of previous studies measured in Korea [23]. CO2 emissions based on incineration gas are calculated as the product of flow rate and fossil carbon content and CO2. Therefore, the estimated CO2 concentration for incineration gas emissions is one of the very important factors. In the case of waste incineration facility A, the seasonal difference in CO2 concentration is not large, so the seasonal effect on CO2 emissions is not expected to be significant, and it is necessary to check the impact of additional statistical approaches.

3.2. Seasonal Characteristics of Waste Composition

As the purpose of this study is to examine seasonal variation in the waste composition that affects GHG emissions, the wastes used in the calculation of GHG emissions were analyzed. Therefore, seasonal characteristics were analyzed for the composition excluding non-combustibles and other wastes.
The analysis results, as summarized in Table 2, revealed that plastic represented the highest average proportion of 26% in the entire waste, followed by paper, rubber/leather, wood, food, textiles, garden waste, and diapers.
In the case of plastic, the overall average proportion was 26%, but the highest proportion of 28% was observed in summer. For paper, the overall average proportion was 25%, but the highest proportion was found to be 27% in autumn.
As for rubber/leather and wood, the overall average proportions were 11% and 8%, respectively; however, the highest proportions of 14% and 15%, respectively, were observed in autumn. In the case of food and textiles, the overall average proportions were 8% and 7%, respectively; however, the highest proportions of 11% and 10%, respectively, were observed in summer. In the case of garden waste, the overall average proportion was 4%, but the highest proportion was found to be 6% in winter. For diapers, the overall average proportion was 2%; however, the highest proportion of 5% was observed in spring. This was compared with the characteristics of domestic waste in other regions of Korea conducted in the previous study. In the case of paper and plastic, which accounted for the largest proportion, it was similar to the paper average ratio (25%) of the waste incineration facility in this study and the paper average ratio (26%) in other regions of Korea. However, in the case of plastics, there was a significant difference when compared to 25% in this study and 13% in previous studies [8]. In the case of a study conducted by Mexico, it was found that paper was 13% and plastic was 15%, which was lower than that of Korean waste [9].
The reason that the ratio of woods is high in autumn is believed to be due to a large number of leaves and branches in autumn. Lithuania has been shown to generate a lot of food waste in the fall. It was analyzed that this reason was due to harvesting activities. The amount of garden waste generated was large in October and November, which is explained because garden and park cleaning is performed a lot at this time. In the case of this study, food waste appears to occur a lot in summer, so there is a difference in food waste; and in the case of wood waste similar to garden waste, it appears that there are many in autumn, but this part was confirmed to be similar [10]. However, it is not possible to confirm that seasonal differences in the compositions of the rest of the waste show a consistent difference, so statistical analysis is necessary. Therefore, it is judged that better results can be secured to confirm seasonal differences by statistical analysis in Section 3.3.

3.3. Seasonal Variation of Statistical Method at MSW Incinerator

Before the analysis of seasonal variation, the normality of the composition analysis data and CO2 concentration measurement data was tested using a statistical software (SPSS, version 21). Since the sample size of the data was less than 2000, the data normality was tested using the Shapiro-Wilks method.
Table 3 summarizes the normality test results. Plastic, rubber, and paper were normally distributed because the significance probability was higher than 0.05. However, the other data were not normally distributed as the significance probability was less than 0.05. Therefore, the Kruskal-Wallis test was used to analyze seasonal variation.
The seasonal variations in waste composition and CO2 concentration were analyzed using the Kruskal-Wallis test, and the results are presented in Table 4.
The Kruskal-Wallis test results indicated that the significance probabilities of all the items, except for wood, were higher than 0.05, indicating that there was no seasonal variation for most of the waste composition.
To identify the cause of seasonal variation in wood, the seasonal response data were examined as a post hoc test, and the results are summarized in Table 5. The results of comparing seasonal responses showed that the proportion of wood was not the same in autumn and spring because the significance level was less than 0.05, and the seasonal pairwise comparison results were found to be similar. This appears to be because there was more wood waste in autumn than in spring. It seems that the seasonal impact on MSW incinerators is low in Korea because of the high recycling rate of waste treatment, and food waste is treated separately owing to the implementation of the volume-rate food waste disposal system since 2013. Additionally, the recent waste generation is not significantly different depending on the season according to the national survey on waste statistics in Korea, and this seems to be due to similar consumption behavior in each season [24].

4. Conclusions

There are two methods for calculating CO2 emissions from waste incineration facilities. First, in the calculation of CO2 emissions based on waste composition, the amount of waste incineration is multiplied by the waste composition ratio, dry matter content, carbon content, and fossil carbon content to calculate the emissions. Among them, the dry matter content, carbon content, and fossil carbon content must be applied according to the waste composition, so the waste composition ratio can be seen as an important factor in the calculation of CO2 emissions based on the waste composition.
Second, in the case of waste incineration gas-based CO2 emissions, it is calculated as the product of the flow rate at which waste incineration gas is discharged, the fossil carbon content, and the CO2 concentration. Therefore, it can be seen that the effect of CO2 concentration is large. This study introduces a statistical approach to analyze seasonal differences in relation to these two factors (waste composition, CO2 concentration) and analyzes seasonal differences through actual measurement of case study facilities. The CO2 concentration of this research facility was 7.3% on average, which was similar to the low level of the facility concentration compared to 7–9% of the CO2 concentration range of the pre-research facility conducted in Korea.
This study was compared to the domestic waste characteristics of other parts of Korea, which were conducted in a preliminary study. In the case of paper and plastic, which account for the largest percentage, the average percentage of paper (25%) in the waste incineration facility under this study was similar to that of paper (26%) in other Korean regions. However, in the case of plastics, this study showed a significant difference when compared with 25% in the previous study area and 13% in the prior study area. This differs from region to region, and the subject of this study was also found to be different because the target was waste injected into waste incineration facilities in the region. In the case of a study conducted in Mexico, 13% of paper and 15% of plastic were found to be lower than Korea’s waste. Therefore, it is necessary to secure representative data that reflects Korea’s characteristics when calculating emissions.
The analysis results in the case study showed that there was no seasonal variation in waste composition, except for wood. In the case of wood waste, similar to the study in Lithuania, autumn was found to be high, but in the case of food waste, Lithuania took up a large proportion in autumn and Korea took up a large proportion in summer, showing a difference. In the case of Korea, food waste is separately managed rather than sent to incineration facilities, so it is judged that this difference is difficult to see seasonal effects. Wood is classified as biomass, and the GHG emissions (CO2 emissions) caused by biomass incineration are reported separately, indicating that the effect of an MSW incinerator on GHG emissions (CO2 emissions) is not significant. Even in the case of CO2 concentration, there is no statistical seasonal difference, so it is judged that the seasonal effect of CO2 emission will not be significant. Therefore, the seasonal effect of CO2 concentration or waste composition may not be an impact when calculating GHG emissions (CO2 emissions) from case study facilities’ MSW incinerators.
This study proposed an approach for analyzing factors that affect the GHG inventory reliability by analyzing seasonal characteristics and variation through the statistical analysis of the waste composition and CO2 concentration in flue gas, which are used for the calculation of the GHG emissions of an MSW incinerator. In addition, the CO2 concentration data measured flue gas of MSW, and waste composition proportion data for each season were presented for reference. If basic data, such as the data presented in this study, are collected in the future through more studies, they are expected to help improve the GHG inventory in the waste sector.
Herein, seasonal variation was analyzed for an MSW incinerator. Therefore, if research is conducted on seasonal variation by applying the same methodology for several facilities in the future, it will be possible to secure higher reliability. In addition, the method proposed in this study can be applied to other factors that may be affected seasonally (carbon content, dry matter content, fossil carbon content), so if additional data are secured and analyzed, the overall seasonal effect is determined by waste incineration.

Author Contributions

All authors contributed to the research presented in this work. Their contributions are presented below. Conceptualization, E.-c.J.; methodology and writing—original draft preparation, S.K.; data curation, J.R. All authors have read and agreed to the published version of the manuscript.

Funding

This work is supported by Korea’s Ministry of Environment (MOE) and the Korea Environment Corporation.

Conflicts of Interest

The authors declare no conflict of interest

References

  1. Ministry of Environment of Korea(MOE). 2018 Waste Generation and Treatment Status in Korea; Ministry of Environment: Incheon, Korea, 2019.
  2. Greenhouse Gas Inventory & Research Center of Korea (GIR). National Inventory Report in Korea; Greenhouse Gas Inventory & Research Center of Korea: Seoul, Korea, 2019. [Google Scholar]
  3. Kang, S.; Kim, S.; Lee, J.; Jeon, Y.; Kim, K.-H.; Jeon, E.-C. A Study on Applying Biomass Fraction for Greenhouse Gasses Emission Estimation of a Sewage Sludge Incinerator in Korea: A Case Study. Sustainability 2017, 9, 557. [Google Scholar] [CrossRef] [Green Version]
  4. Seongmin, K.; Jaehyung, C.; Yoon-Jung, H.; Daekyeom, L.; Ki-Hyun, K.; Eui-Chan, J. Estimation of optimal biomass fraction measuring cycle for municipal solid waste incineration facilities in Korea. Waste Manag. 2018, 71, 176–180. [Google Scholar]
  5. Kang, S.; Cho, C.; Kim, K.; Jeon, E. Fossil Carbon Fraction and Measuring Cycle for Sewage Sludge Waste Incineration. Sustainability 2017, 9, 2790. [Google Scholar] [CrossRef] [Green Version]
  6. Kanchan, P.; Kim, H.; Kim, Y.; Nguyen, Y.; Kim, S. Prediction of greenhouse gas emission from municipal solid waste for South Korea. Environ. Eng. Res. 2020, 25, 462–469. [Google Scholar]
  7. Yoo, K.; Yoo, M. Relationship between Seasonal Variation of Solid Waste Generation and Natural-Social Activities; Korea Society of Waste Management: Seoul, Korea, 1997; Volume 14, pp. 141–150. [Google Scholar]
  8. Hyun, J.; Kim, J.; Bok, J.; Choi, W. Investigation of the Regional and Seasonal Trend of Municipal Wastes Generation in the Asan. J. Korea Soc. Waste Manag. 2007, 24, 629–633. [Google Scholar]
  9. Guadalupe, G.; Meneses, M. Seasonal Characterization of Municipal Solid Waste in the City of Chilhuahua Mexico. Waste Manag. 2009, 29, 2018–2024. [Google Scholar]
  10. Denafas, G.; Ruzgas, T.; Martuzevičius, D.; Shmarin, S.; Hoffmann, M.; Mykhaylenko, V.; Ogorodnik, S.; Romanov, M.; Neguliaeva, E.; Chusov, A.; et al. Seasonal Variation of Municipal Solid Waste Generation and Composition in Four East European Cities. Resour. Conserv. Recycl. 2014, 89, 22–23. [Google Scholar] [CrossRef]
  11. Bexultan, A.; Berik, A.; Almira, Y.; Diyar, T.; Christos, V.; Stavros, P.; Yerbol, S.; Vassilis, I. Seasonal characterisation of municipal solid waste from Astana city, Kazakhstan: Composition and thermal properties of combustible fraction. Waste Manag. Res. 2019, 37, 1271–1281. [Google Scholar]
  12. IPCC. 2006 IPCC Guidelines for National Greenhouse Gas; Intergovernmental Panel on Climate Change, IPCC: Incheon, Korea, 2006; Volume 5. [Google Scholar]
  13. Ministry of Environment. Waste Process Testing Standards; Ministry of Environment: Incheon, Korea, 2017.
  14. Boes, D.C.; Graybill, F.A.; Mood, A.M. Introduction to the Theory of Statistics; McGraw-Hill: New York, NY, USA, 1974. [Google Scholar]
  15. Devore, J.L. Probability and Statistics for Engineering and the Science; Springer: New York, NY, USA, 1995. [Google Scholar]
  16. Ni-Bin, C.; Eric, D. Municipal solid waste characterizations and management strategies for the Lower Rio Grande Valley, Texas. Waste Manag. 2018, 28, 776–794. [Google Scholar]
  17. Cecilia, A.; Arnout, F.H.; Jeanette, S.; Alma, B.; Per, L.; Bart, N.Z. Polybrominated diphenyl ethers (PBDES) at a solid waste incineration plant I: Atmospheric concentrations. Atmos. Environ. 2004, 38, 5139–5148. [Google Scholar]
  18. Guillermo, B.; Oscar, F.; Begona, J.; Gema, G. Factors influencing variability and potential uptake routes of heavy metals in black kites exposed to emissions from a solid-waste incinerator. Environ. Toxicol. Chem. 2003, 22, 2711–2718. [Google Scholar]
  19. Nornadiah, M.R.; Yap, B.W. Power Comparisons of Shapiro-Wilk, Kolmogorov-Smirnov, Lilliefors and Anderson-Daring tests. J. Stat. Model. Anal. MARA Univ. Tech. 2011, 2, 21–33. [Google Scholar]
  20. Royston, J.P. An Extension of Shapiro and Wilk’s W Tests for Normality to Large Samples. J. R. Stat. Soc. 1982, 31, 115–124. [Google Scholar] [CrossRef]
  21. Royston, J.P. Algorithm AS 177: Expected Normal Order Statistics (Exact and Approximate). J. R. Stat. Soc. 1982, 31, 161–165. [Google Scholar] [CrossRef]
  22. Royston, J.P. Algorithm AS 181: The WTest for Normality. J. R. Stat. Soc. 1982, 31, 176–180. [Google Scholar]
  23. Kang, S.; Cha, J.; Cho, C.; Kim, K.; Jeon, E. Estimation of appropriate CO2 concentration sampling cycle for MSW incinerators. Energy Environ. 2020, 31, 535–544. [Google Scholar] [CrossRef]
  24. Ministry of Environment. The 5th (2016–2017) National Waste Statistics Survey in Korea; Ministry of Environment: Incheon, Korea, 2017.
Figure 1. Schematic of CO2 concentration measurement from flue gas.
Sustainability 12 07425 g001
Figure 2. Schematic of waste composition sampling at Municipal Solid Waste (MSW) incinerator.
Sustainability 12 07425 g002
Figure 3. Schematic of seasonal variation analysis method at MSW incinerator.
Sustainability 12 07425 g003
Table 1. Seasonal characteristics of flue gas CO2 concentration at Municipal Solid Waste (MSW) incinerator.
SeasonMeanTotal MeanStandard DeviationMinimumMaximum
Spring7.2 7.30.1 7.1 7.4
Summer7.5 0.7 7.0 8.9
Autumn7.1 0.1 6.9 7.2
Winter7.3 0.1 7.2 7.5
Unit: %.
Table 2. Seasonal characteristics of waste composition at MSW incinerator.
CompositionSeasonMeanTotal MeanStandard DeviationMinimumMaximum
PaperSpring262562037
Summer2291036
Autumn27101639
Winter2532027
GardenSpring246115
Summer2307
Autumn5207
Winter65215
FiberSpring57318
Summer105418
Autumn84413
Winter5236
RubberSpring9113513
Summer104515
Autumn144620
Winter102712
FoodSpring68228
Summer1110325
Autumn87322
Winter83514
DiapersSpring528022
Summer1103
Autumn2114
Winter1012
WoodSpring38318
Summer56116
Autumn156522
Winter103612
PlasticSpring242632028
Summer2862237
Autumn2761835
Winter2632332
Unit: %.
Table 3. The results of normality test of waste composition and CO2 concentration.
Normality Test ResultShapiro-Wilks
StatisticDegree of Freedom, DfSig.
An MSW incineratorPaper0.977240.835
Fiber0.900240.022
Food0.787240.0002
Wood0.907240.031
Garden0.79224<0.0001
Rubber0.957240.390
Diapers0.44724<0.0001
Plastic0.968240.628
CO2 concentration0.61324<0.0001
Table 4. The results of Kruskal-Wallis test by waste composition and CO2 concentration.
Hypothesis testNull HypothesisTestSig.Decision
An MSW incineratorThe distribution of Paper is the same across categories of seasonIndependent-Samples Kruskal-Wallis Test0.832Retain the null hypothesis
The distribution of Fiber is the same across categories of seasonIndependent-Samples Kruskal-Wallis Test0.058Retain the null hypothesis
The distribution of Food is the same across categories of seasonIndependent-Samples Kruskal-Wallis Test0.756Retain the null hypothesis
The distribution of Wood is the same across categories of seasonIndependent-Samples Kruskal-Wallis Test0.005Reject the null hypothesis
The distribution of Garden is the same across categories of seasonIndependent-Samples Kruskal-Wallis Test0.500Retain the null hypothesis
The distribution of Rubber is the same across categories of seasonIndependent-Samples Kruskal-Wallis Test0.103Retain the null hypothesis
The distribution of Diapers is the same across categories of seasonIndependent-Samples Kruskal-Wallis Test0.188Retain the null hypothesis
The distribution of Paper is the same across categories of seasonIndependent-Samples Kruskal-Wallis Test0.696Retain the null hypothesis
The distribution of Plastic is the same across categories of seasonIndependent-Samples Kruskal-Wallis Test0.061Retain the null hypothesis
Table 5. The results of pairwise comparison test by wood composition.
IncineratorPairwise Comparisons of Season for WoodAdjusted Significant *Test Statistic
An MSW incineratorSummer–Autumn0.086−10.000
Summer–Spring1.0003.333
Summer–Winter0.1339.333
Autumn–Spring0.00713.333
Autumn–Winter1.0004.000
Spring–Winter0.850−6.000
* The result of Bonferroni correction.

