Article

Safety and Efficiency Analysis of Turbo Roundabout with Simulations Based on the Lujiazui Roundabout in Shanghai

1
School of Naval Architecture Ocean & Civil Engineering, Shanghai Jiao Tong University, Shanghai 200240, China
2
School of Design, Shanghai Jiao Tong University, Shanghai 200240, China
*
Author to whom correspondence should be addressed.
Sustainability 2020, 12(18), 7479; https://doi.org/10.3390/su12187479
Submission received: 14 August 2020 / Revised: 8 September 2020 / Accepted: 9 September 2020 / Published: 11 September 2020
(This article belongs to the Special Issue Sustainable and Safe Roundabouts)

Abstract

:
Traditional multilane roundabouts have many branch lanes without traffic signs and channelization, which leads to a high tendency for traffic collisions. Turbo roundabouts are a new design that has the potential to reduce lane-change conflicts using canalization to force drivers to keep in specific lanes based on their intended destination. This paper evaluates the safety and efficiency performance of turbo roundabouts for the case of a five-leg roundabout called Lujiazui in Shanghai and provides design and construction guidelines when applying the turbo design. The models for the Lujiazui roundabout and the reconstructed turbo version were built in Vissim, and a comprehensive series of experiments under different traffic volumes and central island radii was performed. Afterward, the conflict statistics extracted from the trajectory files in the Surrogate Safety Assessment Model (SSAM) were analyzed using the conflict severity index (CSI) and were then integrated to calculate the modified conflict frequency (MCF) for safety performance evaluation. A comparative efficiency analysis was also conducted as a supplement. Based on the results, the relative characteristics for safety and efficiency between the turbo and original designs of the Lujiazui roundabout were analyzed. Suggestions to apply the turbo design on a five-leg roundabout are introduced.

1. Introduction

In a road network, intersections are recognized as the most dangerous and critical locations, as several points of conflict exist. As severe collisions and crashes have a large probability of occurring there, they are a considerable threat to the health and property of road users. To improve the safety performance at intersections, researchers have been developing roundabouts since 1902 to slow the speed of vehicles while sacrificing traffic efficiency [1,2]. Compared with traditional signalized intersections, roundabouts have been proven to help reduce the severity of accidents [3] and play an important role in improving the sustainability of transportation by reducing emissions of air pollutants [4]. However, an increasing number of studies indicate poor traffic safety characteristics and a low capacity for standard two-lane roundabouts [5,6,7,8,9,10,11]. Due to the lack of sign usage for route selection or other channelizing measures, there are several lane-change conflict points when vehicles are forced to decelerate based on the geometric size and curvature of the central island, which may cause side-by-side collisions and reduce road safety [12,13]. To address these problems, a new roundabout layout, called the turbo roundabout, was proposed in the Netherlands by Dutch researcher Dr. Lambertus Fortuijn in 1996. A turbo roundabout is a specially designed multilane roundabout with a spiral circulatory roadway where the traffic flows at the entrance, and the exits are physically separated by lines or raised lane dividers, which prevents lane-change behavior [6,14,15,16]. As road users have to choose their routes before entering the roundabouts, weaving conflicts are eliminated, and sideswipe collisions at entrances and exits are reduced [17,18,19]. Several variant forms of turbo roundabouts have been developed. The primary four-leg forms are given in the design guidelines of the Netherlands [20], Slovenia [21] and Serbia [22], including the egg, basic, knee, spiral and rotor turbo roundabout. Among them, the egg, basic, knee and spiral roundabouts are suitable for conditions when traffic flow from a single approach is predominant, while rotor or star roundabouts are recommended for equal traffic volumes at all entries [23]. The variants can be further modified by varying the number of entry lanes. Turbo roundabouts have been used in several countries, especially throughout Europe. According to the data from the website Dirk de Baan [24], there were 603 turbo roundabouts located in 24 countries in Europe, North and South America and South Africa on 2 February 2020. Most are in the Netherlands (372), as this layout was developed there, and it is where the first turbo roundabout was built.
Turbo roundabouts have not yet been introduced into China, and nearly all roundabouts in China are of the standard form without path channeling. Thus, heavy congestion and severe crashes occur often, especially in those with high traffic volumes. In five-leg roundabouts, the problem may be more critical, as traffic volumes tend to be higher and the number of conflict points is more prominent than in a common four-leg roundabout. The purpose of this study is to investigate the validity of turbo roundabouts in improving the safety performance under various traffic conditions based on a case study—the Lujiazui roundabout (a five-leg roundabout in Shanghai)—and discuss the guidelines on implementing this new design on a five-leg roundabout regarding efficiency and safety. To achieve these goals, comparative simulation experiments were conducted, and a new safety evaluation method is proposed in this paper to evaluate the safety performance of roundabouts, relying on the data generated in microsimulation models.

2. Literature Review

Over the past 20 years, scholars have conducted relatively in-depth and thorough studies on roundabouts in terms of traffic safety and efficiency using different approaches. Mahdalova et al. [25] presented the relationship between the inscribed circle diameter of a roundabout and the crash rate. Furthermore, Kim and Choi [26] developed a model to investigate the relationship between crashes and roundabout geometric characteristics to reveal major geometric elements of roundabout safety. The final selection of the independent variables includes the number of approaches, the number of entering lanes, the entry width, the flare width, the number of circulating lanes and the circulating lane width. Anjana and Anjaneyulu [27] found that geometric features of the central island, circulatory roadway and approach roads are associated with crash occurrences for roundabout approaches. Tollazzi and Rencelj [2] conducted a comparative analysis of the standard two-lane, flower and turbo roundabout under four traffic load variants and three options for right-turners in the main traffic direction using the microsimulation software Vissim. It was found that there is an insignificant difference in congestion and queue lengths between the three designs at low traffic loads, while at higher traffic loads, the flower roundabout showed advantages in reduced delays. From these reviews, it is worthwhile to discuss the geometric characteristics of turbo roundabouts from the perspective of traffic safety and efficiency.
As an alternative design with potential value, turbo roundabouts have been discussed in comparative analyses with typical or traditional forms to assess the benefit of conversion. Fortujin [16] indicated that a turbo roundabout has a higher capacity than a standard concentric double-lane roundabout due to its better lane-split. Giuffrè et al. [15] discussed the capacity performance of turbo roundabouts compared with a typical one and gave the advantage domain in terms of capacity. It was found that the capacity of a turbo roundabout is higher than that of a typical one for circulating flows within a certain range. This view was also expressed in [18]. Elhassy et al. [28] investigated the effect of converting a conventional roundabout into a rotor form, one of the typical turbo designs, with the consideration of aggressive driving behavior. It was concluded that when volumes exceed 4500 vehicles per hour or they are oversaturated, rotor roundabouts may not be as suitable as conventional roundabouts. For the safety performance of turbo roundabouts, Fortuijn [6] noted that the conflict points are reduced compared to conventional roundabouts. In addition, Izadi et al. [12] found, based on a case study, that in different layouts and traffic conditions, turbo roundabouts reduce the number of total potential accidents by between 40% and 50% and potential collisions with injuries by between 20% and 30%. Bulla and Castro [19] developed a risk assessment methodology by scoring conflicts from three aspects (consequence, time of exposure and probability) and found a 22% reduction in risk assessment by comparing the average risk of classical and turbo roundabouts based on a case study. Gallelli and Vaiana [29] analyzed the effect of converting a standard roundabout into an egg turbo roundabout on potential conflicts and found an 85% reduction in total conflicts and a 95% reduction in rear-end conflicts. However, there have been few studies on comparative safety analysis under various traffic conditions.
The existing research adopts indices such as deceleration, collision points and the Surrogate Safety Assessment Model (SSAM) output indicators and establishes a conflict propensity and severity evaluation system based on these indices to evaluate the safety performance of roundabouts. Tak et al. [30] proposed the deceleration-based surrogate safety measure (DSSM) as an indicator for rear-end collision risk evaluation based on the safety conditions and decision-making process during human driving. This indicates a strong relationship between the proposed surrogate safety measures and the crash potential. In addition, existing studies used SSAM to analyze the conflict data exported by a microsimulation tool to evaluate traffic safety performance [31]. Al-Ghandour et al. [32] analyzed several volume distribution scenarios with different percentages of turning traffic using SSAM, and the results showed that the conflict frequency varied greatly under different scenarios, which implies the influence of flow distribution on conflict events. Souleyrette and Hochstein [33] developed and refined a conflict analysis methodology using SSAM to compare the safety consequences of alternative designs and improve the conflict and crash modification factors. The maximum postencroachment time (PET) and time-to-collision (TTC) thresholds have been used to identify critical vehicle–vehicle interactions (i.e., conflicts). However, there are certain deficiencies if only using the SSAM output for safety analyses because the initial indices or a risk assessment model with a simple structure cannot correctly reflect the actual traffic safety performance. For instance, conflicts in SSAM must meet both the TTC and PET threshold criteria to be identified as conflicts. However, the TTC appears to be a better indicator of collision propensity, and the PET may not be as appropriate for screening conflict events. The method for rating individual conflicts as potential, slight or severe is not always reasonable for different geometric designs. Giuffrè et al. [14] also mentioned that the model used to analyze roundabouts cannot be used to assess the performance at turbo roundabouts because of their different geometric features and vehicular operation. It is essential to propose a new safety evaluation method with the consideration of geometric and operational features of turbo roundabouts.
The outline of this paper is as follows. In Section 2, the relevant literature is reviewed. In Section 3, the methodology for evaluating safety performance is introduced. In Section 4, the results of the data analysis are presented. Section 5 concludes this work.

3. Methodology

Safety performance in traffic engineering is closely related to crash records, which suggests a wide range of crash statistics over a long period is required for safety evaluation. The SSAM is an attempt to diminish such a dependency by distinguishing the conflict in trajectory files generated from microsimulation software. Measures calculated in SSAM can imply potential crashes to evaluate safety performance, which is viable for the research of turbo roundabouts in China due to the lack of actual operational data. Besides, conflict plays an important role in the safety analysis of intersections. The frequency and position of conflict can be a help in explaining potential safety hazards, thereby introducing suitable countermeasures to improve the safety situation at an intersection—especially at roundabouts, which are unlike signalized intersections, with several driving paths interweaving at the same time. The frequency of conflicts can be an important indicator of the level of service. Several studies have validated the simulated conflicts from SSAM with field studies. Gettman et al. [34] and Guo et al. [35] showed a significant correlation between simulated conflicts by SSAM and the field-measured data. SSAM can identity types of conflicts and show a display of the location of conflicts on the network map. Several conflict indicators to describe a simulated conflict are estimated in SSAM, including TTC and PET, which we have mentioned before.
Therefore, in this study, simulation data generated from SSAM under scenarios were collected as the original data set to evaluate the safety improvement of turbo designs before and after application. Then, new safety indices based on the output measures in SSAM were proposed. Vissim was selected as the microsimulation tool in this study [36,37].
Vissim can reproduce complex traffic operations at individual levels, and it has been widely used in intersection and road network modeling, providing a vivid simulation of drivers’ behavior and flow movement. The modeling of a roundabout raises a high requirement on the setting of links and connectors, routing decisions, priority rules and reduced speed zones [38]. Vissim does a good job in these aspects. Gagnon et al. [39] presented a study comparing the simulated delay with the actual field delay to evaluate the models by five simulation tools, including Vissim, based on two roundabout cases. Vissim showed its outstanding versatility in this study, and adjusting the minimum acceptable gap proved to be a very powerful tool in reproducing the delay situation for Vissim. In addition, Bared and Edara [40] modeled two roundabouts using three kinds of simulation tools (Vissim, Rodel and aaSidra), and the results showed the output of Vissim was closer to field data than that of the other two. The flexibility and the reduction of the real situation have made Vissim one of the main microsimulators used in roundabout modeling [41].

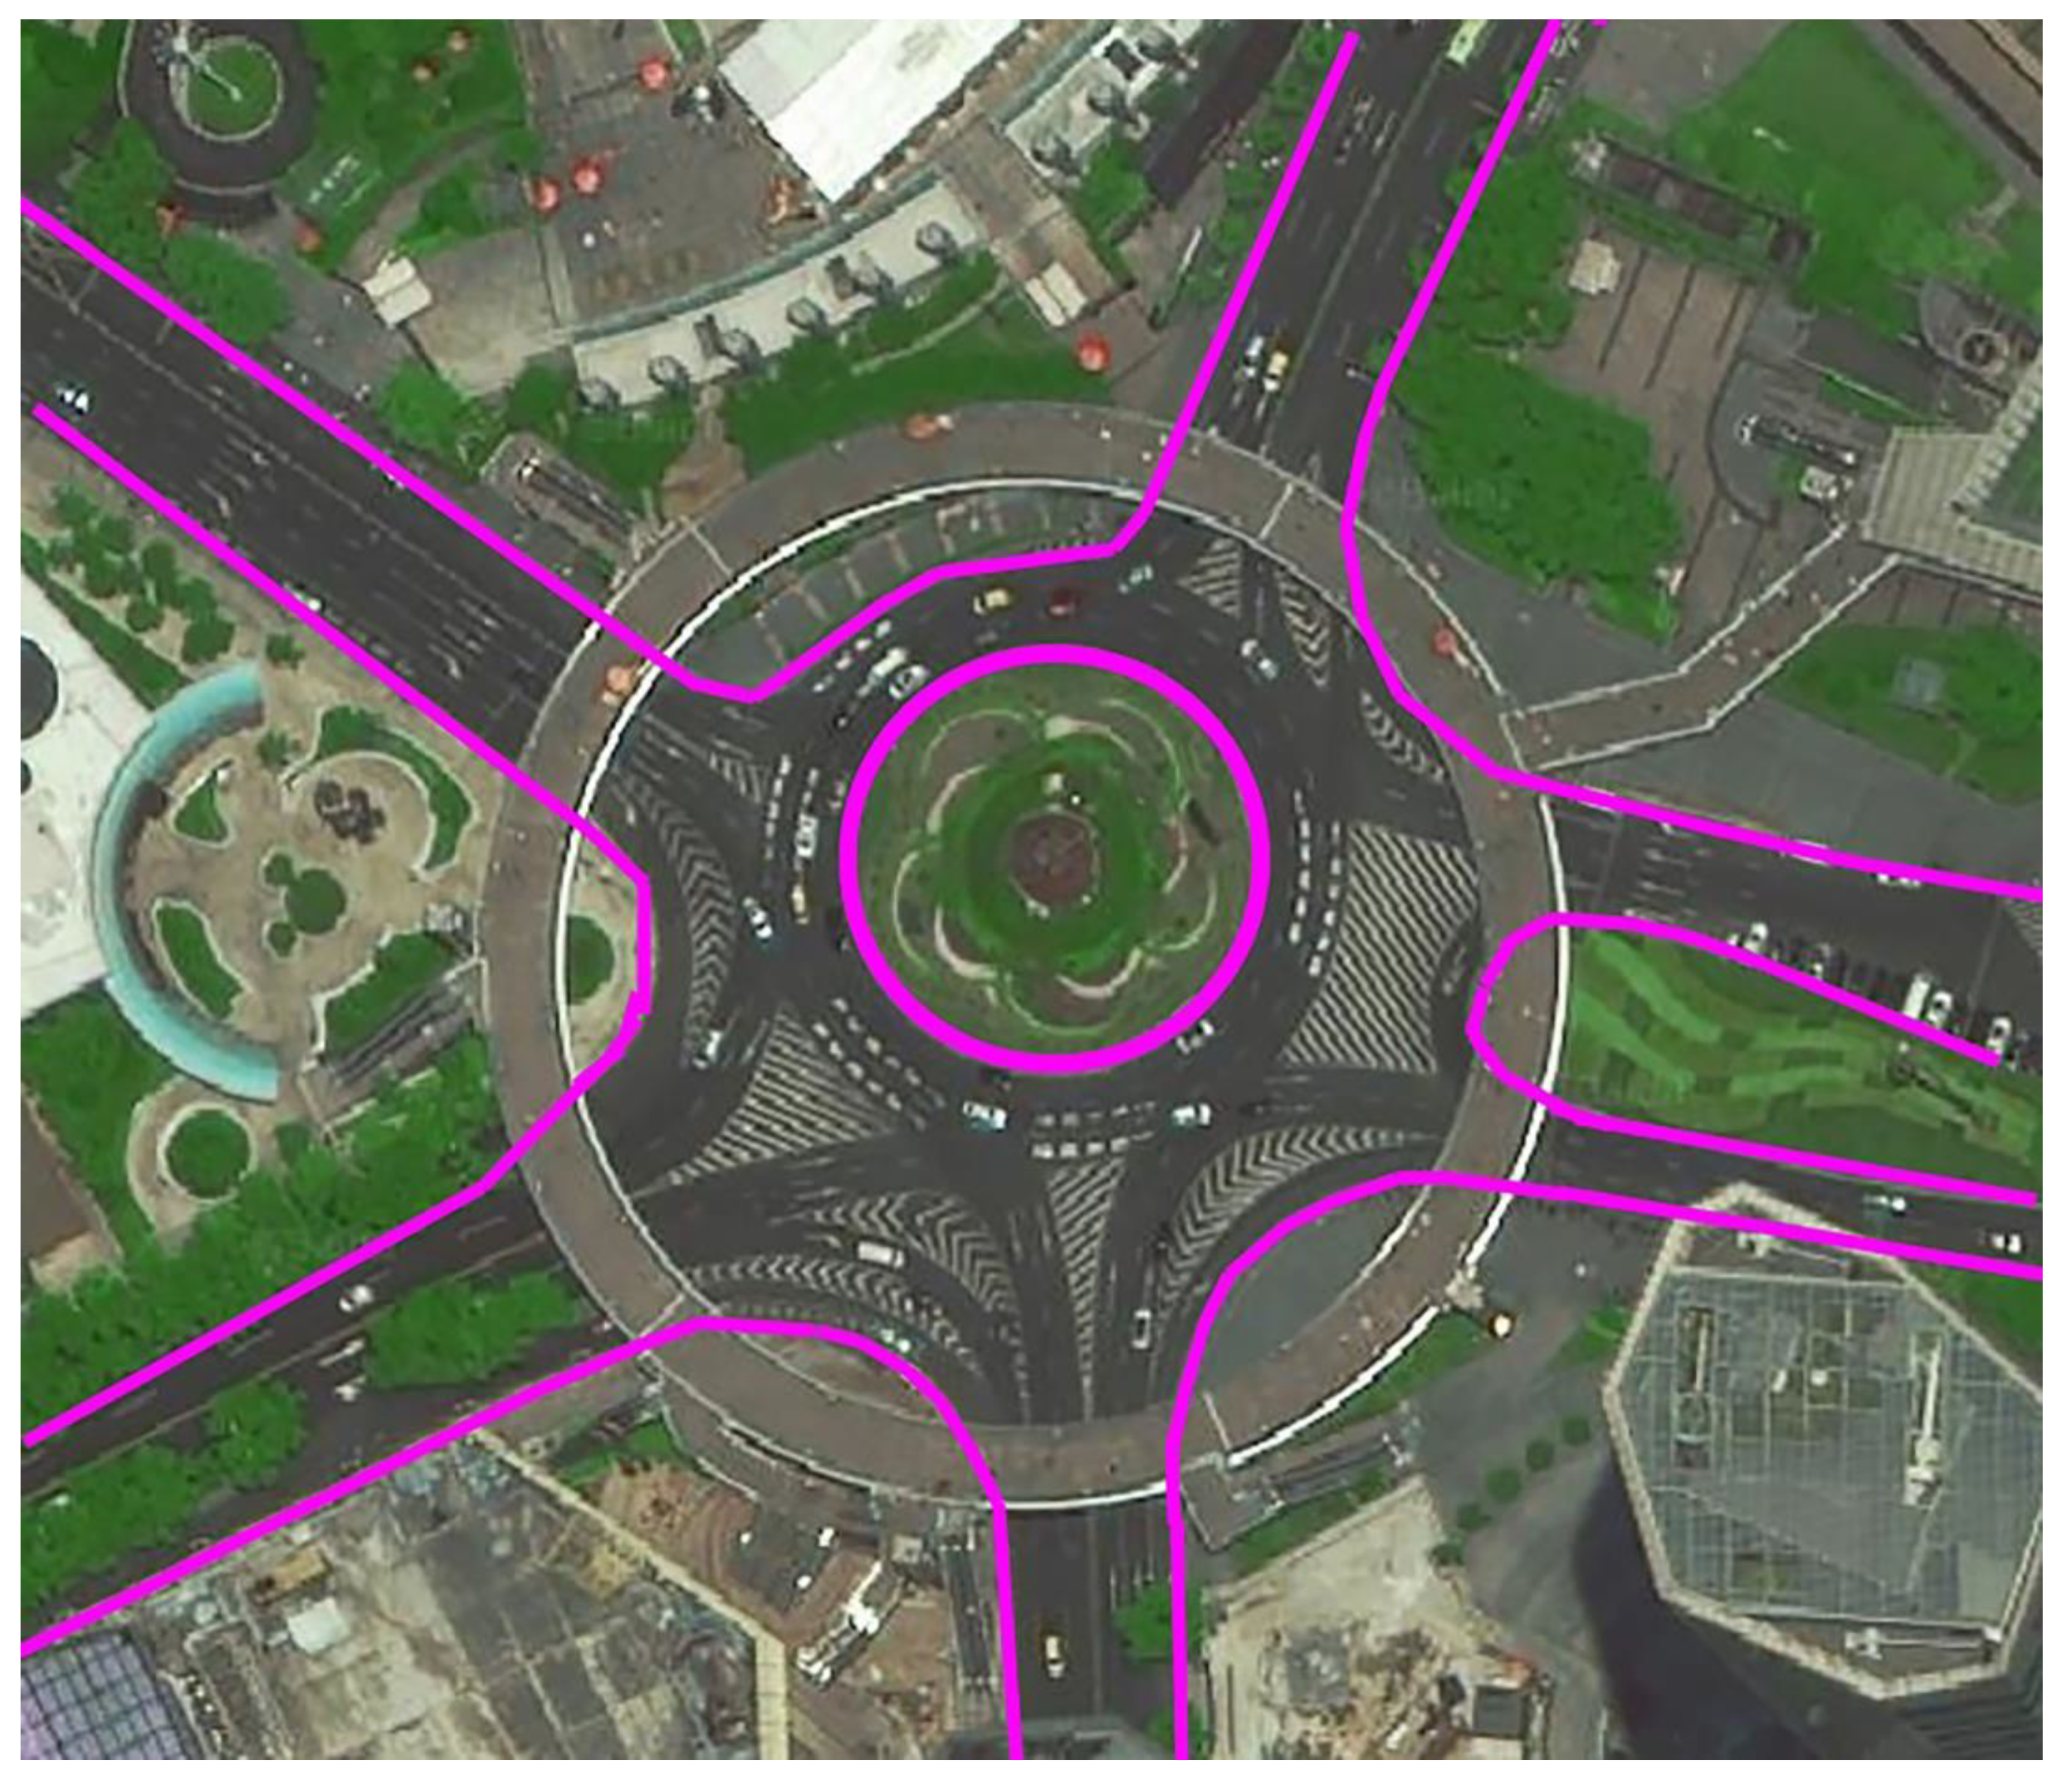
3.1. Simulation and Data Extraction

Lujiazui is a five-leg roundabout located in Shanghai with a right-turn channelization design and a central island radius of 25 m (Figure 1). It was selected as the case study to discuss safety improvements based on the turbo design. The scale shown in the satellite image was used to build the scale model in Vissim to match the actual size of the structure. In the Vissim model, vehicles traveling inside the roundabout were allowed to change lanes only when approaching the objective exit, which is in accordance with actual operations. The turbo design adapted in this case is referred to as the rotor type [23] (Figure 2a). We kept the essential features of the original when we adapted it to Lujiazui (Figure 2b). The center of the adapted turbo roundabout was the junction of the extension lines of the five main roads. Its lane design featured inner canalization of the five outlets, with four lanes per entry. Two lanes per exit were set in accordance with reality. The vehicles traveling were not allowed to change lanes inside the roundabout. Drivers needed to select the correct path before entering the roundabout and stay there until exiting.
To validate the model, 15 min videos were taken of the Lujiazui roundabout at noon for higher traffic volumes. The cameras were placed at three positions to cover view angles that could observe the flow of vehicles from the entrance to the exit (Figure 3). The vehicle volume, composition, traveling speed and average traveling time from the videos were manually extracted.
The main calibration work in this study was to reproduce the actual yield and deceleration behaviors of drivers in Vissim by setting the yielding rules and deceleration area. We calculated the average travel time from 15 min videos by recording the travel time of each vehicle running on the assigned road sections. The MAPE (Mean Absolute Percentage Error) (<10%) of the average travel time was used to verify the model under the same traffic flows with the actual traffic distribution, approaching speed, circulating speeds and traffic composition [42,43,44]. The travel time comparison is shown in Table 1. The entry numbers in Table 1 are based on Figure 3. Based on the videos, the yielding behavior before entry was observed, and deceleration occurred while traveling in the roundabout. Therefore, we set the yielding rules at each entrance and deceleration area with different speed requirements inside the roundabout and entries (Figure 4a), and the parameters are given in Table 2. These settings were applied to the adapted turbo model to ensure the use of the correct parameters for Lujiazui (Figure 4b).
Several scenarios with different input volumes and various central island radii were considered for Lujiazui and the adapted turbo model in the simulation experiments. The traffic flow composition was determined for all entries based on the data obtained from the videos (bus/heavy goods vehicle (HGV) = 0.05; car = 0.95). The vehicle flow from each entry was equally distributed to each exit. The traffic volume entering from each arm was set to be equal because the rotor design is recommended for equal traffic volumes from all entries [23]. From the actual scenarios and construction specifications of the roundabout, the volume input was set from 500 to 1100 vehicles per hour per entry (vphpe), with intervals of 100, and the radius was set from 15 to 40 m, with intervals of 5 m. The minimum average volume we observed was 500 vphpe according to our field investigation on the Lujiazui roundabout. The maximum volume we tested in Vissim without the occurrence of a traffic jam inside the roundabout at an early time was 1100. The choosing of the radius was according to the construction specifications of roundabouts in China. The simulation of a total of 42 scenarios for two models was conducted in this study. The simulation time was 10 min. The experiment for each scenario was run ten times, and the average results were taken for the subsequent analysis.

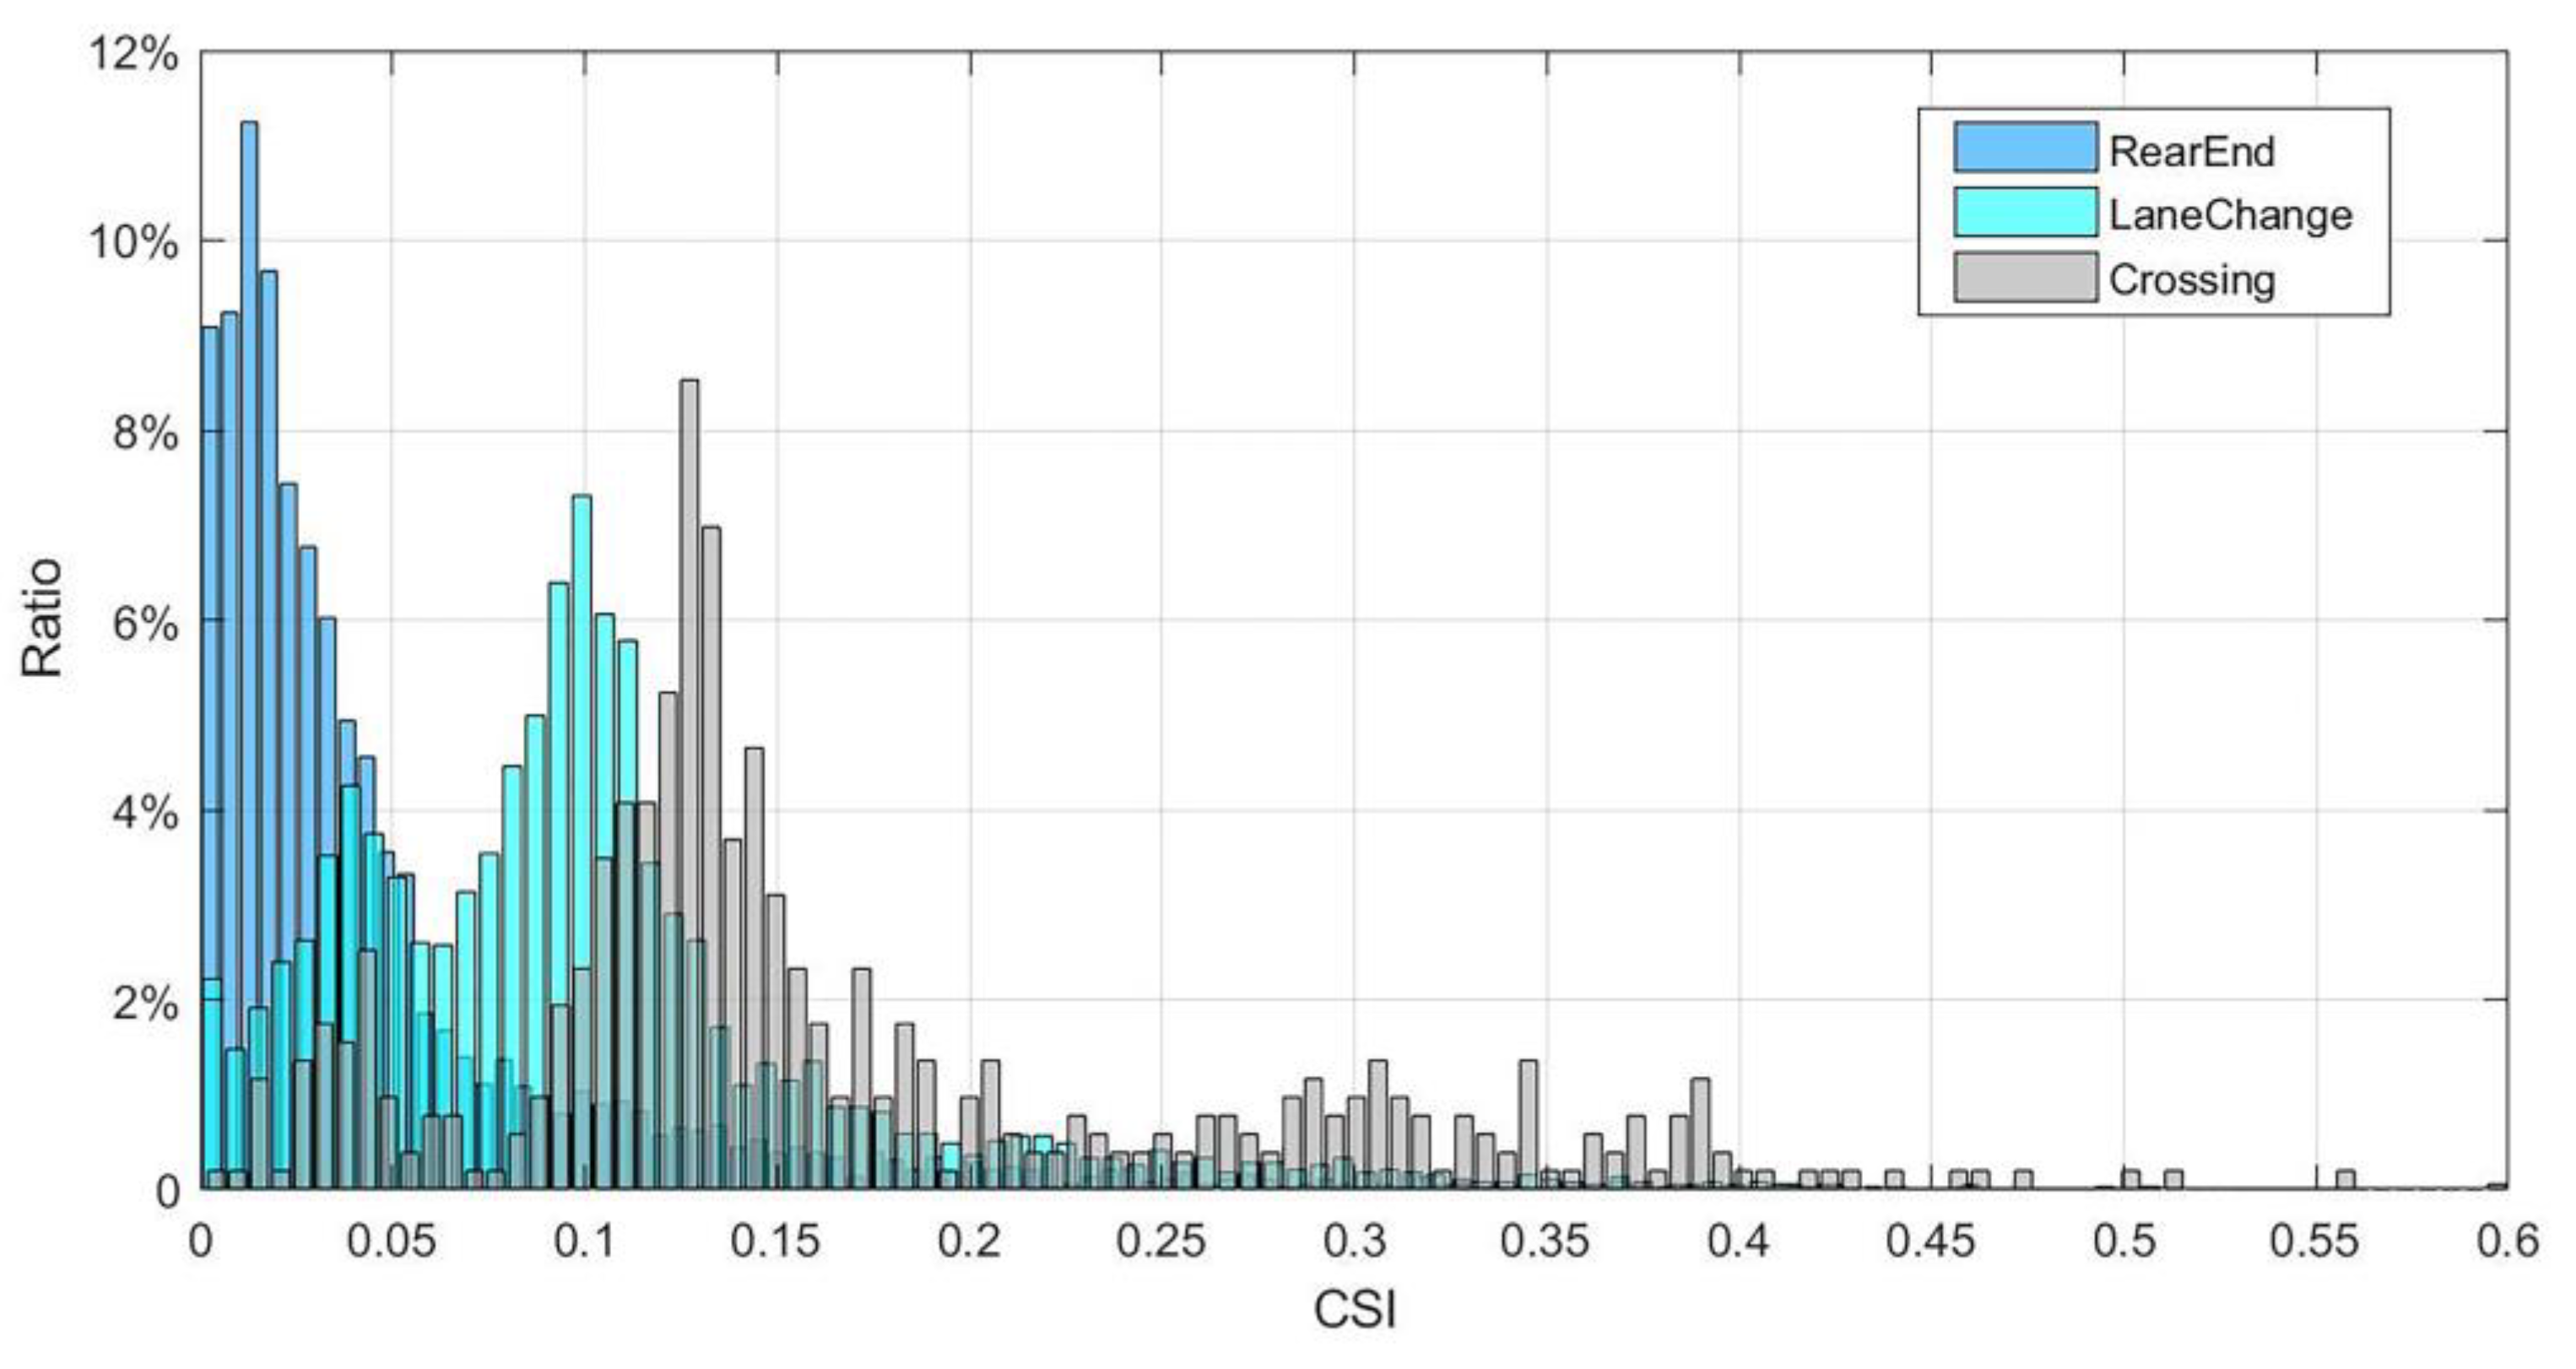
3.2. Measure of Conflict Severity Index (CSI)

SSAM was used to identify the traffic conflicts from the vehicle trajectory files generated in Vissim [45]. With the conflict information extracted from SSAM, the frequency of conflicts cannot reflect the seriousness of traffic scenarios because each conflict could have different degrees of severity. The risk of potential crashes increases with conflict severity. Vasconcelos et al. [46] discovered that the turbo roundabout has fewer but more severe conflicts compared with the standard roundabout. This implies the necessity of considering conflict severity when analyzing the turbo roundabout. This section proposes a new index to explain the conflict severity based on measures defined in SSAM.
For each conflict event, SSAM calculates the surrogate safety measures, including the TTC and MaxDeltaV, where TTC is the minimum time-to-collision and MaxDeltaV is the vehicle velocity change that precedes a crash. Gettman and Head [47] mentioned that a lower TTC indicates a higher probability of collision but cannot be directly linked to the severity of collisions. Souleyrette and Hochstein [33] proposed a severity evaluation method using SSAM, where they used the TTC and MaxDeltaV to modify the severity score and illustrated the relationship between the MaxDeltaV and TTC against the modified severity score. Here, we integrate the TTC and MaxDeltaV to indicate the likely severity of potential collisions and use the TTC to indicate the likelihood of the collision. Equation (1) calculates the CSI of a conflict based on its TTC and MaxDeltaV.
CSI = e TTC ( 1 TTC + a MaxDeltaV )
The first term indicates the probability of a potential crash, which varies from 0 to 1. When there are 0 s to a collision, the collision occurs with a probability of 100%, while a higher TTC implies that the driver has time to avoid the crash and lowers its likelihood. The second term denotes the consequence if a potential crash does occur. A zero TTC not only means the driver is going to have a collision, but it also indicates that the driver does not have time to perform any avoidance measures, and the full harm from the imminent crash occurs with the invariant acceleration and direction. A larger MaxDeltaV indicates a higher severity of the crash, while the influence of the TTC is the opposite. “a” is a constant used to balance the contributions of the TTC and MaxDeltaV to the severity. A conflict with a high CSI means a higher safety risk.
To get the proper value of “a”, we mainly referred to previous research [33] in which the authors assigned severity scores based on the MaxDeltaV and TTC according to a discussion on a comprehensive literature review. According to the overall severity score contour line equations combining these two measures shown in [33], the slope range was 17~20. We tested different constants in this range to see at which value the difference in CSI distribution performance among conflict types could be amplified. Finally, we found 20 was the fittest. Thus, in this study, we set “a” to 20.
The SSAM divides conflicts into three categories based on the angle of the vehicle-to-vehicle interaction: rear-end conflict (≤30°), lane-change conflict (30–80°) and crossing conflict (≥80°). We took conflict data under scenarios with a 25 m radius as an example. The distribution of the CSI for the three conflict types based on this data set is illustrated in Figure 5. Most of the rear-end conflicts showed a small CSI, while the distributions of the lane-change and crossing conflicts were concentrated at larger CSIs. This is because scenarios where vehicle–vehicle interactions are at large angles are always severe for high collision speeds, such as at cross junctions. Vasconcelos et al. [46] indicated a correlation between the conflict angle and severity. We saw that a crossing conflict was more likely to generate high risks than lane-change and rear-end conflicts.

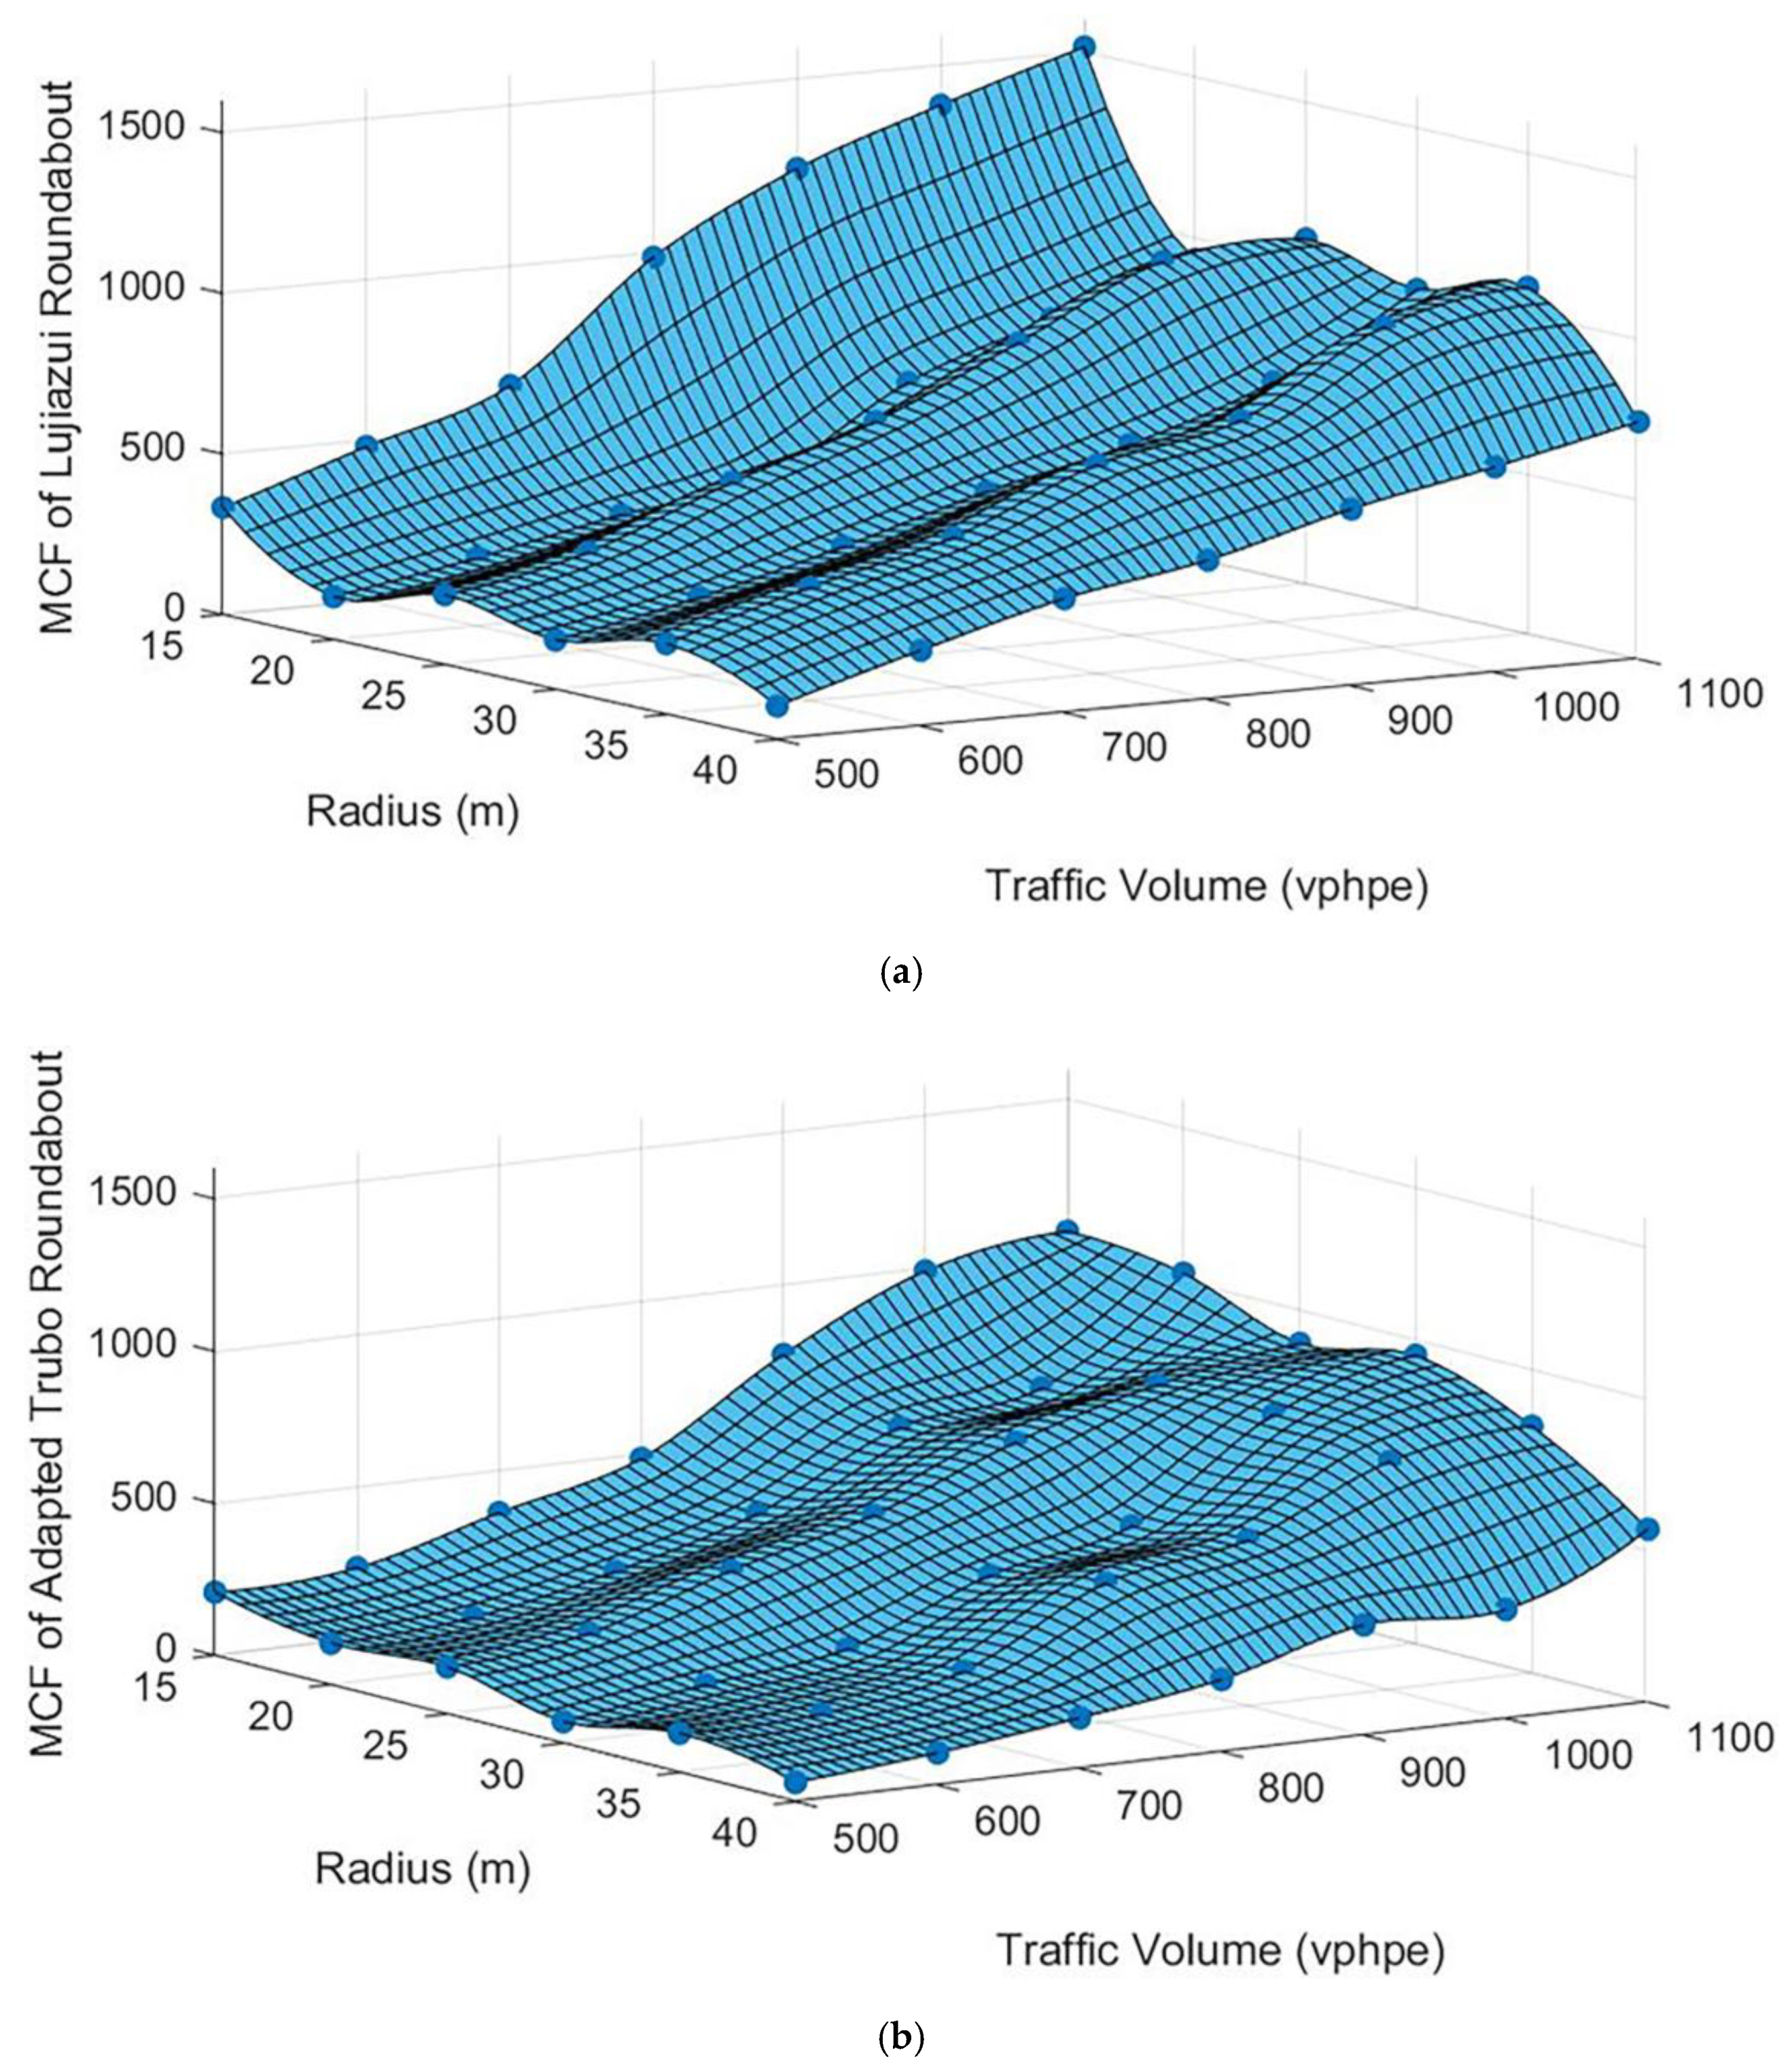
3.3. Calculating Modified Conflict Frequency (MCF)

Section 3.2 proposed the CSI to evaluate the safety risk of a single conflict and find its different distributions for three conflict types. The conflict frequency generated in a given period is a quantitative indicator to evaluate the current traffic safety but lacks a consideration of the severity. Therefore, Equation (2) combines the severity and frequency by weighting the CSI’ value from different conflict types and outputs the MCF. A higher MCF indicates a worse safety performance.
The CSI’ can be regarded as the attribute of the conflict type. When calculating the MCF, 15% of conflicts with a high CSI value are considered as low-probability events that are not representative of the general case, as Figure 5 shows. Thus, we adopt the maximum CSI value of 85% (85th lower percentile value of the CSI distribution) as the CSI’ to account for all conflicts of this type. Here, we get the CSI’ of each conflict type and standardize these values, with the lowest equal to 1. Table 3 shows the weight-calculated results based on the conflict data set generated in the experiments (including repeats) with a 25 m roundabout radius.
MCF = CSI crossing * N crossing + CSI   rear end * N   rear end + CSI lane change * N lane change ,
where N i is the frequency of the conflict type i over 10 min and CSI i is the weight of conflict type i .

4. Results

The conflict frequencies of the three conflict types (crossing, rear-end and lane-change) are summarized from the SSAM output after 42 groups of simulation experiments. For a clear presentation, we took R = 25 m as an example, and the results are given in Table 4. Based on the methodology introduced in Section 3.2 and Section 3.3, rare statistics were transferred into the MCF through calculations with the CSI’ shown in Table 3. Since the calibration of the models is based on the Lujiazui roundabout, with a 25 m radius, we reasonably believe that the CSI’ calculated based on scenarios with a 25 m radius can show the attributes of each conflict type closer to the real situation.
The comparisons of the frequency for each conflict type indicate the adapted turbo roundabout had fewer total conflicts but more crossing conflicts than the Lujiazui roundabout in most scenarios, including the radius conditions not shown in Table 4. The decreased lane-change conflicts and the increased crossing conflicts agree with common sense, as turbo roundabouts have channelization inside and require drivers to cross to the correct lane, which could be the innermost at the entry area. The turbo design resulted in fewer rear-end conflicts based on this study, most likely because four-lane entries reduce the vehicle density compared with two-lane entries.
Figure 6 shows the change curves of the MCF values based on different volumes and radii. The figure indicates that larger volumes produced larger MCF values. Furthermore, the MCF decreased in general with the radius. It is noted that the safety performance of the Lujiazui roundabout fluctuated with the radius; two such fluctuations were observed from 20 to 30 m and 30 to 40 m. It is shown that the relationship between the radius and safety level was not singularly linear. In the Lujiazui roundabout, the lane-change point is casually chosen by the driver, which means that the number of rear-end conflicts could be highly related to the length provided for the driver to change lanes. A larger radius provides drivers a sufficient distance to change their path but also places more vehicles inside, which results in more potential conflicts when drivers change lanes. Compared with the Lujiazui roundabout, the MCF value of the adapted turbo roundabout did not significantly vary with the radius changes. This indicates the safety performance of the turbo design was not sensitive to the radius, while that of Lujiazui was.
We used the reduced MCF to represent safety improvements, as seen in Figure 7, before and after the application of the turbo design on the Lujiazui roundabout under different radii and volumes. It is evident that adopting the turbo roundabout could improve the safety performance in most cases. For radii of 30–40 m with traffic volumes under 800 vphpe, the safety performance was enhanced by 40–60%. However, in some cases, the turbo design was not as good of a choice. Under higher volumes (>800 vphpe) with specific radii of 20–30 m, the safety improvement percentage varied within approximately 10% and even went negative. It follows that when traffic volumes in a roundabout are high, the effect of channelizing on safety is weakened. This is likely from the significantly enhanced proportion of rear-end conflicts due to the high traffic density in the road sections of entry, which limits the improvement results from decreased crossing and lane-change conflicts.
To determine whether the turbo design can be a better fit for realistic scenarios, planners need to account for both the influence of the transportation efficiency and safety performance to evaluate the integral level of service. The average delay exported from Vissim was adopted as the traffic efficiency index, which was restricted to within the roundabout. A longer delay indicates passing vehicles driving in the roundabout have a lower efficiency.
According to the observations on the simulation, we found the occurrence of delays in the adapted turbo roundabout mostly concentrated on the junction between the roundabout and road sections of entry, while that was rare to see inside the roundabouts. For the vehicles that may need to get into the innermost lane, the appearance of an acceptable gap requires the driver waiting for a longer time, which causes a delay for itself and subsequent vehicles. This is also evidenced by the fact that the queues in the leftmost lanes were always the longest among the four entry lanes. Besides, frequent underutilization of traffic lanes on entry was found in the adapted turbo roundabouts as the volume increased. Since channelization of the internal circular routes requires that the driver be able to drive in the correct approach lane before entering the roundabout, vehicles need to do the lane change across three lanes at most. That increases the probability of short traffic blocks. The conditions became even worse because of the existence of heavy goods vehicles (HGVs) and buses, as they need more time and space to do the lane change.
We used a reduction in the average delay to represent the efficiency improvement compared with the original design, as shown in Figure 8. It was seen that the adapted turbo roundabout performed better with radii of 15, 25 and 40 m. In comparison, the Lujiazui roundabout was better with radii of 20, 30 and 35 m in most volume cases. This indicates the influence of radius on the traffic efficiency and can be explained by the nonlinear relationship between the radius and average delay. A larger radius provides an increased space for more vehicles operating at free speed. However, this keeps the vehicles inside for longer travel distances, with more possibilities to meet conflicts, which causes delays. The improvement in efficiency was under 35%, but the negative influence brought by the turbo design could reach 60%. It was most severe when there were high traffic volumes (>1000 vphpe) with radii of 30 and 35 m, which should be avoided.

5. Conclusions

Based on the above analysis on features of the turbo design (rotor type) in terms of safety and efficiency, the guidelines for implementing a turbo design for a five-leg roundabout construction are given as follows:
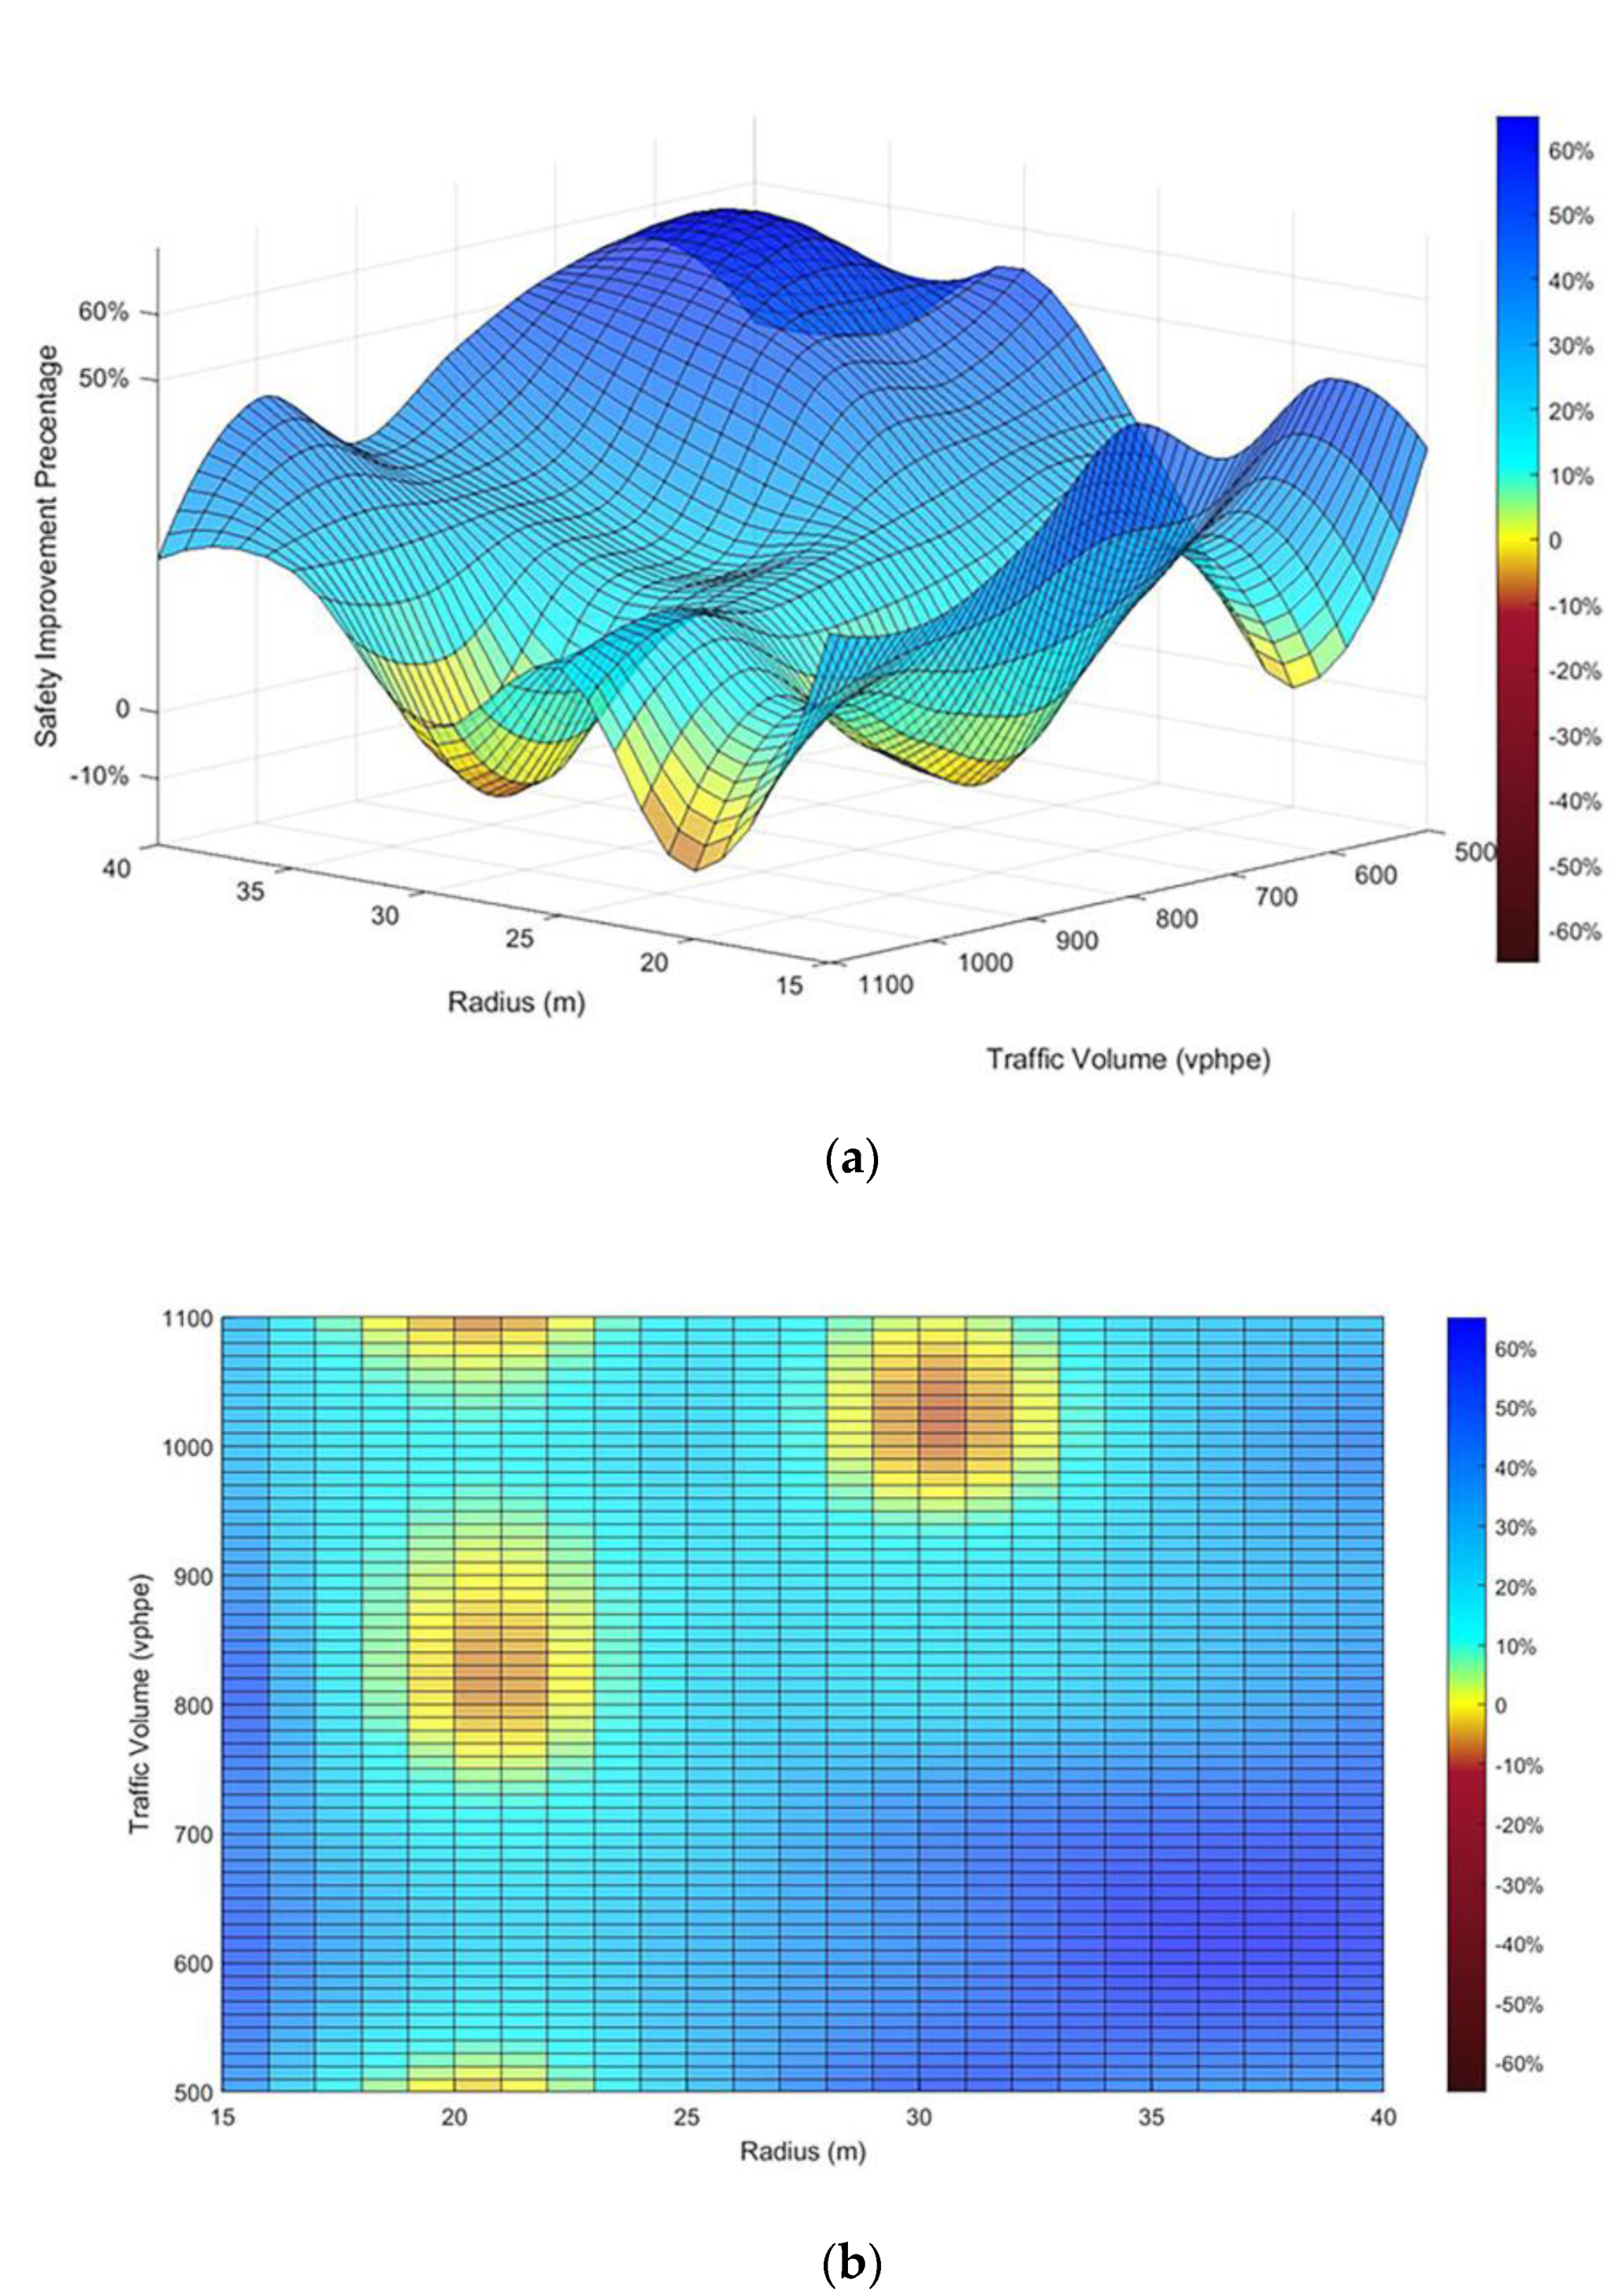
  • A turbo design can improve the safety performance in most volume conditions. However, when the volume is 800–1100 vphpe with a 20–30 m radius, adapting the turbo design does not make an appreciable difference and can even cause performance degradation. For more beneficial safety improvements, the scenario with radii of 30–40 m and traffic volumes under 800 vphpe is recommended for applying the turbo design. It is important to leave enough space for each vehicle to avoid rear-end conflicts so that the safety benefit through channelization can be maximized.
  • There is a limitation of the turbo design when considering transportation efficiency. High volumes with large radii could result in significant delays compared with designs without channelization. The delay mostly results from waiting for an acceptable gap at the entry. Therefore, we suggest designers avoid applying the turbo design on large roundabouts (>30 m) under high traffic volumes (>1000 vphpe).
  • Disorderly lane changes at road sections of entry should be avoided in practice, as they may generate the underutilization of lane spaces and rear-end behavior due to traffic blocks. It is necessary to set rules to reduce the act of changing lanes across multiple channels, especially for HGVs and buses.
In summary, this article provided a safety and efficiency improvement analysis for a five-leg roundabout before and after a turbo design as applied to different geometric and traffic volume scales. The proposed evaluation indices, the CSI and MCF, calculated and evaluated the safety performance using Vissim and SSAM. These concluded suggestions on turbo roundabouts can guide the rational application of roundabout design in China so as to improve the development of sustainable transportation.
This study still has some limitations. We adopted the “rotor” as the adapted turbo design, which is only one of many turbo roundabout architectures. Thus, the conclusions cannot be applied to other turbo types. Additionally, we considered the traffic distribution to be equal for the destinations in this study, which limits the application scenarios. The model simulation in Vissim lacks calibration with actual data on turbo roundabouts and a significance analysis of repeated simulation results. As for the methodology we applied in this study, the measurement of the CSI involved quantitative assessment of the severity of collisions predicted by conflicts through indicators (TTC and MaxDeltaV), in which the equation and value of the constant were largely dependent on our subjective understanding of risks without empirical evidence.
In the future, with sufficient real data obtained from field studies, the modeling and research on turbo roundabouts considering additional factors (e.g., the uncertainty of driver behavior, construction costs, flow distribution and pollution) are expected.

Author Contributions

Conceptualization, L.L.; formal analysis, Y.S. and W.W.; methodology, Q.L., J.D., Y.S. and W.W.; software, Q.L. and J.D.; supervision, Z.Z.; visualization, Q.L.; writing—original draft, Q.L., J.D., Y.S. and W.W.; writing—review and editing, Q.L. All authors have read and agreed to the published version of the manuscript.

Funding

The National Science Foundation of China partially supported this work (grant no. E080701/51508325).

Acknowledgments

The authors are grateful to the Transportation Research Center of Shanghai Jiao Tong University for software and hardware support.

Conflicts of Interest

The authors declare no conflict of interest.

References

  1. Fernandes, P.; Salamati, K.; Rouphail, N.; Coelho, M. The effect of a roundabout corridor’s design on selecting the optimal crosswalk location: A multi-objective impact analysis. Int. J. Sustain. Transp. 2017, 11, 206–220. [Google Scholar] [CrossRef]
  2. Tollazzi, T.; Rencelj, M. Comparative analyse of the two new alternative types of roundabouts—Turbo and flower roundabout. Balt. J. Road Bridg. Eng. 2014, 9, 164–170. [Google Scholar] [CrossRef]
  3. Montella, A. Identifying crash contributory factors at urban roundabouts and using association rules to explore their relationships to different crash types. Accid. Anal. Prev. 2011, 43, 1451–1463. [Google Scholar] [CrossRef]
  4. Guerrieri, M.; Corriere, F.; Rizzo, G.; Casto, B.L.; Scaccianoce, G. Improving the sustainability of transportation: Environmental and functional benefits of right turn by-pass lanes at roundabouts. Sustainability 2015, 7, 5838–5856. [Google Scholar] [CrossRef] [Green Version]
  5. Mauro, R.; Branco, F. Comparative analysis of compact multilane roundabouts and turbo-roundabouts. J. Transp. Eng. 2010, 136, 316–322. [Google Scholar] [CrossRef]
  6. Fortuijn, L.G. Turbo roundabouts: Design principles and safety performance. Transp. Res. Rec. 2009, 2096, 16–24. [Google Scholar] [CrossRef]
  7. Gallelli, V.; Vaiana, R.; Iuele, T. Comparison between simulated and experimental crossing speed profiles on roundabout with different geometric features. Procedia Soc. Behav. Sci. 2014, 111, 117–126. [Google Scholar] [CrossRef] [Green Version]
  8. Silva, A.B.; Seco, A. Trajectory deflection influence on the performance of roundabouts. In Proceedings of the European Transport Conference (ETC), Strasbourg, France, 3–5 October 2005. [Google Scholar]
  9. Silva, A.B.; Seco, A.; Silva, J. Characterization of trajectories adopted at roundabout crossings. In Proceedings of the European Transport Conference (ETC), Strasbourg, France, 18–20 September 2006. [Google Scholar]
  10. Praticò, F.; Vaiana, R.; Gallelli, V. Micro-simulation effectiveness in predicting operating speed profiles in a roundabout. Adv. Transp. Stud. 2015, 37, 5–14. [Google Scholar]
  11. Almoarawi, M.; Dabbour, E. Predicting operating speeds at urban multilane roundabouts in Abu Dhabi, United Arab Emirates. J. Adv. Transp. 2018, 2018, 1–10. [Google Scholar] [CrossRef]
  12. Izadi, A.; Mirzaiyan, D.; Rashidi, A.; Hosseini, M. Comparing traffic performances of turboroundabouts and conventional roundabout (case study). Turk. Online J. Des. Art. Commun. 2016, 6, 598–604. [Google Scholar] [CrossRef]
  13. Corriere, F.; Guerrieri, M. Performance analysis of basic turbo-roundabouts in urban context. Procedia Soc. Behav. Sci. 2012, 53, 622–632. [Google Scholar] [CrossRef] [Green Version]
  14. Guerrieri, M.; Ticali, D.; Corriere, F. Turbo roundabouts: Geometric design parameters and performance analysis. GSTF J. Comput. 2012, 2, 227–232. [Google Scholar]
  15. Giuffrè, O.; Guerrieri, M.; Granà, A. Evaluating capacity and efficiency of turbo-roundabouts. In Proceedings of the TRB 2009 Annual Meeting, Washington, DC, USA, 11–15 January 2009. [Google Scholar]
  16. Fortuijn, L.G. Turbo roundabouts: Estimation of capacity. Transp. Res. Rec. 2009, 2130, 83–92. [Google Scholar] [CrossRef]
  17. Brilon, W. Studies on roundabouts in Germany: Lessons learned. In Proceedings of the 3rd International TRB roundabout Conference, Carmel, IN, USA, 18–20 May 2011. [Google Scholar]
  18. Silva, A.B.; Santos, S.; Gaspar, M. Turbo-roundabout use and design. In Proceedings of the CITTA 6th Annual Conference on Planning Research, Responsive Transports for Smart Mobility, Coimbra, Portugal, 17 May 2013. [Google Scholar]
  19. Bulla, L.A.; Castro, W. Analysis and comparison between two-lane roundabouts and turbo roundabouts: Based on a road safety audit methodology and microsimulation—A case study in urban area. In Proceedings of the 3rd International Conference on Road Safety and Simulation, Indianapolis, IN, USA, 14–16 September 2011. [Google Scholar]
  20. CROW (Dutch Information and Technology Platform). Turborotondes (Turbo Roundabouts); CROW: Ede, The Netherlands, 2008. [Google Scholar]
  21. Ministry of Transport Republic of Slovenia. Krožna križišča (Roundabouts). Available online: https://www.gov.si/assets/organi-v-sestavi/DRSI/Dokumenti-DRSI/Tehnicne-specifikacije/TSC_03_341_2011_Krozna_krizisca.pdf (accessed on 10 September 2020).
  22. Serbian Authority for Roads, B. Priručnik za Projektovanje Puteva U Republici Srbiji, Dio 5.3 Kružne Raskrisnice (Manual for Road Design in Republic of Serbia, Part 5.3 Roundabouts); Putevi Srbije: Belgrade, Serbia, 2012. [Google Scholar]
  23. Džambas, T.; Ahac, S.; Dragčević, V. Geometric design of turbo roundabouts. Tech. Gaz. 2017, 24, 309–318. [Google Scholar] [CrossRef] [Green Version]
  24. Dirk de Baan. Verkeer, Verkeersveiligheid, Vorm. Available online: www.dirkdebaan.nl (accessed on 2 September 2020).
  25. Mahdalova, I.; Krivda, V.; Skvain, V. Influence of roundabout inscribed circle diameter to the traffic safety. In Proceedings of the 2nd International Conference on Civil, Architectural and Hydraulic Engineering (ICCAHE 2013), Zhuhai, China, 27–28 July 2013; pp. 1122–1125. [Google Scholar]
  26. Kim, S.; Choi, J. Safety analysis of roundabout designs based on geometric and speed characteristics. KSCE J. Civ. Eng. 2013, 17, 1446–1454. [Google Scholar] [CrossRef]
  27. Anjana, S.; Anjaneyulu, M.V.L.R. Development of safety performance measures for urban roundabouts in India. J. Transp. Eng. 2015, 141, 1. [Google Scholar] [CrossRef]
  28. Elhassy, Z.; Abou-Senna, H.; Shaaban, K.; Radwan, E. The implications of converting a high-volume multilane roundabout into a turbo roundabout. J. Adv. Transp. 2020, 2020, 1–12. [Google Scholar] [CrossRef]
  29. Gallelli, V.; Vaiana, R. Safety improvements by converting a standard roundabout with unbalanced flow distribution into an egg turbo roundabout: Simulation approach to a case study. Sustainability 2019, 11, 466. [Google Scholar] [CrossRef] [Green Version]
  30. Tak, S.; Kim, S.; Yeo, H. Development of a deceleration-based surrogate safety measure for rear-end collision risk. IEEE Trans. Intell. Transp. Syst. 2015, 16, 2435–2445. [Google Scholar] [CrossRef]
  31. Vasconcelos, L.; Silva, A.B.; Seco, A. Safety analysis of turbo-roundabouts using the SSAM technique. In Proceedings of the CITTA 6th Annual Conference on Planning Research, Coimbra, Portugal, 17 May 2013. [Google Scholar]
  32. Al-Ghandour, M.N.; Schroeder, B.J.; Williams, B.M.; Rasdorf, W.J. Conflict models for single-lane roundabout slip lanes from microsimulation: Development and validation. Transp. Res. Rec. 2011, 2236, 92–101. [Google Scholar] [CrossRef]
  33. Souleyrette, R.; Hochstein, J. Development of a Conflict Analysis Methodology Using SSAM (No. InTrans Project 10-376); The Institute for Transportation, Iowa State University: Ames, IA, USA, 2012. [Google Scholar]
  34. Gettman, D.; Pu, L.; Sayed, T.; Shelby, S.; Siemens, I. Surrogate Safety Assessment Model and Validation; United States Federal Highway Administration, Office of Safety Research and Development: McLean, VA, USA, 2008; FHWA-HRT-08-051. [Google Scholar]
  35. Guo, Y.; Essa, M.; Sayed, T.; Haque, M.M.; Washington, S. A comparison between simulated and field-measured conflicts for safety assessment of signalized intersections in Australia. Transp. Res. Pt. C-Emerg. Technol. 2019, 101, 96–110. [Google Scholar] [CrossRef]
  36. Vaiana, R.; Gallelli, V.; Iuele, T. Methodological approach for evaluation of roundabout performances through microsimulation. Appl. Mech. Mater. 2012, 253–255, 1956–1966. [Google Scholar] [CrossRef]
  37. Praticò, F.; Vaiana, R.; Gallelli, V. Transport and traffic management by micro simulation models: Operational use and performance of roundabouts. In Proceedings of the 18th International Conference on Urban Transport and the Environment (UT’12), A Coruna, Spain, 14–16 May 2012; pp. 383–394. [Google Scholar]
  38. Trueblood, M.; Dale, J. Simulating roundabouts with VISSIM. In Proceedings of the 2nd Urban Street Symposium: Uptown, Downtown, or Small Town: Designing Urban Streets That Work, Anaheim, CA, USA, 28–30 July 2003. [Google Scholar]
  39. Gagnon, C.; Sadek, A.W.; Touchette, A.; Smith, M. Calibration potential of common analytical and microsimulation roundabout models: New England case study. Transp. Res. Rec. 2008, 2071, 77–86. [Google Scholar] [CrossRef] [Green Version]
  40. Bared, J.; Edara, P.K. Simulated capacity of roundabouts and impact of roundabout within a progressed signalized road. In Proceedings of the TRB National Roundabout Conference, Vail, CO, USA, 22–25 May 2005. [Google Scholar]
  41. Elias, A. Roundabout Modeling in CORSIM. Master‘s Thesis, University of Florida, Gainesville, FL, USA, 2009. [Google Scholar]
  42. Gallelli, V.; Iuele, T.; Vaiana, R.; Vitale, A. Investigating the transferability of calibrated microsimulation parameters for operational performance analysis in roundabouts. J. Adv. Transp. 2017, 2017, 1–10. [Google Scholar]
  43. Vaiana, R.; Gallelli, V.; Iuele, T. Sensitivity analysis in traffic microscopic simulation model for roundabouts. Balt. J. Road Bridg. Eng. 2013, 8, 174–183. [Google Scholar] [CrossRef]
  44. Guido, G.; Vitale, A.; Saccomanno, F.; Gallelli, V. Sensitivity of simulated vehicle tracking profiles for input into safety performance analysis. Adv. Transp. Stud. 2016, 2, 65–74. [Google Scholar]
  45. Huang, F.; Liu, P.; Yu, H.; Wang, W. Identifying if VISSIM simulation model and SSAM provide reasonable estimates for field measured traffic conflicts at signalized intersections. Accid. Anal. Prev. 2013, 50, 1014–1024. [Google Scholar] [CrossRef]
  46. Vasconcelos, L.; Silva, A.B.; Seco, Á.M.; Fernandes, P.; Coelho, M.C. Turboroundabouts: Multicriterion assessment of intersection capacity, safety, and emissions. Transp. Res. Rec. 2014, 2402, 28–37. [Google Scholar] [CrossRef] [Green Version]
  47. Gettman, D.; Head, L. Surrogate safety measures from traffic simulation models. Transp. Res. Rec. 2003, 1840, 104–115. [Google Scholar] [CrossRef] [Green Version]
Figure 1. Satellite image of the Lujiazui roundabout.
Sustainability 12 07479 g001
Figure 2. The schematic diagrams of (a) the rotor design in [23] for a four-leg roundabout and the (b) adapted rotor design we developed for a five-leg roundabout in this study.
Sustainability 12 07479 g002
Figure 3. Videos of the Lujiazui roundabout shot from (a) the east, (b) the west and (c) the south.
Sustainability 12 07479 g003
Figure 4. The Vissim model settings for (a) Lujiazui and the (b) adapted turbo model. The yellow region is the deceleration area, the red lines across the lanes represent the stop lines for vehicle yielding, the green lines are the guidelines for prior vehicles and the blue lines indicate the exiting direction of each traffic flow.
Sustainability 12 07479 g004aSustainability 12 07479 g004b
Figure 5. Distribution of conflict severity index (CSI) values over the three conflict types for a 25 m radius roundabout.
Sustainability 12 07479 g005
Figure 6. The modified conflict frequency (MCF) change curve for the (a) Lujiazui roundabout and the (b) adapted turbo roundabout. The blue dots represent the MCF values obtained through the simulation experiments.
Sustainability 12 07479 g006
Figure 7. Safety improvement percentage after adapting the turbo design under different volumes and radii as (a) a surface plot and (b) its plane projection.
Sustainability 12 07479 g007
Figure 8. Efficiency improvement percentage after adapting the turbo design under different volumes and radii as a (a) surface plot and (b) its plane projection.
Sustainability 12 07479 g008
Table 1. Travel time comparison between Vissim and field runs.
FromToDistance (m)Travel Time (sec)
VissimField Runs% Diff.
Entry 1Entry 236.369.049.33−3.10%
Entry 2Entry 336.158.878.56+3.60%
Entry 3Entry 451.336.556.25+4.80%
Table 2. Parameters of the yielding principle and deceleration area.
Yielding Principle
Minimum time gap3.0 L
Minimum space gap5.0 m
Maximum vehicle velocity 30.0 km/h
Deceleration Area (α—Deceleration Rate)
Car (inside roundabout)12 (α = 2) km/h
HGV/bus (inside roundabout)10 (α = 2) km/h
Car (before entering)15 (α = 2) km/h
HGV/bus (before entering)12 (α = 2) km/h
Table 3. Weight calculation based on the conflict data set generated in the experiments with a 25 m roundabout radius.
CSI (85th Lower Percentile Value)CSI’ (Standardized)
Rear-end conflict0.091
Lane-change conflict0.14951.66
Crossing conflict0.29353.26
Table 4. R = 25 m conflict frequency under different traffic volumes.
TypeAdapted Turbo RoundaboutLujiazui Roundabout
Volume
(vphpe)
CrossingRear-EndLane-ChangeCrossingRear-EndLane-Change
50020352123487
6002313741852119
700452411522135167
800416517525178224
9004512624220302282
10005818426332330368
11004725129323396364

