Risk Assessment and Monitoring of Green Logistics for Fresh Produce Based on a Support Vector Machine

Abstract
:1. Introduction
2. Literature Review
2.1. Green Logistics of Fresh Produce
2.2. Keeping Produce Fresh
2.3. Support Vector Machine
2.4. Research Focus and Contribution
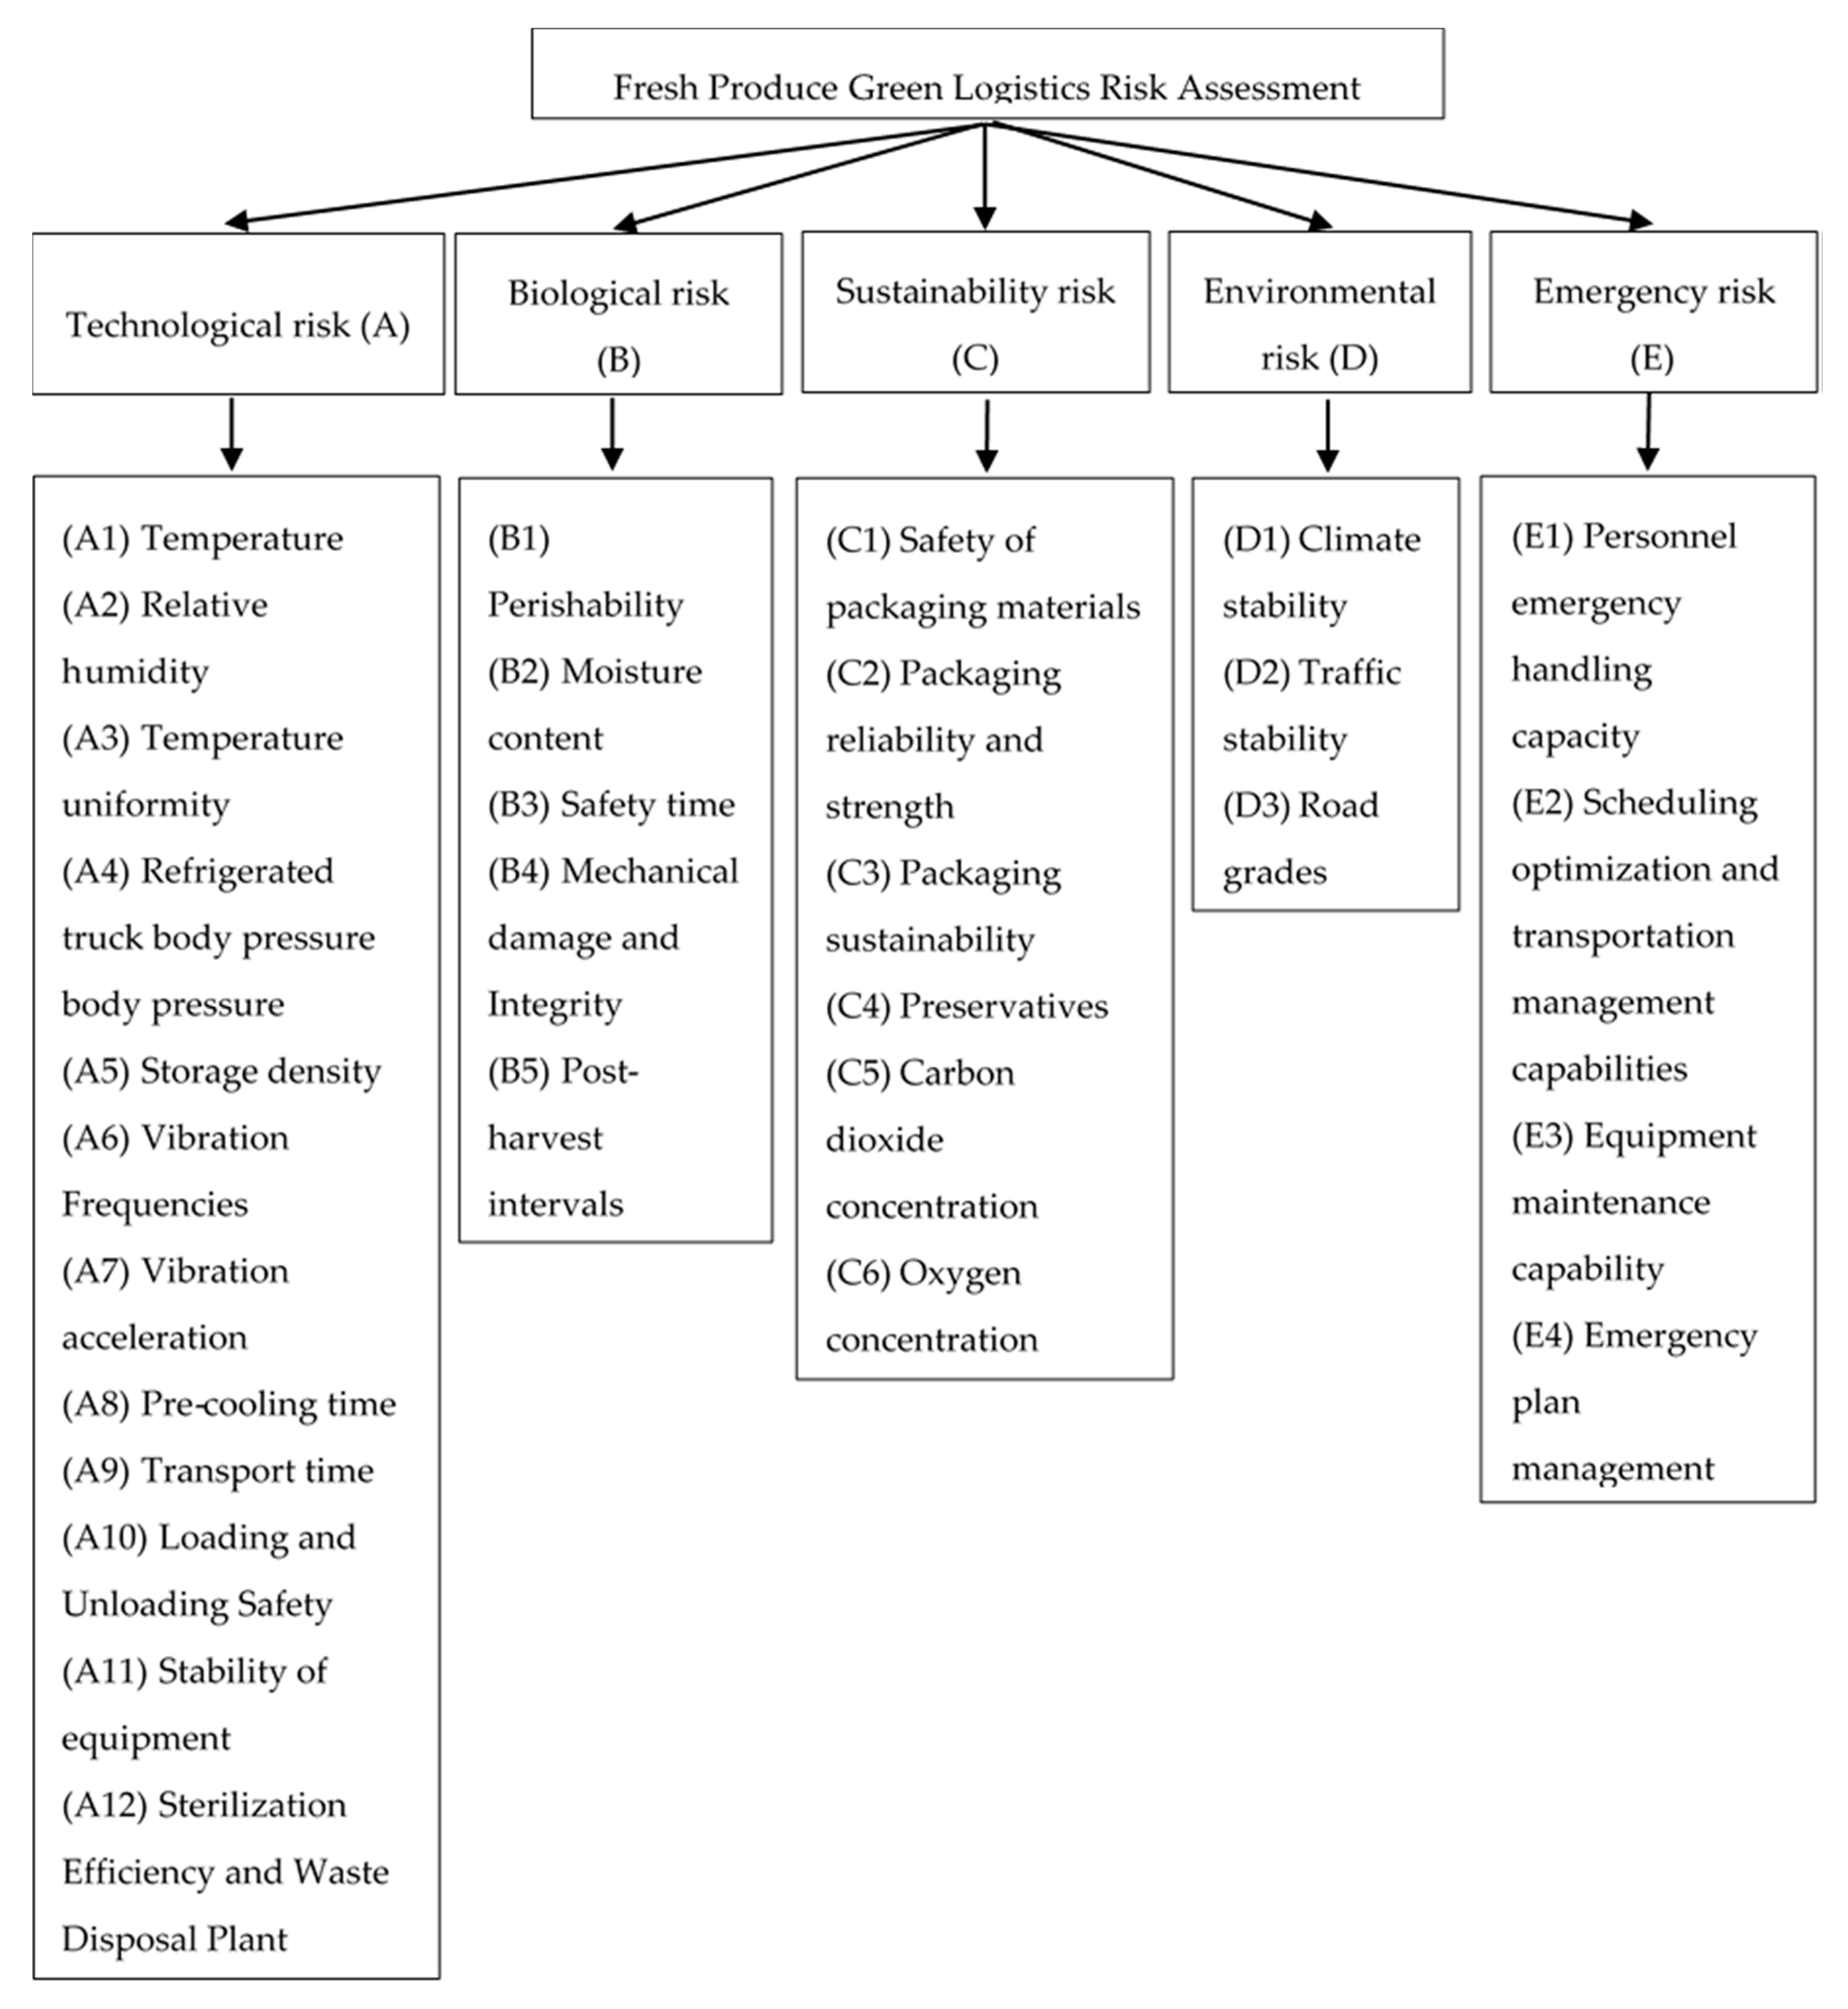
3. Proposed Risk Assessment Criteria System for Green Logistics of Fresh Produce
3.1. Direct Measurement Index of Proposed System
- Temperature (A1): The suitable storage temperature can extend the shelf life of fresh produce and ensure that fresh food will be safe to eat. Logistics companies need to try to maintain properly refrigerated or frozen temperature to comply with food safety regulations in the transport link, e.g., 0 to +4 °C is the safe refrigerator temperature range for the strawberry [14,34,35].
- Relative humidity (A2): The relative humidity represents the ratio of the current absolute humidity to the highest absolute humidity at that temperature and is measured in real-time. High relative humidity levels (85–95%) are usually recommended for transporting most fresh food to prevent moisture loss [36,37].
- Temperature uniformity (A3): This measures the potential variation in temperature between different points in the boxcar. The temperatures are collected using six sensors from multiple sites in the boxcar to measure the temperature uniformity. (Temperature uniformity (Maximum temperature–Minimum temperature)/ Average temperature). Improving temperature uniformity (i.e., decreasing temperature variation inside the boxcar) is thus required to keep food fresh [54].
- Refrigerated truck body pressure (A4): An inappropriate pressure inside the truck body could have a negative influence on product freshness.
- Storage density (A5): Storage density is defined as the percentage of available storage space to the total warehouse space (Storage density = Total storage apace in cubic feet/Total warehouse area in cubic feet). Extra space will be left when stacking to ensure that fresh products can carry out respiration, thus ensuring the freshness of produce [34].
- Vibration frequency (A6) and Vibration acceleration (A7): Vibration frequency, which is measured in hertz (Hz) units, is the rate at which vibrations and oscillations occur. This vibration acceleration may happen when encountering the bumpy roads, erratic driving, and so on. These indicators are used to measure the extent to which the goods vibrate, which may damage their integrity [42,43].
- Precooling time (A8): Precooling is a very important step in the postharvest stage of the fresh produce industry. Precooling means quickly removing the heat from harvested fruits and vegetables to reduce the loss in the quality of product once it has been picked. Likewise, efficient precooling equipment increases the shelf-life of fresh produce [55].
- Transport time (A9): The transport time represents the time needed to transport goods from the farm to a grocery store or a customer; a shorter transport time may ensure that the fresh produce quality better. For example, the plane takes less time to transport fresh products to consumers, but it also requires high transportation costs. On the contrary, road transportation costs are lower, but the freshness of fruits is sometimes not guaranteed due to the long transportation time [14].
- Moisture content (B2): This refers to the amount of water present in produce when it is loaded into the truck. The fruit with high water content will not rot easily, which can ensure the safety of transportation. This indicator can be measured by chemical experiments [41].
- Safety time (B3): This is also called shelf-life, which refers to the time from harvest to deterioration. In order to transport and store fruits and vegetables properly, it is useful to know approximately how long the fresh produce will last. Plan your transportation, preservation, sterilization, and other facilities accordingly so that fresh foods are at the peak of freshness when consumers plan to buy them [41].
- Postharvest interval (B5): The postharvest interval represents the time from harvest to transport, and mainly includes the time required for precooling, processing, and storage.
- Gas composition (C5), (C6): The gas composition (carbon dioxide and oxygen concentration) in the boxcar is used as an indicator. High carbon dioxide and low oxygen concentrations can inhibit produce respiration and is commonly used as a preservation practice (e.g., modified atmosphere packaging) [38,39].
3.2. Indirect Measurement Index of Proposed System
- Loading and unloading safety (A10): This factor is mainly dependent upon the training of the stevedore and the stability of the loading and unloading equipment. Standard operation technology can greatly reduce the loss of fresh products in the process of loading and unloading.
- Equipment stability (A11): The stability of equipment refers to the ability to maintain normal operation of the transportation equipment, refrigeration system, sanitation equipment, air conditioning system, and monitoring equipment. Damage to the fresh-keeping equipment in transit makes the fresh-keeping measures ineffective: long-term failure causes the produce to rot.
- The sterilization efficiency and waste disposal plant (A12): The capacity to inhibit bacterial reproduction and dispose of waste, respectively, thus guaranteeing the freshness of the produce. Efficient sanitary equipment can ensure the sustainability of preservation measures in fruit and vegetable logistics [59,60].
- Perishability (B1): We use perishability to measure whether the goods themselves are perishable; for example, strawberries have a shorter shelf life than apples [41].
- Mechanical damage and integrity (B4): These factors are used to indicate the integrity of the fresh food when loaded into the truck. A logistics company can use a nondestructive method to measure this indicator. Damaged fruit has a strong respiratory intensity and exposes wounds to pathogenic microorganisms, which lead to deterioration in quality [43].
- Packaging reliability and strength (C2): The ability of the package to complete the specified function under the specified conditions and within the specified time. This indicator can be given based on the rate of damage previously caused by the packaging mode [61].
- Packaging sustainability (C3): This factor refers to the sustainability of the raw materials of the package. It can be measured with the help of the related international standards.
- Preservatives (C4): The safety of preservatives used in packaging, such as chemical or bio-antiseptic, vacuum packaging, or modified atmosphere packaging, is also assessed. Such as adding unsafe preservatives will be rated as level 4, whereas using gas fresh-keeping technology will be rated as level 1.
- Climate stability (D1): This factor is used to indicate the possibility of encountering abnormal weather, such as rainstorms, ice, or snow, when transporting fresh goods [62].
- Traffic stability (D2): This indicates the frequency of traffic jams and accidents on the transportation route, which then increase the transportation time [62].
- Road grade (D3): The road grade represents the road traffic conditions during transportation, and is used as an indicator because frequent congestion and poor road conditions can prolong the transportation time.
- Personnel emergency handling capacity (E1): This indicates the ability of the transporter to handle any encountered emergency during transportation. An excellent driver can quickly deal with emergencies and minimize losses. Enterprises combine the theoretical examination and practical performance to determine the level of this indicator [19,63].
- The equipment maintenance capability (E3): This indicates the ability of transport personnel to repair equipment when the equipment fails, and an excellent operator can quickly repair the equipment and minimize the negative impact on fruit freshness [62].
- Emergency plan management (E4): This represents the ability to plan for possible emergencies; adequate plan management can reduce the transportation risk. The main objective of emergency planning is to reduce injuries, protect the community, and maintain business continuity.
4. Risk Assessment Using an SVM
4.1. Employed SVM Algorithm
4.2. Developed Risk Assessment Model of Fresh Produce Transportation
4.2.1. Risk Levels
4.2.2. Data Acquisition
4.2.3. Standardized Processing
4.2.4. Kernel Function and Cross-Validation
5. Simulation and Numerical Analysis
6. Conclusions
Supplementary Materials
Author Contributions
Funding
Acknowledgments
Conflicts of Interest
References
- Ruan, J.; Shi, Y. Monitoring and assessing fruit freshness in IOT-based e-commerce delivery using scenario analysis and interval number approaches. Inf. Sci. 2016, 373, 557–570. [Google Scholar] [CrossRef]
- Gibson, K.E.; Almeida, G.; Jones, S.L.; Wright, K.; Lee, J.A. Inactivation of bacteria on fresh produce by batch wash ozone sanitation. Food Control 2019, 106, 106747. [Google Scholar] [CrossRef]
- Kengpol, A.; Tuammee, S. The development of a decision support framework for a quantitative risk assessment in multimodal green logistics: An empirical study. Int. J. Prod. Res. 2016, 54, 1020–1038. [Google Scholar] [CrossRef]
- Nakandala, D.; Lau, H.C.W.; Zhao, L. Development of a hybrid fresh food supply chain risk assessment model. Int. J. Prod. Res. 2017, 55, 4180–4195. [Google Scholar] [CrossRef]
- Ishangulyyev, R.; Kim, S.; Lee, S.H. Understanding Food Loss and Waste-Why Are We Losing and Wasting Food? Foods 2019, 8, 297. [Google Scholar] [CrossRef] [PubMed] [Green Version]
- 2019 National Logistics Operation Status Report in China. Available online: http://www.chinawuliu.com.cn/lhhzq/202004/20/499790.shtml (accessed on 2 July 2020).
- 30th Annual State of Logistics Report. Available online: https://cscmp.org/store/detail.aspx?id=SOL-19 (accessed on 2 July 2020).
- Zhang, H.; Qiu, B.; Zhang, K. A new risk assessment model for agricultural products cold chain logistics. Ind. Manag. Data Syst. 2017, 117, 1800–1816. [Google Scholar] [CrossRef] [Green Version]
- Food Loss and Waste Database from Food and Agricultural Organization of the United Nations. Available online: http://www.fao.org/food-loss-and-food-waste/flw-data/en/ (accessed on 10 July 2020).
- Sustainable Development Goals from Food and Agricultural Organization of the United Nations. Available online: http://www.fao.org/sustainable-development-goals/en/ (accessed on 10 July 2020).
- Manuel, D.; Sowers, R.B. Optimal transport to cold chain in perishable hand-picked agriculture. Nat. Resour. Model. 2017, 30, 30. [Google Scholar] [CrossRef]
- Cai, X.; Zhou, X. Optimal Policies for Perishable Products When Transportation to Export Market Is Disrupted. Prod. Oper. Manag. 2014, 23, 907–923. [Google Scholar] [CrossRef]
- Blackburn, J.D.; Scudder, G.D. Supply Chain Strategies for Perishable Products: The Case of Fresh Produce. Prod. Oper. Manag. 2009, 18, 129–137. [Google Scholar] [CrossRef]
- Bogataj, M.; Bogataj, L.; Vodopivec, R. Stability of perishable goods in cold logistic chains. Int. J. Prod. Econ. 2005, 93, 345–356. [Google Scholar] [CrossRef]
- Diabat, A.; Jabbarzadeh, A.; Khosrojerdi, A. A perishable product supply chain network design problem with reliability and disruption considerations. Int. J. Prod. Econ. 2019, 212, 125–138. [Google Scholar] [CrossRef]
- Mohammed, A.; Wang, Q. The fuzzy multi-objective distribution planner for a green meat supply chain. Int. J. Prod. Econ. 2017, 184, 47–58. [Google Scholar] [CrossRef] [Green Version]
- Wang, M.; Zhao, L.; Herty, M. Joint replenishment and carbon trading in fresh food supply chains. Eur. J. Oper. Res. 2019, 277, 561–573. [Google Scholar] [CrossRef]
- Ingrao, C.; Gigli, M.; Siracusa, V. An attributional Life Cycle Assessment application experience to highlight environmental hotspots in the production of foamy polylactic acid trays for fresh-food packaging usage. J. Clean. Prod. 2017, 150, 93–103. [Google Scholar] [CrossRef]
- Perezmesa, J.C.; Piedramunoz, L.; Garciabarranco, M.C.; Giagnocavo, C. Response of Fresh Food Suppliers to Sustainable Supply Chain Management of Large European Retailers. Sustainability 2019, 11, 3885. [Google Scholar] [CrossRef] [Green Version]
- Dong, Q.; Cooper, O. An orders-of-magnitude AHP supply chain risk assessment framework. Int. J. Prod. Econ. 2016, 182, 144–156. [Google Scholar] [CrossRef]
- Kumar, A.; Mangla, S.K.; Kumar, P.; Karamperidis, S. Challenges in perishable food supply chains for sustainability management: A developing economy perspective. Bus. Strategy Environ. 2020. [Google Scholar] [CrossRef]
- Rangel, D.A.; De Oliveira, T.K.; Leite, M.S.A. Supply chain risk classification: Discussion and proposal. Int. J. Prod. Res. 2015, 53, 6868–6887. [Google Scholar] [CrossRef]
- Gokarn, S.; Kuthambalayan, T.S. Creating sustainable fresh produce supply chains by managing uncertainties. J. Clean. Prod. 2019, 207, 908–919. [Google Scholar] [CrossRef]
- Kaipia, R.; Dukovskapopovska, I.; Loikkanen, L. Creating Sustainable Fresh Food Supply Chains through Waste Reduction. Int. J. Phys. Distrib. Logist. Manag. 2013, 43, 262–276. [Google Scholar] [CrossRef] [Green Version]
- Ismail, A.; Abdlerazek, S.; Elhenawy, I. Development of Smart Healthcare System Based on Speech Recognition Using Support Vector Machine and Dynamic Time Warping. Sustainability 2020, 12, 2403. [Google Scholar] [CrossRef] [Green Version]
- Wang, G.; Ma, J. A hybrid ensemble approach for enterprise credit risk assessment based on Support Vector Machine. Expert Syst. Appl. 2012, 39, 5325–5331. [Google Scholar] [CrossRef]
- Ghadge, A.; Kara, M.E.; Mogale, D.G.; Choudhary, S.; Dani, S. Sustainability implementation challenges in food supply chains: A case of UK artisan cheese producers. Prod. Plan. Control 2020, 1–16. [Google Scholar] [CrossRef]
- Norrman, A.; Jansson, U. Ericsson’s proactive supply chain risk management approach after a serious sub-supplier accident. Int. J. Phys. Distrib. Logist. Manag. 2004, 34, 434–456. [Google Scholar] [CrossRef]
- Lau, H.; Nakandala, D.; Shum Paul, K. A business process decision model for fresh-food supplier evaluation. Bus. Process. Manag. J. 2018, 24, 716–744. [Google Scholar] [CrossRef]
- Li, J.; Hong, S.J. Towards a New Model of Supply Chain Risk Management: The Cross-Functional Process Mapping Approach. Int. J. Electron. Cust. Relatsh. Manag. 2007, 1, 91. [Google Scholar] [CrossRef]
- Deng, X.; Yang, X.; Zhang, Y.; Li, Y.; Lu, Z. Risk propagation mechanisms and risk management strategies for a sustainable perishable products supply chain. Comput. Ind. Eng. 2019, 135, 1175–1187. [Google Scholar] [CrossRef]
- Burek, J.; Nutter, D.W. Life cycle assessment of grocery, perishable, and general merchandise multi-facility distribution center networks. Energy Build. 2018, 174, 388–401. [Google Scholar] [CrossRef]
- Prakash, S.; Soni, G.; Rathore, A.P.S.; Singh, S. Risk analysis and mitigation for perishable food supply chain: A case of dairy industry. Benchmarking Int. J. 2017, 24, 2–23. [Google Scholar] [CrossRef]
- Chen, X.; Lu, L.; Wang, J. Numerical simulation and experimental verification of forced-air precooling temperature field inside fruit packaging box with multiple-layer grids. Trans. Chin. Soc. Agric. Eng. 2014, 30, 249–257. [Google Scholar]
- Song, H.; Kim, J.; Kim, B.; Koo, J. Development of a food temperature prediction model for real time food quality assessment. Int. J. Refrig. 2019, 98, 468–479. [Google Scholar] [CrossRef]
- Jalali, A.; Seiiedlou, S.; Linke, M.; Mahajan, P. A comprehensive simulation program for modified atmosphere and humidity packaging (MAHP) of fresh fruits and vegetables. J. Food Eng. 2017, 206, 88–97. [Google Scholar] [CrossRef]
- Jalali, A.; Rux, G.; Linke, M.; Geyer, M.; Pant, A.; Saengerlaub, S.; Mahajan, P.V. Application of humidity absorbing trays to fresh produce packaging: Mathematical modeling and experimental validation. J. Food Eng. 2019, 244, 115–125. [Google Scholar] [CrossRef]
- Ketsa, S.; Wisutiamonkul, A.; Van Doorn, W.G. Apparent synergism between the positive effects of 1-MCP and modified atmosphere on storage life of banana fruit. Postharvest Biol. Technol. 2013, 85, 173–178. [Google Scholar] [CrossRef]
- Chong, K.L.; Peng, N.; Yin, H.; Lipscomb, G.G.; Chung, T. Food sustainability by designing and modelling a membrane controlled atmosphere storage system. J. Food Eng. 2013, 114, 361–374. [Google Scholar] [CrossRef]
- Aung, M.M.; Chang, Y.S. Temperature management for the quality assurance of a perishable food supply chain. Food Control 2014, 40, 198–207. [Google Scholar] [CrossRef]
- Defraeye, T.; Nicolai, B.; Kirkman, W.; Moore, S.D.; Van Niekerk, S.; Verboven, P.; Cronje, P.J.R. Integral performance evaluation of the fresh-produce cold chain: A case study for ambient loading of citrus in refrigerated containers. Postharvest Biol. Technol. 2016, 112, 1–13. [Google Scholar] [CrossRef]
- Berardinelli, A.; Donati, V.; Giunchi, A.; Guarnieri, A.; Ragni, L. Damage to pears caused by simulated transport. J. Food Eng. 2005, 66, 219–226. [Google Scholar] [CrossRef]
- Fernando, I.; Fei, J.; Stanley, R. Measurement and analysis of vibration and mechanical damage to bananas during long-distance interstate transport by multi-trailer road trains. Postharvest Biol. Technol. 2019, 158, 110977. [Google Scholar] [CrossRef]
- Verboven, P.; Flick, D.; Nicolai, B.; Alvarez, G. Modelling transport phenomena in refrigerated food bulks, packages and stacks: Basics and advances. Int. J. Refrig. 2006, 29, 985–997. [Google Scholar] [CrossRef]
- Jacxsens, L.; Luning, P.; Van Der Vorst, J.; Devlieghere, F.; Leemans, R.; Uyttendaele, M. Simulation modelling and risk assessment as tools to identify the impact of climate change on microbiological food safety—The case study of fresh produce supply chain. Food Res. Int. 2010, 43, 1925–1935. [Google Scholar] [CrossRef]
- Accorsi, R.; Gallo, A.; Manzini, R. A climate driven decision-support model for the distribution of perishable products. J. Clean. Prod. 2017, 165, 917–929. [Google Scholar] [CrossRef]
- Sharma, R.; Kamble, S.S.; Gunasekaran, A.; Kumar, V.; Kumar, A. A systematic literature review on machine learning applications for sustainable agriculture supply chain performance. Comput. Oper. Res. 2020, 119, 104926. [Google Scholar] [CrossRef]
- Singh, S. Support Vector Machine Based Approaches For Real Time Automatic Speaker Recognition System. Int. J. Electr. Comput. Eng. 2018, 8, 2804. [Google Scholar]
- Munkhdalai, L.; Munkhdalai, T.; Namsrai, O.; Lee, J.Y.; Ryu, K.H. An Empirical Comparison of Machine-Learning Methods on Bank Client Credit Assessments. Sustainability 2019, 11, 699. [Google Scholar] [CrossRef] [Green Version]
- Harris, T. Quantitative credit risk assessment using support vector machines: Broad versus Narrow default definitions. Expert Syst. Appl. 2013, 40, 4404–4413. [Google Scholar] [CrossRef]
- Li, F.; Wang, W.; Xu, J.; Yi, J.; Wang, Q. Comparative study on vulnerability assessment for urban buried gas pipeline network based on SVM and ANN methods. Process. Saf. Environ. Prot. 2019, 122, 23–32. [Google Scholar] [CrossRef]
- Lau, C.K.; Lai, K.K.; Lee, Y.P.; Du, J. Fire risk assessment with scoring system, using the support vector machine approach. Fire Saf. J. 2015, 78, 188–195. [Google Scholar] [CrossRef]
- Mogale, D.G.; Kumar, S.K.; Tiwari, M.K. Green food supply chain design considering risk and post-harvest losses: A case study. Ann. Oper. Res. 2020, 1–28. [Google Scholar] [CrossRef]
- Nam, S.W.; Kim, Y.S. Analysis on the Uniformity of Temperature and Humidity According to Environment Control in Tomato Greenhouses. Prot. Hortic. Plant Fact. 2009, 18, 215–224. [Google Scholar]
- Xu, C.-C.; Liu, D.-K.; Guo, C.-X.; Wu, Y.-Q. Effect of cooling rate and super-chilling temperature on ice crystal characteristic, cell structure, and physicochemical quality of super-chilled fresh-cut celery. Int. J. Refrig. 2020, 113, 249–255. [Google Scholar] [CrossRef]
- Wu, Y.-J.; Hou, J.-L. An employee performance estimation model for the logistics industry. Decis. Support. Syst. 2010, 48, 568–581. [Google Scholar] [CrossRef]
- Lin, C.-C.; Chang, C.-H. Evaluating skill requirement for logistics operation practitioners: Based on the perceptions of logistics service providers and academics in Taiwan. Asian J. Shipp. Logist. 2018, 34, 328–336. [Google Scholar] [CrossRef]
- Chikwendu, O.C.; Chima, A.S.; Edith, M.C. The optimization of overall equipment effectiveness factors in a pharmaceutical company. Heliyon 2020, 6, e03796. [Google Scholar] [CrossRef]
- Gu, G.; Ottesen, A.; Bolten, S.; Wang, L.; Luo, Y.; Rideout, S.; Lyu, S.; Nou, X. Impact of routine sanitation on the microbiomes in a fresh produce processing facility. Int. J. Food Microbiol. 2019, 294, 31–41. [Google Scholar] [CrossRef] [Green Version]
- Bouwknegt, M.; Verhaelen, K.; Rzezutka, A.; Kozyra, I.; Maunula, L.; Von Bonsdorff, C.; Vantarakis, A.; Kokkinos, P.; Petrovic, T.; Lazic, S. Quantitative farm-to-fork risk assessment model for norovirus and hepatitis A virus in European leafy green vegetable and berry fruit supply chains. Int. J. Food Microbiol. 2015, 198, 50–58. [Google Scholar] [CrossRef] [PubMed]
- Fadiji, T.; Coetzee, C.J.; Berry, T.M.; Opara, U.L. Investigating the role of geometrical configurations of ventilated fresh produce packaging to improve the mechanical strength—Experimental and numerical approaches. Food Packag. Shelf Life 2019, 20, 100312. [Google Scholar] [CrossRef]
- Ali, S.M.; Moktadir, M.A.; Kabir, G.; Chakma, J.; Rumi, M.J.U.; Islam, M.T. Framework for evaluating risks in food supply chain: Implications in food wastage reduction. J. Clean. Prod. 2019, 228, 786–800. [Google Scholar]
- Tramarico, C.L.; Salomon, V.A.P.; Marins, F.A.S. Multi-criteria assessment of the benefits of a supply chain management training considering green issues. J. Clean. Prod. 2017, 142, 249–256. [Google Scholar] [CrossRef] [Green Version]
- Wu, Y.; Xiao, H.; Peng, X.; Zhao, H. Situation and Development Trend of Strawberry Storage and Transport Preservation Technology. Acad. Period. Farm. Prod. Process. 2011, 11, 130–132, 156. [Google Scholar]
- Vapnik, V.N. The Nature of Statistical Learning Theory; Springer: Berlin, Germany, 1995. [Google Scholar]
- Guyon, I.; Vapnik, V.; Boser, B.; Bottou, L.; Solla, S.A. Structural risk minimization for character recognition. Advances in Neural Information Processing Systems; Morgan Kaufmann: Burlington, MA, USA, 1992; pp. 471–479. [Google Scholar]
- Yang, J.; Luo, D. The P2P Risk Assessment Model Based on the Improved AdaBoost-SVM Algorithm. J. Financ. Risk Manag. 2017, 06, 201–209. [Google Scholar] [CrossRef] [Green Version]
- Hsu, C.W.; Lin, C.J. A Comparison of Methods for Multiclass Support Vector Machines. IEEE Trans. Neural Netw. 2002, 13, 415–425. [Google Scholar] [PubMed] [Green Version]
- Qian, H.; Mao, Y.; Xiang, W.; Wang, Z. Recognition of human activities using SVM multi-class classifier. Pattern Recognit. Lett. 2010, 31, 100–111. [Google Scholar] [CrossRef]
- Duarte, E.C.; Wainer, J. Empirical comparison of cross-validation and internal metrics for tuning SVM hyperparameters. Pattern Recognit. Lett. 2017, 88, 6–11. [Google Scholar] [CrossRef]
- Cristianini, N.; Shawe-Taylor, J. An Introduction to Support Vector Machines and Other Kernel-Based Learning Methods; Cambridge University Press: Cambridge, UK, 2000. [Google Scholar]
- Ben-Arie, J.; Wang, Z.; Pandit, P.; Rajaram, S. Human activity recognition using multidimensional indexing. IEEE Trans. Pattern Anal. Mach. Intell. 2002, 24, 1090–1104. [Google Scholar] [CrossRef] [Green Version]
- Chang, C.C.; Lin, C.J. LIBSVM: A library for support vector machines. ACM Trans. Intell. Syst. Technol. 2011, 2, 1–27. [Google Scholar] [CrossRef]
- Hiroaki, K.; Yutaka, I.; Fei, L.; Hu, Y.; Nobutaka, N.; Takeo, S. Analysis of Shock during Strawberry Transport and Damage Estimation. Hortic. Res. 2010, 9, 221–227. [Google Scholar]

| Article | Methodologies | Research |
|---|---|---|
| Cai et al. [12] | Mathematic model | The effects of freshness-keeping efforts |
| Bogataj et al. [14] | The effects of time, distance, and temperature | |
| Diabat A et al. [15] | Considering the disruption of disaster scenarios | |
| Mohammed A et al. [16] | Investigating environmental impact | |
| Ingrao et al. [18] | Life Circle Assessment | The effects of packing technology in environmental sustainability |
| Perezmesa et al. [19] | Survey and Analysis | The response of suppliers to sustainable supply chain management |
| Kumar et al. [21] | Interpretive Structural Modelling–Analytic Network Process Decision Framework | Identify and model key challenges to sustainability in perishable food supply chains |
| Gokarn [23] | Structural Equation Modelling | The influence of supply, demand, and price uncertainties on the sustainability of cold chain. |
| Kaipia et al. [24] | Empirical study | Information sharing |
| Nakandala et al. [4] | Fuzzy Logic and Hierarchical Holographic Modelling | Internal risk and external risk |
| Deng et al. [31] | Tropos Goal-Risk Framework | Demand risk, staff risk, equipment risk, inventory risk, method risk, logistics risk, organizational risk, information risk, and environmental risk |
| Prakash et al. [29] | Interpretative Structural Modelling | Environmental risk, supply risk, demand risk, and process risk |
| Ruan and Shi [1] | Scenario Analysis and Interval Number Approaches | Monitor and assess fruit freshness based on the internet of things |
| Present study | Support Vector Machine | Technological risk, biological risk, sustainability risk, environmental risk, and emergency risk |
| First-Class | Second-Class | Explanation | Reference |
|---|---|---|---|
| Technological risk (A) | Temperature | The actual temperature of food | Bogataj, M. et al. [14] Song H. et al. [35] |
| Relative humidity | Actual humidity of food | Jalal A. et al. [36] Jalali, A. et al. [37] | |
| Temperature uniformity | Measure the uniformity of temperature | ||
| Refrigerated truck body pressure | Pressure in the boxcar | ||
| Storage density | The space between the goods | ||
| Vibration frequencies | Measure the effect of vibration on food | Fernando, I. et al. [43] Berardinelli, A. et al. [42] | |
| Vibration acceleration | |||
| Precooling time | The time after harvesting to be cooled to the fresh-keeping temperature | ||
| Transport time | The time of the transport link | Bogataj, M. et al. [14] | |
| Loading and Unloading Safety | Handling the proficiency of workers | ||
| Stability of equipment | The old or new degree of equipment | ||
| Sterilization Efficiency and Waste Disposal Plant | Cleaning and sterilization of equipment | Gu, G. et al. [59] Bouwknegt, M. et al. [60] | |
| Biological risk (B) | Perishability | Whether the specified fruit or vegetable is perishable | Defraeye, T. et al. [41] |
| Moisture content | The moisture content of the specified fruit or vegetable | ||
| Safety time | Freshness keeping time | ||
| Mechanical damage and Integrity | Completeness of the specified fruit or vegetable before transportation | Fernando, I. et al. [43] | |
| Postharvest intervals | Time from harvest to transport | ||
| Sustainability risk (C) | Safety of packaging materials | Whether the packing is safe | Wu, Y. et al. [64] Jalali, A. et al. [36] Verboven, P. et al. [44] |
| Packaging reliability and strength | Whether the packing is strong | Fadiji, T. et al. [61] | |
| Packaging sustainability | |||
| Preservatives | Safety of anticorrosion measure | ||
| Carbon dioxide concentration | The concentration of the gas in the package | Ketsa, S. et al. [38] Chong, K.L. et al. [39] | |
| Oxygen concentration | |||
| Environmental risk (D) | Climate stability | Possibility of extreme weather | Ali, S.M. et al. [62] |
| Traffic stability | Possibility of traffic jams | ||
| Road grades | The capacity of a road | ||
| Emergency risk (E) | Personnel emergency handling capacity | Capacity to tackle an emergency | Tramarico, C.L. [63] |
| Scheduling optimization, transportation management capabilities | The capability of transportation route planning and management | ||
| Equipment maintenance capability | The maintenance level of transport workers | Ali, S.M. et al. [62] | |
| Emergency plan management | The capacity of early warning |
| Risk Level | Severity of Consequence | Enterprise Response Measures |
|---|---|---|
| 1 | Very low | Unnecessary |
| 2 | Low | Check the fresh-keeping plan |
| 3 | High | Upgrade equipment |
| 4 | Very High | Replace equipment and fresh-keeping plan |
| Index | Dimension | Range | 1 | 2 | 3 | …… | 349 | 350 | |
|---|---|---|---|---|---|---|---|---|---|
| Technological risk (A) | Temperature | Positive | [0,22] | 0.11 | 17.21 | 5.22 | …… | 10.64 | 7.00 |
| Relative humidity | Negative | [0.8,0.95] | 0.91 | 0.85 | 0.91 | …… | 0.91 | 0.87 | |
| Temperature uniformity | Positive | [0.4,3.2] | 1.05 | 1.38 | 1.56 | …… | 2.00 | 0.98 | |
| Refrigerated truck body pressure | [1.28,2.72] | 1.69 | 2.15 | 1.67 | …… | 2.13 | 1.74 | ||
| Storage density | [0.68,0.98] | 0.80 | 0.83 | 0.82 | …… | 0.75 | 0.86 | ||
| Vibration Frequencies | [14,25] | 17.49 | 20.77 | 17.39 | …… | 16.45 | 19.21 | ||
| Vibration acceleration | [2.94,14.7] | 8.09 | 14.12 | 13.34 | …… | 5.30 | 4.70 | ||
| Precooling time | [0.2,2.55] | 1.72 | 1.07 | 1.66 | …… | 1.62 | 1.81 | ||
| Transport time | [0,49] | 23.91 | 4.54 | 8.50 | …… | 24.95 | 8.18 | ||
| Loading and Unloading Safety | [1,5] | 1 | 1 | 2 | …… | 5 | 1 | ||
| Stability of equipment | [1,5] | 2 | 1 | 1 | …… | 4 | 2 | ||
| Sterilization Efficiency and Waste Disposal Plant | [1,5] | 5 | 4 | 2 | …… | 2 | 2 | ||
| Biological risk (B) | Perishability | [1,5] | 5 | 5 | 4 | …… | 2 | 2 | |
| Moisture content | Negative | [0.86,0.96] | 0.92 | 0.91 | 0.91 | …… | 0.88 | 0.88 | |
| Safety time | [2,17] | 4.73 | 8.93 | 5.93 | …… | 7.85 | 4.28 | ||
| Mechanical damage and Integrity | [1,5] | 3 | 4 | 4 | …… | 2 | 5 | ||
| Postharvest intervals | Positive | [1,121] | 83.60 | 65.27 | 73.21 | …… | 37.31 | 77.35 | |
| Sustainability risk (C) | Safety of packaging materials | [1,5] | 5 | 2 | 5 | …… | 1 | 3 | |
| Packaging reliability and strength | [1,5] | 5 | 1 | 5 | …… | 4 | 2 | ||
| Packaging sustainability | [1,5] | 1 | 4 | 4 | …… | 4 | 5 | ||
| Preservatives | [1,5] | 2 | 1 | 4 | …… | 1 | 5 | ||
| Carbon dioxide concentration | Negative | [0.05,0.25] | 0.16 | 0.14 | 0.11 | …… | 0.10 | 0.15 | |
| Oxygen concentration | Positive | [0.02,0.15] | 0.07 | 0.03 | 0.10 | …… | 0.09 | 0.09 | |
| Environmental risk (D) | Climate stability | [1,5] | 3 | 2 | 2 | …… | 4 | 2 | |
| Traffic stability | [1,5] | 4 | 3 | 1 | …… | 1 | 4 | ||
| Road grades | [1,5] | 2 | 1 | 5 | …… | 2 | 1 | ||
| Emergency risk (E) | Personnel emergency handling capacity | [1,5] | 5 | 1 | 2 | …… | 1 | 1 | |
| Scheduling optimization, transportation management capabilities | [1,5] | 4 | 3 | 4 | …… | 1 | 3 | ||
| Equipment maintenance capability | [1,5] | 5 | 5 | 3 | …… | 2 | 3 | ||
| Emergency plan management | [1,5] | 3 | 2 | 1 | …… | 3 | 3 | ||
| Risk level | 3 | 2 | 3 | …… | 2 | 1 | |||
| Simulation Number | 1 | 2 | 3 | 4 | 5 | 6 |
| Prediction Accuracy | 90% | 90% | 97.5% | 85% | 90% | 90% |
© 2020 by the authors. Licensee MDPI, Basel, Switzerland. This article is an open access article distributed under the terms and conditions of the Creative Commons Attribution (CC BY) license (http://creativecommons.org/licenses/by/4.0/).
Share and Cite
Zhang, G.; Li, G.; Peng, J. Risk Assessment and Monitoring of Green Logistics for Fresh Produce Based on a Support Vector Machine. Sustainability 2020, 12, 7569. https://doi.org/10.3390/su12187569
Zhang G, Li G, Peng J. Risk Assessment and Monitoring of Green Logistics for Fresh Produce Based on a Support Vector Machine. Sustainability. 2020; 12(18):7569. https://doi.org/10.3390/su12187569
Chicago/Turabian StyleZhang, Guoquan, Guohao Li, and Jing Peng. 2020. "Risk Assessment and Monitoring of Green Logistics for Fresh Produce Based on a Support Vector Machine" Sustainability 12, no. 18: 7569. https://doi.org/10.3390/su12187569
APA StyleZhang, G., Li, G., & Peng, J. (2020). Risk Assessment and Monitoring of Green Logistics for Fresh Produce Based on a Support Vector Machine. Sustainability, 12(18), 7569. https://doi.org/10.3390/su12187569