Abstract
The aim of this study is to improve the water distribution uniformity of a vertical impact sprinkler and explore the design method of the drive spoon blades. The width of straight blades (h1), the width of curved blades (h2) and number of blades (s) were chosen as the experiential variables. The suitable ranges of three variables for response surface method were determined initially by one-factor experimental design method, and 17 different drive spoons were designed according to response surface methodology. The results showed that in the one-factor experimental condition, the CU (Christiansen’s uniformity coefficient) values first increased and decreased slightly when h1 exceeded 3 mm with the increase of h1 within the variation range of the experimental factor. The CU values firstly increased and then decreased with the increase of h2. The CU values decreased rapidly when s was less than 3 or greater than 6. The relationship between CU values and h1, h2 and s was established using response surface methodology. The p-values for h1, h2 and s were 0.0359, 0.0092, 0.0212, and all of the selected factors were significant on CU. The order of parameters affecting CU were h2, h1 and s. The ideal parameters for the drive spoon blades were h1 = 6 mm, h2 = 4 mm, and s = 3. CU was greatly improved after the optimization of structure for the drive spoon blades, which increased to 87.96% from 73.12%. After optimization, the application rates within 1 to 5 m were improved and increased from 10% to 15% with an average of 10.7% under different operating pressures. The maximum application rates decreased from 9.3, 9.3, 9.4 and 8.4 mm·h−1 to 8.5, 8.4, 8.5 and 7.9 mm·h−1 with operating pressures of 300, 400, 500 and 600 kPa, respectively. The maximum application rates in the overlap area were decreased from 18, 16, 16 and 15 mm·h−1 to 16, 14, 14 and 12 mm·h−1 with operating pressures of 300, 400, 500 and 600 kPa, respectively.
1. Introduction
At present, the promotion of advanced water-saving irrigation technologies presented by sprinkling irrigation and micro-irrigation is an important measure for developing water-saving agriculture and improving water utilization [1,2,3]. As one of the efficient water-saving irrigation technologies, sprinkler irrigation has advantages such as water conservation, productivity increase, labor-saving, maintaining ecological balance and improving crop quality [4,5,6]. The sprinkler is the key piece of equipment for sprinkler irrigation, and the hydraulic and operating performance determines the quality of the irrigation system to a great extent [7,8]. The vertical impact sprinkler is the most presentable middle-high pressure (>300 kPa) rotating sprinkler, and the most widely used in both solid set spray and hose-drawn traveler irrigator systems [9,10].
The vertical impact sprinkler was the one which acquired the driving torque from the reacting force generated by a water jet through the drive spoon [11]. As one of the key hydraulic components of a vertical impact sprinkler, the drive spoon played two major roles: (1) it acquired driving force from the water jet to drive the sprinkler; (2) it breaks the water jet and supplements the water near to the sprinkler to improve the water distribution uniformity. The water distribution uniformity of a vertical impact sprinkler depends on flow rate and working pressure, as well as the overlapping distance and the structure which can affect the water jet. However, most studies about the sprinkler were mainly focused on hydraulic performance assessment with different nozzle diameters, operating pressures, wind speeds and layouts [12,13,14,15]. Hence, an analysis of the effect of other key structures (such as the water dispersion device, the drive arm, the drive spoon and so on) on hydraulic performance is also important for the improvement of sprinkler application and design. Li et al. [16] further analyzed the motion process of the drive spoon in the water jet and pointed out the ideal positional parameters of the drive spoon for the vertical impact sprinkler. Tang et al. [17] analyzed the stress and deformation distribution on the drive spoon blades by utilizing the fluid-structure interaction method. Tang et al. [11] developed a simple theory of the forces caused by the impact of the water jet on the drive spoon and carried out an experiment to verify the accuracy, and the research results provided a theoretical basis for optimizing the structural mechanical properties of the drive spoon. Ge et al. [18] analyzed a variety of methods to obtain sprinkler radial water distribution and proposed the most feasible method for a vertical sprinkler used in mobile sprinkler machines. Issaka et al. [19] improved the hydraulic performance of a horizontal impact sprinkler under low-pressure conditions by optimizing the structural parameters of a fixed water dispersion device. Li et al. [20] investigated the influence of a fixed water dispersion device on jet dispersion and range for a horizontal impact sprinkler.
However, researchers on water dispersion devices by scholars were mainly focused on the horizontal impact sprinkler, and there was little research on the effect of the structure sizes of drive spoon blades on hydraulic performance for the vertical impact sprinkler. The existing research results cannot be applied to guide the design of the drive spoon for the vertical impact sprinkler due to the working principles and structural forms which were totally different for horizontal and vertical impact sprinklers. However, in the actual application of this kind of vertical impact sprinkler, we found that the drive spoon blades have a significant influence on the hydraulic performance. At the same time, the design principles of the drive spoon blades are not clear, therefore, we cannot design the drive spoon blades when we need to design or optimize a new sprinkler.
Hence, the main objectives of this research were to use the one-factor experimental design method and response surface methodology to optimize the structural sizes of the drive spoon blades for improving the hydraulic performance of a vertical impact sprinkler, and to verify the accuracy of the optimized results by experiments.
2. Materials and Methods
2.1. Structure of the Drive Spoon
A vertical impact sprinkler from the Nelson Irrigation Co., Walla Walla, WA, USA, was selected for this study. As shown in Figure 1, the structure of the vertical impact sprinkler includes lower bearing assembly, stop shifter, shift lever, counterweight, arm, shift lever shaft, drive arm shaft, spray tube, nozzle and drive spoon.
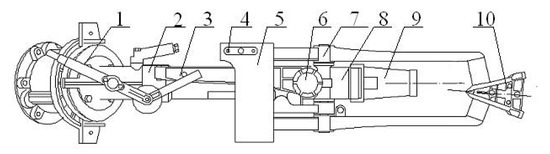
Figure 1.
General arrangement diagram of vertical impact sprinkler: 1. lower bearing assembly, 2. stop shifter, 3. shift lever, 4. Counterweight, 5. drive arm, 6. shift lever shaft, 7. drive arm shaft, 8. spray tube, 9. nozzle and 10. drive spoon.
The structure diagram of the drive spoon used in the experiment is shown in Figure 2. The previous studies on the working principle of the drive spoon and its motion process in the water jet have been described in detail [16,17]. The structure parameters of the drive spoon blades mainly include the width of straight blades (h1), the width of curved blades (h2), outlet angle of water jet on curved blades (α2), number of blades (s) and blade thickness (b).
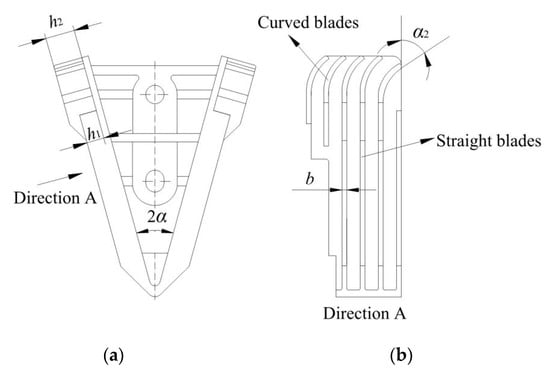
Figure 2.
Structural diagram of the drive spoon: (a) Top view of drive spoon; (b) View from direction A of drive. α is the angle between straight blades and the centerline of jet (°); α1 is the angle of straight blades into water jet (°); α2 is the outlet angle of water jet on curved blades (°); h1 is the width of straight blade (mm); h2 is the width of curved blade (mm); b is blade thickness (mm).
The curved blades play major roles in providing the action area for the water jet, generating the impact force and changing the direction of the water jet. An impact force is generated at the curved blades due to the change of the water jet direction, which makes the drive arm move downward, escaping from the water jet. At the same time, the water flow through the curved blades drops on the near range, which can supplement the water application rate near to the sprinkler and improve water distribution uniformity.
The straight blades play a major role of guiding the water flow along the trench and generating an acting force to make the drive spoon enter into the water jet and accelerate when the drive arm cuts into the water jet.
The drive spoon is designed with multiple blades with the main purpose of separating the water jet into multiple smaller water jets through blades which can greatly reduce the inertia and increase the angular momentum of jet flow.
The angle of curved blades (α2) is the outlet angle when the water flow passes through the drive spoon; the size of which has influence on the magnitude of the vertical impact force obtained by the drive spoon from the water jet. The angle is generally 45°, and the curved blades can achieve preferable impact force to drive the sprinkler and attain desirable dispersion of water flow as well.
2.2. Experiment Set-Up
An indoor experiment apparatus was set up in the experimental hall of the Research Center of Fluid Machinery Engineering and Technology at Jiangsu University, Zhenjiang, China. The schematic of the experimental set-up is shown in Figure 3. A centrifugal pump supplied water to the test system from a constant level reservoir. Pressure was measured at the base of the sprinkler head using a pressure gauge with an accuracy tolerance of 0.4%. The catch cans used in the study for testing radial water application were cylindrical in shape with a height of 0.6 m and an inside diameter of 0.2 m. The water collected in each catch can was measured using a graduated cylinder. The application rate was calculated based on the diameter of the catch cans and the duration of each test. The sprinkler was run for 20 min before performing the experiments in order to standardize environmental conditions. Three repetitions were made for every operating pressure and the volume of water in each catch can was determined as the average of catch cans for three repetitions.
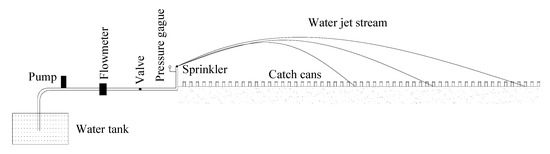
Figure 3.
Schematic diagram of the experimental system in the laboratory.
The three design variables including the width of curved blades, the width of straight blades and the number of blades were selected to research. The one-factor experimental design method was adopted to conduct a contrast experiment in an item-by-item approach, and to research the influence of the three variables on hydraulic performance. During the experiment, all the variables were kept unchanged except for the changes on the design variables of selected factors. Namely, the angle of curved blades was kept as 45°, and the blade thickness was maintained as 1 mm. The nozzle diameter was 12.5 mm and operating pressure was 500 kPa. Table 1 presents various sizes of the blade on the drive spoon for the experiment.

Table 1.
Structure sizes of the drive spoon blades for the one-factor experiment.
After analyzing the results of the one-factor experiment, response surface methodology (RSM) was adopted to establish the relationship between CU (Christiansen’s uniformity coefficient) values and three factors based on the analysis results of the one-factor experiment. Response surface methodology (RSM) is a collection of mathematical and statistical techniques for investigating the problems in which several independent variables have on response variables [21,22]. RSM aims at building a regression model (approximation) that is closest to the true regression model. The model to be built is based on experimental data and the model is empirical.
2.3. Evaluation Index
The rate that water falls to the ground is the application rate and it is an important hydraulic performance for sprinklers. Another important index is the sprinkler irrigation uniformity coefficient, and it mainly reflects the distribution of the water volume in the irrigation area to a homogeneous degree. Hence, it has a significant influence on the growth of crops and is one of the important indexes to evaluate the quality of sprinkler irrigation. Christiansen’s uniformity coefficient (CU) was defined to evaluate sprinkler irrigation systems and has the strongest historical precedent in the sprinkler irrigation industry [23,24]. Christiansen’s equation is defined as:
where CU is Christiansen’s uniformity coefficient, %. xi is measured depth (volume or mass) of water in equally spaced catch cans on a grid; xm is mean depth (volume or mass) of water of the catch in all cans.
MATLAB (The MathWorks, Inc., Apple Hill Drive, Natick, MA, USA) was used as the computational program to calculate the combined CU values according to the radial application rate of water distribution [25,26]. A square layout is more convenient to pipeline design and irrigation system management, which is widely applied in practical engineering [27]. Hence, a square layout form was adopted to analyze the effects of structural parameters on CU values as presented in Figure 3. The spacing coefficient was defined as a parameter to describe the overlapping distance of two sprinklers (l), and spacing coefficient was equal to the times of radius of throw (R). As shown in Figure 4, the maximum spacing coefficient achieved for square layout was 1.41. At this point, the control area was largest, which resulted in fewer pipes and sprinklers. The spatial water distribution is mainly used to describe the distribution of applied water on a surface for irrigation with combined sprinklers.
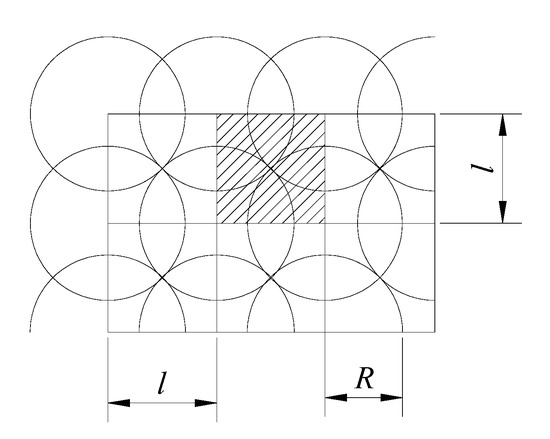
Figure 4.
Schematic diagram of sprinkler under square combination: l is overlapping distance of two sprinklers; R is radius of throw.
3. Results and Discussion
3.1. Analysis of Single Factor Experiment Results
Figure 5a presents the relationships between h1 and CU values. The graph shows that the CU values initially increased and then decreased slightly when h1 exceeded 3 mm with the increase of h1 within the variation range of the experimental factor. When h1 was 4 mm, CU achieved a maximum value of 75.06%.
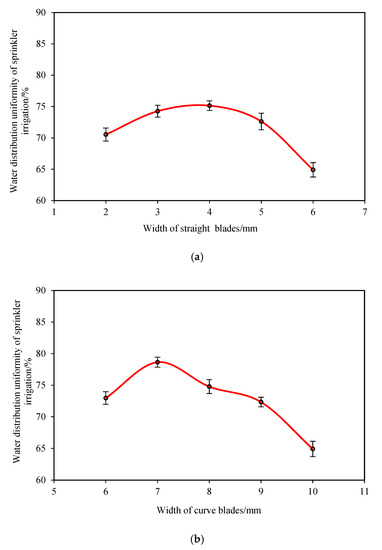
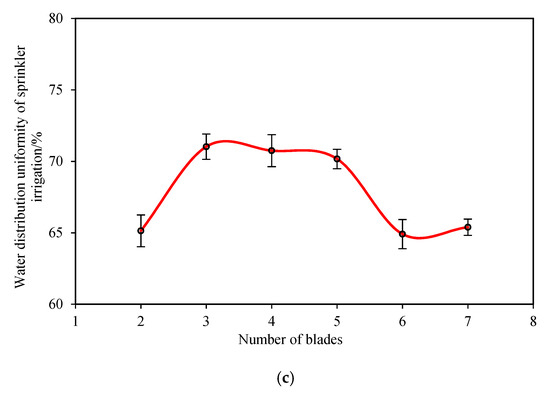
Figure 5.
Relationships between three design variables and CU (Christiansen’s uniformity coefficient) values: (a) The width of straight blades; (b) The width of curved blades; (c) Number of blades.
Figure 5b presents the relationships between h2 and CU values. It can be observed that the CU values firstly increased and then decreased with the increase of h2 within the variation range of experimental factor. When h2 was 7 mm, CU achieved a maximum value of 78.65%. Tang et al. [18] stated that the frequency of a drive spoon break water jet presented normal distribution with h2, which indicated that larger or smaller size of h2 has influence on the water distribution.
Figure 5c presents the relationships between number of blades and CU values. The graph shows that the CU values had small variation when the number of blades increased from three to six, and CU achieved a maximum value of 71.72% when the number of blades was three. The CU values decreased rapidly when the number of blades was less than three or greater than six.
3.2. Response Surface Analysis
The value ranges of three parameters were selected based on the one-factor experiment results. In order to ensure the accuracy of experiment and reduce the experimental schemes, the Box–Behnken response surface design method was chosen in this study, and Box–Behnken designs were specially made to three levels, coded as −1, 0, and +1. The Box–Behnken design uses the twelve middle edge nodes and three center nodes to fit a 2nd order equation. The central composite plus Box–Behnken becomes a full factorial with three extra samples taken at the center. Table 2 is the test table of three levels and three parameters based on the Box–Behnken design method.
Table 2.
Experimental factor and levels.
According to the Box–Behnken design method, 17 group schemes in Table 3 were determined and the response variables of each scheme were tested by experiment. The design expert software was applied for the response surface methodology to establish the relationship between different variables and objective function. More importantly, the mathematical model of the relationship was built using the regression analysis. The quadratic polynomial equation for the response variable using the relative parameters was established as described below in Equation (2):
CU = 239.355 − 29.175h2 + 32.67h1 − 63.095s + 0.41h1·h2 + 1.575h2·s − 1.735h1·s + 1.52h22 − 3.725h12 + 7.205s2
Table 3.
Response surface experimental design and results.
Table 4 shows the results of regression analysis for Equation (2). The R-Squared (coefficient of determination) and adequate precision values were worked out using the design expert software. The R-Squared value for the model was 0.9646 indicating a better fit between the mathematical model and the actual data observed within the experimental domain. The precision of an experiment can be expressed as the coefficient of variation (CV): the higher the CV, the lower the reliability of the experiment. CV was 1.78% in this experiment, which indicated that the experiment has a good reliability and small deviation. The predicted R-Squared of 0.7406 was in rational agreement with the adjusted R-Squared of 0.9191. Adequate precision measures the signal to noise ratio and a ratio greater than four is desirable. The value of adequate precision for Equation (2) was considerably larger than four, thus proving the required model discrimination.
Table 4.
Regression analysis for response variable.
A p-value less than a 5% alpha level means that there is greater than 95% chance that the results are not random, thus enhancing the significance of the results. The p-values for the mathematical model and the width of straight blades, the width of curved blades and number of blades were 0.0003, 0.0359, 0.0092 and 0.0212, which indicated that the model and three selected factors were significant on CU. The p-values of three factors show that the order of factors affecting CU were the width of curved blades, the width of straight blades and number of blades.
3.3. Optimization and Validation
Design variables: The width of straight blades, the width of curved blades and number of blades. There were three design variables in the optimization model which was a nonlinear mathematical programming problem.
Objective function: The calculated CU value from Equation (2) within the constraint condition is maximum. The function of programming solution in Microsoft Excel was adopted in this research to calculate the maximum CU value based on Equation (2).
Constraint condition: The value ranges of different design variables were: 3 ≤ h1 ≤ 5, 6 ≤ h2 ≤ 8, 3 ≤ s ≤ 5.
Table 5 presents a comparison of optimized results and initial values. It can be observed that CU was greatly improved after the structural optimization for the drive spoon blades, increased to 83% from 73%, which indicated that the optimized method in this research was feasible. The width of curved blades, the width of straight blades and the number of blades after optimization were 6 mm, 4 mm and 3, respectively.
Table 5.
Comparison of the values of design variables and performance before and after optimization.
A confirmation test was used to validate the correctness of the optimized structure values and the predicted CU. A new drive spoon was manufactured according to the optimization values. The experimental CU was 88% with the operating pressure of 500 kPa, and slightly higher than the predicted CU. After optimization, the CU value was increased by 21% compared to before optimization. The irrigation system with high water distribution uniformity is more profitable and efficient in the yield improvement, and that can also be scheduled to achieve water conservation as well as environmental protection [28,29].
3.4. Comparison of Hydraulic Performance before and after Optimization
Figure 6 presents the comparison of hydraulic performance before and after optimization. Before optimization, the application rates of sprinkler irrigation at the outer range dropped rapidly under low-pressure conditions. This means that the water distribution patterns before optimization were not good for combined application. After optimization, the application rates within 1 to 5 m were improved and increased from 10% to 15% with an average of 10.7% under different operating pressures. On the other hand, the maximum application rates decreased from 9.3, 9.3, 9.4 and 8.4 mm·h−1 to 8.5, 8.4, 8.5 and 7.9 mm·h−1 with operating pressures of 300, 400, 500 and 600 kPa, respectively. Li et al. [30] indicated that the triangular shape of the water distribution curve was beneficial to reduce the peak water application rate. It can be observed by the shapes at the end of the water distribution curves that the sprinkler is more suitable for combining application after optimization.
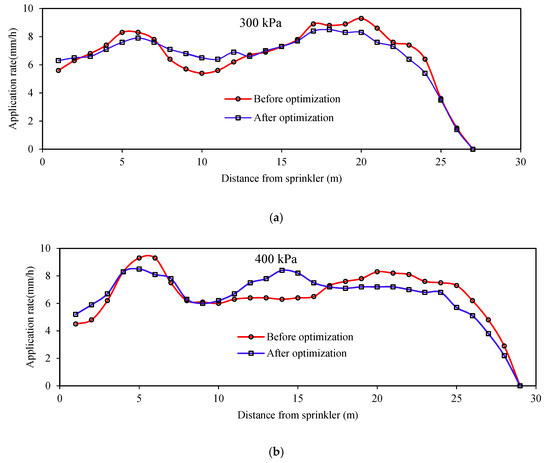
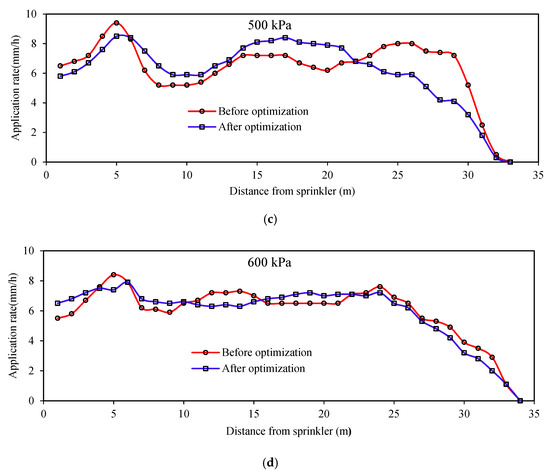
Figure 6.
Water distribution comparison diagram before and after optimization: (a) 300 kPa; (b) 400 kPa; (c) 500 kPa; (d) 600 kPa.
Figure 7 compares the spatial water distribution before and after optimization with square layout, with 1.41 times radius of throw at different operating pressures. The figure shows that after the optimization of the blades’ structure, the water distribution uniformity in the overlap area improved, especially under low-pressure conditions. The improvement was lower under high-pressure conditions because the water distribution already had a good uniformity. Ge et al. [9] indicated that the maximum distribution uniformity coefficients of the vertical impact sprinkler can reach 80.5% under high-pressure conditions, and this was consistent with the results of this study. The maximum application rates in the overlap area were decreased from 18, 16, 16 and 15 mm·h−1 to 16, 14, 14 and 12 mm·h−1 with operating pressures of 300, 400, 500 and 600 kPa, respectively. This is effective for reducing the risk of disrupting crops [31]. On the other hand, King [32] developed a soil-independent, quantitative potential runoff index based on application rates to facilitate selection of sprinklers for irrigation systems, and indicated that low sprinkler application rates facilitated soil infiltration and reduced the risk of surface runoff. Al-Kayssi and Mustafa [33] also indicated that the soil infiltration rate was significantly decreased with increasing sprinkler application rate. Hence, the vertical impact sprinkler after optimizing the drive spoon blades was more conducive to the application to deal with different soil and crops.
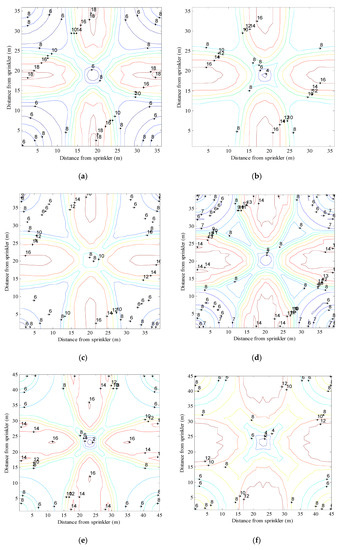
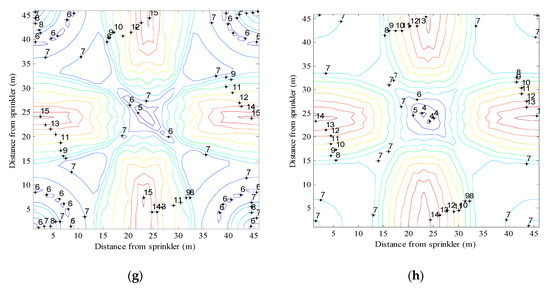
Figure 7.
Comparison of spatial water distribution (mm·h−1) before and after optimization: (a) Before optimization with 300 kPa; (b) After optimization with 300 kPa; (c) Before optimization with 400 kPa; (d) After optimization with 400 kPa; (e) Before optimization with 500 kPa; (f) After optimization with 500 kPa; (g) Before optimization with 600 kPa; (h) After optimization with 600 kPa.
4. Conclusions
This research presents the influence of three key structural sizes (the width of straight blades, the width of curved blades and number of blades) on hydraulic performance for sprinklers by using the design of experiment (DOE) method. From the results of this study, the following conclusions can be drawn:
The CU values first increased and then decreased slightly. The CU values increased and then decreased with the increase of the width of curved blades. The CU values decreased rapidly when the number of blades was less than 3 mm or greater than 6mm and the CU values had small variation when the number of blades increased from three to five.
The relationship between CU values and the width of straight blades, the width of curved blades and the number of blades was established. The p-values for three design variables were 0.0359, 0.0092, 0.0212, and all of the selected factors were significant on CU. The optimal values for the width of straight blades, the width of curved blades and number of blades were 6 mm, 4 mm, and 3, respectively. CU was greatly improved after the optimization of structure for the blades on the drive spoon, increasing to 87.96% from 73.12%.
After optimization, the maximum application rates decreased from 9.3, 9.3, 9.4 and 8.4 mm·h−1 to 8.5, 8.4, 8.5 and 7.9 mm·h−1, respectively. The maximum application rates in the overlap area were decreased from 18, 16, 16 and 15 mm·h−1 to 16, 14, 14 and 12 mm·h−1, and this is effective for reducing the risk of disrupting crops and surface runoff.
Author Contributions
P.T. conceived and structured the testing system. H.L. performed literature search, helped in experiments and analyzed the test data. P.T. and C.C. wrote the paper and approved the submitted version of the manuscript. All authors have read and agreed to the published version of the manuscript.
Funding
This work was supported by the National Natural Science Foundation of China, grant number 51939005, and the Natural Science Research Project of Jiangsu Higher Education Institutions, grant number 19KJB470014.
Acknowledgments
A huge thanks is due to the editor and reviewers for their valuable comments to improve the quality of this paper.
Conflicts of Interest
The authors declare no conflict of interest.
References
- Li, Y.B.; Liu, J.P. Prospects for development of water saving irrigation equipment and technology in China. J. Drain. Irrig. Mach. Eng. 2020, 38, 738–742. [Google Scholar]
- Zhang, L.; Zhou, W.; Li, D.X. Research progress in irrigation mode selection of high-efficiency water-saving agriculture. J. Drain. Irrig. Mach. Eng. 2019, 37, 447–453. [Google Scholar]
- Li, H.; Issaka, Z.; Jiang, Y.; Tang, P.; Chen, C. Overview of emerging technologies in sprinkler irrigation to optimize crop production. Int. J. Agric. Biol. Eng. 2019, 12, 1–9. [Google Scholar] [CrossRef]
- O’Shaughnessy, S.A.; Evett, S.R.; Colaizzi, P.D.; Andrade, M.A.; Marek, T.H.; Heeren, D.M.; Lamm, F.R.; LaRue, J.L. Identifying advantages and disadvantages of variable rate irrigation: An updated review. Appl. Eng. Agric. 2019, 35, 837–852. [Google Scholar] [CrossRef]
- Zhu, Z.R.; Fan, Y.S.; Duan, F.Y.; Chen, Z. Effects of sprinkler irrigation and fertilization on water dynamic and yield of spring wheat. J. Drain. Irrig. Mach. Eng. 2019, 37, 174–178. [Google Scholar]
- Robles, O.; Playán, E.; Cavero, J.; Zapata, N. Assessing low-pressure solid-set sprinkler irrigation in maize. Agric. Water Manag. 2017, 191, 37–49. [Google Scholar] [CrossRef]
- Yan, H.; Hui, X.; Li, M.; Xu, Y. Development in sprinkler irrigation technology in China. Irrig. Drain. 2020, 1–13. [Google Scholar] [CrossRef]
- Darko, R.O.; Yuan, S.Q.; Liu, J.P.; Yan, H.F.; Zhu, X.Y. Overview of advances in improving uniformity and water use efficiency of sprinkler irrigation. Int. J. Agric. Biolog. Eng. 2017, 10, 1–15. [Google Scholar]
- Ge, M.S.; Wu, P.T.; Zhu, D.L.; Zhang, L. Comparisons of spray characteristics between vertical impact and turbine drive sprinklers—A case study of the 50PYC and HY50 large volume impact-type sprinklers. Agric. Water Manag. 2020, 228, 105847. [Google Scholar] [CrossRef]
- Ge, M.S.; Wu, P.T.; Zhu, D.L.; Zhang, L. Optimized configuration of a hose reel traveling irrigator. Agric. Water Manag. 2020, 240, 106302. [Google Scholar] [CrossRef]
- Tang, P.; Li, H.; Issaka, Z.; Chen, C. Impact forces on the drive spoon of a large cannon irrigation sprinkler: Simple theory, CFD numerical simulation and validation. Biosyst. Eng. 2017, 159, 1–9. [Google Scholar] [CrossRef]
- Ouazaa, S.; Burguete, J.; Zapata, N. Solid-set sprinklers irrigation of field boundaries: Experiments and modeling. Irrig. Sci. 2016, 34, 85–103. [Google Scholar] [CrossRef][Green Version]
- Sheikhesmaeili, O.; Montero, J.; Laserna, S. Analysis of water application with semi-portable big size sprinkler irrigation systems in semi-arid areas. Agric. Water Manag. 2016, 163, 275–284. [Google Scholar] [CrossRef]
- Hu, G.; Zhu, X.Y.; Yuan, S.Q.; Zhang, L.G.; Li, Y.F. Comparison of ranges of fluidic sprinkler predicted with BP and RBF neural network models. J. Drain. Irrig. Mach. Eng. 2019, 37, 263–269. [Google Scholar]
- Zapata, N.; Robles, O.; Playán, E.; Paniagua, P.; Romano, C.; Salvador, B.; Montoya, F. Low-pressure sprinkler irrigation in maize: Differences in water distribution above and below the crop canopy. Agric. Water Manag. 2018, 203, 353–365. [Google Scholar] [CrossRef]
- Li, H.; Tang, P.; Liu, Z.C.; Tu, Q. Calculation of sprinkler drive vane positional parameters and its influence on sprinkler performance. Trans. Chin. Soc. Agric. Eng. 2014, 30, 109–116. [Google Scholar]
- Tang, P.; Li, H.; Chen, C.; Zou, C.H.; Jiang, Y. Arm movement law and hydraulic performance of large volume impact sprinkler with counterweight. Trans. Chin. Soc. Agric. Eng. 2015, 31, 37–44. [Google Scholar]
- Ge, M.S.; Wu, P.T.; Zhu, D.L.; Zhang, L. Application of different curve interpolation and fitting methods in water distribution calculation of mobile sprinkler machine. Biosyst. Eng. 2018, 174, 316–328. [Google Scholar] [CrossRef]
- Issaka, Z.; Li, H.; Jiang, Y.; Tang, P.; Chen, C. Hydraulic performance characteristics of impact sprinkler with a fixed water dispersion device. Int. J. Agric. Biolog. Eng. 2018, 11, 104–112. [Google Scholar] [CrossRef]
- Li, H.; Issaka, Z.; Jiang, Y.; Tang, P.; Chen, C. Influence of a fixed water dispersion device on jet dispersion and range from an impact sprinkler. Irrig. Drain. 2019, 68, 669–678. [Google Scholar] [CrossRef]
- Mohammed, I.S.; Na, R.; Kushima, K.; Shimizu, N. Investigating the effect of processing parameters on the products of hydrothermal carbonization of corn stover. Sustainability 2020, 12, 5100. [Google Scholar] [CrossRef]
- Ghaleb, A.A.S.; Kutty, S.R.M.; Ho, Y.C.; Jagaba, A.H.; Noor, A.; Al-Sabaeei, A.M.; Almahbashi, N.M.Y. Response surface methodology to optimize methane production from mesophilic anaerobic co-digestion of oily-biological sludge and sugarcane bagasse. Sustainability 2020, 12, 2116. [Google Scholar] [CrossRef]
- Zhu, X.Y.; Yuan, S.Q.; Jiang, J.Y.; Liu, J.P.; Liu, X.F. Comparison of fluidic and impact sprinklers based on hydraulic performance. Irrig. Sci. 2015, 33, 367–374. [Google Scholar] [CrossRef]
- Liu, J.P.; Yuan, S.Q.; Darko, R.O. Characteristics of water and droplet size distribution from fluidic sprinklers. Irrig. Drain. 2016, 65, 522–529. [Google Scholar] [CrossRef]
- Wang, X.; Li, G.; Guo, C.C.; Han, W.T.; Yao, X.M.; Sun, Y. Optimization of impact sprinkler sub-nozzle parameters of elevation angle and position. Trans. Chin. Soc. Agric. Eng. 2015, 31, 89–95. [Google Scholar]
- Yuan, S.Q.; Darko, R.O.; Zhu, X.Y.; Liu, J.P.; Tian, K. Optimization of movable irrigation system and performance assessment of distribution uniformity under varying conditions. Int. J. Agric. Biol. Eng. 2017, 10, 72–79. [Google Scholar]
- Xu, Z.D.; Xiang, Q.J.; Waqar, A.Q.; Liu, J. Field combination experiment on impact sprinklers with aerating jet at low working pressure. J. Drain. Irrig. Mach. Eng. 2018, 36, 840–844. [Google Scholar]
- Barragan, J.; Cots, L.; Monserrat, J.; Lopez, R.; Wu, I.P. Water distribution uniformity and scheduling in micro-irrigation systems for water saving and environmental protection. Biosyst. Eng. 2010, 107, 202–211. [Google Scholar] [CrossRef]
- Nascimento, A.K.; Schwartz, R.C.; Lima, F.A.; López-Mata, E.; Domínguez, A.; Izquiel, A.; Tarjuelo, J.M.; Martínez-Romeroa, A. Effects of irrigation uniformity on yield response and production economics of maize in a semiarid zone. Agric. Water Manag. 2019, 211, 178–189. [Google Scholar] [CrossRef]
- Li, H.; Jiang, Y.; Xu, M.; Li, Y.M.; Chen, C. Effect on hydraulic performance of low-pressure sprinkler by an intermittent water dispersion device. Trans. ASABE 2016, 59, 521–532. [Google Scholar]
- Lamm, F.R.; Bordovsky, J.P.; Howell, S.T.A. A review of in-canopy and near-canopy sprinkler irrigation concepts. Trans. ASABE 2019, 62, 1355–1364. [Google Scholar] [CrossRef]
- King, B.A. Moving spray-plate center-pivot sprinkler rating index for assessing runoff potential. Trans. ASABE 2016, 59, 225–237. [Google Scholar]
- Al-Kayssi, A.W.; Mustafa, S.H. Modeling gypsifereous soil infiltration rate under different sprinkler application rates and successive irrigation events. Agric. Water Manag. 2016, 163, 66–74. [Google Scholar] [CrossRef]


© 2020 by the authors. Licensee MDPI, Basel, Switzerland. This article is an open access article distributed under the terms and conditions of the Creative Commons Attribution (CC BY) license (http://creativecommons.org/licenses/by/4.0/).