1. Introduction
Tourism, as a field of economic activity, has registered one of the biggest and fastest growth rates in recent years. According to the World Tourism Organization (UNWTO), the number of arrivals of international tourism will reach 1.8 billion in 2030 if a yearly growth of 3.3% is recorded [
1,
2]. International tourism represents a fundamental component of international specialisation and is a significant drive of development, prosperity and welfare, as shown by the statistical data provided by the reports of the European Commission (EC), of UNWTO or those of the World Council of Tourism and Travels. At a global level, tourism has brought a significant contribution to economic growth and there is a close correlation between the economically developed countries and those with a developed touristic sector [
3,
4,
5,
6,
7,
8,
9,
10]. Tourism contributes to economic growth and poverty reduction, especially in the case of less developed countries but not automatically [
11]. Therefore, in 2019, the direct, indirect, and induced impact of travels and tourism has shown that tourism has contributed with 8.9 billion USD (respectively 10.3% of the global GDP) to the global GDP (Gross Domestic Product), with 330 million jobs of those created at a global level. Worldwide destinations have registered a growth of 3.8% in 2019 in comparison with 2018, being the 10th consecutive year of sustained growth since 2009 [
12]. The fact that international tourism has grown beyond any expectations confirms once more that travels are now part of the consumption models for an increasing number of persons, both in emerging economies and in the advanced ones. This also underlines the need to place tourism as one of the main pillars of socio-economic development, being a major contributor to economic growth, exports, and job creation [
1]. In a global, still unequal economic environment, positive outcomes have been registered in all regions and sub-regions while the growth of international touristic arrivals has exceeded the growth of world economy in 2019 in comparison to 2018 (+3.5% against +2.5%) [
3,
4].
The positive perspectives of international tourism, as shown in the World Tourism Barometer, 2020 [
12] report, can be influenced by a deterioration of the economic scenario (the current trade and geopolitical tensions in Latin America, Asia and Pacific, and the Middle East), as well as by major events, such as the Brexit impact on Europe (from March 2019) which affected countries in the Euro-zone as well as the access towards destinations outside the Eurozone. Despite all these, Europe is still the biggest area in the world in terms of the expenses made by international visitors (619 billion USD), representing in 2019, 37% of the total global international expenses. The WTTC (World Travel & Tourism Council) report [
3] shows that the European global economy has increased in 2019 as opposed to 2018 by 1.3%, while the tourism sector has recorded a 2.4% increase in 2019 than in 2018.
Taking into account that tourism can determine economic growth both for the developed countries and for the developing countries, for Central and East European countries (CEE), the development of tourism may have positive implications on economic growth and at the same time, it can diversify the economic activities. Tourism development can determine economic growth by means of the increase in the number of persons working in tourism, the stimulation of investments in infrastructure, technology and human capital, and the creation and development of local companies which should support the tourism activities. International tourism can also determine the reduction of the payment balance of a country because it can be considered a form of export. By promoting ecological tourism, the environment and wildlife protection can be improved. Since sustainable development means the way in which the resources are used in order to satisfy the human needs and protect the environment so that future generations are not affected, the topic is all the more important as the goals of sustainability focus on economic growth. If during the world conference from Rio de Janeiro in 1992, the participants reached the conclusion that sustainable development must represent a balance among economic growth, environmental protection and use of alternative resources, in 2015 an agreement among 196 states was concluded regarding the implementation of 17 objectives mentioned in the Agenda for Sustainable Development by 2030. The data provided by the World Tourism Organization and the Organization of American States [
13] show that tourism is included in three of the sustainable development objectives as follows: objective 8 focuses on economic development and jobs, objective 12 aims for production and consumption sustainability, and objective 14 refers to the life below water. In our paper, we have tackled sustainability from the perspective of economic growth by means of tourism. As a consequence, the awareness and the opportunities by means of which tourism development may influence economic growth determined the formulation and testing of the hypothesis according to which tourism determines economic growth, which implies that a long-term factor of economic growth is tourism. The identification of the existence of this hypothesis is important for any country and especially for the decision-making factors who can create economic policies to allocate resources for the development of tourism while tourism development will in its turn determine economic growth.
The goal of the current research consists in the performance of an analysis regarding the evolution in time of the relationship between tourism growth and economic growth on a sample of ten countries from CEE: Bulgaria, Czech Republic, Estonia, Hungary, Latvia, Lithuania, Poland, Romania, Slovenia, and Slovakia. Since previous empirical studies revealed four potential existing situations, these will represent the hypotheses of our study, as follows: international tourism growth leads to economic growth; economic growth leads to international tourism growth; the existence of a bidirectional relationship between international tourism and economic growth (bidirectional causality); the lack of a causality relationship between the two phenomena under analysis.
The performance of an empirical study comes to cover the gap of a detailed and comparative empirical research regarding the relationship between international tourism growth and economic growth. Moreover, the approach of this analysis is conducted in the context of sustainability, taking into account that one of the sustainability goals aims to grow the economy and tourism growth also focuses on environmental protection. Therefore, this paper will fill in the missing gap in the literature. The methodology used allows the performance of subsequent comparisons between countries, which is an additional element in comparison with the previous methodologies that were non-compatible with each other. The study conclusions will allow the substantiation of the decisions made by the policy-makers concerning the phenomenon promoting development, either the international tourism or the economy overall.
There is a very scarce amount of research studies on this topic, conducted on variables recorded on a monthly basis for CEE countries, due to lack of data. The current study comes in to complete this gap, adding to the existing literature minute results about the evolution of the causality relationship between international tourism growth and economic growth. Thus, the results obtained confirm for the CEE countries included in the analysis, that the causality relationship between international tourism growth and economic growth changes over time both in terms of the relationship intensity and its direction. There are time samples where international tourism leads to economic growth and economic growth leads to international tourism, which confirms the existence of the bidimensional causality. The results also confirm the type of causality correlated with the business cycles.
In order to attain its goal, the paper is structured as follows: analysis of the literature and development of the research hypotheses, importance and economic impact of tourism in CEE countries, research methodology, data used, empirical results, discussions, conclusions, limits of research, and future research directions.
3. The Importance and the Economic Impact of Tourism in the CEE Countries
As it was previously stated, tourism can determine economic growth both for developed and developing countries, while for the CEE countries, tourism growth can have positive implications on economic growth. Tourism and travels in the CEE countries were characterised in the period 2017-2019 by fluctuating values for the contribution of travel and tourism to GDP (see
Figure 1).
Thus, in
Figure 1, it can be noticed that for Lithuania, Poland, and Romania, increases in the contribution of travel and tourism to GDP were registered in 2019 in comparison with 2017, Hungary registers a stagnation, while for Bulgaria, Czech Republic, Estonia, Latvia, Slovenia, and Slovakia there were decreases.
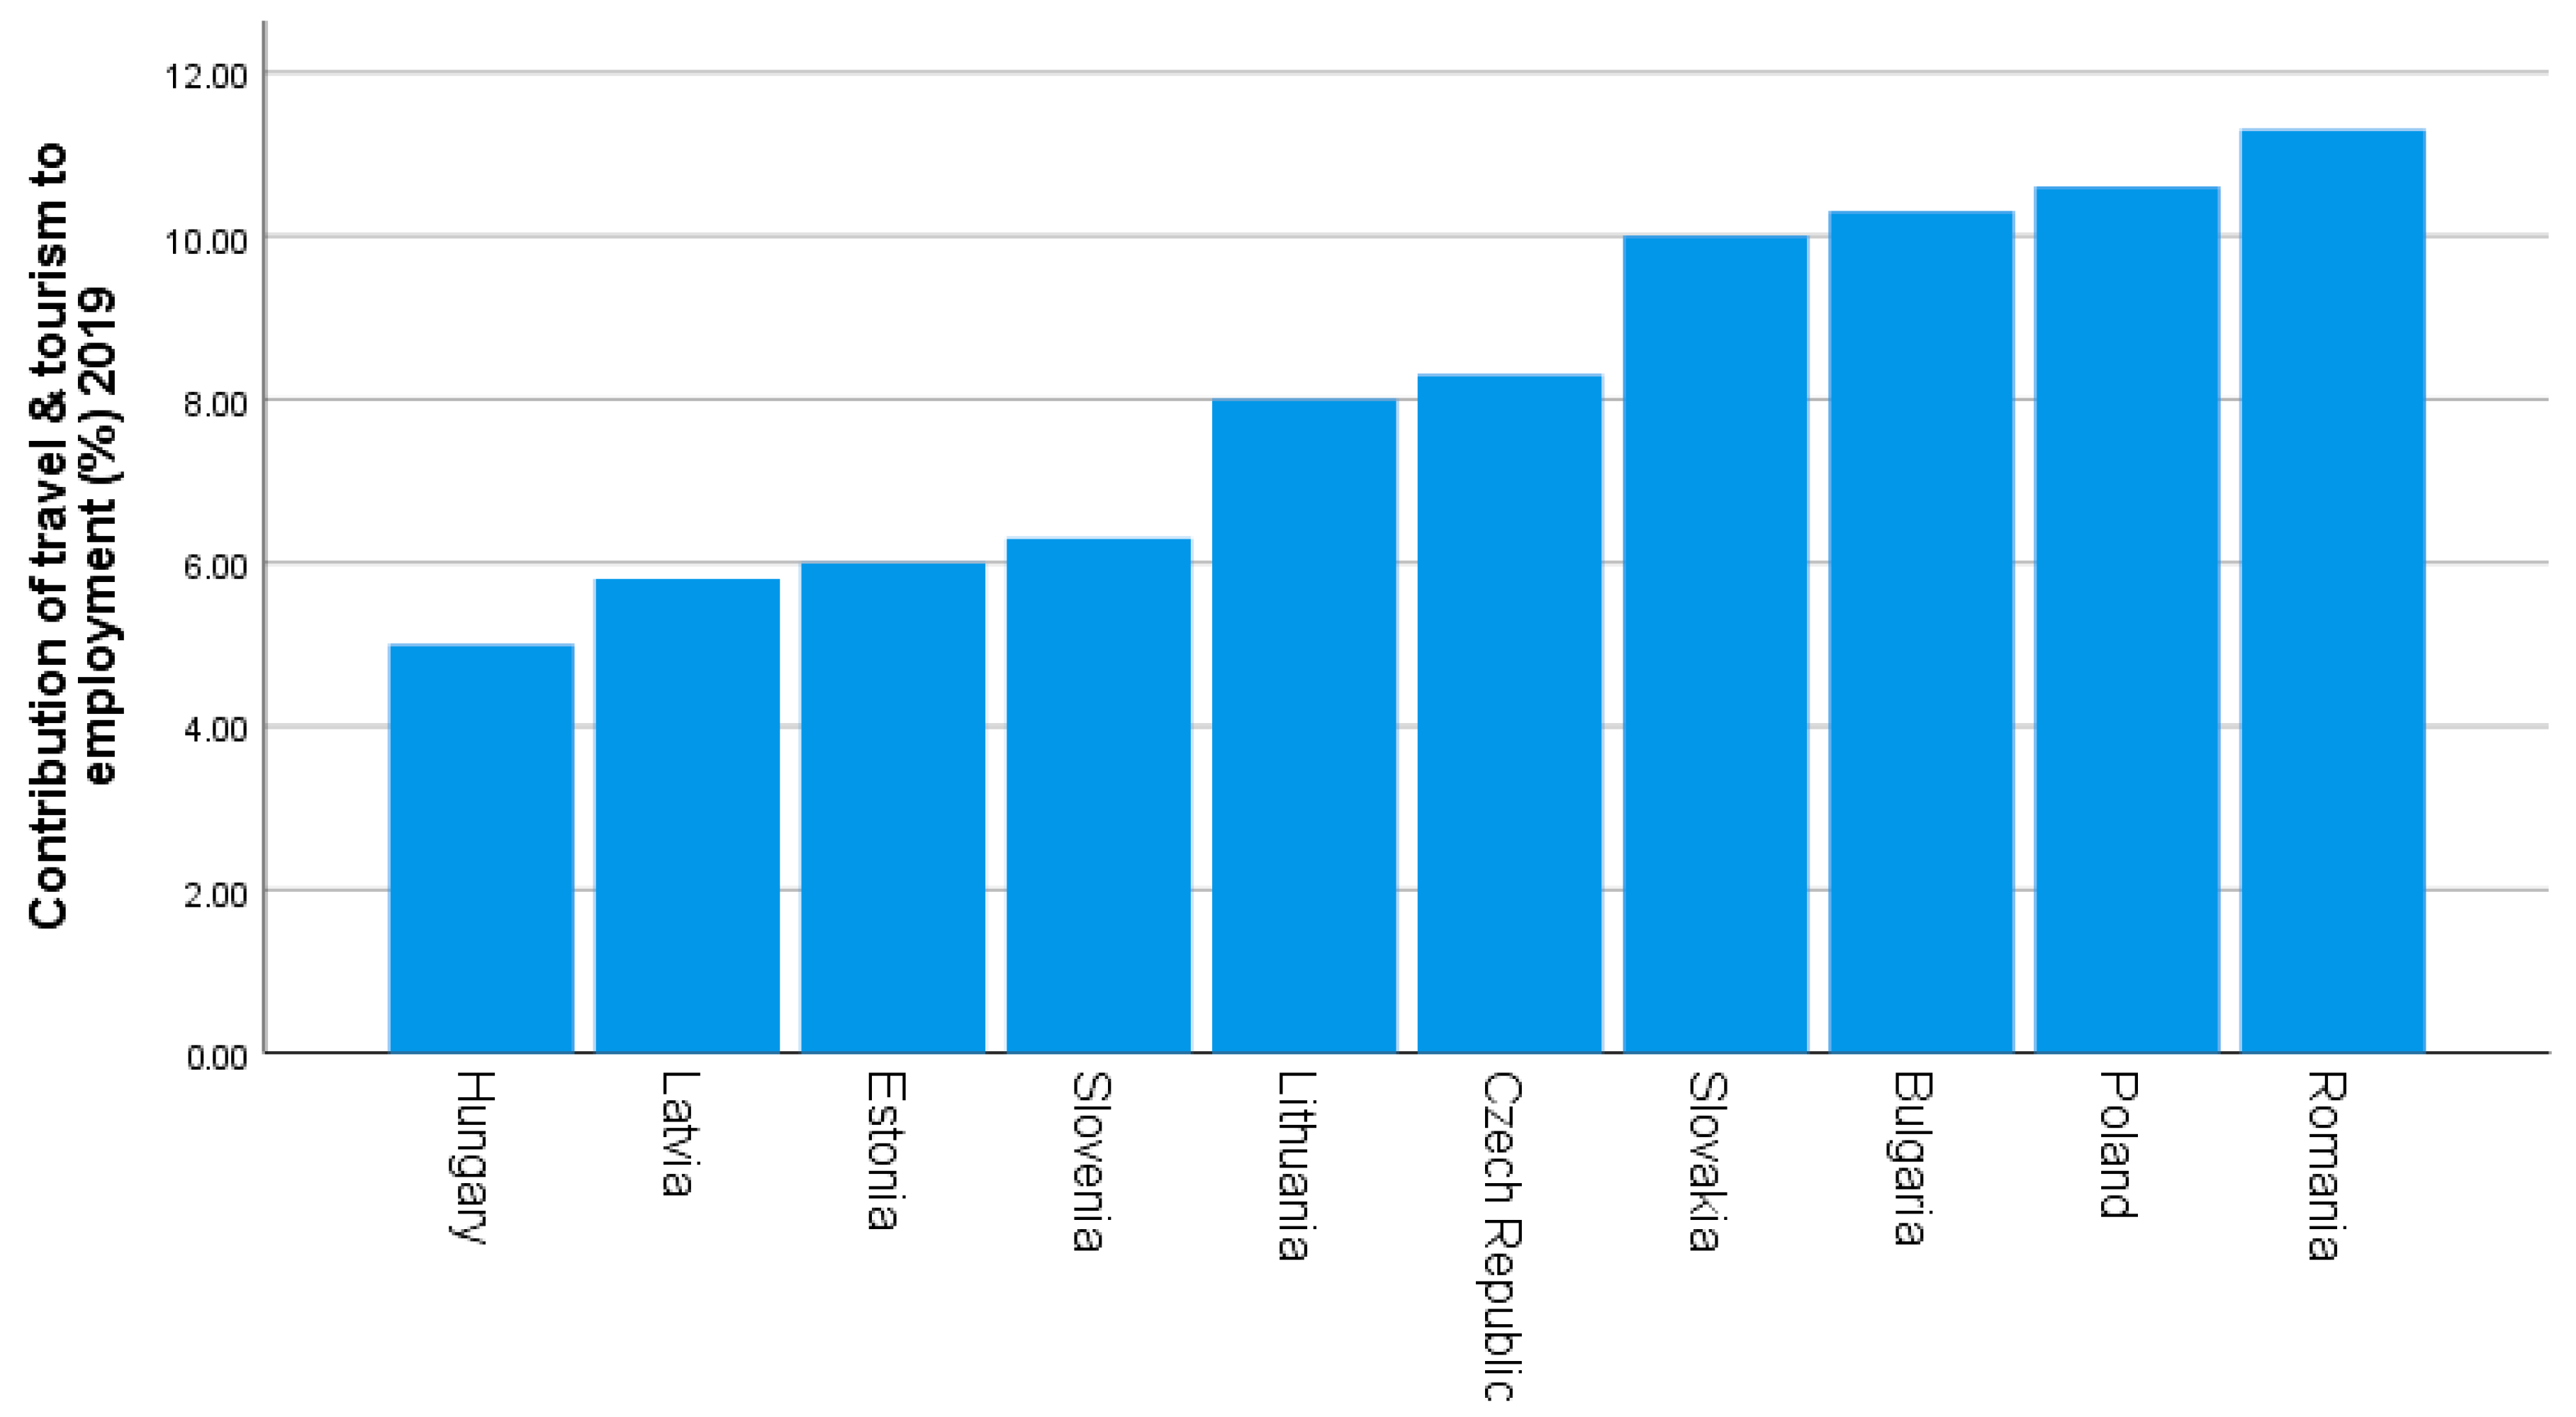
According to
Figure 2, the greatest contribution of travel and tourism to employment (%) is registered in Romania, being followed by Poland, Bulgaria and Slovakia while the smallest contribution travel and tourism to employment (%) is found in Hungary.
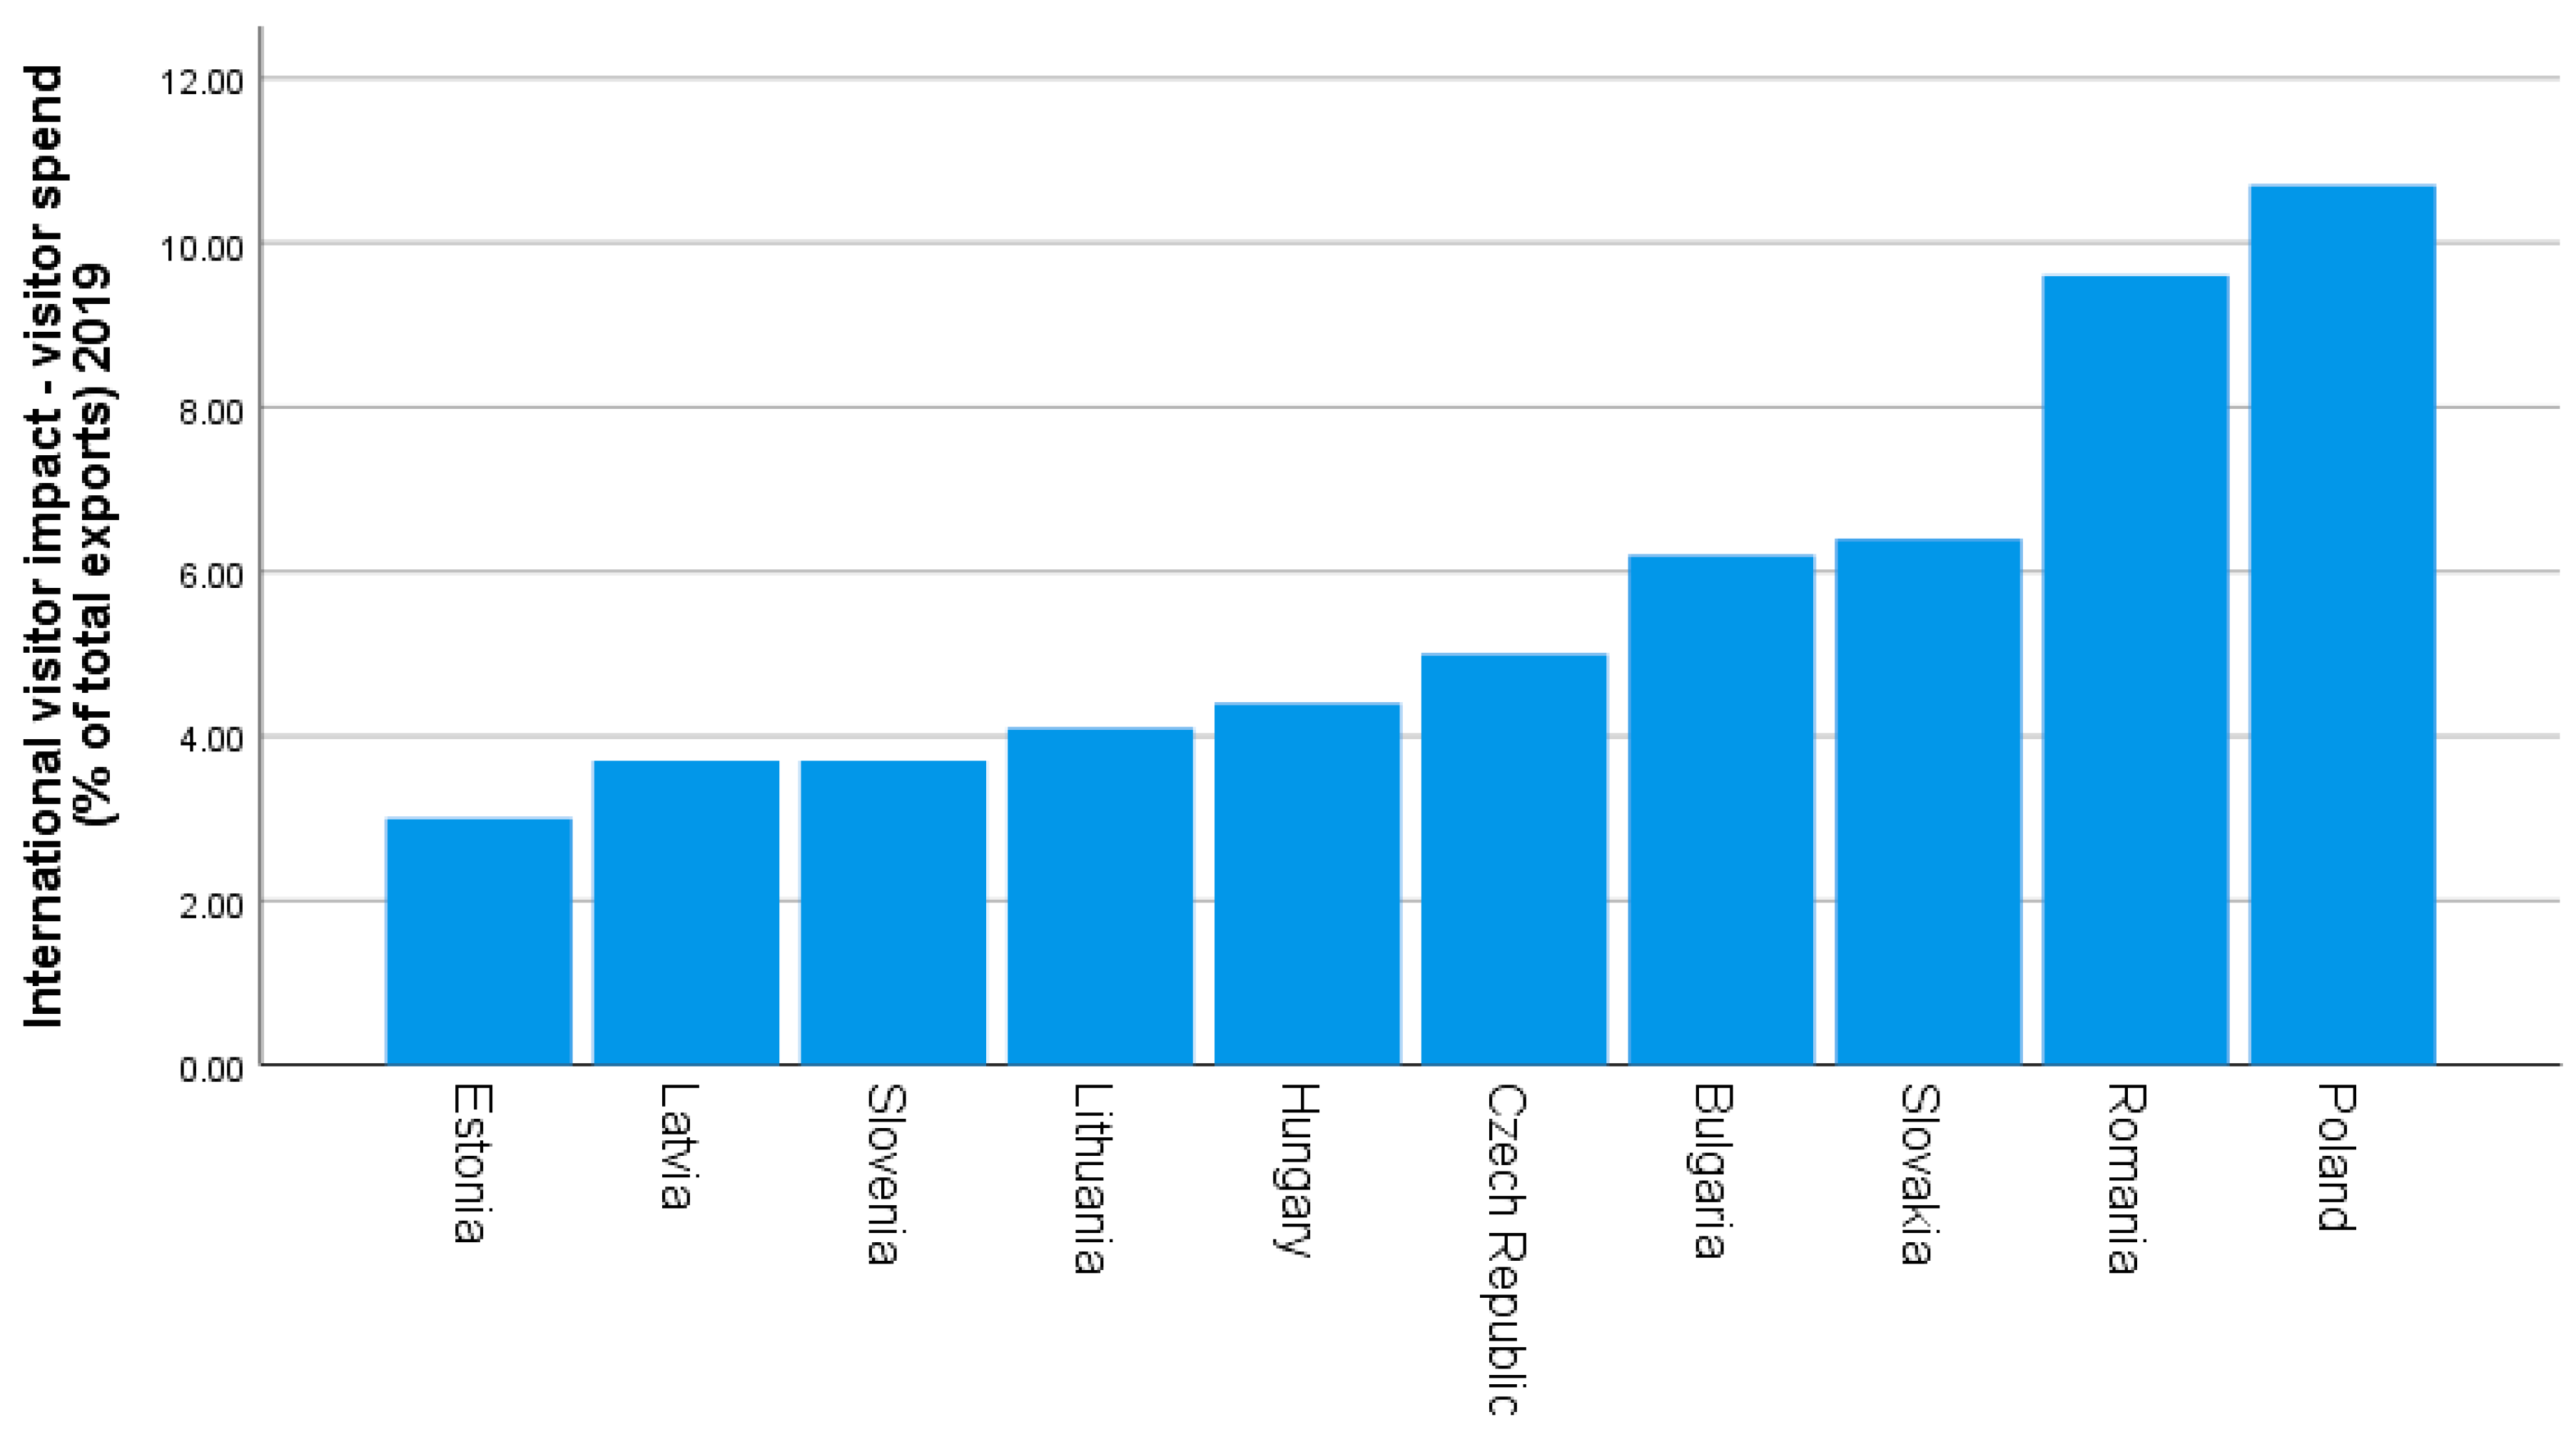
Poland and Romania also occupy top places when it comes to the weight of visitor spend within total exports according to
Figure 3.
In Bulgaria, tourism is the service sector with the highest contribution to economic growth. In tourism, there are 65.90% of the employees from the service activities. Bulgaria has developed prevalently the tradition of relatively cheap international tourism, especially for the seaside destinations in summer, as well as for the mountain destinations both in summer and winter [
73]. According to the data provided by Lonely Planet [
74], in 2011, Bulgaria was placed among the first 10 touristic destinations preferred by tourists at a global level.
Czech Republic is a competitive and popular touristic destination within the CEE and the economy of this country receives a substantial income from tourism [
75]. Prague is the 5th most visited city in Europe, after London, Paris, Istanbul, and Rome [
76].
The impact of tourism industries on the economy of the Czech Republic from employment according to the data provided by the Czech Statistical Office [
77] is characterised by increases, such as the number of jobs in tourism (to 237,093 jobs in tourism of the 5,320,015 number of jobs in the national economy in 2018 in comparison with 235,691 jobs in tourism of the 5250485 number of jobs in the national economy in 2017), the number of people employed in tourism (to 240,591 employees in tourism out of the 5,418,117 number of people employed in the national economy in 2018 in comparison with 238,843 employees in tourism out of the 5,346,092 number of people hired in the national economy in 2017). In the Annual report on tourism 2018-Czech Republic [
78], the Chinese tourists represent a very important customer base for tourism in the Czech Republic. In 2018, there was a significant increase in their number—there were almost 620 thousand tourists from the Popular Republic of China who stayed in the accommodation units, representing 5.8% of the total of foreign visitors. The Chinese tourists were the 4th most frequent nationality of the total number of foreign tourists hosted in the Czech Republic in 2018. Even if the number of Chinese tourists in the Czech Republic is still increasing, in 2018, the average nights spent in the Czech Republic by the Chinese tourists have been only 2.5 nights.
Statistics Estonia [
79] report the following statistical data about the touristic activity of this country as follows: 3.8 million tourists (59% foreign tourists and 41% domestic tourists) were hosted in 2019, in touristic establishments from Estonia, an increase of 1.5 million tourists compared to 2018, and the number of nights spent registering 7 million nights in 2019. The foreign tourists who travelled to Estonia in 2019 had as the main reason for the trip being holidays (71%), and business (23%), with the other 6% claiming other reasons to visit. In comparison with 2018, both the number of foreign tourists and the nights spent increased by 5%.
The statistical data provided by the Hungarian Central Statistical Office [
80] show that in Hungary the touristic activity is also characterised by increases for international trips, as follows: number of inbound trips (from 31,565 thousands in 2009 to 44,460 thousands in 2019); expenditures of visitors (from 353,234 million HUF in 2009 to 601,746 million HUF in 2019); expenditures per day per person (from 11.2 thousand HUF in 2009 to 13.5 thousand HUF in 2019) [
80].
The trends in the touristic activity in Hungary, synthesised by Todinca and Ardelean [
81] for the period 2015-2025, show an increase in the direct contribution of tourism to the GDP of 3.9%/year, equal to the global average and over the European average (2.8%/year) and in the number of jobs in the touristic sector by 2.5%/year, over the global average (2%/year) and the European one (1.6%/year).
Latvia has become quite the touristic destination, which is testified by the constant increase in the number of its visitors [
81]. Latvia was the destination with the fastest growth for the Russian tourists, with arrivals in 2017 of 13.6%, being followed by the demand for German tourists (11.7%) and by the demand for Lithuanian tourists (10.2%). The demand for Indian tourists ranks Latvia on the 3rd place while the demand for Japanese tourists puts Latvia on the last spot in the 27-country ranking analysed in Europe [
82].
The State Department of Tourism within the Ministry of Economy improved the competitive advantage of Lithuania within the tourism industry by encouraging the growth of external tourism and domestic tourism [
83]. The statistical data provided by Tourism Statistics in Lithuania [
84] highlight that in Lithuania, the touristic activity is characterised by increases in the number of foreign tourists arrived in Lithuania in 2019 in comparison with 2018 is of 11% (from 1,744,733 foreign tourists in 2018 to 1,936,132 foreign tourists in 2019).
In Poland, the well-developed touristic industry and tourism infrastructure ensure the easiness of communication, booking, and transportation towards this touristic destination [
84].
According to the statistical data provided by the Polish Tourism Organisation [
84], one can notice in Poland constant growth in the number of tourists arrived. Thus, in 2017, Poland was visited by over 18 million visitors, in 2018 the number of visitors increased to 119.6 million and in 2019 there were over 20 million arrivals. For Poland, the tourism industry represents according to the statistical data provided by Eurostat [
85] an important drive for the economy and for the labour market. These increases were due to the fact that the Polish Tourism Organisation is in charge with the merchandising and promotion of Poland as a touristic destination, ensuring the development and functioning of the Polish touristic information system [
84].
According to the data provided by the National Bank of Romania, the Ministry of Public Finance, and the estimates of the Master Plan for the Development of National Tourism 2007–2026, the total contribution of tourism to GDP in Romania is estimated to grow by 6.9% until 2026 [
86]. Having as a feature the large consumption of live work, intelligence and creativity, tourism also drives and stimulates production from other sectors. Alongside all these, tourism is also a way (sometimes the only one) to capitalize on a superior level all categories of resources and especially the natural ones: the beauty of landscapes, the curative properties of spring and thermal waters, climate conditions. Tourism is also able to ensure the welfare of certain underprivileged areas, being a remedy for non-industrialised regions as well as a mitigation lever for inter-regional imbalances.
The data included in the Annual Report-Tourism in numbers for 2019 by Slovenian Tourist Board [
87] show that in 2019 international tourist arrivals in Slovenia recorded increases of +6.3%, over the European average of +4% and the World’s average of +4%. By macro-destinations of Slovenia, the indicators of touristic activity for 2019 show that: in Alpine Slovenia, international tourist arrivals is of 2,214,854 tourists; in Thermal Pannonian Slovenia, international tourist arrivals is of 1,193,346 tourists; in Mediterranean and Karst Slovenia, international tourist arrivals is of 1,396,995 tourists; in Ljubljana and Central Slovenia, international tourist arrivals is of 1,424,378 tourists.
The impact in the economy and the quantitative and qualitative dimensions of the touristic market have placed Slovakia in 2016 on the 77th position out of 185 countries according to the aggregate volume of the tourism industry and on one of the last positions (place no. 146) in relative terms as for the total contribution of tourism to GDP. The forecasts for the period 2017–2027 place Slovakia only on the 135th position in terms of the tourism industry growth at a global level [
88]. According to the data provided by the Statistical Office of the Slovak Republic [
89], tourism and travels in Slovakia are characterised by increases, as follows: the number of visitors increased by 20.20% in December 2019 as opposed to December 2018 (to 434,478 visitors, with 72,991 more visitors than the previous period); the increase of domestic visitors (272,475 visitors) was more dynamic, with 24.4% more in December 2019 as opposed to December 2018, an increase of 53,434 visitors. During the same period, 162,003 foreigners visited Slovakia, which represented an increase of 13.7% (with 19,557 visitors). The data provided by the European Travel Commission [
82] show that Slovakia was the destination with the fastest demand growth for Indian tourists, with arrivals on the rise of 47.3% in compliance with the data from March 2019. This indicates that the Indian tourists do not only visit Slovakia in a much higher number in comparison with the month of March 2018 but also that in recent years there has been an increasing demand for Slovakia after it became very popular among all Indian tourist categories.
4. Methodology
Before the in-depth study of the relationship between international tourism and economic growth by means of the spillover index created by Diebold and Yilmaz in 2012 [
67], the existence of the Granger-causality [
90] was tested for each country in the sample. The variables which were used in testing the causality are growth rates of international tourist arrivals at tourist accommodation and growth rates for industrial production. Thus, the following equations were estimated:
where:
and
time series corresponding to the growth rates of international tourist arrivals at tourist accommodation and growth rates for industrial production;
and
parameters corresponding to the lags of the variables
and
that influence the variable
;
and
the parameters corresponding to the lags of the variables
and
that influence the variable
.
The choice of the lags’ size i and j was performed by selecting the equations for which minimal values of the Akaike and Schwarz information criteria were obtained. At the same time, the residual variables from the Equations (1) and (2) must meet the hypothesis of the lack of autocorrelation and homoscedasticity.
The results obtained should be interpreted as follows:
if in the Equation (1) there are only the statistically significant parameters , then the variable Granger causes the variable ;
when in the Equation (2) there are the statistically significant parameters the variable Granger causes the variable ;
when in the two equations there are both the parameters and the parameters which are statistically significant, there is a bidirectional Granger-causality relationship between the two variables and ;
when none of the parameters and are statistically significant, then the variables are independent one from the other.
Testing the significance of the parameters is conducted by calculating the F statistic of the Wald test. If the results obtained confirm the Granger-causality, it can be continued with the VAR estimation model.
In order to identify the inter-linkages between international tourism and economic growth, we used in this study the spillover index which was created by Diebold and Yilmaz [
66] and then developed by Diebold and Yilmaz [
67].
The advantages of the spillover index created are represented on one hand by the decomposition of the total spillover into the spillover from one variable and on the other hand by the spillover to a variable (which allows the determination of the recipient variable or of a variable which induces shocks), as well as the decomposition of the forecast error variance which is not influenced by the variable order (as it was estimated in the VAR model by means of the Cholesky–factor identification). This last advantage is very important, especially when studying the relationship between tourism and economic growth since at the beginning of the study it was not known which variable influences another variable, taking into account that there can be four distinct situations [
18].
The VAR model was estimated using the methodology proposed by Diebold and Yilmaz [
60] which can be represented by means of the model proposed by Equation (1), as follows:
In our case is a vector with two endogenous variables (N endogenous variables, in general), Ci is a 2 × 2 matrix of autoregressive coefficients (NxN matrix of autoregressive coefficients, in general), is a vector 2 × 1 of error terms (Nx1 vector of error terms, in general) which are assumed as not being serially correlated.
The total, direct and net spillover indices are determined based on the VAR model from Equation (3) through the general decomposition of the forecast error variance.
Diebold and Yilmaz [
67] calculated the total volatility spillover index using Equation (4), as follows:
where:
—is the
H-step-ahead forecast error variance decomposition [
90,
91] and it is rendered by Equation (5), where the conditions mentioned in Equation (6) are met:
Diebold and Yilmaz [
67] also determined the directional spillover indices which allow the quantification of as much volatility of a variable as possible when this is transmitted towards another variable/other variables and they decomposed the total spillover in spillover from one variable/some variables or to a variable/to some variables.
The directional volatility spillover received by the variable
i from other variables
j is quantified through the index from Equation (7), as follows:
while the measuring of directional volatility spillovers transmitted by the variable
i to other variables
j is calculated by using the index rendered in Equation (8), as follows:
When calculating the difference between the directional spillover indices presented in Equations (7) and (8) the net spillover is obtained as seen in the relationship proposed by Equation (9), as follows:
In what follows, we will use this methodological framework of the volatility spillover index proposed by Diebold and Yilmaz [
67], as well as by Koop et al. [
90] and Pesaran and Shin [
91], between economic growth and international tourism and vice versa in order to identify the interdependence type between the two phenomena. The study was conducted for each of the 10 CEE countries included in the sample.
5. Data
As it was previously stated, this study took into consideration 10 CEE countries, as follows: Bulgaria, Czech Republic, Estonia, Hungary, Latvia, Lithuania, Poland, Romania, Slovakia, and Slovenia. For the quantification of the tourism performance, the number of international tourists is a variable which had already been used in other previous studies focused on the relationship between tourism and economic growth [
92,
93,
94,
95,
96,
97]. For the quantification of economic growth, we used industrial production because, unlike the GDP which is recorded on a term basis at the most, this variable has a higher frequency with monthly recordings [
97,
98].
From the Eurostat database [
99], a European Statistical Office, international tourist arrivals at tourist accommodation establishments was extracted for the countries under study, with a monthly frequency between January 2000–October 2019. Not all countries analysed had available data for the period mentioned. Thus, according to
Appendix A,
Table A1, for international tourist arrivals at tourist accommodation in Slovenia and Hungary, there were data available starting with January 2001, Bulgaria, Czech Republic, and Romania have available data since January 2002, Estonia, Latvia, Poland, and Slovakia, have available data starting with January 2003, while the smallest sample was available for Slovakia, starting with the year 2004. In the database provided by Eurostat, the time series international tourist arrivals are not seasonally adjusted.
Since in the Eurostat database, Bulgaria does not have monthly data for 2004 regarding international tourist arrivals at tourist accommodation, even if it has values registered before this year, the series was completed for the missing year with data provided by the WTO—World Tourism Barometer reports [
100,
101,
102,
103]. The Eurostat database also offered seasonally adjusted time series for the industrial production index where there were available values for all countries and for all periods common with the time series for international tourist arrivals at tourist accommodation. The graphical representation of the variable international tourist arrivals at tourist accommodation for CEE countries is presented in
Appendix A,
Figure A1.
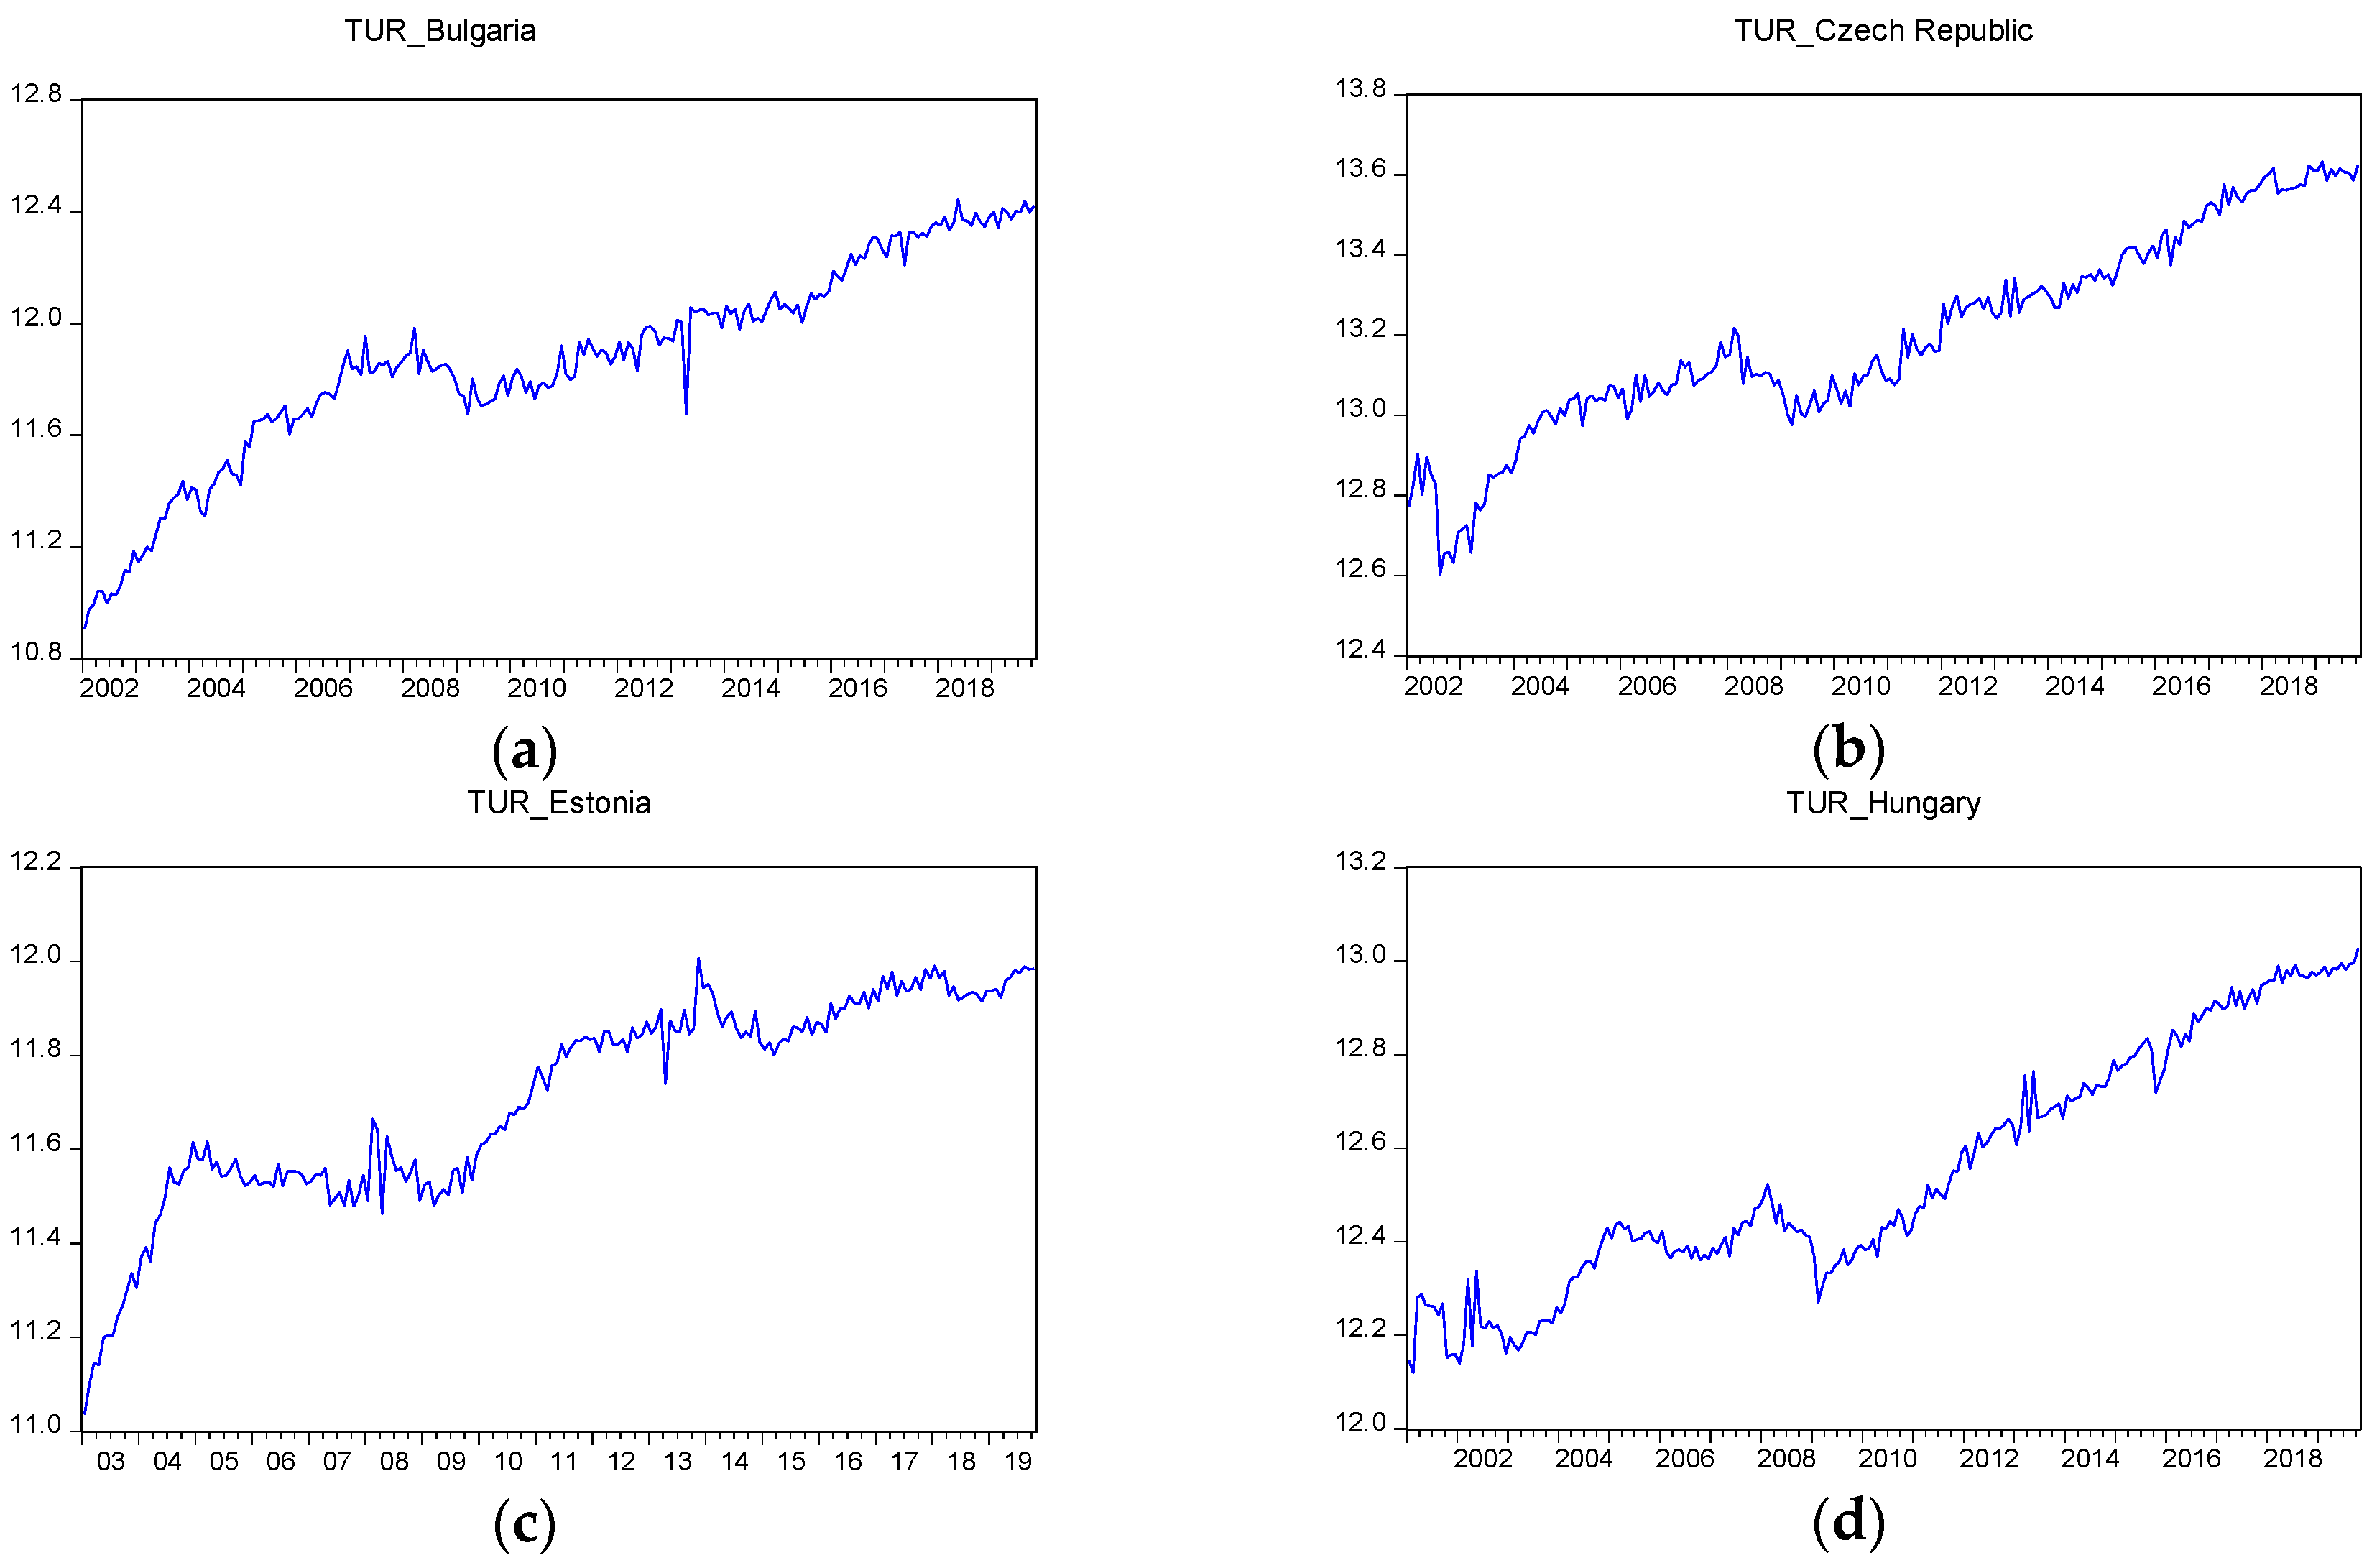
Since the time series international tourist arrivals for the countries considered in the analysis present trend, seasonal evolutions as well as increased variability in time, they were logarithmated for the reduction of variability [
104] and then seasonally adjusted by means of the method TRAMO/SEATS, as it is also recommended in the works of the authors Andrei T. et al. [
105] and Akar [
106]. The TRAMO/SEATS method (Time Series Regression with ARIMA noise, Missing Values and Outliers/ Signal Extraction in ARIMA Time Series) was developed by Maravall [
107], Gomez [
108], and Gomez and Maravall [
109] for the seasonal adjustment.
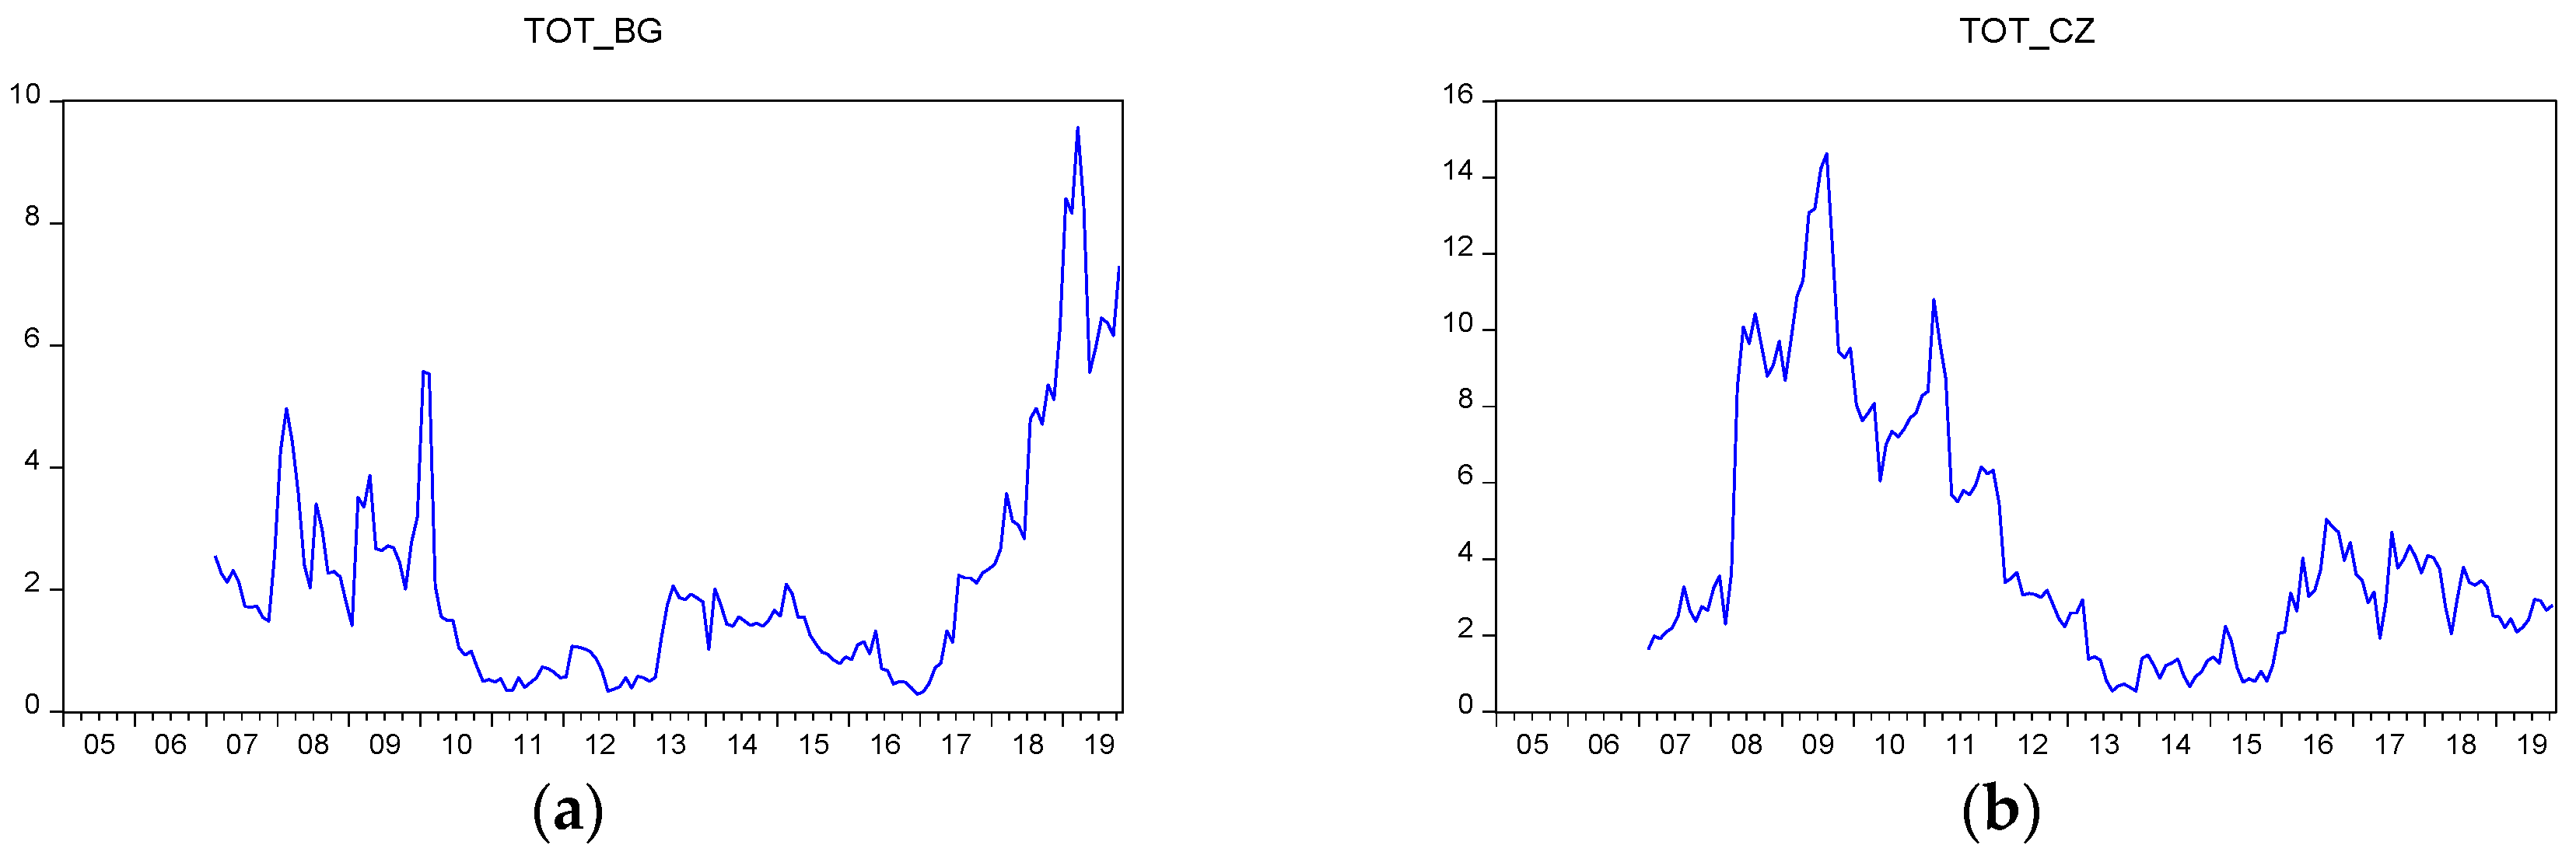
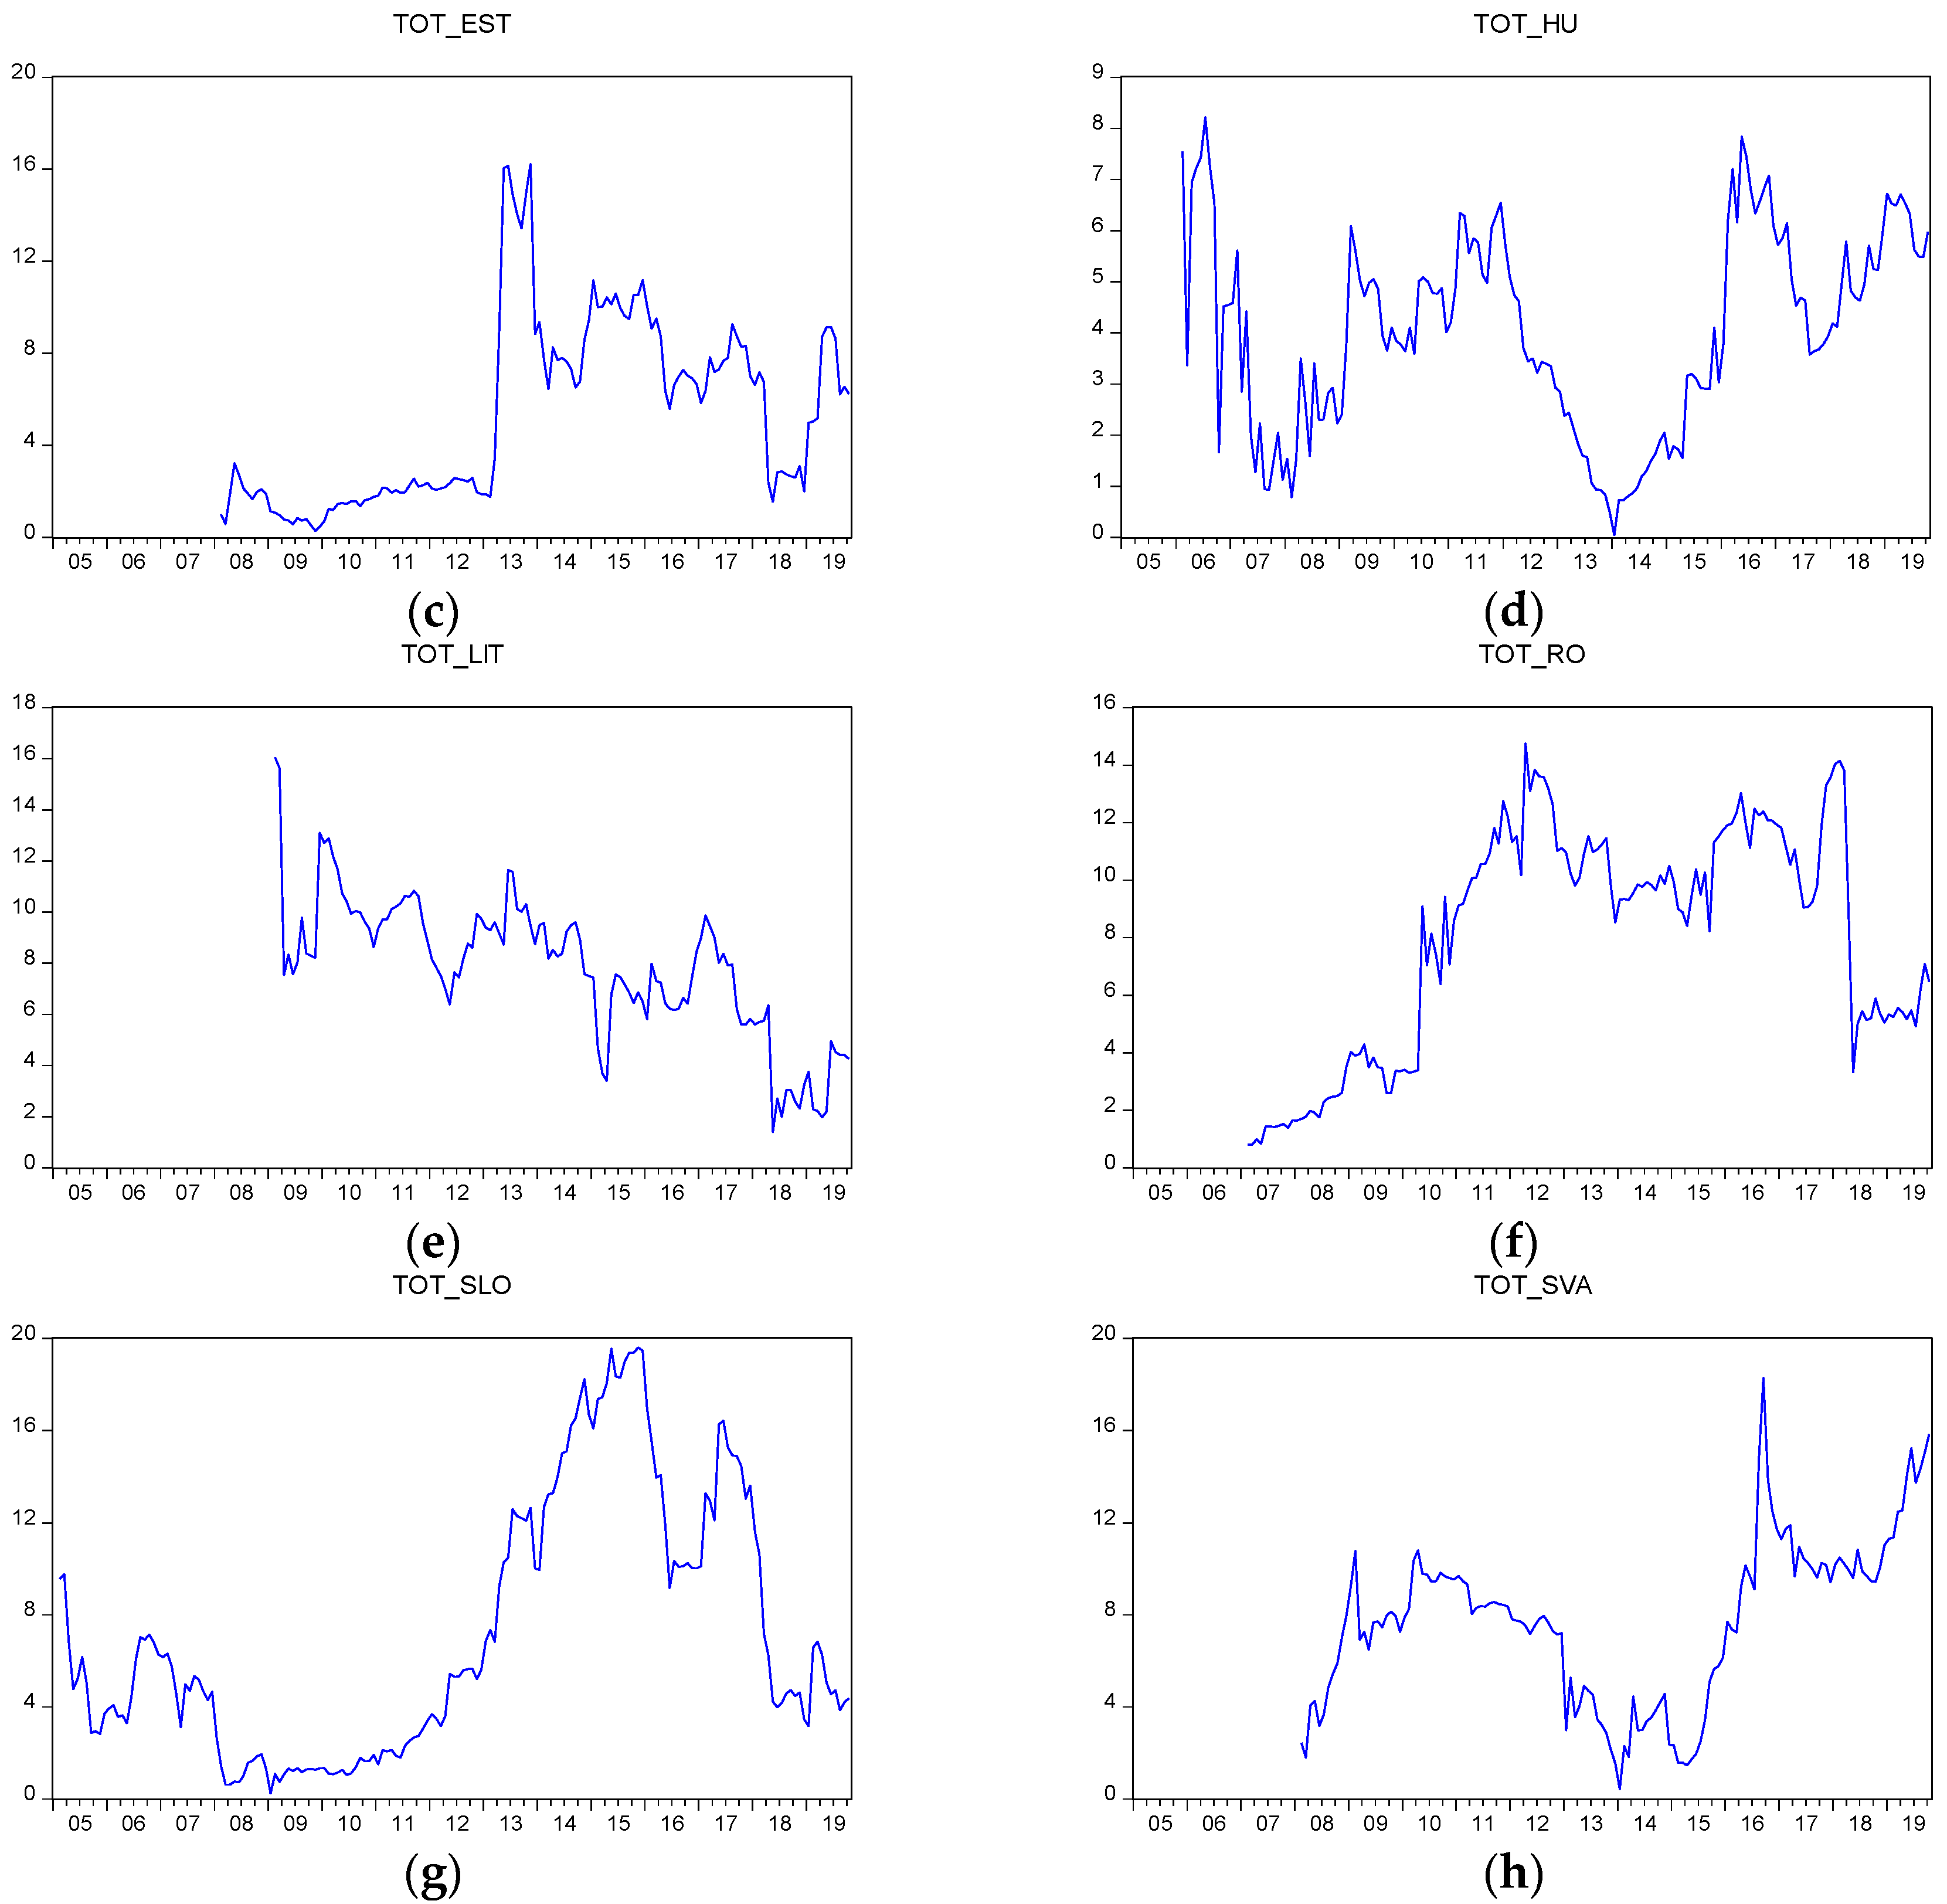
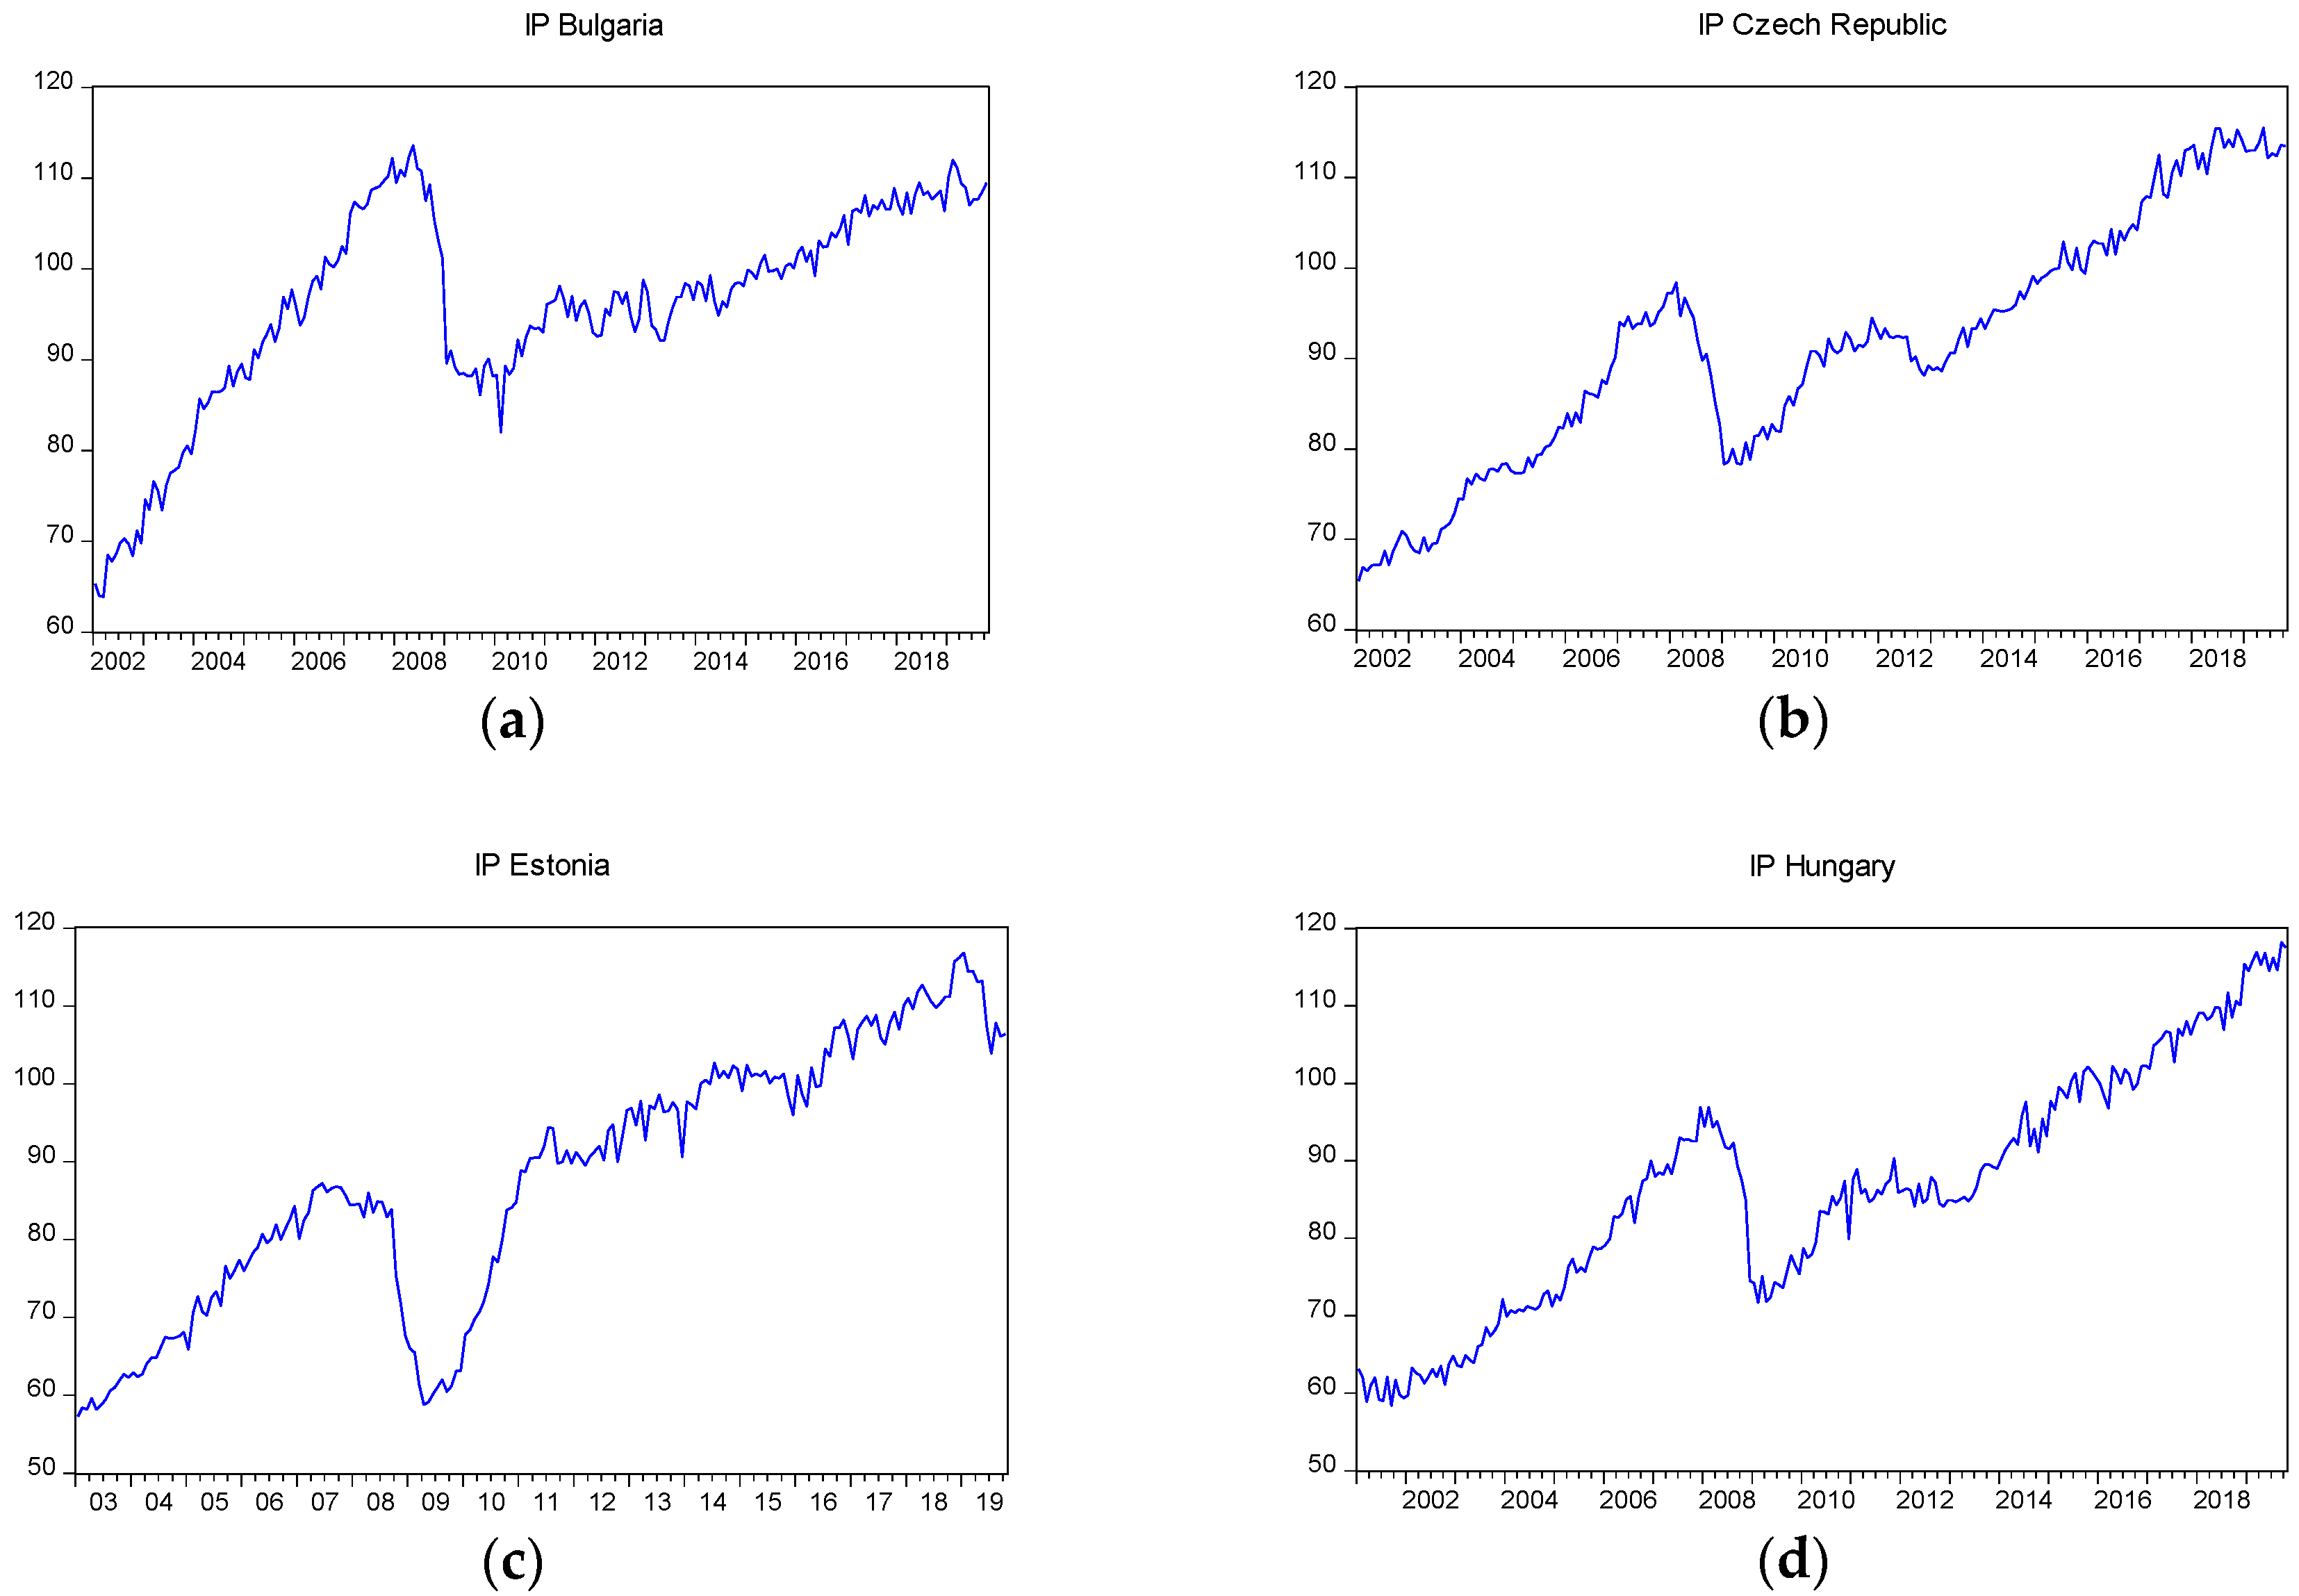
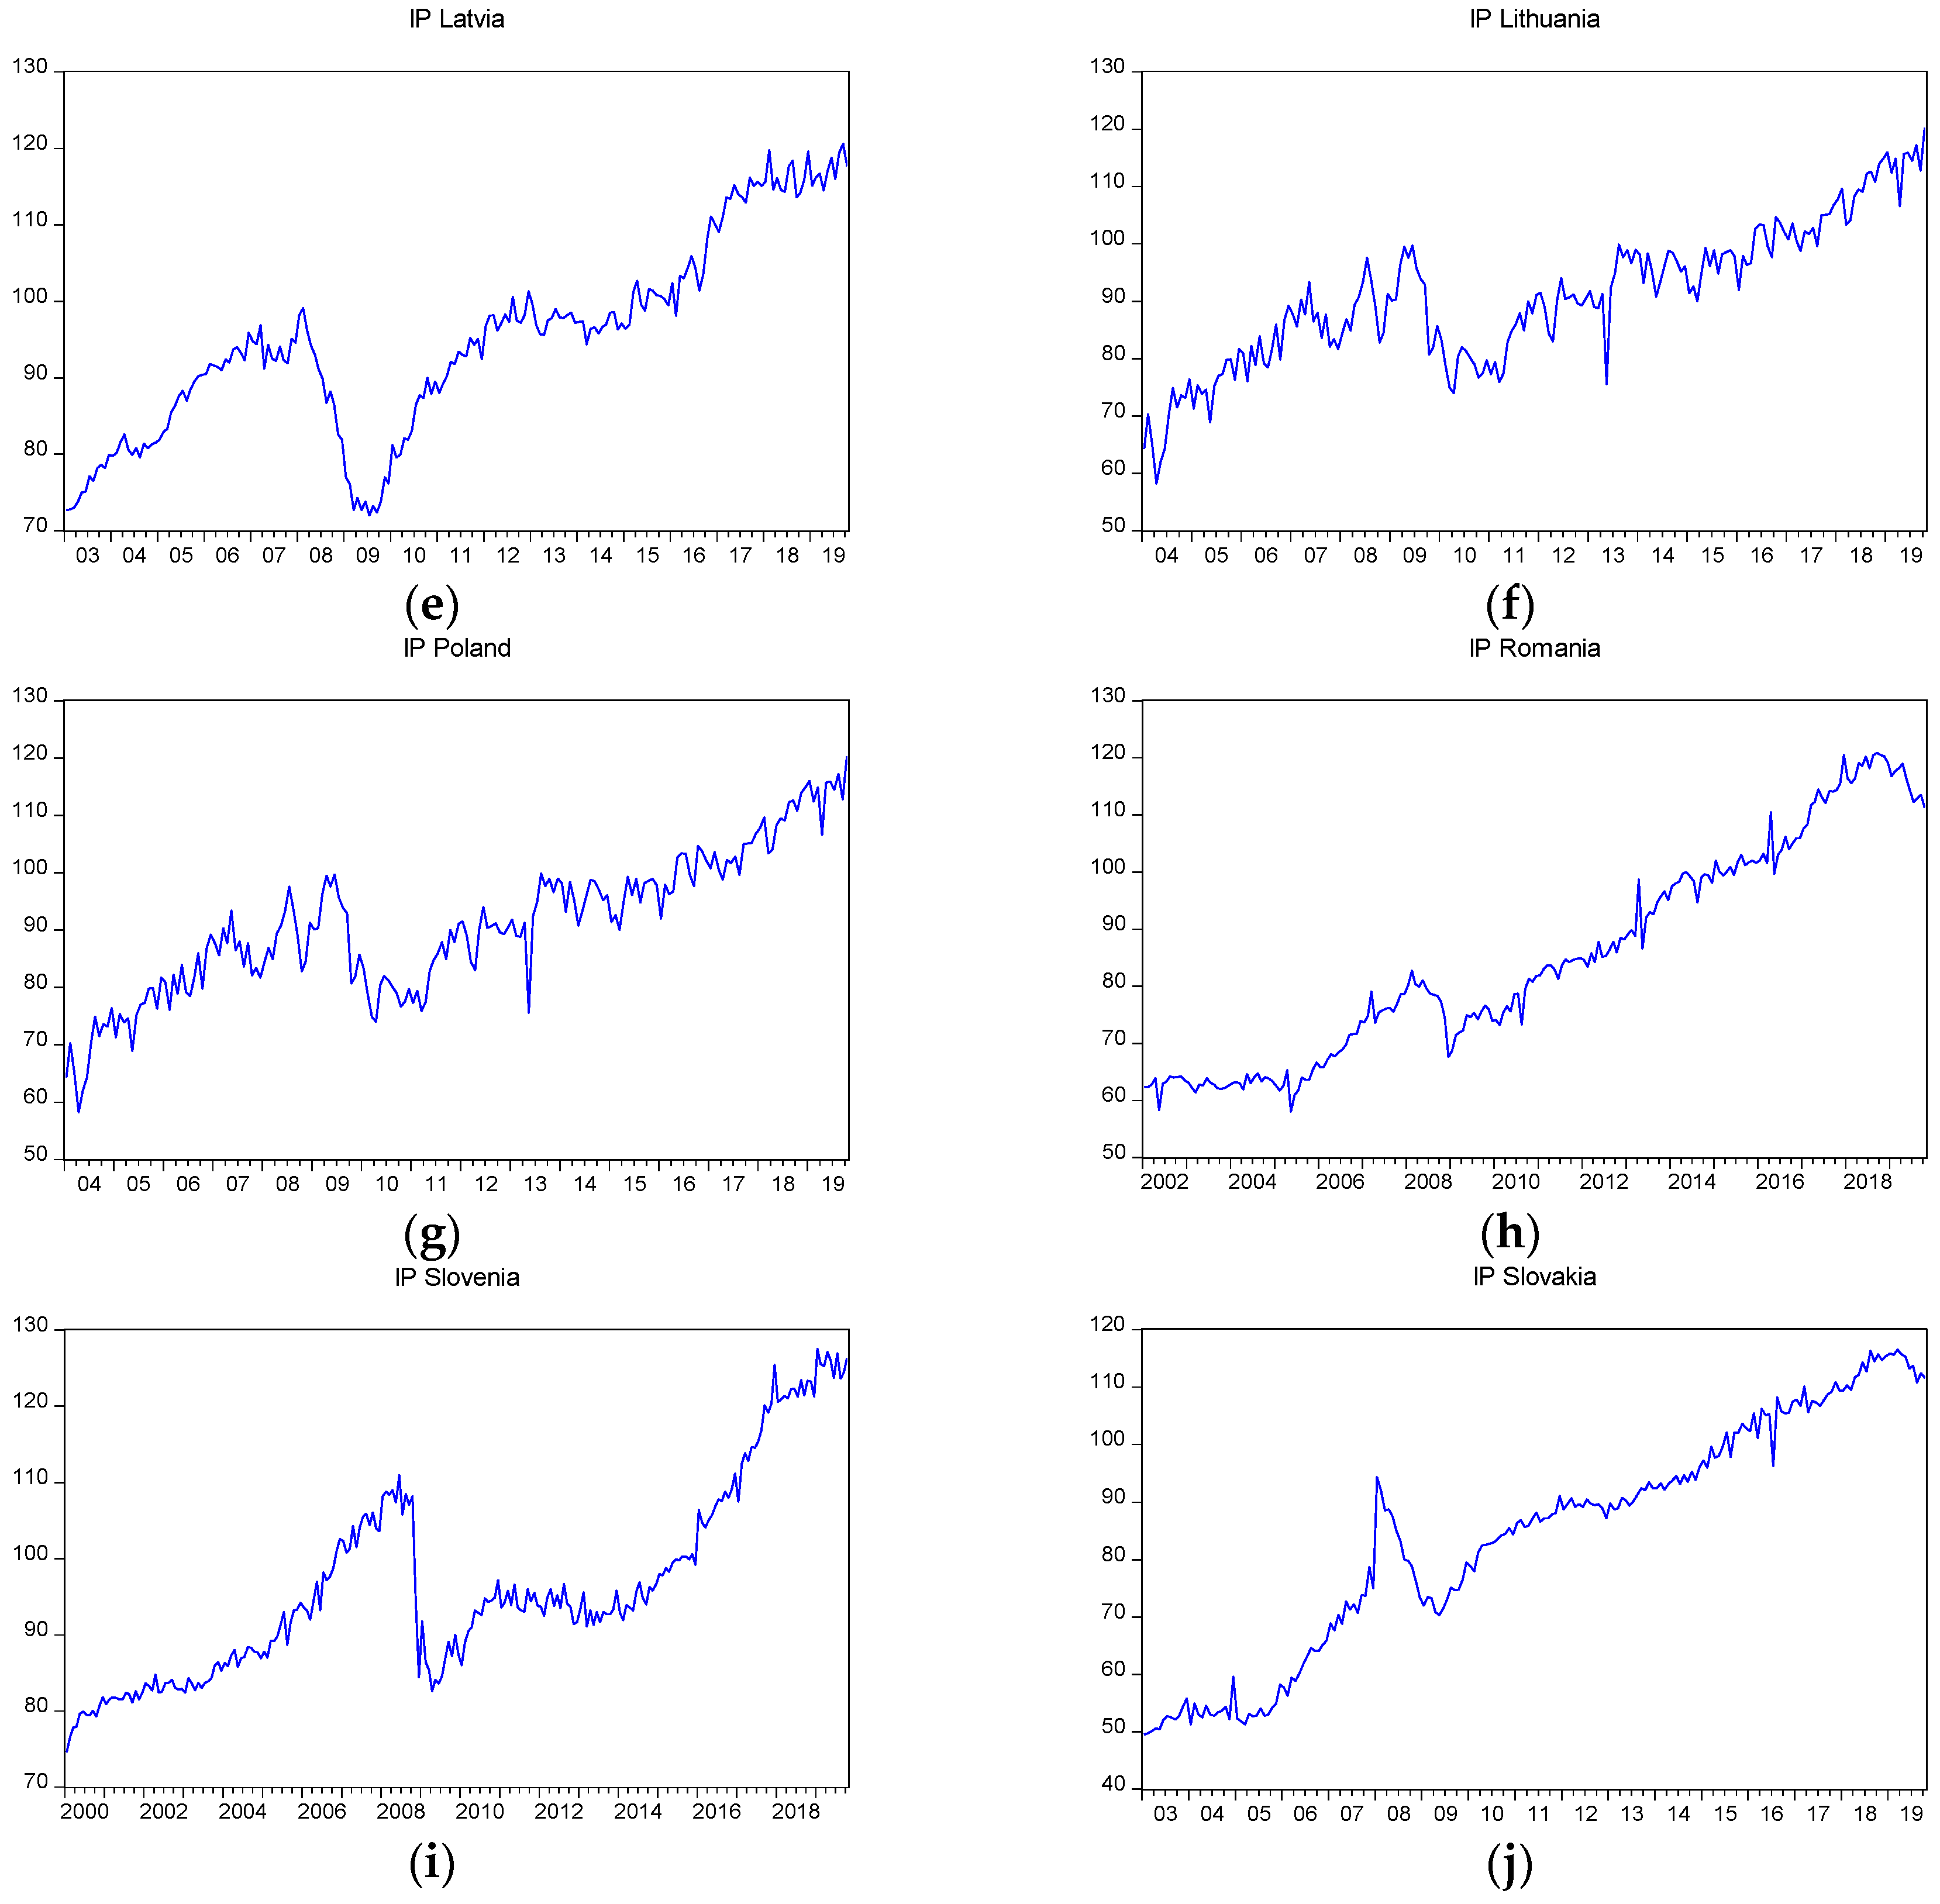
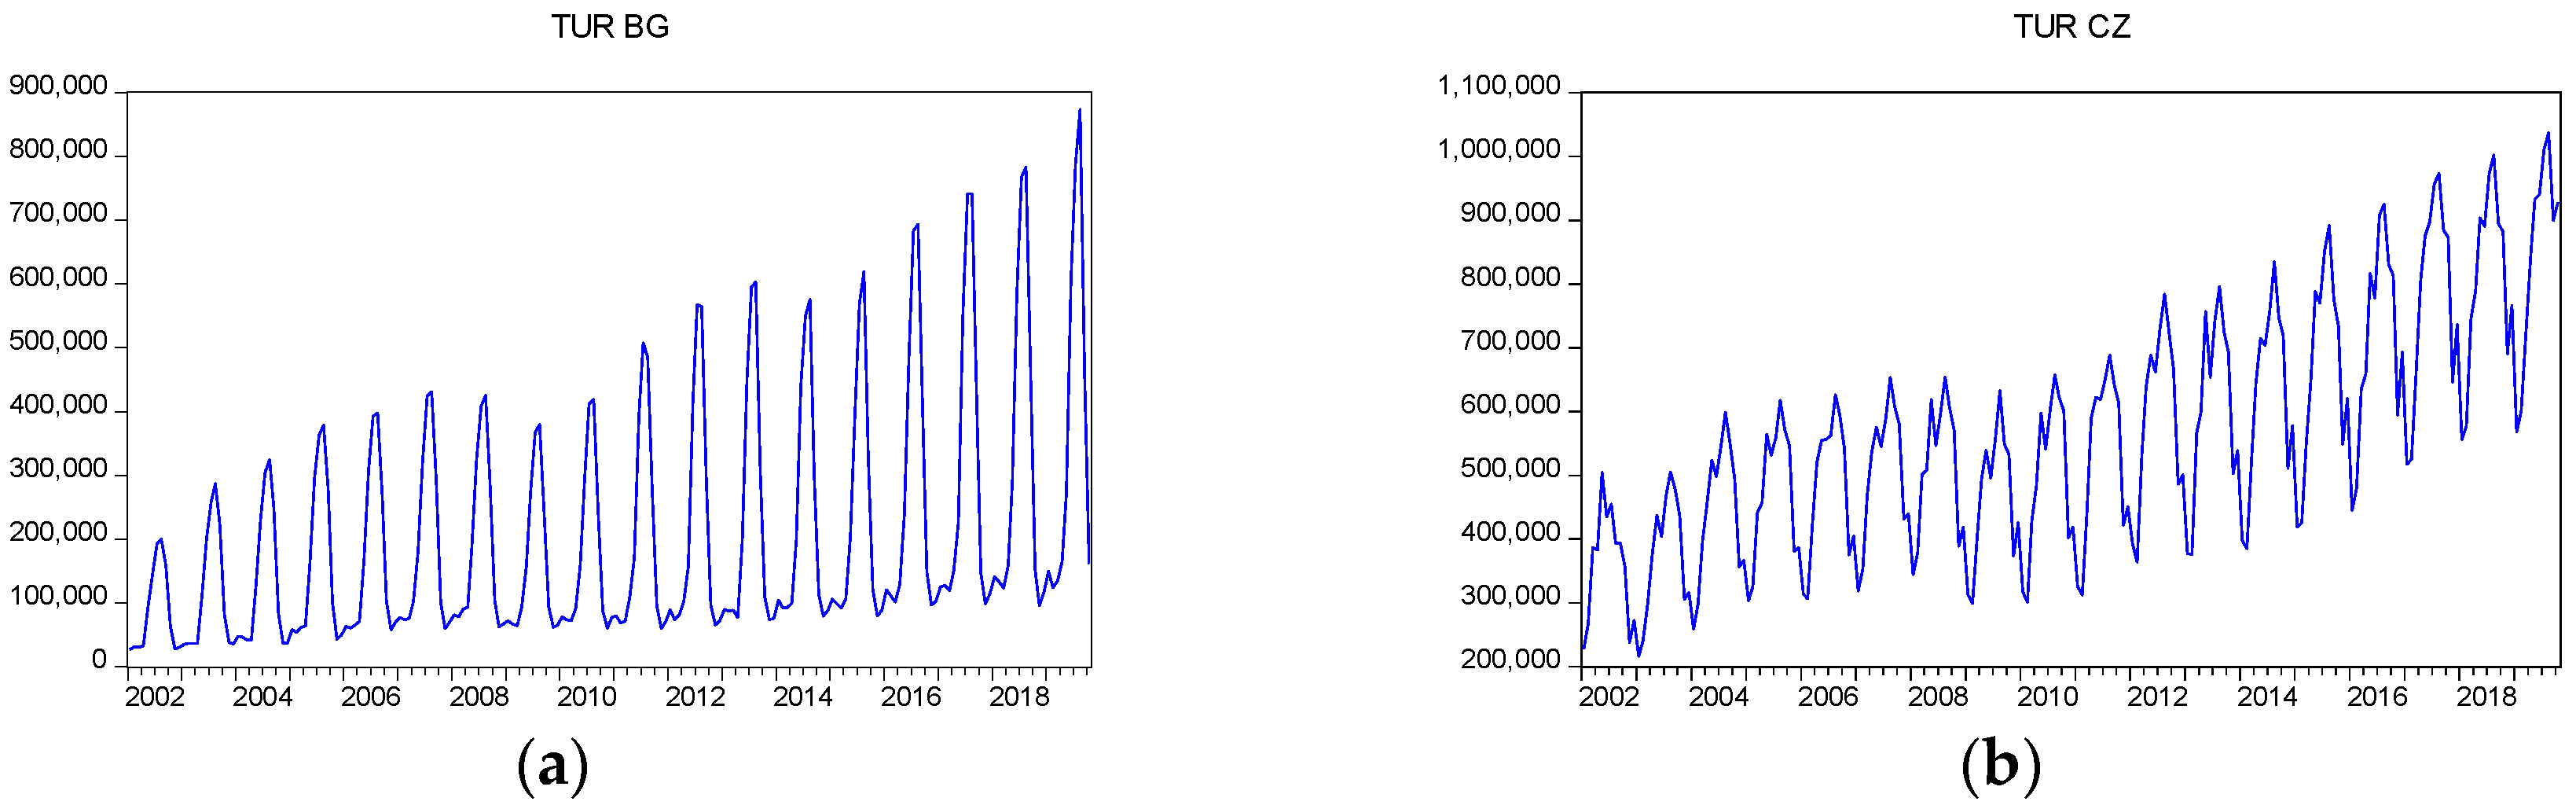
The graphical representation of the seasonally adjusted time series for the industrial production index and for international tourist arrivals at tourist accommodation is presented in
Figure 4 and
Figure 5, respectively.
Table A2 in the
Appendix B presents the descriptive statistical indicators for the industrial production indices for the countries analysed, which are seasonally adjusted time series as well as for the international tourist arrivals at tourist accommodation, which are logarithmated and seasonally adjusted.
For the analysis of the short-term dynamics of the relationship between international tourism and economic growth in CEE countries, the VAR model was used since its condition was that the variables must be stationary. In order to test the stationarity, certain unit root tests were used for the robustness of results. First, the ADF test (Augmented Dickey-Fuller) proposed by Dickey and Fuller [
110] was used since it is a traditional test used in most research papers. Another test, the PP test (Phillips-Perron) [
111] was used, which, unlike ADF, takes into consideration an autocorrelation order higher than the one considered in the test equation. If there is a structural break, the unit root tests ADF and PP can determine results that may appear meaningless. That is the reason why the other two unit root tests were used, the modified ADF breakpoint unit root test [
112] and Lee-Strazicich root test [
113]. The modified ADF breakpoint unit root test [
114] enables a single structural break, while by means of the Lee-Strazicich root test, we can consider two structural breaks. Since the time series in the analysis include a long period of time, it is recommended to use the Lee-Strazicich root test. In this study, we will consider two moments of structural breaks.
In the
Appendix B Table A2, for the seasonally adjusted industrial production time series, as well as for the logarithmated and seasonally adjusted time series for international tourist arrivals at tourist accommodation, one can observe that all unit root tests depict the same situation, namely, they have at least one unit root. As a consequence, the first difference of these time series was used and it was determined the growth rates by calculating the logarithm of the first difference. Both the industrial production growth rate and the growth rate for international tourist arrivals are stationary according to the results of the unit root tests presented in
Appendix B Table A3.
The determination of the variance coefficients for the growth rates for industrial production and international tourist arrivals based on the means and standard deviations corresponding to each time series, presented in the
Appendix B Table A3, highlights the presence of higher volatility for the industrial production growth rate for the countries considered in comparison with the international tourist arrivals at tourist accommodation time series. Even if during the period under study, the CEE countries suffered both from the global financial and economic crisis which started at the end of 2007 and from the crisis of sovereign debts of EU countries, the industrial production average rates are very low (even reaching the value 0.02%) but still positive.
According to the Jarque-Berra test [
114] presented in
Appendix B Table A3, most of the statistical time series do not follow normal distribution laws. There are some exceptions though, such as the growth rates of industrial production in the Czech Republic and Latvia and the growth rates of international tourist arrivals at tourist accommodation in Latvia, which follow normal distribution laws. The evolution of industrial production and international tourist arrivals at tourist accommodation growth rates are stationary according to the unit root tests and graphical representations from
Appendix C,
Figure A2 and
Figure A3.
6. Empirical Results
The empirical analysis of the relationship between international tourism development and economic growth for CEE countries starts with the testing of the existence and direction of the causality relationship. Since both the economic growth rate and the growth rate of international tourist arrivals at tourist accommodation are stationary the Granger-causality between the two variables was determined. The choice of lags i and j from the Equations (1) and (2) was made by selecting the estimated equations for which the minimal values of the Akaike, Schwarz, Hannan-Quinn, and Forecast Prediction Error information criteria were obtained. The estimated residual variables are also white noise.
The results obtained for the Granger-causality are presented in
Table 1.
The data included in
Table 1 confirm the hypothesis H1, which says that international tourism determines economic growth for Bulgaria, Estonia, and Slovakia, and the hypothesis H2, according to which economic growth causes international tourism growth for the Czech Republic, Hungary, Lithuania, Romania, and Slovenia. For Latvia and Poland, there was no Granger-causality identified between the variables considered, that is why we will exclude these countries from the subsequent analyses. We also notice that no country comprised in the sample is characterised by hypothesis H3 of the bidirectional influence of these two phenomena.
For the estimation of VAR models corresponding to each country, we determined the optimal lag length by taking into consideration both information criteria and meeting the white noise requirement of residuals. Testing the lack of multivariate autocorrelation was conducted using the Lagrange multiplier test [
115] and testing the homoscedasticity by means of the White [
116]. The optimal lag lengths obtained based on th information criteria are presented in
Table 2 while the lag used in the subsequent estimations for each country of the VAR model is highlighted in bold.
In
Table 3, there is an overview of the results of the spillover growth analysis between the international tourist arrivals at tourist accommodation and economic development for each country left in the study. These results are obtained based on the total spillover index according to the methodology proposed by Diebold and Yilmaz [
67].
For each country, by columns, there are the contributions for the forecast error time series, the growth rate of international tourist arrivals at tourist accommodation (j) and the industrial production growth rate (i), which result from the innovations at the time series i and j (contribution TO others).
The contributions to the forecast error variance of time series, the industrial production growth rate (i) and the growth rate of international tourist arrivals at tourist accommodation (j), which result from the innovations at the time series j and i are presented in the rows of
Table 3 (contribution FROM others).
The net spillover growth is calculated as a difference between the two contributions: the contribution TO others and the contribution FROM others. The average effect on the growth rate of international tourism and the industrial production growth rate represents the total spillover index.
Since, as is the case of Bulgaria, net spillovers for the growth rate of international tourist arrivals at tourist accommodation are positive, this suggests that international tourism is a net transmitter. Indeed, for Bulgaria, hypothesis H1 was confirmed which says that the international tourism growth determines economic growth. If the net spillover growth rate is negative, as is for Bulgaria for the industrial production growth rate, this indicates that this series is a net recipient.
The results from
Table 3, in the case of Lithuania, show that the value obtained for the total spillover index is 5.615. For this country,
Table 3 also shows that a shock on international tourism explains 96.76% of the forecast error variance of international tourism and 3.24% of the industrial production index. The values for spillovers between international tourism and economic growth determine the decreasing order of countries as follows: Lithuania, Slovenia, Romania, Slovakia, Bulgaria, Hungary, Estonia, Czech Republic. According to the same results, Bulgaria and Estonia are countries where even if the spillover is weak, it transmits from international tourism to economic growth. For the other countries, Czech Republic, Hungary, Lithuania, Romania, Slovakia, and Slovenia, the spillover is performed from economic growth to international tourism, results which are in compliance with those obtained by Škrinjarić [
16].
For all countries, the total spillover index has low and very low values, which indicates that there is a weak interdependence between economic growth and international tourism. The highest values are recorded for Lithuania and Slovenia (5.615 and 3.484, respectively). The lowest value of the total spillover index is recorded for Estonia (0.868) but low values exist also for Bulgaria (1.052), Czech Republic (1.445), Hungary (1.433), Slovakia (1.821), and Romania (2.877). In regard to the net spillover (for the countries which have a higher spillover index), both Lithuania and Slovenia prove that economic growth is the shock transmitter for tourism. This confirmation completes the results obtained through the VAR methodology.
To determine the total spillover index for the countries left in the sample, a 60-month rolling–window was considered. For this reason, indices have a number of values smaller with the size of the rolling–window. The sample of 60 months was also used in the research conducted by Antonakakis et al. [
68] and Dragouni et al. [
36]. The descriptive statistical indicators for the total spillover indices are presented in
Table 4. As the results included in
Table 4 and
Figure 6 show, the total spillover indices fluctuate over time, very much for all countries in the analysis. The highest fluctuation is observed for Slovenia (between 0.238% and 19.606%). There are also high fluctuations for Slovakia (between 0.427% and 17.854%), Estonia (0.285% and 16.22%), Lithuania (1.395% and 16.058%), Czech Republic (0.537% and 14.624%), and Romania (0.803% and 14.756%). The lowest fluctuations of the total spillover index are registered in Hungary (from 0.041% to 8.212%) and Bulgaria (from 0.281% to 9.295%).
The total spillover index for all the countries left in the study shows that the interdependences between economic growth and international tourism development vary over time. Important decreases in total spillover index are registered during the economic and financial crisis between 2007–2008 and after 2010 (2010–2013), also known as the year of the start of the debt crises.
In this study, the authors identified that the fluctuation of the total spillover index between economic growth and international tourism growth for CEE countries is in compliance with both the results of the study conducted by Antonakakis et al. [
18] where they included countries such as Austria, Cyprus, Germany, Greece, Italy, the Netherlands, Portugal, and Spain, and with the results of the study performed by Tang and Tan [
97] for Malaysia and Turkey.
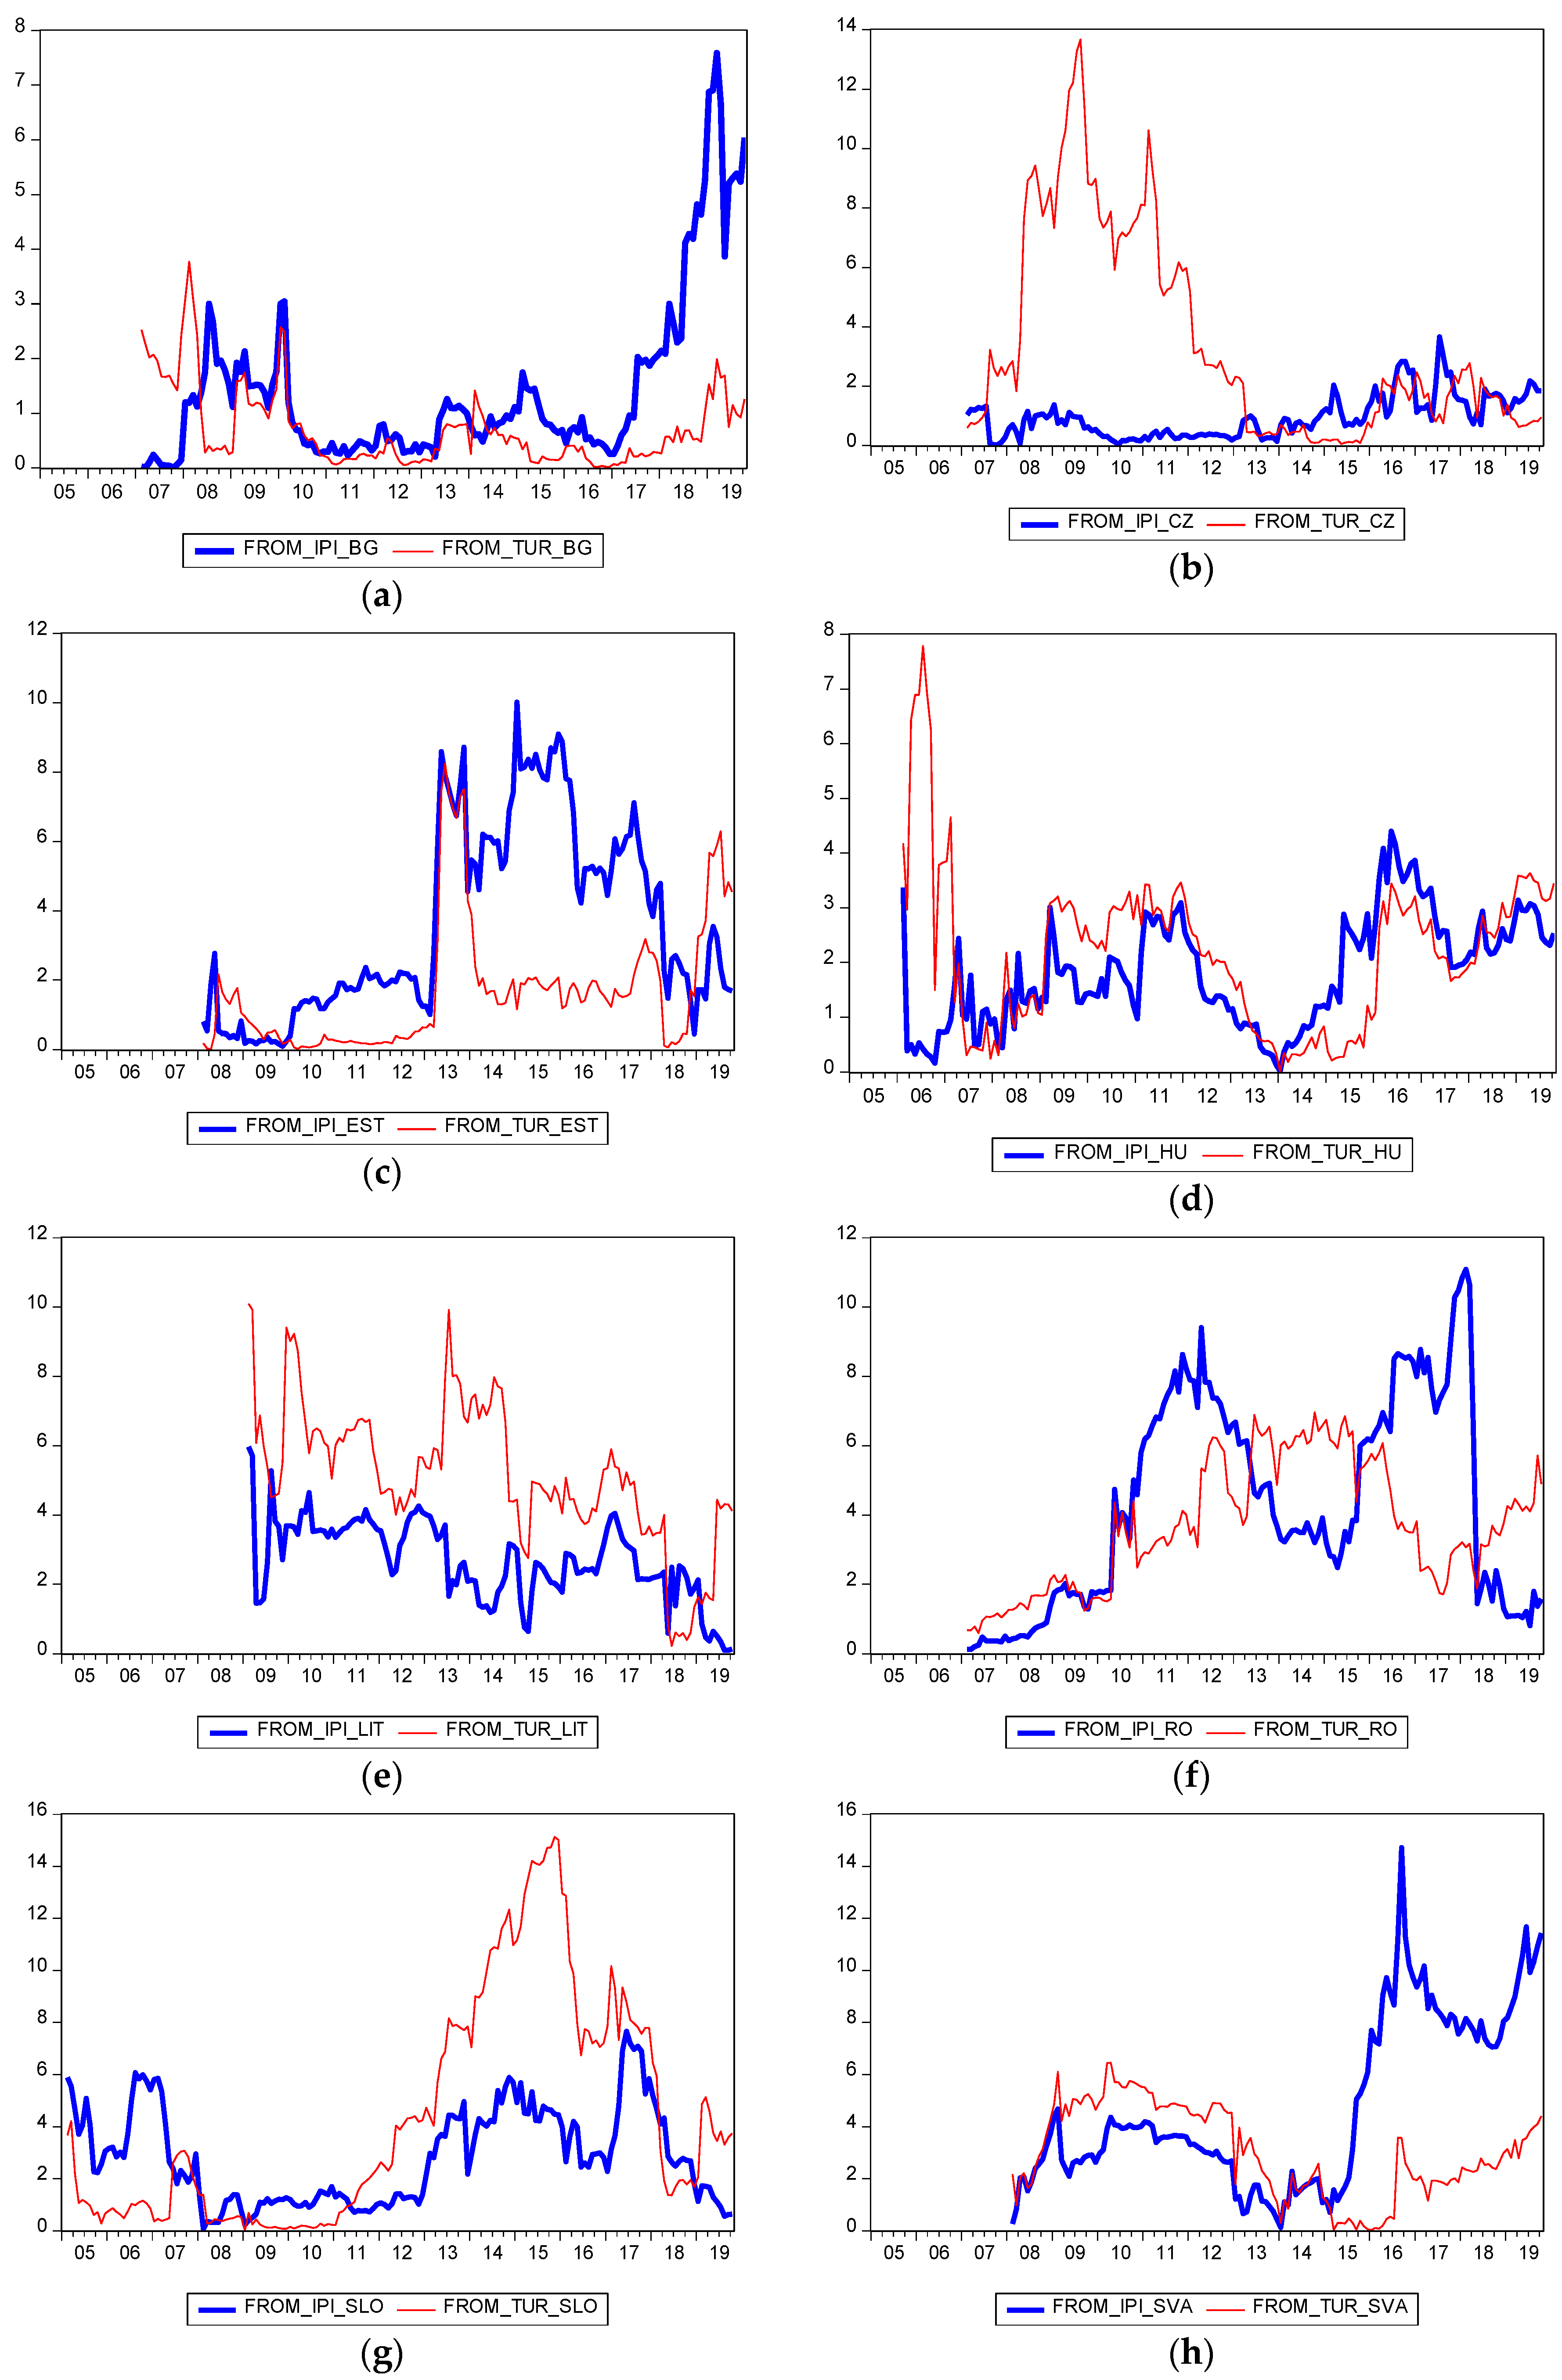
In what follows, we verify whether the previously determined relationship between the spillover direction between economic growth and international tourism, respectively between international tourism and economic growth are maintained and are stable over time. This investigation will be responded based on the analysis of the directional and net spillover between tourism growth and economic growth, whose situations are described in
Figure 7 and
Figure 8.
Regarding the evolution of the spillover indices from the industrial production growth rate and from the tourism growth rate, it was noticed that for the entire period considered in the study this situation is not stable, it is not maintained. There are periods when the spillover of the industrial production growth rate is more emphasized but also periods when the tourism growth rate gains the upper hand. Therefore, the graphical representations from
Figure 7 and
Figure 8 show for all countries left in the analysis a change in time of the shock transmission from one phenomenon to another one.
The graphical representation of net spillover both from the industrial production growth rate to the growth rate of international tourist arrivals, as well as from the growth rate of international tourist arrivals to the industrial production rate, is graphically represented in
Figure 8. When the values of the net spillover index from the industrial production growth to international tourism growth are positive, economic growth has a spillover effect of shocks on the international tourism growth rate and when the values are negative, economic growth is the recipient of shocks from the international tourism growth. When the values of the net spillover index from the international tourism growth rate to the industrial production growth rate are positive, international tourism has a spillover effect of shocks and when they are negative, the tourism is the recipient of shocks.
In the case of Bulgaria and Estonia, the greatest values of the net spillover index from the international tourism growth rate to the industrial production growth rate are positive which implies a shock spillover from international tourism towards economic growth. In the case of Czech Republic, Hungary, Lithuania and Slovenia, the greatest values of the net spillover indices from the industrial production growth rate to the international tourism growth rate are positive, showing a shock transmission from economic growth to international tourism. Following the results obtained for the spillover indices, it can be noticed that the testing of working hypotheses H1 and H2 (TLG, GLT) are not confirmed overall. There are periods when hypothesis H1 which tests whether international tourism growth leads to economic growth is confirmed, and periods when hypothesis H2 which tests whether economic growth leads to international tourism growth is confirmed. Six countries out of the eight studied (Czech Republic, Estonia, Hungary, Lithuania, Romania, and Slovenia) experienced in the last period of time studied, starting with 2018 or 2019, a change in the shock transmission between the two phenomena, leading to the confirmation of hypothesis H2, referring to economic growth led tourism (with the exception of Czech Republic).
In what follows, the authors will describe the idiosyncrasies of each country included in the analysis.
In the case of Bulgaria, one can notice from
Figure 8 that the net spillover index of the industrial production growth rate has negative values which highlights that the international tourism growth causes a spillover towards the industrial production growth. For almost the entire period studied, hypothesis H1 is confirmed which states that international tourism growth determines economic growth. There are also some exceptional periods during the years 2006–2007, before the economic and financial crisis and also in 2013. Therefore, according to
Figure 4, when the industrial production growth rate is negative (the industrial production registers drops) hypothesis H1 according to which international tourism growth determines economic growth is invalidated, but hypothesis H2 is supported, stating that economic growth determines international tourism growth. From
Figure 8, one can also notice that for a long period of time the values of the net spillover indices are very low, almost close to zero, which confirms a very low total spillover index (result depicted in
Table 3), as well as the confirmation of hypothesis H4 which states there is a causality relationship missing between international tourism and economic growth. There are exceptions for the interval 2006–2007 and 2017–2018 when the highest values and the lowest values, respectively, of the net spillover index of industrial production growth rate are recorded. It can be stated that when industrial production has the highest values recorded, economic growth determines international tourism growth. Since the last years included in the analysis present high values of the net spillover index from international tourism growth to economic growth, it is recommended that the policy-makers of this country make decisions to continue the already launched tourism development because this sector of the economic activity is a drive for economic growth.
Estonia, another country for which hypothesis H1 was confirmed, which says that international tourism growth determines industrial production growth (by the estimation of VAR model), presents a variation of the spillover index between the two phenomena, as
Figure 8 shows. Even if almost during the entire period the net spillover shock index from the industrial production index to international tourism registers negative values, confirming the previously mentioned hypothesis H1, there are two time spans, 2008–2009 and 2018–2019 respectively, when the net spillover index registers positive values, suggesting transmission from economic growth to international tourism growth, and respectively, the confirmation of hypothesis H2.
In comparison with Bulgaria and in accordance with
Figure 4 and
Figure 8, when economic growth registers negative values, this causes shock spillover from economic growth towards international tourism growth. During the periods when positive values are registered for economic growth, tourism determines the shock spillover on economic development. The confirmation of causality between tourism and economic growth by business cycles stages is in compliance with the results obtained by Brida et al. [
38].
For the Czech Republic, hypothesis H2, whereby economic growth determines international tourism growth, was confirmed. When analysing the net spillover shock index from economic growth towards international tourism growth, presented in
Figure 8, it was noticed that this varies very much over time. At the beginning of the period, its values are positive, confirming the shock transmission from economic growth to tourism growth (confirming hypothesis H2), however, after 2013, the index has negative fluctuations and rarely positive, confirming the hypothesis H1 whereby tourism growth determines economic growth. If the data from
Figure 4 and
Figure 5 are analysed, it can be noticed that the industrial production index and international tourist arrivals at tourist accommodation establishments for the Czech Republic, in 2013, reached the value they had before the economic and financial crisis. Therefore, economic growth, as well as international tourism growth, determine in this case how the shocks are transmitted from the international tourism growth to economic growth.
In the case of Hungary, the net spillover shock index presented in
Figure 8, from economic growth to international tourism growth, shows for a long period of time, 2006–2014, values which are close to zero, which confirms that the aggregate total spillover index has a low value and that hypothesis H4 is confirmed according to which there is a lack of causality between international tourism and economic growth. Still, at the beginning of the analysis which was conducted for the sample made up of 10 CEE countries, the highest positive values were observed confirming hypothesis H2 where economic growth leads to international tourism growth. At the end of the period, after 2014, when predominant negative values were registered, it was suggested the confirmation of hypothesis H1, where international tourism growth determines economic growth. There is almost the same situation as in the case of Czech Republic: reaching in 2014 the same value of the industrial production index as the one before the economic and financial crisis determines a change in the shock spillover, from international tourism growth towards economic growth. In the case of international tourism, the return to the value before the economic and financial crisis happened sometime before, in 2012.
For Lithuania, it was observed that during the period under consideration, there was the highest value of the aggregate total spillover index. The graphical representation of the net spillover shock index from economic growth to international tourism growth, presented in
Figure 8, show that in almost the entire sample studied, there are mostly high positive values, indicating a transmission from economic growth to international tourism, a situation previously identified through the VAR methodology. Nevertheless, apart from the fact that this spillover fluctuates in time (it is not constant), we notice that in 2018 the net spillover index is negative suggesting transmission from international tourism development to economic growth. Thus, we can include Lithuania within the countries whose spillover phenomenon is not unidirectional throughout the period considered. In this case, hypothesis H3 is confirmed.
In the case of Romania, the evolution of net spillover index from
Figure 8 suggestively evolved under the form of cycles. Since the start of the time sample until the year 2010, low positive values for the net spillover index are noticed, which indicates a transmission from economic growth to tourism growth, then between 2010 and mid-2013 negative values, with spillover from international tourism growth to economic growth. The net spillover index continues from mid-2013 until 2015 and then after 2017 with positive values showing a spillover from economic growth to international tourism growth (hypothesis H2 is confirmed). During the interval 2015–2017, there are negative values suggesting a spillover from international tourism growth to economic growth for which hypothesis H1 is confirmed.
Slovenia stands out through two distinct periods concerning the spillover between these two phenomena. During the first part of the period, until 2010, the spillover is performed prevalently from international tourism to economic growth (hypothesis H1 is confirmed) while in its second part, after 2010, the spillover is done especially from economic growth to international tourism growth (hypothesis H2 is confirmed), with one brief exception in 2018. The same situation occurs in Slovakia but the other way round. There are two distinct periods: in the first period up to 2014, the spillover is performed from economic growth to international tourism growth (hypothesis H2 is confirmed) while after 2014 the spillover happens from international tourism growth to economic growth.
As a consequence of the current analysis, one can notice that there are countries included in the study for which there is no constant and consistent spillover between the two phenomena considered: international tourism and economic growth. For the same country, within the time sample under consideration, there are both the shock spillover from economic growth to international tourism and from international tourism to economic growth.
7. Conclusions, Limits of the Research, and Future Directions
The research in the CEE countries regarding the causality relationship between tourism and economic growth is influenced by the data availability, both from the point of view of the period required and from the perspective of available variables. The uses of variables that quantify international tourism and economic growth with monthly frequency in the research performed on the causality between international tourism and economic growth are very scarce (most of them being conducted on annual data) and this study comes to cover this gap.
As it can be noticed from the analysis, the starting data of the study, especially for international tourist arrivals at tourist accommodation establishments with monthly frequency (for the industrial production there is a longer time period) are different according to their availability. Since there has not been any analysis of the causality relationship between international tourism and economic growth for CEE countries and using the spillover index under study, the authors chose to look into this one.
In the study of the research hypotheses according to which international tourism leads to economic growth and economic growth leads to international tourism, by using the static approach, the results obtained were contradictory. The methodological framework of the volatility spillover indices proposed by Diebold and Yilmaz [
67], Koop et al. [
90], as well as Pesaran and Shin [
91], was used on a sample of 10 CEE countries. This enabled the ability to study the relationship between international tourism growth and economic growth and vice versa in order to identify the interdependence type between phenomena and their follow-up over time. As a consequence of the analyses conducted in the current study, the results obtained enabled the validation or invalidation of the hypotheses advanced in the literature review chapter.
Firstly, the relationship between economic growth and international tourism growth is time-variant. Thus, there is the possibility that for the same country, for a certain period of time, international tourism growth determines economic growth, confirming thus hypothesis H1 whereby tourism growth leads to economic growth. Meanwhile, under other time intervals, economic growth determines international tourism growth, confirming thus hypothesis H2 according to which economic growth leads to tourism growth. According to the results obtained, for Bulgaria and Estonia, hypothesis H1 is confirmed (international tourism led economic growth), while hypothesis H2 (economic growth led international tourism) is confirmed for the other countries: Czech Republic, Hungary, Lithuania, Romania, Slovenia, and Slovakia. Moreover, all the countries have time samples unequally distributed, which caused that hypotheses H1 and H2 be validated in turns. We estimate that for the 10 CEE countries, the hypothesis H3 regarding the existence of a bidirectional relationship between tourism and economy (bidirectional causality) should include both hypothesis H1 where international tourism leads economic growth and hypothesis H2 where economic growth leads international tourism. Under the conditions of the present study, hypothesis H3 is also validated, respectively the existence of the bidirectional causality. Especially for Bulgaria and for Hungary, one can notice time intervals with very low or close to zero values for spillover index which confirms the lack of causality between the two phenomena, meaning the confirmation of hypothesis H4.
Secondly, the causality relationship between international tourism and economic growth fluctuates over time, taking values that change from one interval to another time interval analysed. The fluctuation of the causality intensity is strongly correlated with the business cycles and therefore this result is in agreement with the conclusions drawn by Brida et al. [
38] and Antonakakis et al. [
68]. The analysis distinguishes Romania, whose results show the change between the shock spillover from international tourism or the industrial production index, these being conducted by business cycle stages. Taking into account the results obtained, it is recommended that the policymakers take measures in accordance with the business cycle stages corresponding to each country.
For Bulgaria, Estonia, and Slovakia where the hypothesis H1 (TLEG) is confirmed, policymakers should support the investments in the touristic sector and the creation of adequate jobs for the development of activities performed by the economic agents from this sector such as tax rebates, the flexibility of labour market in the touristic field, facilitating the supply chains of food products towards hotels, etc. These policies can determine a stronger initial development of international tourism and then a sustained economic growth.
In the Czech Republic, Hungary, Lithuania, Romania, and Slovenia where the hypothesis EGLT (H2) is validated, the proposed decisions should lead to the increase in the trust level of international tourists by means of investments in the improvement of the image of touristic destinations abroad, high-quality standards in the field of tourism, improvement of connections and means of transportation outside the country and, last but not least, increase in the level of safety and security perceived by international tourists.
For Latvia and Poland, the fourth hypothesis was confirmed, namely the lack of causality. Under this circumstance, it is recommended that the facilities and the attention of policymakers should move from the international economic actors in the touristic field functioning in these two countries towards the local agents which have a greater contribution to the economic growth in the areas where they deploy their activity.
As it has already been mentioned, the previous studies obtained contradictory results determined by the use of different time samples, different variables that quantify the two phenomena studied, tourism growth and economic growth, and respectively, the country sample included in the analysis. In the present study, the results obtained are different for Bulgaria and Estonia, which does not confirm the results obtained in the study conducted by Škrinjarić [
16]. This result can be explained by the inclusion in the analysis of a different variable: the total tourist arrivals. All these considered, we propose that future research should focus on the study of the causality relationship between tourism and economic growth by taking into account several variables that quantify component elements of tourism, such as the domestic tourist arrivals. The goal will be to minutely analyse the touristic phenomenon for the same CEE countries. Even if the variable international tourist arrivals has been mentioned in the literature as an indicator of tourism quantification overall, the variable which was used, namely international tourist arrivals at tourist accommodation establishments offered the possibility of conclusions only in regard to the relationship between international tourism and economic growth and vice versa. Consequently, this study touches on an important topic and helps in understanding the phenomenon which exists between the existence or lack thereof of a unidirectional causality, of a bidirectional causality or the lack of causality between the variables analysed. Moreover, as a distinctive feature, this study quantified economic growth as a component of sustainable development. Since we now have the spillover indices, future research could focus on the performance of comparative econometric models between the evolution of macroeconomic indicators and the spillover index between tourism growth and economic growth. This will allow the in-depth knowledge of the spillover phenomenon by means of the identification of the economic factors influencing the causality between tourism growth and economic growth.
This study has its limits. In order to perform an analysis comprising a sample of 10 CEE countries, data provided by Eurostat were used. For future research, the authors recommend the elaboration of a methodological approach including compatible samples which could allow the use of other variables in the analysis.


