Article

Prediction and Maintenance of Water Resources Carrying Capacity in Mining Area—A Case Study in the Yu-Shen Mining Area

1
School of Mines, China University of Mining and Technology, Xuzhou 221116, China
2
School of Energy, Xi’an University of Science and Technology, Xi’an 710054, China
3
Department of Mining Engineering, Balochistan University of Information Technology Engineering and Management Sciences, Quetta 87300, Pakistan
*
Author to whom correspondence should be addressed.
Sustainability 2020, 12(18), 7782; https://doi.org/10.3390/su12187782
Submission received: 2 September 2020 / Revised: 14 September 2020 / Accepted: 16 September 2020 / Published: 21 September 2020
(This article belongs to the Special Issue Sustainable Water Resources Development)

Abstract

:
The problem of water resources damage caused by coal mining has restricted the sustainable development of Yu-Shen mining area. Illustrating the relationship between mining and water resources carrying capacity is of great significance to solve this problem. In this study, the authors proposed an appraisal and prediction model of water resource carrying capacity in the mining area (WRCCMA) based on the analytic hierarchy process (AHP)-fuzzy comprehensive evaluation method. A triple-leveled structure model was developed, and the main influencing factors of the WRCCMA and the membership functions were analyzed. The prediction model was applied to Yubujie colliery to test its validity by investigating the changes of vegetation coverage and the ground deformation of the colliery and its adjacent coal mine before and after mining. Subsequently, we obtained the WRCCMA of the study area and zoning map of different grades of WRCCMA in the mining area by applying this model to the whole Yu-Shen mining area. Furthermore, three countermeasures to maintain the WRCCMA and realize water conservation coal mining (WCCM) were provided to collieries with different WRCCMA grades, including mining methods selection, mine water reutilization, and water-resisting layer reconstruction. Reasonable mining methods and water-resisting layer reconstruction can reduce the development of water conductive fractures and thus prevent groundwater from penetrating into the goaf. Mine water reutilization provides a source of water demand for collieries and families, contributing to the reduction of abstraction of water resources. These three countermeasures can help to maintain the WRCCMA. This paper successfully combines the fuzzy theory with mining engineering and provides theoretical and practical guidance for other mining areas in arid and semi-arid regions of Northwest China.

1. Introduction

With the depletion of coal resources in central and eastern China, the focus of coal mining has gradually shifted to arid and semi-arid areas in Northwest China, where the proven reserves make up to more than two thirds of the country’s total, and contributes to over one third of China’s annual coal production [1,2]. However, Northwest China has a dry climate, sparse vegetation, and water resources are scarce, accounting for only 3.9% of the entire country [3]. Water resources are likely to be damaged by mining, which leads to the water shortages being in worse condition [4,5,6]. Taking Yu-Shen mining area as an example, the water table has declined by more than 8 m over an area of 1000 km2, and the number of springs and the flow have decreased by 93.58% and 81.06%, respectively [7,8]. High-intensity and large-scale mining activity are found to be the direct cause of significant water table lowering in 71.5% of these areas [9]. Mining has exceeded the water resource carrying capacity in the mining area (WRCCMA) and made the water resources come into a vicious circle [10]. Therefore, it is necessary to evaluate the WRCCMA and take corresponding measurements to achieve water conservation coal mining (WCCM) [11].
In-depth research on WRCC has been conducted locally and abroad. Many research tools, including drones and satellites and a variety of research approaches, i.e., system dynamics theory, ecological footprint, artificial neural network, regional water resources metabolism theory, and fuzzy comprehensive evaluation, have been employed to study the WRCC of cities, rivers, and reservoirs [12,13,14,15,16,17,18]. However, there is less literature available that has studied the WRCC in the mining areas. As the research object of WRCC is different, the influencing factors, emphases, and purposes are also varying [19,20,21]. At present, the research objects of WRCC are mainly cities and regions. The evaluation factors focus on the water resources system, industrial water system, agricultural water system, domestic water system, and water treatment system [22,23], which is essentially different from those in mining areas.
Fan Limin et al. proposed the concept of WCCM and agreed that WCCM is an important way to keep the WRCCMA [24]. Qian Minggao et al. believe that only when mining scale is in the range allowed by WRCCMA can sustainable development be achieved [25]. Palchik, Liu Shiliang, Guo Wenbin, and Ma Liqiang Zhang Jixiong studied the formation of the fractured zone and derived the formula for predicting the height of the water conducted fracture zone (WCFZ). They thought that the relationship between the thickness of overlying strata and WCFZ height decides if the water table will drop [26,27,28,29,30]. Huang Qixiang and Ma Liqiang studied the critical value of aquiclude thickness to effectively protect aquifer [4,31,32]. Wu Qiang and Zhang Hairong conducted a study on the factors of roof water inrush from the aspects of geological structure [33,34,35,36]. Booth, Hill, Stoner et al. studied mining’s impacts on an aquifer, and pointed out that the aquifer should be an environmental factor for choosing mining methods and mining parameters [37,38,39,40]. Karaman, Robertson, Howladar, and Gandhe studied the problems of surface subsidence, shallow water leakage, and water quality deterioration, and hold the view that without a sustainable and long-term mining plan, the water level will deplete and a water crisis will occur in the coming years [41,42,43,44]. Li Wenping, Wang Shuangming, Ma Xiongde Yang Zhi studied the impact of water table lowering on the vegetation coverage and the number of springs. They also determined the groundwater level threshold under the constraint of ecology security in mining area [45,46,47,48].
Therefore, the evaluation of WRCCMA also needs to take into account the overburden strata system, geological structure system, aquifer system, coal mining system, and ecosystem [49]. Furthermore, the emphasis of WRCC research in urban areas and mining area is different. In most situations, the water resources system plays a significant role in the evaluation of cities’ WRCC, while the WRCCMA is heavily influenced by the coal mining system, since the groundwater and surface water resources are prone to be damaged by mining [22,23,41]. The purpose of WRCC evaluation of cities is to meet the industrial and domestic water demand and provide water support for urban economic development [19,20,21]. By contrast, the evaluation of WRCCMA aims to satisfy not only coal mine production and living water demand, but also ecological water demand and realize the sustainable development of mining area [4,11].
As far as how to maintain the WRCCMA is concerned, from the perspective of reducing mining’s impacts on the overlying strata and thereby the WCFZ height, WCCM methods, including the backfill mining, height-restricted mining, room and pillar mining, slice mining, and narrow strip mining, have been proposed and successfully practiced [50,51,52,53]. Moreover, constructing a reservoir in an underground coal mine is also perceived as an effective method to maintain the WRCCMA, since it can avoid mine water drainage and surface evaporation loss, and thus improve the mine water reutilization rate [54,55]. Furthermore, water-resisting layer reconstruction has been innovated by grouting for the purpose of reducing the permeability of rock mass and blocking the water conductive fractures between the aquifer and the mined-out area [56].
The above research has studied the evaluation factors of the WRCCMA from different perspectives, but lacks a systematic analysis. The influencing factors of WRCCMA and the change rule of the WRCCMA are complex and fuzzy, which is consistent with the characteristics of fuzzy mathematics. As a result, because of the difference in research objects, purposes, emphases, and evaluation factors of WRCCMA and the WRCC of urban areas, the authors intend to use the fuzzy comprehensive evaluation methods based on the analytic hierarchy process (AHP) to develop a mathematical model to evaluate and predict the grade of WRCCMA in the Yu-Shen mining area. The corresponding measures for collieries with different grades will also be offered. The research results can provide a theoretical foundation and practical reference to achieve WCCM for other mining areas in arid and semi-arid regions.

2. Overview of the Study Area

2.1. Location and Climate of Yu-Shen Mining Area

The Yu-Shen mining area is located in the north of Yulin City, Shaanxi Province, China, and is close to the Inner Mongolia Autonomous Region. The total in-situ coal reserve of this area is greater than 30 billion tons [2]. The total study area was 2625 km2, with the longest distance 97 km in east-west direction and 95 km in a north-south direction. The overall surface elevation varies from 1200 m to 1300 m, and is lower in the southeast and higher in the northwest. There are 90 collieries, coalfields, and exploration zones in this area, out of which 40% is currently in production, and the rest are still in preparation or exploration stage. The location of the Yu-Shen mining area, the planning zone, and a part of boreholes are shown in Figure 1. The Yu-Shen mining area fits into the continental monsoon climate. The annual rainfall in the area is only 400 mm on average, more than two-thirds of which occur between July and September, while the average annual evaporation exceeds 1900 mm. According to the standard of the classification, the Yu-Shen mining area belongs to an arid and semi-arid region [4].

2.2. Geological and Underground Aquifer Characteristics

2.2.1. Geological Characteristics

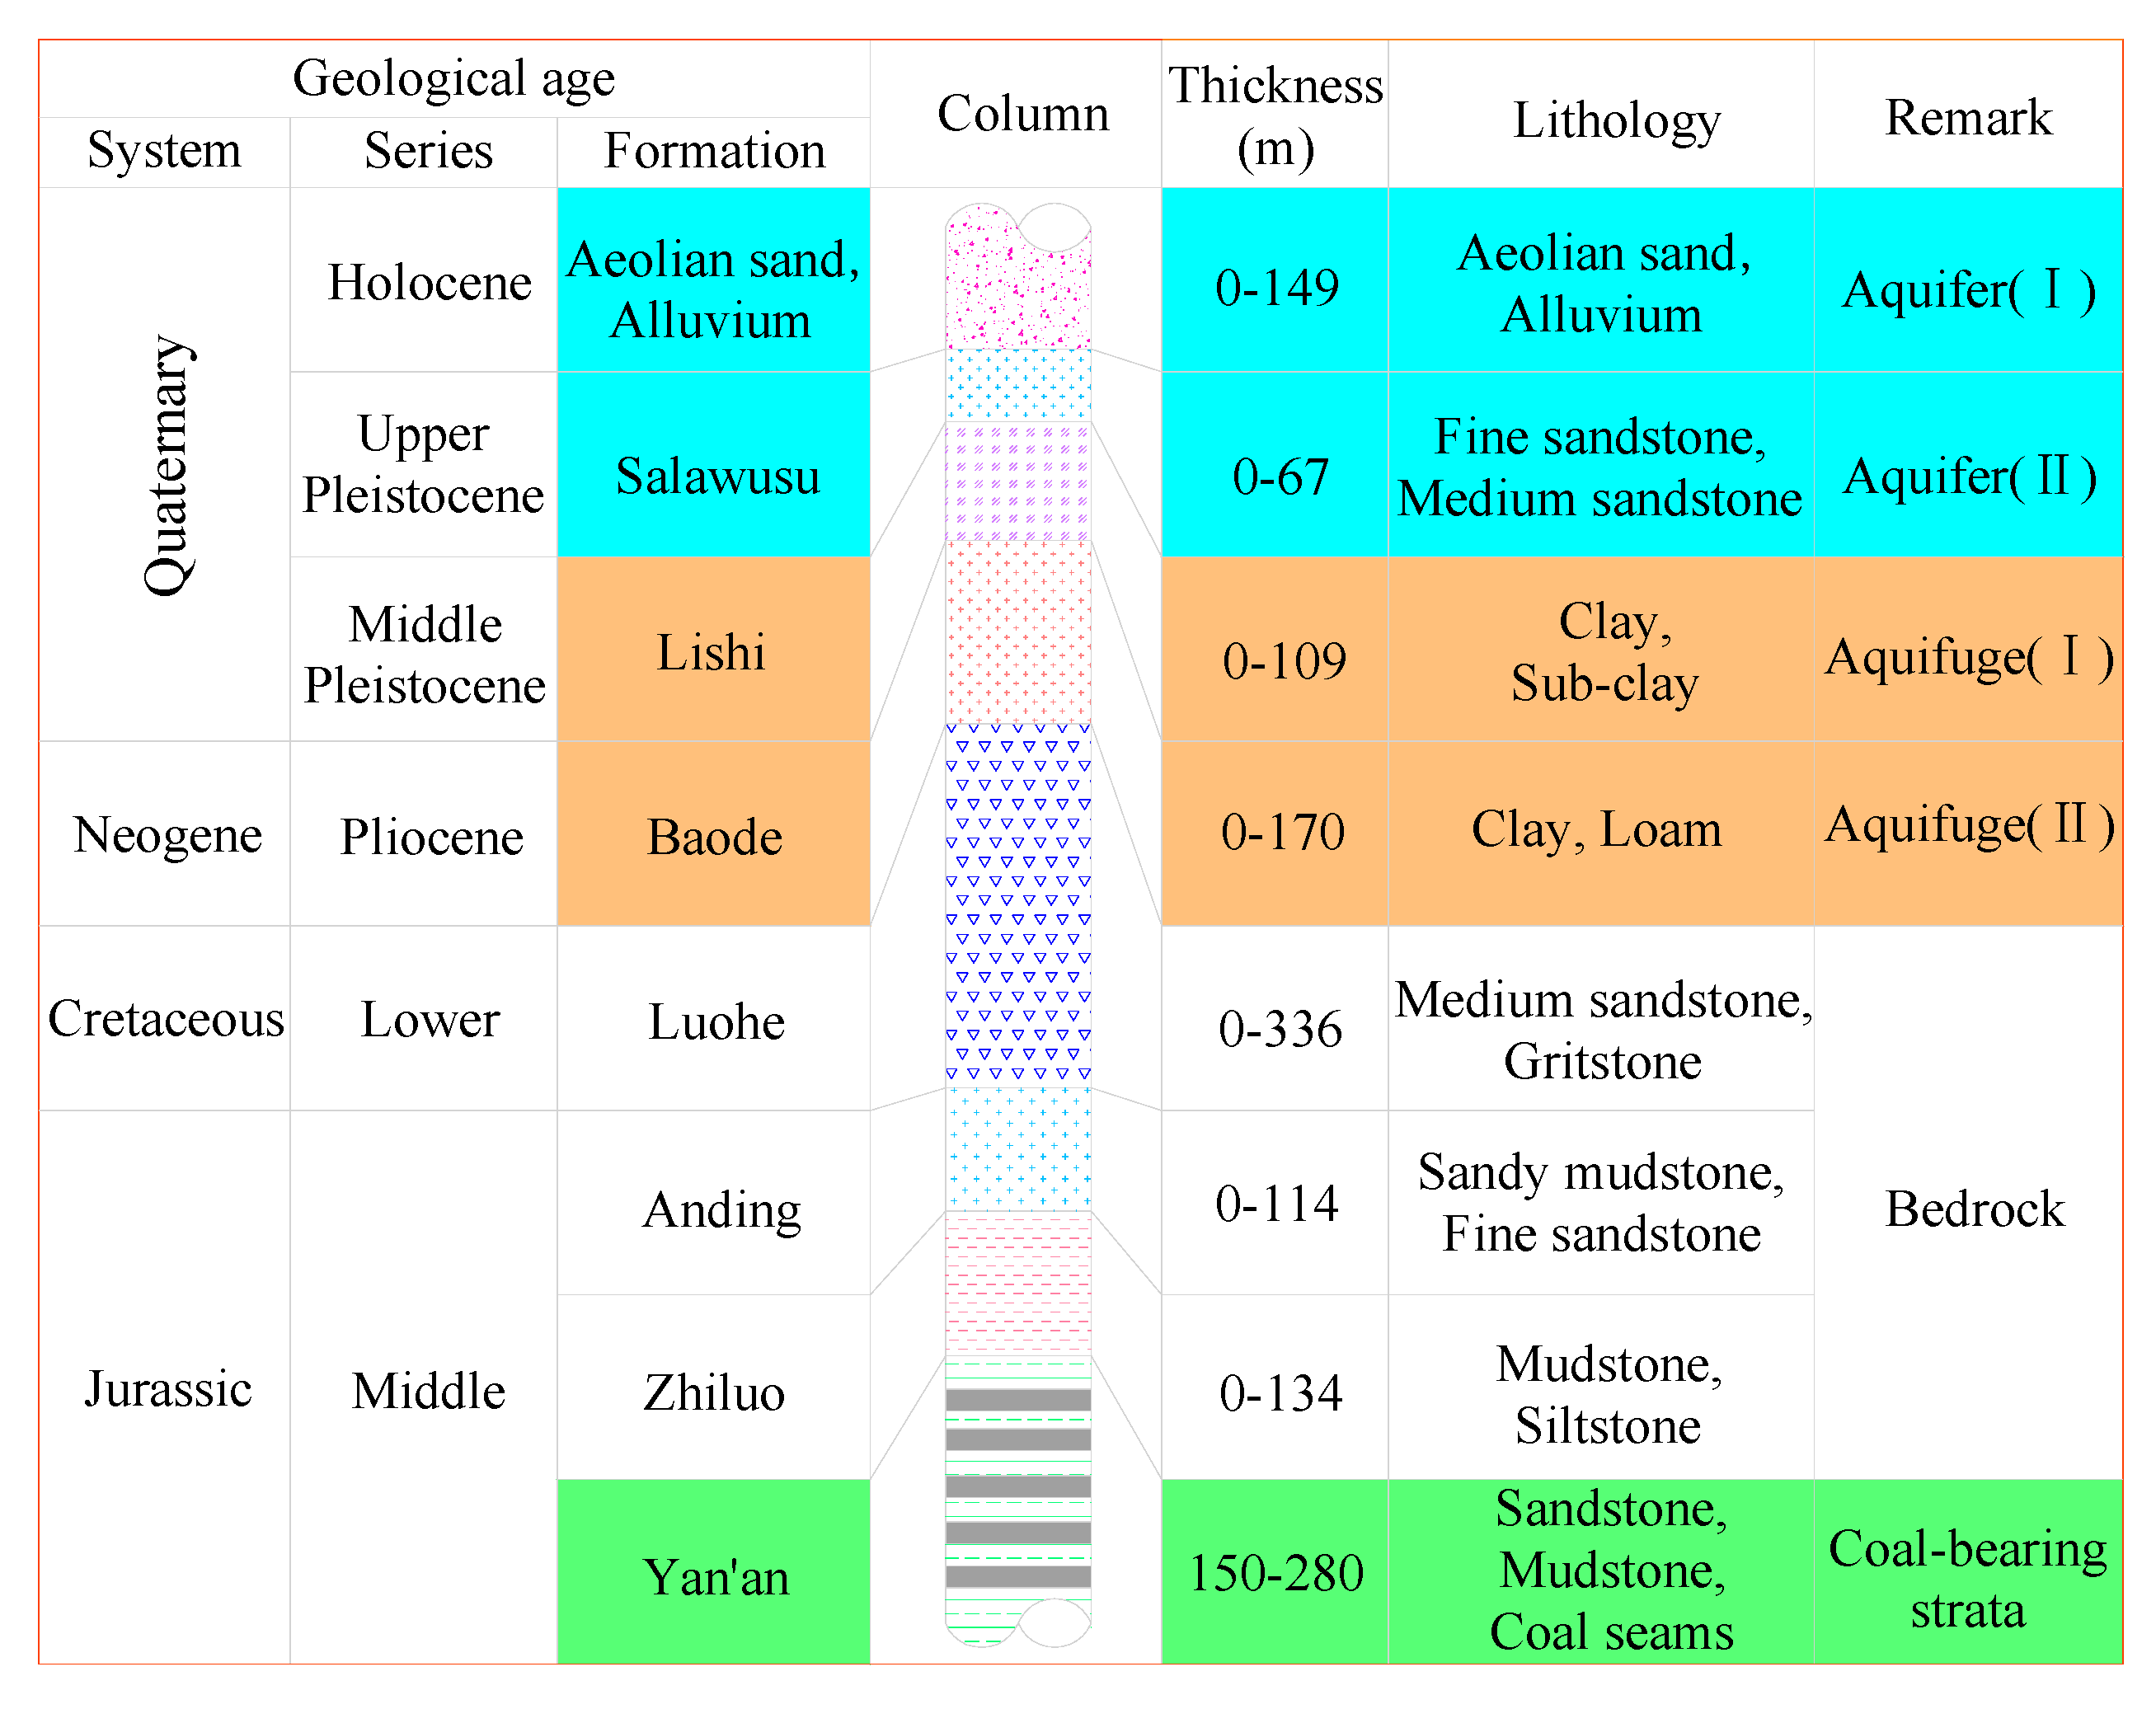
The comprehensive stratigraphic column of Yu-Shen mining area, as shown in Figure 2. The aquifer is mainly Salawusu Formation, usually forming a complete aquifer with overlying Aeolian sand Formation. The aquifuge has consisted of Lishi Formation and Baode Formation. Yan’an Formation is the coal-bearing Formation, which has five main mineable coal seams [4,45].

2.2.2. Underground Aquifer Characteristics

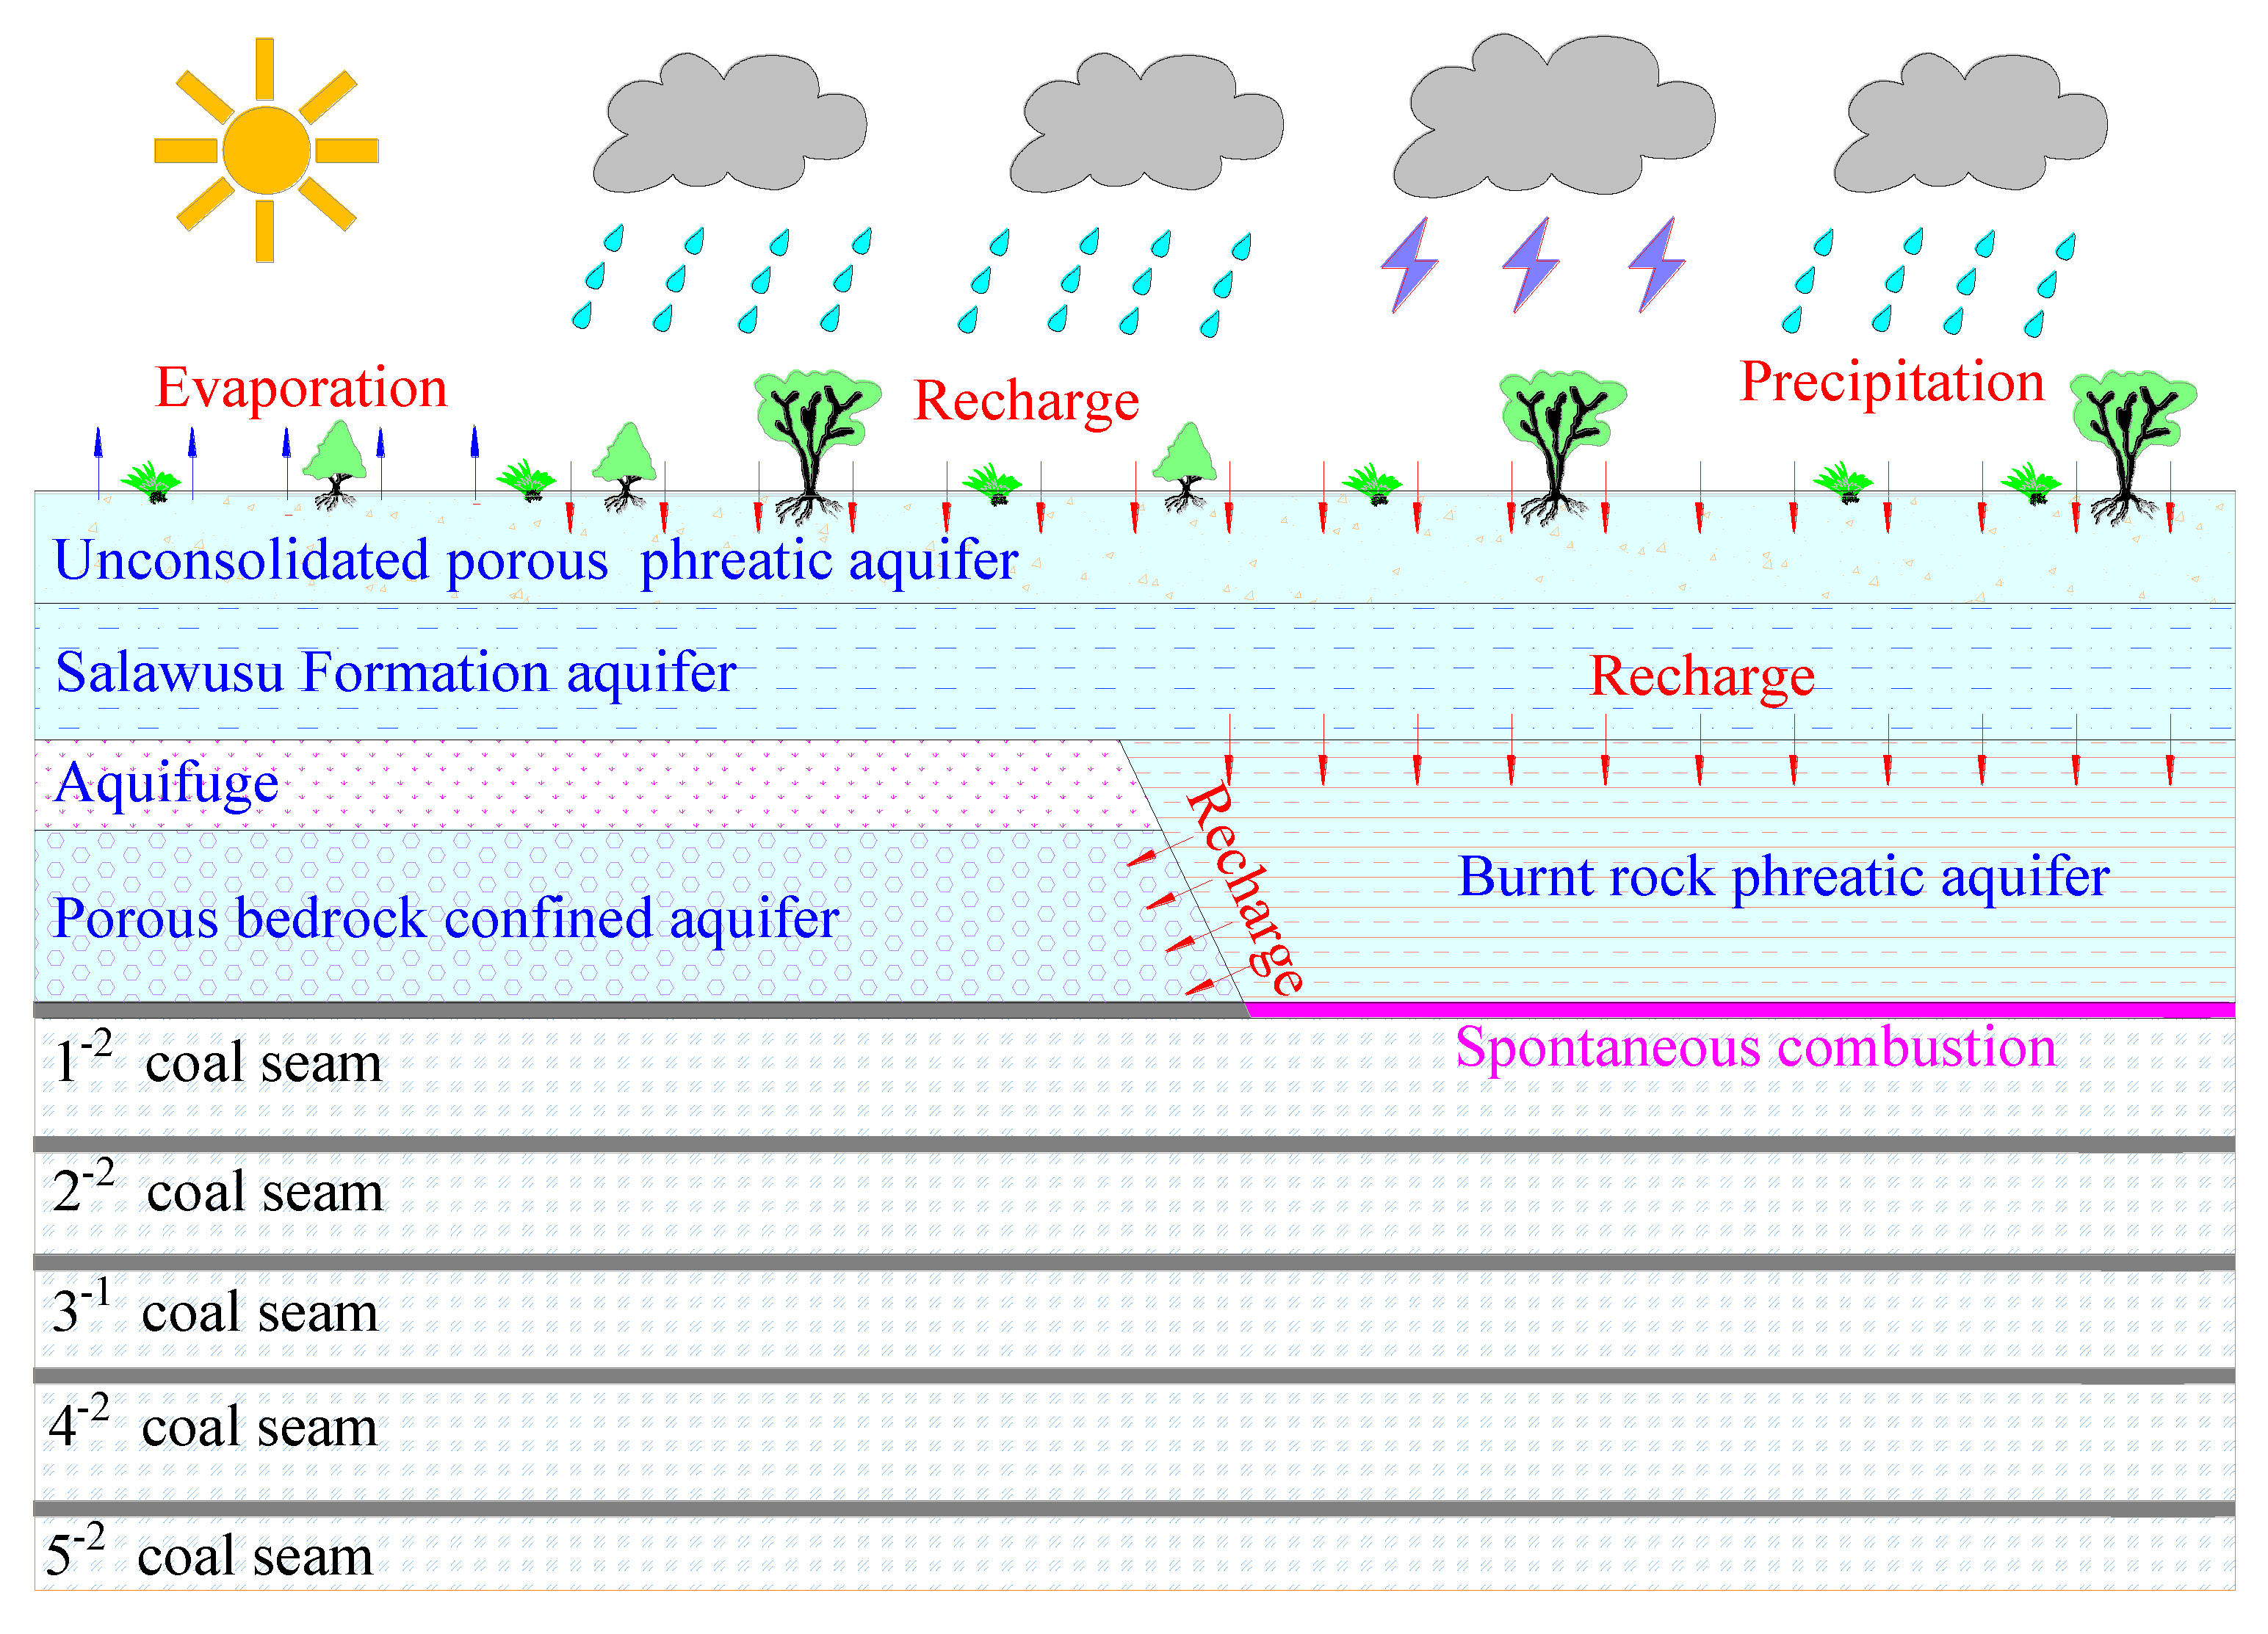
From top to bottom, there are total four types of aquifers in the Yu-Shen mining area, including: the unconsolidated porous phreatic aquifer, Salawusu phreatic aquifer, burnt rock phreatic aquifer, and porous bedrock confined aquifer, as shown in Figure 3. The unconsolidated porous phreatic aquifer is thin and is mainly recharged from precipitation, usually forming a complete aquifer with the underlying Salawusu Formation aquifer. The porous bedrock confined aquifer is characterized by a minor dimension of pore, high permeability, extremely low water abundance, and limited distribution range. The burnt rock phreatic aquifer itself cannot form a water-storing structure and is primarily recharged from the Salawusu phreatic aquifer. The Salawusu Formation aquifer is widely distributed in the mining area, and its thickness ranges from 0 m to 67.3 m. The buried depth of water table is generally less than 10 m [4,45]. As a result, it is the major aquifer in this area which needs to be considered during the evaluation of WRCCMA.

3. Identification of Influencing Factors of WRCCMA

The influence factors of WRCCMA are fuzzy and complex, which is consistent with the characteristics of fuzzy mathematics capable of solving many multi-leveled and fuzzy problems [11]. The fuzzy comprehensive evaluation method is based on fuzzy mathematics. It can transform qualitative evaluation into quantitative evaluation using the membership degree theory of fuzzy mathematics and is used to make an overall evaluation of objects restricted by many factors. The analytic hierarchy process (AHP)-fuzzy comprehensive evaluation method was employed and a triple-leveled structure model was constructed to identify the influencing factors of WRCCMA and calculate their weights. In the AHP model, six factors were selected as secondary indicators, i.e., overburden strata system, geological structure system, groundwater system, coal mining system, ecological system, and social system. Meanwhile, 15 factors, including the thickness of aquifuge, fault strength, mining method, vegetation coverage, and water resources per capita, were chose as tertiary indicators, as shown in Figure 4. By analyzing the results of field investigation and the existing research, we constructed the membership function of each influencing factor, which was the basis of evaluating the WRCCMA [11,49].

3.1. Overburden Strata System

1. The distance from aquifer to coal seam b
With the working face advancing, the overlying strata above the goaf will move and produce water conducted fractures because of losing the support from coal body. When the face reaches critical mining, if b is greater than the height of the WCFZ, the groundwater will not penetrate into the mined-out area, and a water inrush accident will not occur. However, when it is less than the height of the WCFZ and greater than the height of the caved zone, the fractures will develop and reach the aquifer. The groundwater table lowering and water resources loss will happen, but sand gushing in mines will be impossible. With the continuous advancement of the face after critical mining, the water flowing fissures will naturally be compacted and closed, and the water level may return to its original level on account of the recharge from precipitation, lateral runoff, and irrigation return flow. When b is less than the caved zone height, mining is prone to causing water and sand inrush. The groundwater enters a vicious cycle and water level will not recover [9,10,11]. In this situation, the grade of WRCCMA is the lowest. Therefore, the membership function is as follows:
μ 1 a ( b ) = { 1 , b > H d 0.3 , H k < b H d 0 , b H k ,
where Hk refers to the height of the caved zone (m); Hd refers to the height of WCFZ (m); b refers to the distance from an aquifer to coal seam (m).
2. Aquifuge thickness
The water-resisting property of the aquifuge is also an important indicator to evaluate the WRCCMA. The stronger the water-resistant ability, the lower risk of the groundwater will be lost due to mining. The scholars and experts engaged in mining generally believe that clay has a strong water-resistant property, and the clay stratum is usually thought of as an impermeable layer that the water bodies cannot flow through by gravity [31]. The authors found that the thickness of the aquifuge is the most important influencing factor of the water-resisting property. If it is less than 12 m, groundwater has a tendency to infiltrate into gob through the aquifuge, while if it is greater than 40 m, it can effectively prevent water seepage [4,32,57].
μ 1 b ( h ) = { 0 , h < 12 ( h 12 ) / 28 , 12 h 40 1 , h 40

3.2. Geological Structure System

The fault lowers the integrity and mechanical properties of the rock mass. The strata near the fault are usually broken, loose, and fractures are well-developed [33]. The faults can easily be connected with mining-induced water flowing fissures and form a complete water flowing channel for groundwater penetrating into the goaf. Moreover, those faults with high fault throw and long extension length also provide a large space for groundwater storage [34]. When the face advances ahead and the water conductive fractures reach the fault, the water bursting into the mine will take place. The greater the fault strength, the more the fractures are developed, which is unfavorable to WCCM, and therefore the lower the grade of WRCCMA.
The fault strength was selected as the evaluation indicator of WRCCMA. The formula of fault strength is as follows [35]:
S = i = 1 k l i h i / A ,
where li refers to the length of the i-th fault (m); hi refers to the fault throw of the i-th fault (m); A refers to the area of the block (m2); k refers to the number of faults in the block.
The membership function of fault strength is [36]:
μ 2 a ( S ) = { 1 , S < 0.22 ( 45 100 S ) / 23 , 0.22 S 0.45 0 , S 0.45 .

3.3. Groundwater System

1. Buried depth of groundwater table
The arid and semi-arid areas in Northwest China are ecologically fragile, and water resources are incredibly scarce [4]. Surface vegetation needs to absorb water from the aquifer through the root system to meet its own growth needs. The buried depth of aquifer can directly affect the luxuriance, degradation of plants, as well as the type, composition, and quantity of vegetation [58]. When the depth is too shallow, the water contained in the soil will flood the vegetation root system, which is not conducive to the respiration of the root system, thereby inhibiting the growth of vegetation. Furthermore, the shallow depth can easily lead to soil salinization and is harmful to the growth of vegetation. On the other hand, when the depth exceeds the critical depth from which the vegetation root can absorb groundwater, the vegetation will die due to water shortage [59]. The change of water level (D) before and after coal exploitation was selected as an evaluation indicator.
μ 3 a ( D ) = { 1 , D < 1 ( 8 D ) / 6.5 , 1.5 D 8 0 , D > 8 .
2. Recharge of groundwater
In arid and semi-arid areas, surface runoff is limited and the groundwater provides the important water supply for production and living. The groundwater is mainly recharged from precipitation, followed by lateral flow and irrigation infiltration. Thus, the coefficient of recharge from precipitation was selected as the evaluation standard and its formula is as follows [60]:
α = μ Δ h / R ,
where α refers to the coefficient of recharge from precipitation; μ refers to the specific yield; Δh refers to the rise of water level caused by cumulative recharges from precipitation in one year (mm); R refers to annual precipitation (mm).
The membership function is:
μ 3 b ( α ) = { 0 , α < 0.1 ( 10 α 1 ) / 3 , 0.1 α 0.4 1 , α 0.4 .
3. Groundwater mineralization (M)
When the buried depth of groundwater is within the suitable growth range of plants, the groundwater salinity has a significant impact on the growth of plants. The critical salinity of different plants’ withering and death vary. The suitable range for most vegetation is 0.5–3 g/L, and 3–5 g/L will not inhibit the vegetation growth. When it is greater than 8 g/L, most of the plants will perish and die [59,60].
μ 3 c ( M ) = { 1 , M 0.5 0.8 + ( 6 2 M ) / 25 , 0.5 < M 3.0 1.4 0.2 M , 3.0 < M 5.0 0.2 + ( 8 M ) / 15 , 5.0 < M 8.0 0 , M > 8.0
4. Water yield property of aquifer
The water abundance of an aquifer is related to its thickness and permeability. The greater the thickness and permeability of the aquifer, the stronger the ability for the aquifer to store water and receive replenishment and thereby the higher the water abundance. The water yield property has a positive correlation with the grade of WRCCMA. Based on the grading standard [4], the water-richness is divided into three grades, low, medium, and high, the corresponding uniform drawdown unit flow is q < 0.1 L⸱s−1⸱m−1, 0.1 L⸱s−1⸱m−1 < q ≤ 5.0 L⸱s−1⸱m−1, and q > 5.0 L⸱s−1⸱m−1, respectively.
μ 3 d ( q ) = { 1 , H i g h   o c c u r r e n c e 0.7 , M e d i u m   o c c u r r e n c e 0.3 , L o w   o c c u r r e n c e 0 , N o   o c c u r r e n c e
5. Groundwater quality
In the course of coal exploitation, the coal mine solid waste is accumulated to form a waste heap on the surface. The leaching water formed after the solid waste is washed, leached, or soaked will seriously pollute the shallow water and leads to water quality deterioration. This phenomenon will not only threaten the health of local citizens, but also do damage to the regional ecological environment conservation, contributing to the lowering of the WRCCMA grade. The comprehensive pollution index p was selected as the evaluation standard [11]:
μ 3 e ( p ) = { 1 , p 0.20 0.8 , 0.21 p 0.40 0.6 , 0.41 p 0.70 0.4 , 0.71 p 1.00 0.2 , 1.01 p 2.00 0 , p 2.00 .

3.4. Coal Mining System

1. Mining methods
The WCFZ heights of various mining methods are different [26]. As a consequence, the degrees of mining’s influence on overlying aquifer are varying. Longwall full-seam mining will only be implemented when a coal seam is thin while the overlying strata are thick, and the height of mining-induced WCFZ is less than the distance between the aquifer and the coal seam. Among all mining methods, the longwall full-seam mining has the lowest ability to preserve water bodies above colliery [27]. In arid and semi-arid mining areas, coal mining under aquifers usually adopts WCCM methods, including backfill mining, partial mining, and slice mining [28]. When other conditions are the same, compared to full-seam mining, slice mining can reduce the height of the WCFZ to a limited extent [29]. Partial mining, i.e., height-restricted mining, strip mining, and room and pillar mining, can reduce movement and deformation of the overlying strata and thereby the height of WCFZ. However, all of these partial mining are realized by abandoning coal pillars and restricting the mining thickness of coal seam, wasting large amounts of good coal resources [30]. The backfill mining replaces coal pillars by filling bodies to fill up the gob and support the roof and overlying strata. It is an effective mining method to control strata movement together with the development of water conducted fractures, and thus can better preserve overlying aquifer.
μ 4 a ( M m ) = { 1 , M m = B a c k f i l l   m i n i n g 0.7 , M m = P a r t i a l   m i n i n g 0.5 , M m = S l i c e   m i n i n g   0.3 , M m = L o n g w a l l   m i n i n g  
2. Mining parameters
Mining parameters, including mining height, advancing speed, width, and advancing length of longwall panel, are important factors of the WCFZ height [4]. If the water flowing fractures penetrate the overlying aquifer, groundwater water loss will happen and thereby lower the grade of WRCCMA. With the rapid advancement of the panel, the caved zone is gradually compacted [4]. Hence, the water flowing channel can be completely closed, and the water level above the goaf may recover progressively. The authors studied the relationship between the mining speed and the change of the groundwater table. The extent of crack development and penetrance under the condition of mining speed greater than 15 m/d is weaker than that less than 10 m/d. When the mining speed is less than 10 m/d, the water level drops significantly, while when it is greater than 15 m/d, its effect on the water level is not obvious. Furthermore, the greater the width and the advancing length of the coal face, the easier it is for the overlying strata to sink as a whole, and the less likely it is for water conductive fissures to develop. According to the results of on-site investigation and combined with the existing research, the multivariate membership function of mining parameters is [4,11]:
μ 4 b ( K ) = 0.055 0.02771 x 1 + 0.0155 x 2 +   0.002007 x 3 +   0.00023 x 4 ,
where x1 refers to the mining height; x2 refers to the mining speed; x3 refers to the width of face; x4 refers to the advancing length of face.
3. Surface deformation
The surface deformation will exert influence on the WRCCMA. Mining-induced land subsidence will alter the landform and the direction of rivers and affect the normal growth of plants, resulting in vegetation stunting and even vegetation coverage reduction. Moreover, land cracks developing down to the aquifer will change the coefficient of recharge from precipitation and affect the recharge, runoff, and discharge of groundwater. Hence, the original balance and circulation state of groundwater will be broken. The subsidence coefficient q was used as evaluation standard and its formula is as follows [5,10]:
q = W max / M cos α ,
where Wmax refers to the maximum subsidence value after critical mining (m); M refers to the thickness of coal seam (m); α refers to the dip angle of coal seam (°).
In light of the subsidence factors of different lithological strata measured in some coal mines, the membership function is:
μ 4 c ( q ) = { 1 , q < 0.27 ( 0.55 q ) / 0.28 , 0.27 q 0.55 0 , q > 0.55 .

3.5. Ecological System

1. Vegetation coverage (β)
Vegetation plays a significant role in maintaining ecological balance and curbing land desertification. There are three types of water supplies for vegetation, i.e., atmospheric precipitation, surface water, and groundwater, among which the groundwater is the main source of water supply because rainfall and surface runoff are minimal. The circulation and balance of water resources control the growth and types of vegetation, alteration in circulation and balance will unavoidably lead to changes in vegetation coverage. Vegetation coverage is closely related to the WRCCMA and is an intuitive expression of it. Up to now, there has been no acknowledged classification standard for vegetation coverage in the Yu-Shen mining area. Based on the ecological characteristics of arid and semi-arid areas and referring to the classification standards adopted in neighboring areas, its grade was divided into five levels [59]:
μ 5 a ( β ) = { 1 , β > 80 % 1.5 β 0.2 , 60 % < β 80 % β + 0.1 , 40 % < β 60 % 1.5 β 0.1 , 20 % β 40 % 0 , β < 20 % .
2. Total water resources
The total water resources are closely correlated to the eco-environment and human social activities and are an important factor affecting the WRCCMA. The draining depressurization, which uses artificial drainage to lower the water level and head pressure, makes the amounts of water resources continuously decrease for a long period of time [60]. Besides this, as the evaporative capacity in arid and semi-arid area is high, the discharged mine water will suffer from evaporation loss. Taking the ratio of total water resources after and before mining (η) as the evaluation standard:
μ 5 b ( η ) = { 0 , η < 40 % 2 η 0.8 , 40 % η 90 % 1 , η 90 % .

3.6. Social System

1. Water utilization rate (υ)
The utilization rate of water resources is a main indicator that reflects whether the WRCCMA has the potential for improvement. Taking into account the requirements of eco-environment conservation and biodiversity, the development and utilization rate of water resources should not exceed 30%. If it exceeds 40%, the sustainable development of water resources will be affected [17].
μ 6 a ( υ ) = { 1 , υ < 20 % 1.5 2.5 υ , 20 % υ 60 % 0 , υ > 60 %
2. Water resources per capita (φ)
Water resources per capita are an intuitive reflection of WRCCMA. A low level means that water resources cannot meet the water demand of humans and thus, the grade of WRCCMA is low, and vice versa. Water resources per capita of extremely severe, severe, medium, and slight water shortage areas are <500 m3, 500–1000 m3, 1000–2000 m3, 2000–3000 m3, respectively [23].
μ 6 b ( φ ) = { 1 , φ > 3000 0.0002 φ + 0.4 , 2000 φ 3000 0.0003 φ + 0.2 , 1000 φ 2000 0.0006 φ 0.1 , 500 φ 1000 0 , φ < 500

4. Mathematical Model of WRCCMA

4.1. Mathematical Modeling

In the AHP multilevel model, level A represents the overall goal, level B denotes the level of evaluation criteria, and level C is comprised of sub-criteria. Judgment matrices were developed by this multilevel structure to realize the numerical expression and quantification of WRCCMA [61]. The evaluation factors are as follows:
U = {u1, u2, u3, u4, u5, u6}.
Let the fuzzy subset V denote the discourse domain of WRCCMA. The Φ value, indicating the level of WRCCMA, is the membership degree of U in V. The domain of V is defined by Equation (20):
V = {I, II, III, IV, V}.
The following equation can calculate the Φ value:
Φ = i = 1 n w i u i ( u i ) ,
where ui(ui) refers to the membership degree of the i-th factor and wi refers to the weight of the i-th factor.
The grade of WRCCMA can be classified as carrying surplus, capable of carrying, moderate carrying, slightly over-carrying, and severely over-carrying [4,11], as shown in Table 1.

4.2. Weight Determination

Researchers and scholars engaged in coal mining, hydrogeology, eco-environment, and WRCC have been invited to assign the weights of the factors of this AHP model of WRCCMA. In terms of the relative weight evaluation table of the factors from the experts, the following judgment matrices were obtained:
W A ~ B = [ 1 2 1 / 5 1 / 4 1 1 1 / 2 1 1 / 8 1 / 7 1 / 2 1 / 2 5 8 1 1 5 5 4 7 1 1 4 4 1 2 1 / 5 1 / 4 1 1 1 2 1 / 5 1 / 4 1 1 ] W B 3 ~ C = [ 1 4 5 2 2 1 / 4 1 1 1 / 2 1 / 2 1 / 5 1 1 2 / 5 2 / 5 1 / 2 2 5 / 2 1 1 1 / 2 2 5 / 2 1 1 ]
W B 4 ~ C = [ 1 3 2 1 / 3 1 1 / 2 1 / 2 2 1 ]   W B 5 ~ C = [ 1 1 / 2 2 1 ]   W B 6 ~ C = [ 1 1 / 4 4 1 ]   W B 1 ~ C = [ 1 2 1 / 2 1 ]
The relative weight evaluation of sub-factors of the groundwater system from the experts was taken as an example. There are three steps totally to calculate the weights of these sub-factors of matrix W B 3 ~ C .
Step 1: Calculating the largest eigenvalue and its eigenvector
The largest eigenvalue λmax of the matrix W B 3 ~ C is 5.0059 and the eigenvector W = (0.4085, 0.0977, 0.0854, 0.2042, 0.2042).
Step 2: Testing the random coincidence coefficient C.R.
Equations (22) and (23) were used to conduct the consistency test:
C . I . = ( λ max n ) / ( n 1 ) ,
where C.I. refers to the consistency indicator; λmax refers to the largest eigenvalue; n refers to the number of the influencing factors of this matrix.
C . R . = ( C . I . ) / ( R . I . ) ,
where C.R. refers to the consistency ratio and R.I. refers to the average consistency index.
If C.R. < 0.1, the relative weights are reasonable. Otherwise, the judgment matrix needs to be adjusted by reassigning the weights of these sub-factors. The C.R. of the matrix W B 3 ~ C is 0.0013 < 0.1, indicating the relative weight from the experts is reasonable and acceptable.
Step 3: Calculating the weights of the influencing factors in the premise of C.R. passing the check.
The weight of the groundwater system is 0.3795. Then, 0.3795 × W = (0.1550, 0.0371, 0.0324, 0.0775, 0.0775) is the weight of the five sub-factors of groundwater system.
The weights of the other five matrixes were also calculated using this method. The weight distribution is as shown in Table 2.

5. Model Verification and WRCCMA Prediction

5.1. Model Verification

5.1.1. Numerical Simulation of Groundwater Level Decline

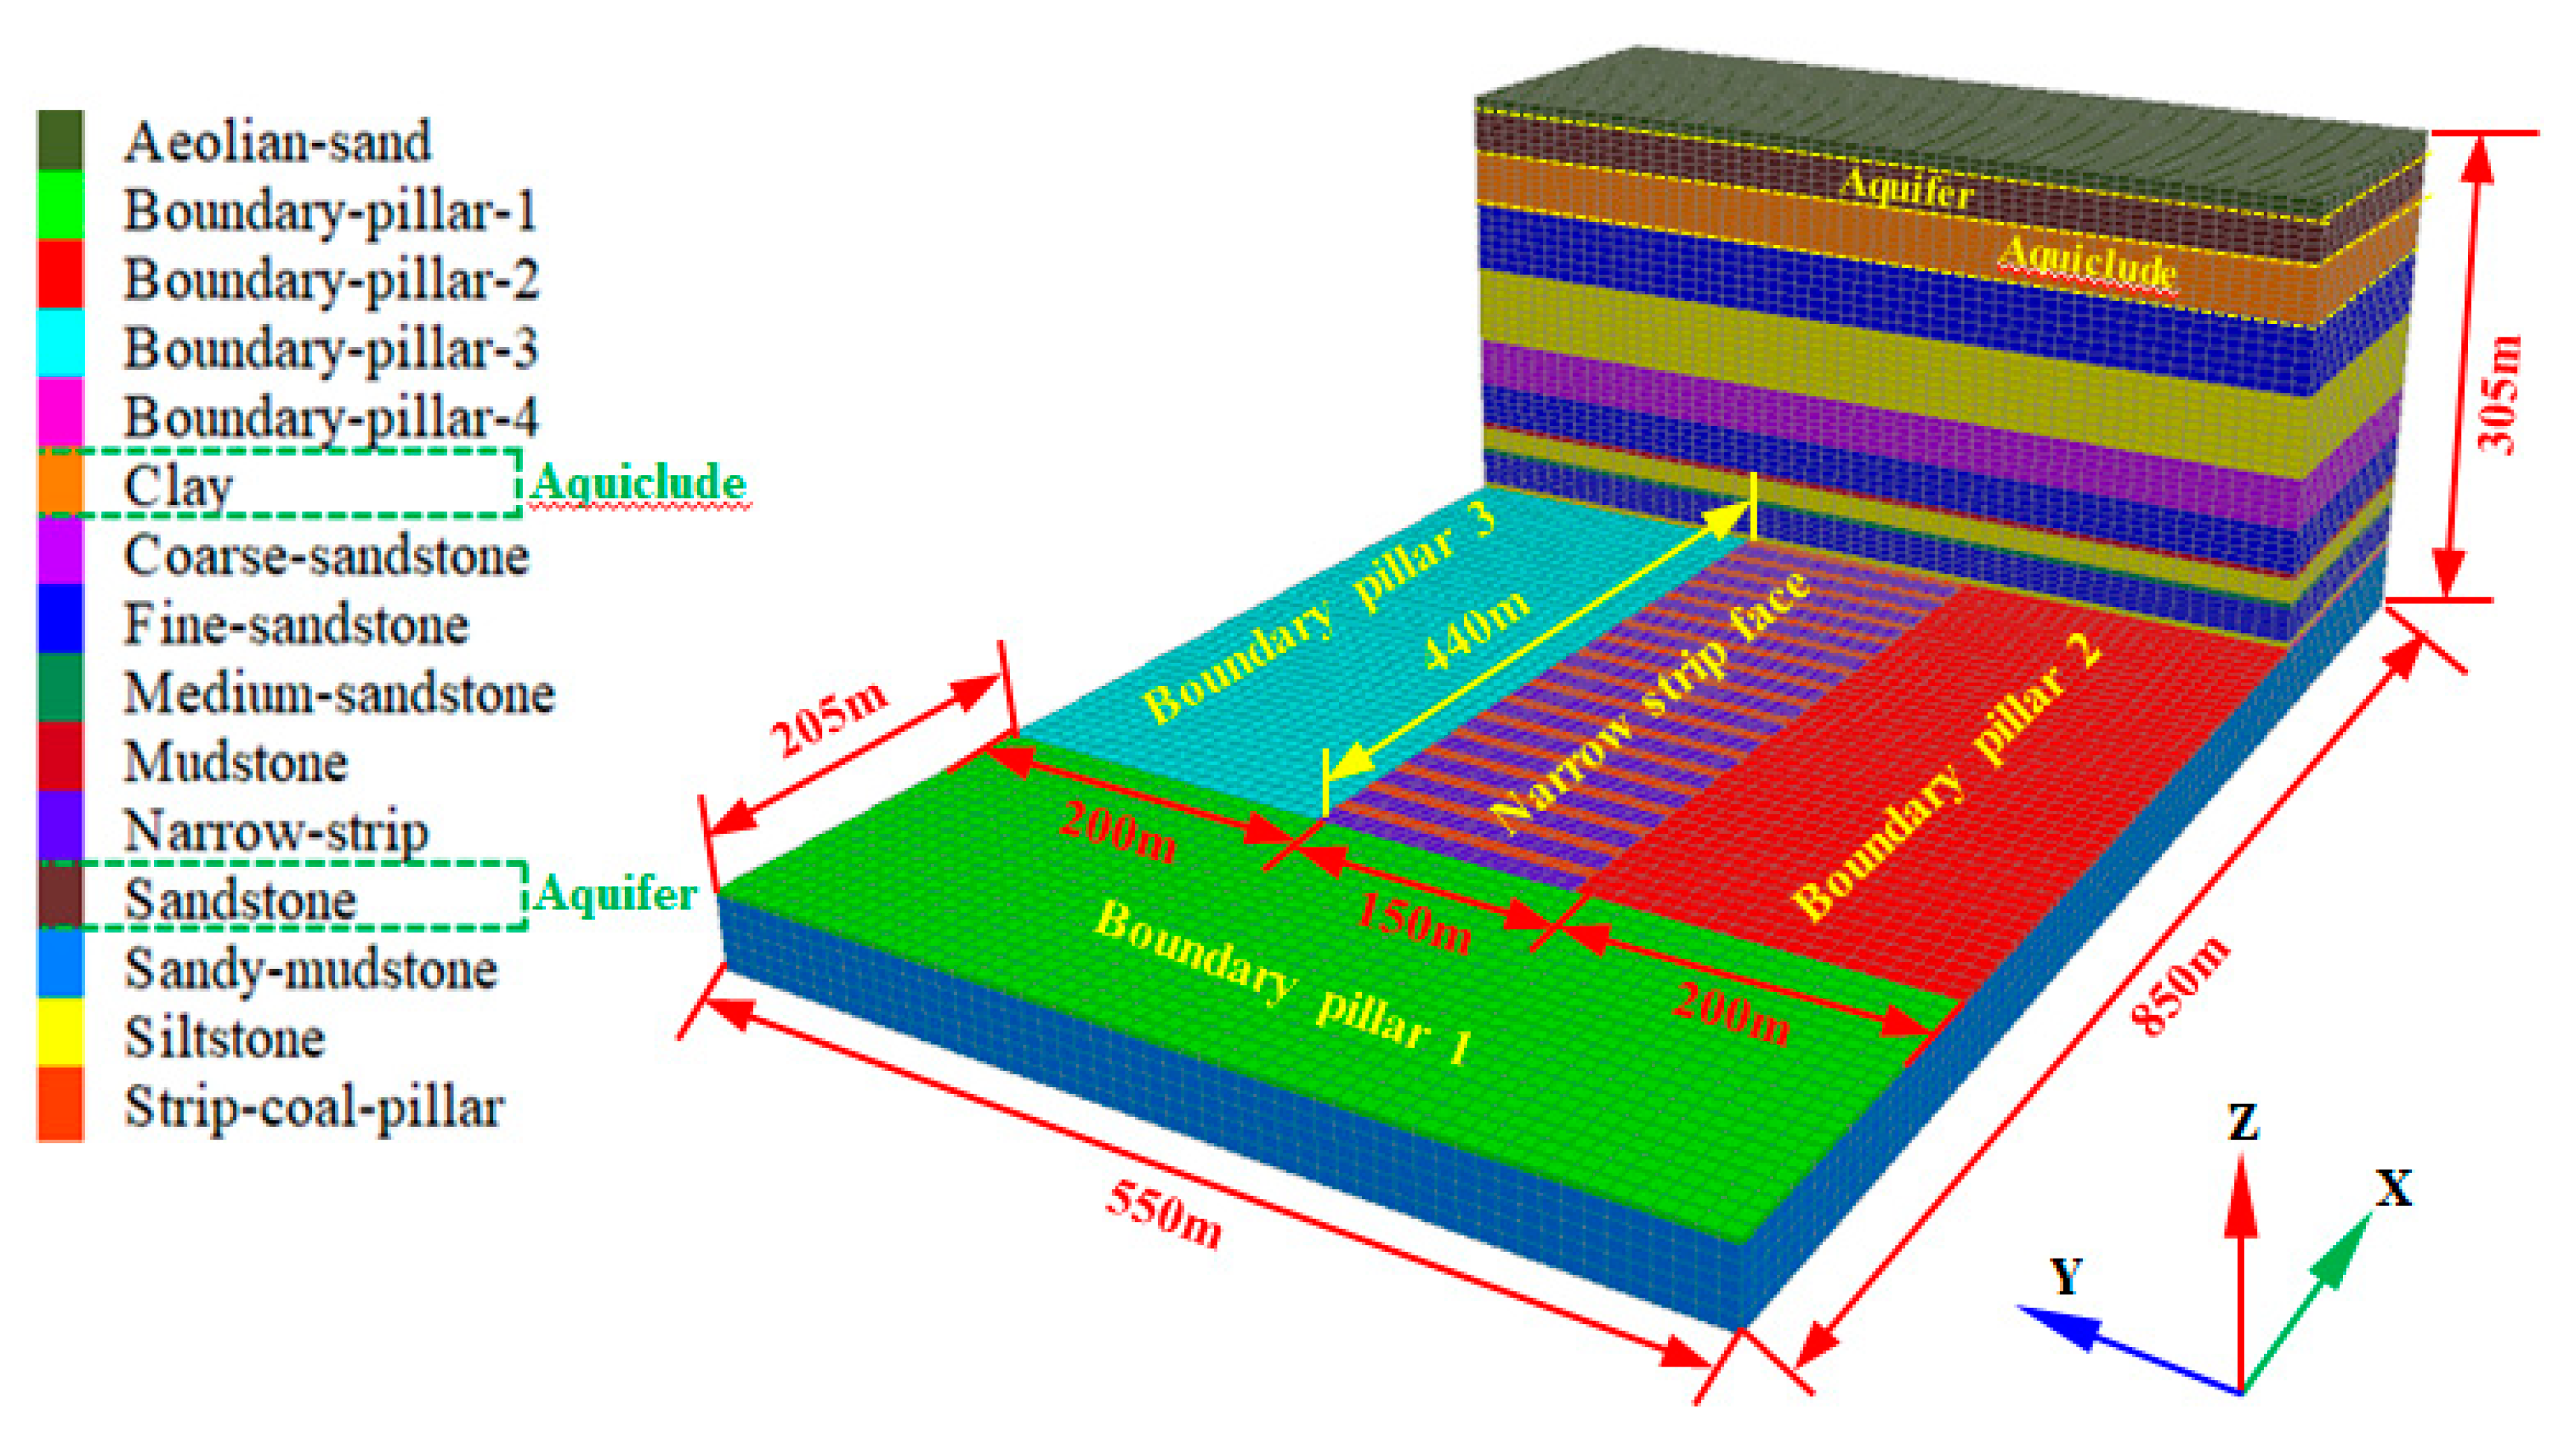
The mathematical evaluation model was applied to Yubujie colliery to verify its reliability and rationality. The narrow strip WCCM method was used in Yubujie colliery. The narrow strip that was mined was 12 m wide, and the strip coal pillars left unmined was 8 m wide [4], as shown in Figure 5. Since there were no data on water level drop in this colliery, fluid-solid coupling module of Fast Lagrangian Analysis of Continua (FLAC3D) finite element software was employed to simulate groundwater table lowering under narrow strip mining. The numerical simulation model was as shown in Figure 6.
Based on the stratigraphic column of Yubujie colliery and taking into account the boundary effect and critical mining, the dimension of the model was determined to be 850 m × 550 m × 305 m (X × Y × Z). The mining height was 6 m and the size of the narrow strip working face was 450 m × 150 m (Strike × Dip). The width of the boundary coal pillars was 205 m in strike direction and 200 m in dip direction. The front and rear sides of the model were fixed in the X direction, the left and right sides were fixed in the Y direction, and the bottom boundary was fixed in the Z direction. The Mohr-Coulomb model was used during the calculation. The “CONGIG fluid” code was used to enter the seepage mode, and the “Initial pp” code was employed to set the pore pressure and pore water pressure gradient. The seepage mode was set as the isotropic. The permeability coefficient of the clay (aquifuge) was 10–13m2/Pa-sec. Other hard rocks, including sandstone, fine sandstone, medium sandstone siltstone, gritstone, and mudstone had a larger permeability coefficient than clay. The porosity was set to default value 0.5, and the tensile strength of fluid was set to 1015 Pa. The Biot coefficient was set to 1, and the saturation was set to 1. The top sandstone (aquifer) was set as a free surface, and the surrounding boundary and bottom boundary were set as permeable boundaries by using the “Fix pp” code. Fluid could flow into or out of the model along the permeable boundary. The mechanical parameters of the rock were as shown in Table 3. The groundwater depression cone and the contour map of water table drop were as shown in Figure 7. The numerical simulation results show that the water level dropped by 1.32 m, suggesting a narrow variation in groundwater levels.

5.1.2. The Evaluation of the WRCCMA for Yubujie Colliery

The distance from the aquifer to the coal seam of Yubujie colliery is 220 m on average, and the thickness of the aquifuge varies from 20 to 90 m. The height of the caved zone and the height of WCFZ are 33.9 m and 158.8 m, respectively. There is no large fault in the Yubujie colliery and the fault strength is less than 0.22. After mining, the water level has decreased by 1.32 m, and the coefficient of recharge from precipitation is 18.4%. Moreover, the salinity ranges from 270.2 to 675.4 mg/L and the aquifer is highly water-rich. The comprehensive water pollution index p is less than 0.2. The thickness of the coal seam varies from 4.1 to 7.2 m, with an average of 6.0 m, and the subsidence coefficient is 0.18. The vegetation coverage of Yubujie colliery is 64%, and the ratio of total water resources after mining and before mining is 90.4%. The water resources utilization is 34.04%. The per capita water resources vary from 1000 to 2000 m3/person [57]. The comprehensive evaluation value Φ was calculated to be 0.84, indicating the WRCCMA is capable of carrying.

5.1.3. The Changes in Vegetation Coverage and Surface Deformation after Mining

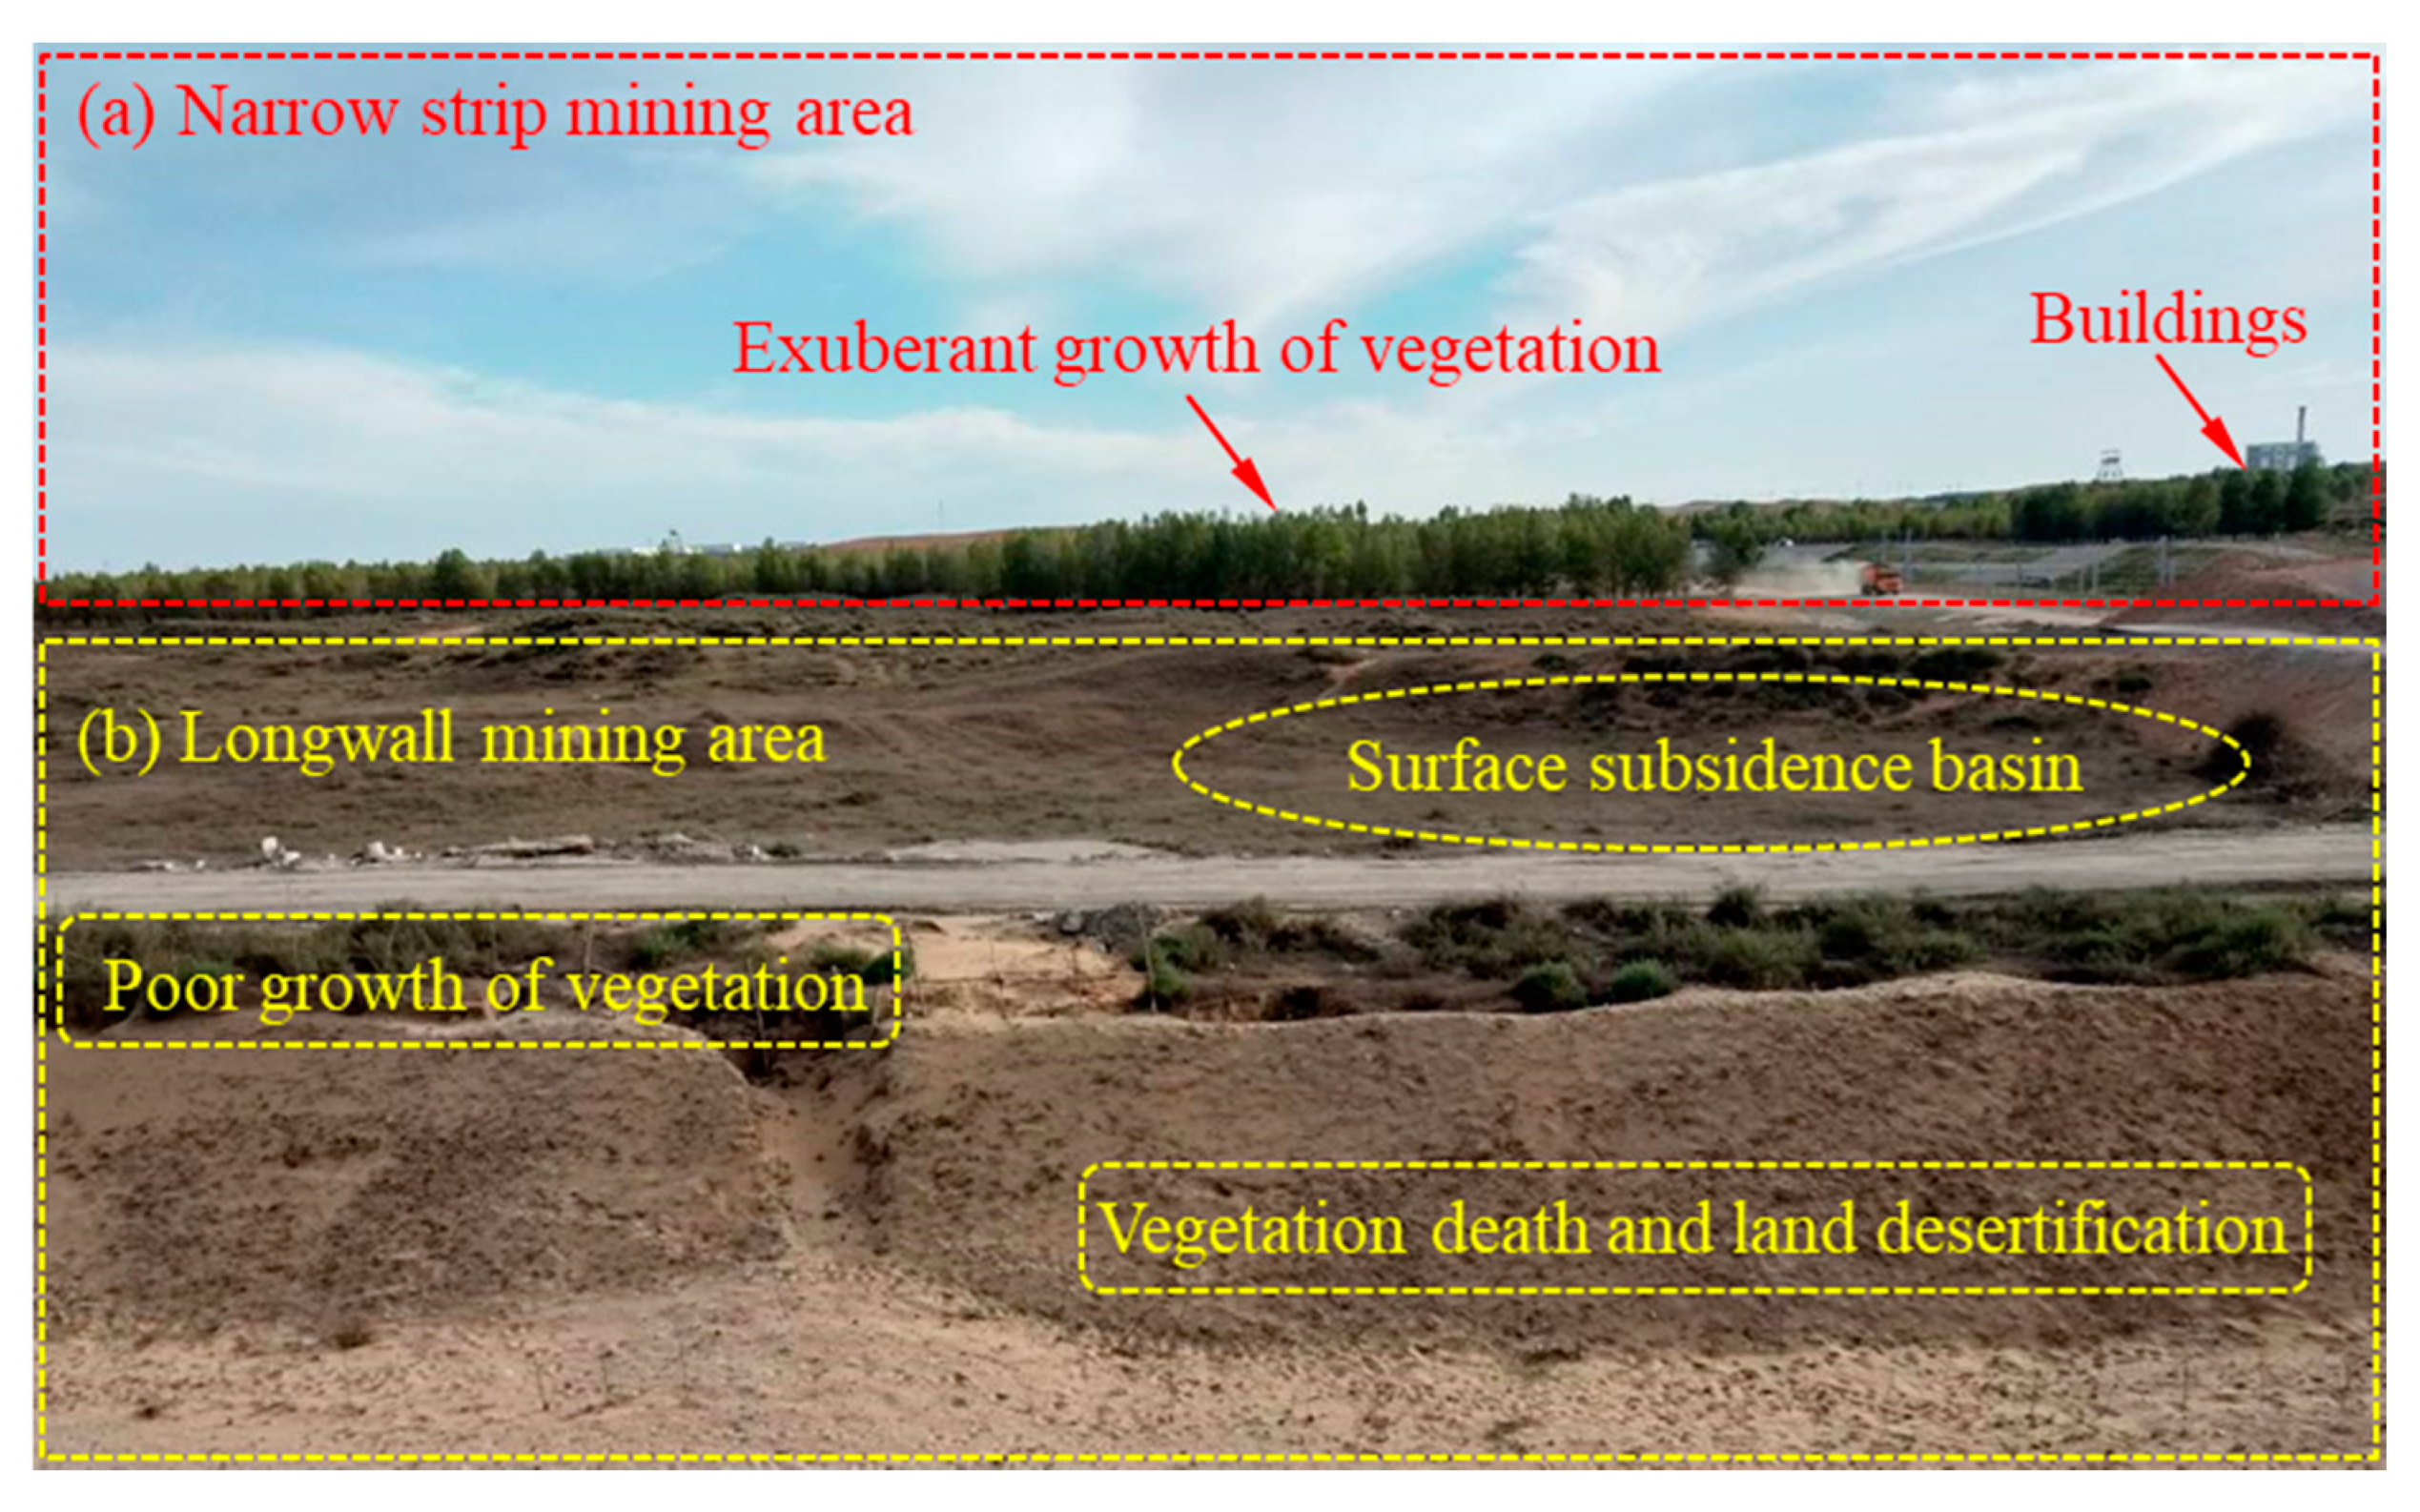
Vegetation coverage and landform alteration is the direct reflection of the WRCCMA. An on-site investigation was conducted in Yubujie colliery, as shown in Figure 8. The area framed with a red dash line is a part of Yubujie colliery, which used the narrow strip WCCM method. The vegetation grew luxuriantly after mining in this area, showing that the grade of the WRCCMA is high, and water resources are sufficient to meet the demand of the surface vegetation. By contrast, the area framed in the yellow dash line is the adjacent coal mine of Yubujie colliery, which used the traditional longwall full-seam mining method. It can be seen that after mining, a small subsidence basin appeared above the coal face, and the trend of vegetation deterioration and land desertification is conspicuous. Hence, from the perspective of the changes in the vegetation coverage and the ground deformation after mining, the impacts of different mining methods on the WRCCMA are also obviously different. This also confirms that it is reasonable for experts to give high scores to mining methods in the fuzzy mathematical evaluation model.

5.2. WRCCMA Prediction for Yu-Shen Mining Area

By analyzing the collected data as well as the existing research, the membership degree of each evaluation indicator was determined. Subsequently, combined with the weight distribution, we calculated the comprehensive evaluation value Φ of each drill hole under longwall full-seam mining in the Yu-Shen mining area.

5.2.1. Membership Degree Determination

1. Overburden strata system
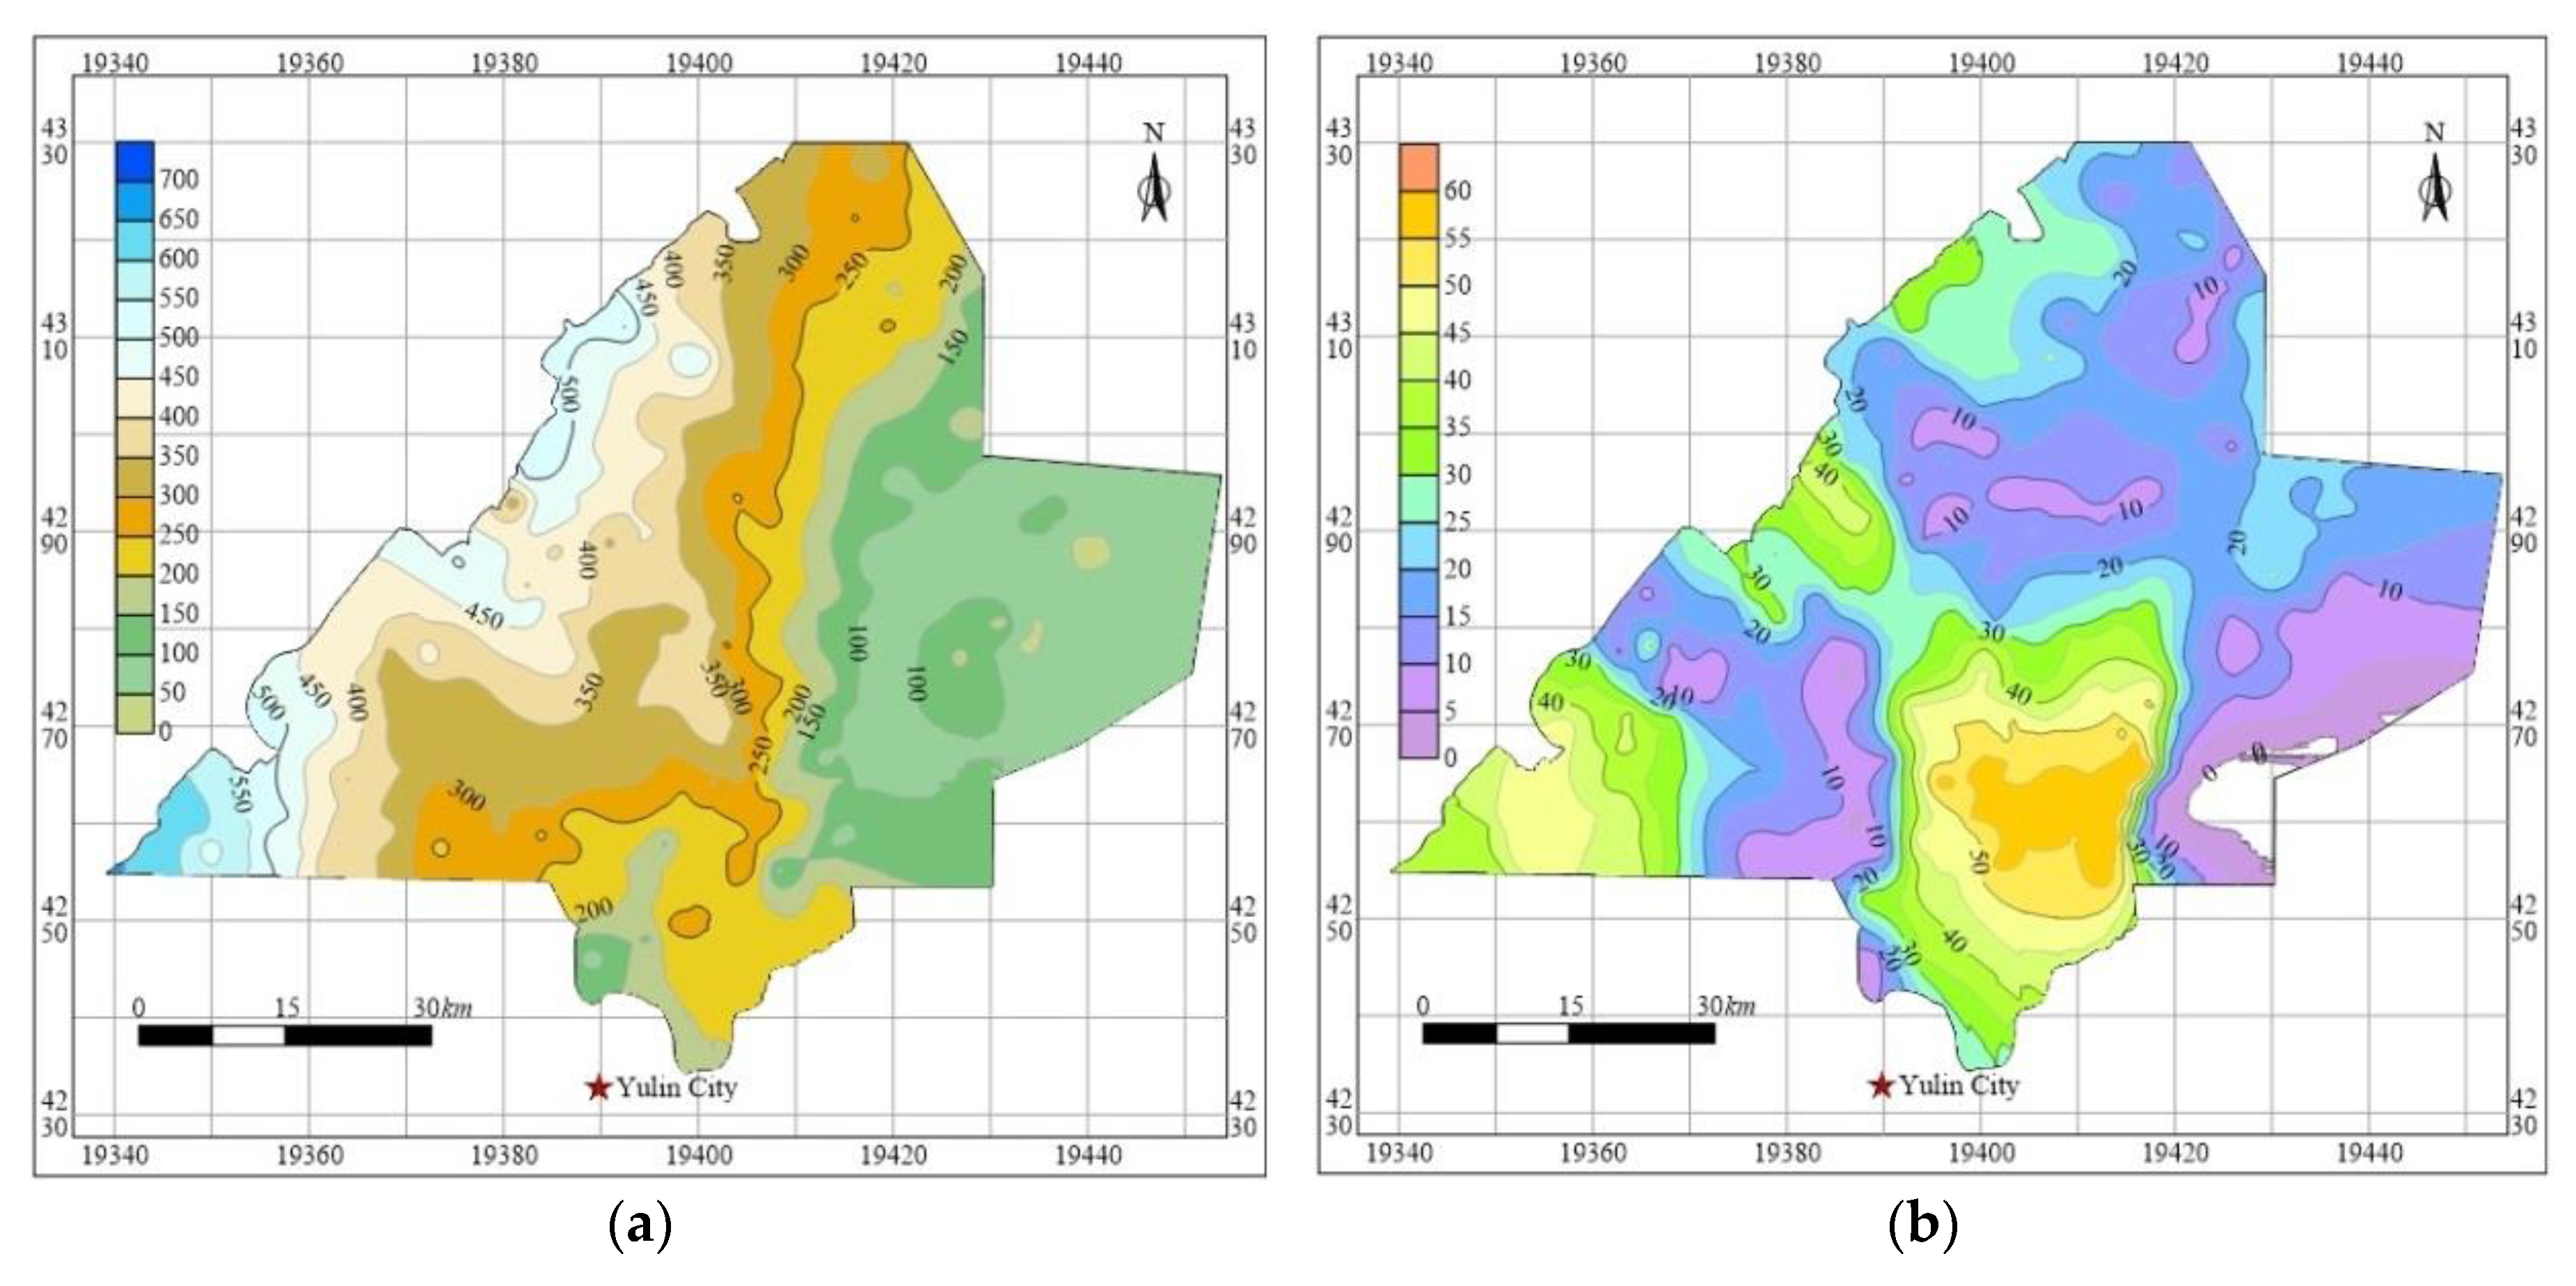
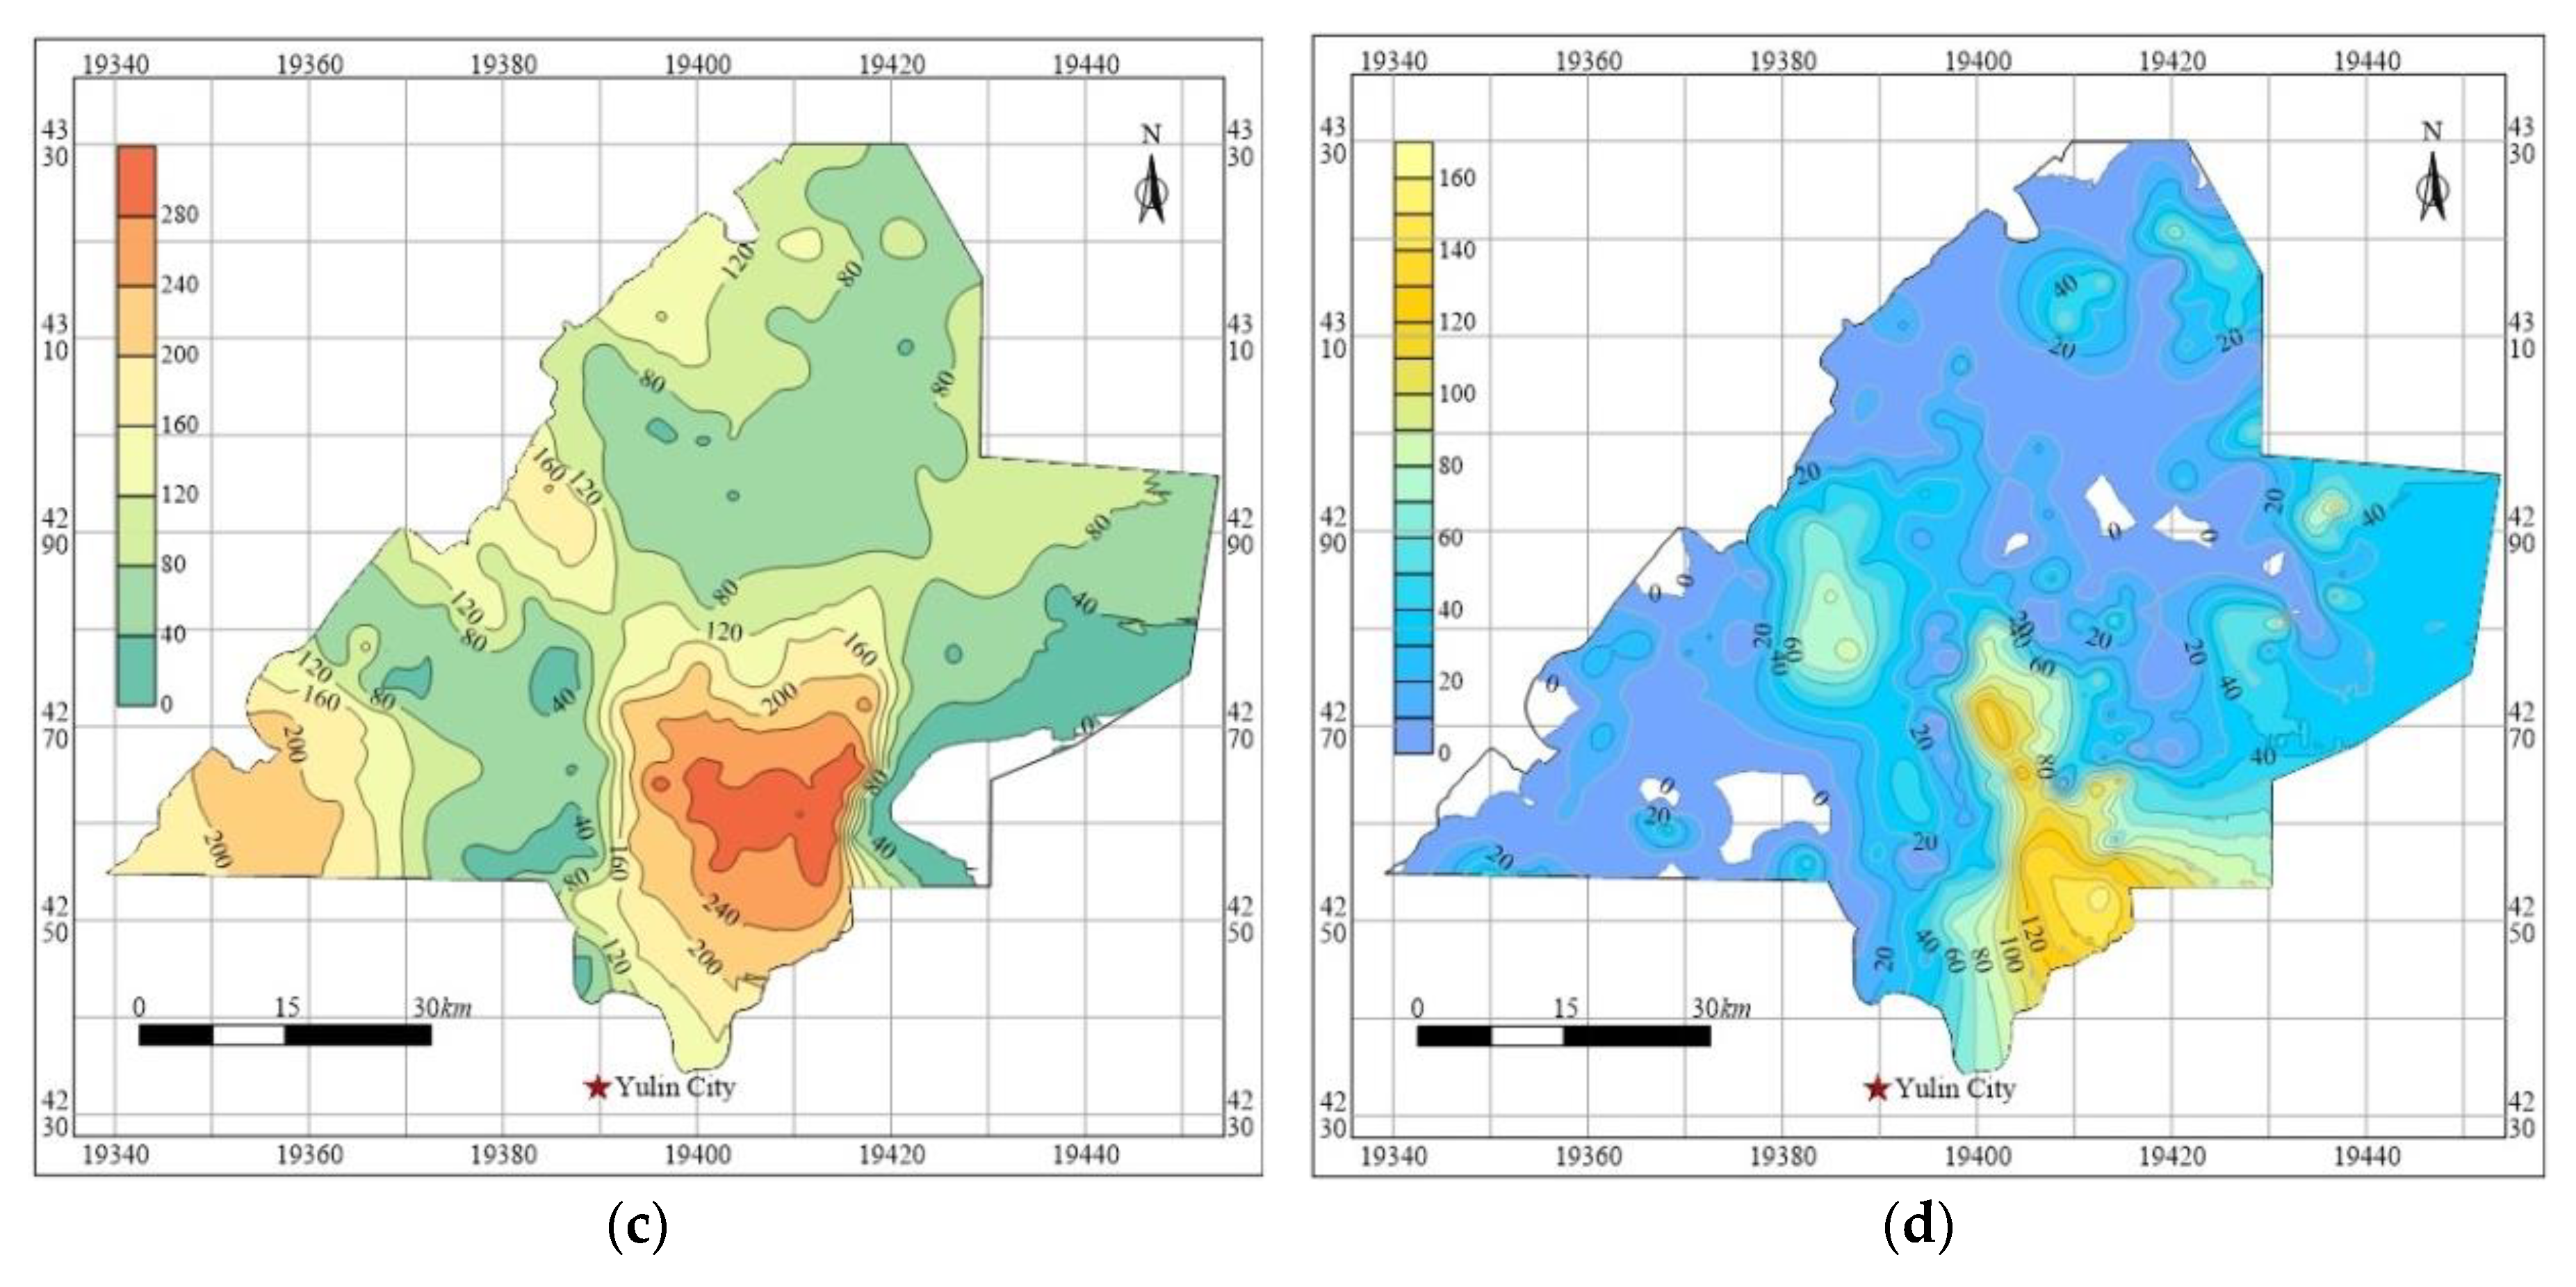
Based on the drilling data, we obtained the distance from the aquifer to the first-mined coal seam by subtracting the buried depth of the Salawusu Formation aquifer from the buried depth of the first-mined coal seam, and its contour map was plotted using Kriging method, as shown in Figure 9.
Many scholars have done a lot of theoretical and practical research on the height of WCFZ in East China. The empirical formulae for calculating the height of WCFZ, which are suitable for different overburden lithology and dip angles of coal seams, were given when adopting longwall mining method [27,28,29]. However, most of the main mineable coal seams in eastern mining area belong to Permian system, while the Yu-Shen mining area is mainly Jurassic coal seam [4,30]. The hydrogeological and geological engineering conditions in this area are significantly different from those in the eastern mining area [60]. Thus, the traditional prediction formulae of WCFZ height are inapplicable to Yu-Shen mining area. In this paper, field measurement and numerical simulation were employed to determine the heights of the caved zone and the WCFZ. The caved zone height and WCFZ height of Yuyang colliery, Yushuwan colliery, Jinjitan colliery, and Hanglaiwan colliery were obtained by drilling fluid consumption observation assisted with the core engineering geological logging, water pressure test in the borehole, television logging, and geophysical logging. The mining height of these coal mines varies from 3.5 to 5.5 m, which cannot represent the whole Yu-Shen mining area. Therefore, the universal distinct element code (UDEC) was used to establish different numerical simulation models of various stratigraphic structures (sand soil bedrock, sand bedrock, bedrock, soil-bedrock) and different mining height (2–12 m). During the numerical simulation, the physical and mechanical parameters of these models were continuously optimized until the simulation results were consistent with the measured results. Then, the formulae for predicting the height of the caved zone and WCFZ in the Yu-Shen mining area were obtained by using linear regression, as shown in Formulas (24) and (25). On the basis of the formulae and the coal seam thickness of different drill holes, we calculated the height of the caved zone and the WCFZ of boreholes in the Yu-Shen mining area, and plotted their contour maps, as shown in Figure 9. The subordinate degree of the distance from aquifer to coal seam of each borehole was then determined.
H c = 100 M 0.6 M + 14.1 ,
where Hc is the height of caved zone (m) and M is the mining height (m).
{ H f = 21.75 M + 28.28 R 2 = 0.99 ( Sand-soil-bedrock ) H f = 22.20 M + 37.13 R 2 = 0.97 ( Sand-bedrock ) H f = 16.70 M + 30.80 R 2 = 0.97 ( Bedrock ) H f = 21.97 M + 28.42 R 2 = 0.98 ( Soil-bedrock ) ,
where Hf is the height of WCFZ (m) and M is the mining height (m).
The aquifuge in the mining area mainly consists of the loess in Quaternary Middle Pleistocene Lishi Formation and the red soil in Neogene Pliocene Baode Formation. The Lishi Formation is a loess formation composed of grayish-yellow sandy loam and silty clay, and its thickness ranges from 0 to 109.5 m, with an average of 23.0 m. The Baode Formation is a red soil formation comprised of brown-red clay and loam, with a thickness of 30 m on average [4,60]. The contour map of the thickness of aquifuge is shown in Figure 9.
2. Geological structure system.
According to the geological exploration and seismic exploration results, the geological structure of the Yu-Shen mining area is simple, and there are seven normal faults identified in total. The fault characteristics are shown in Table 4.
3. Groundwater system
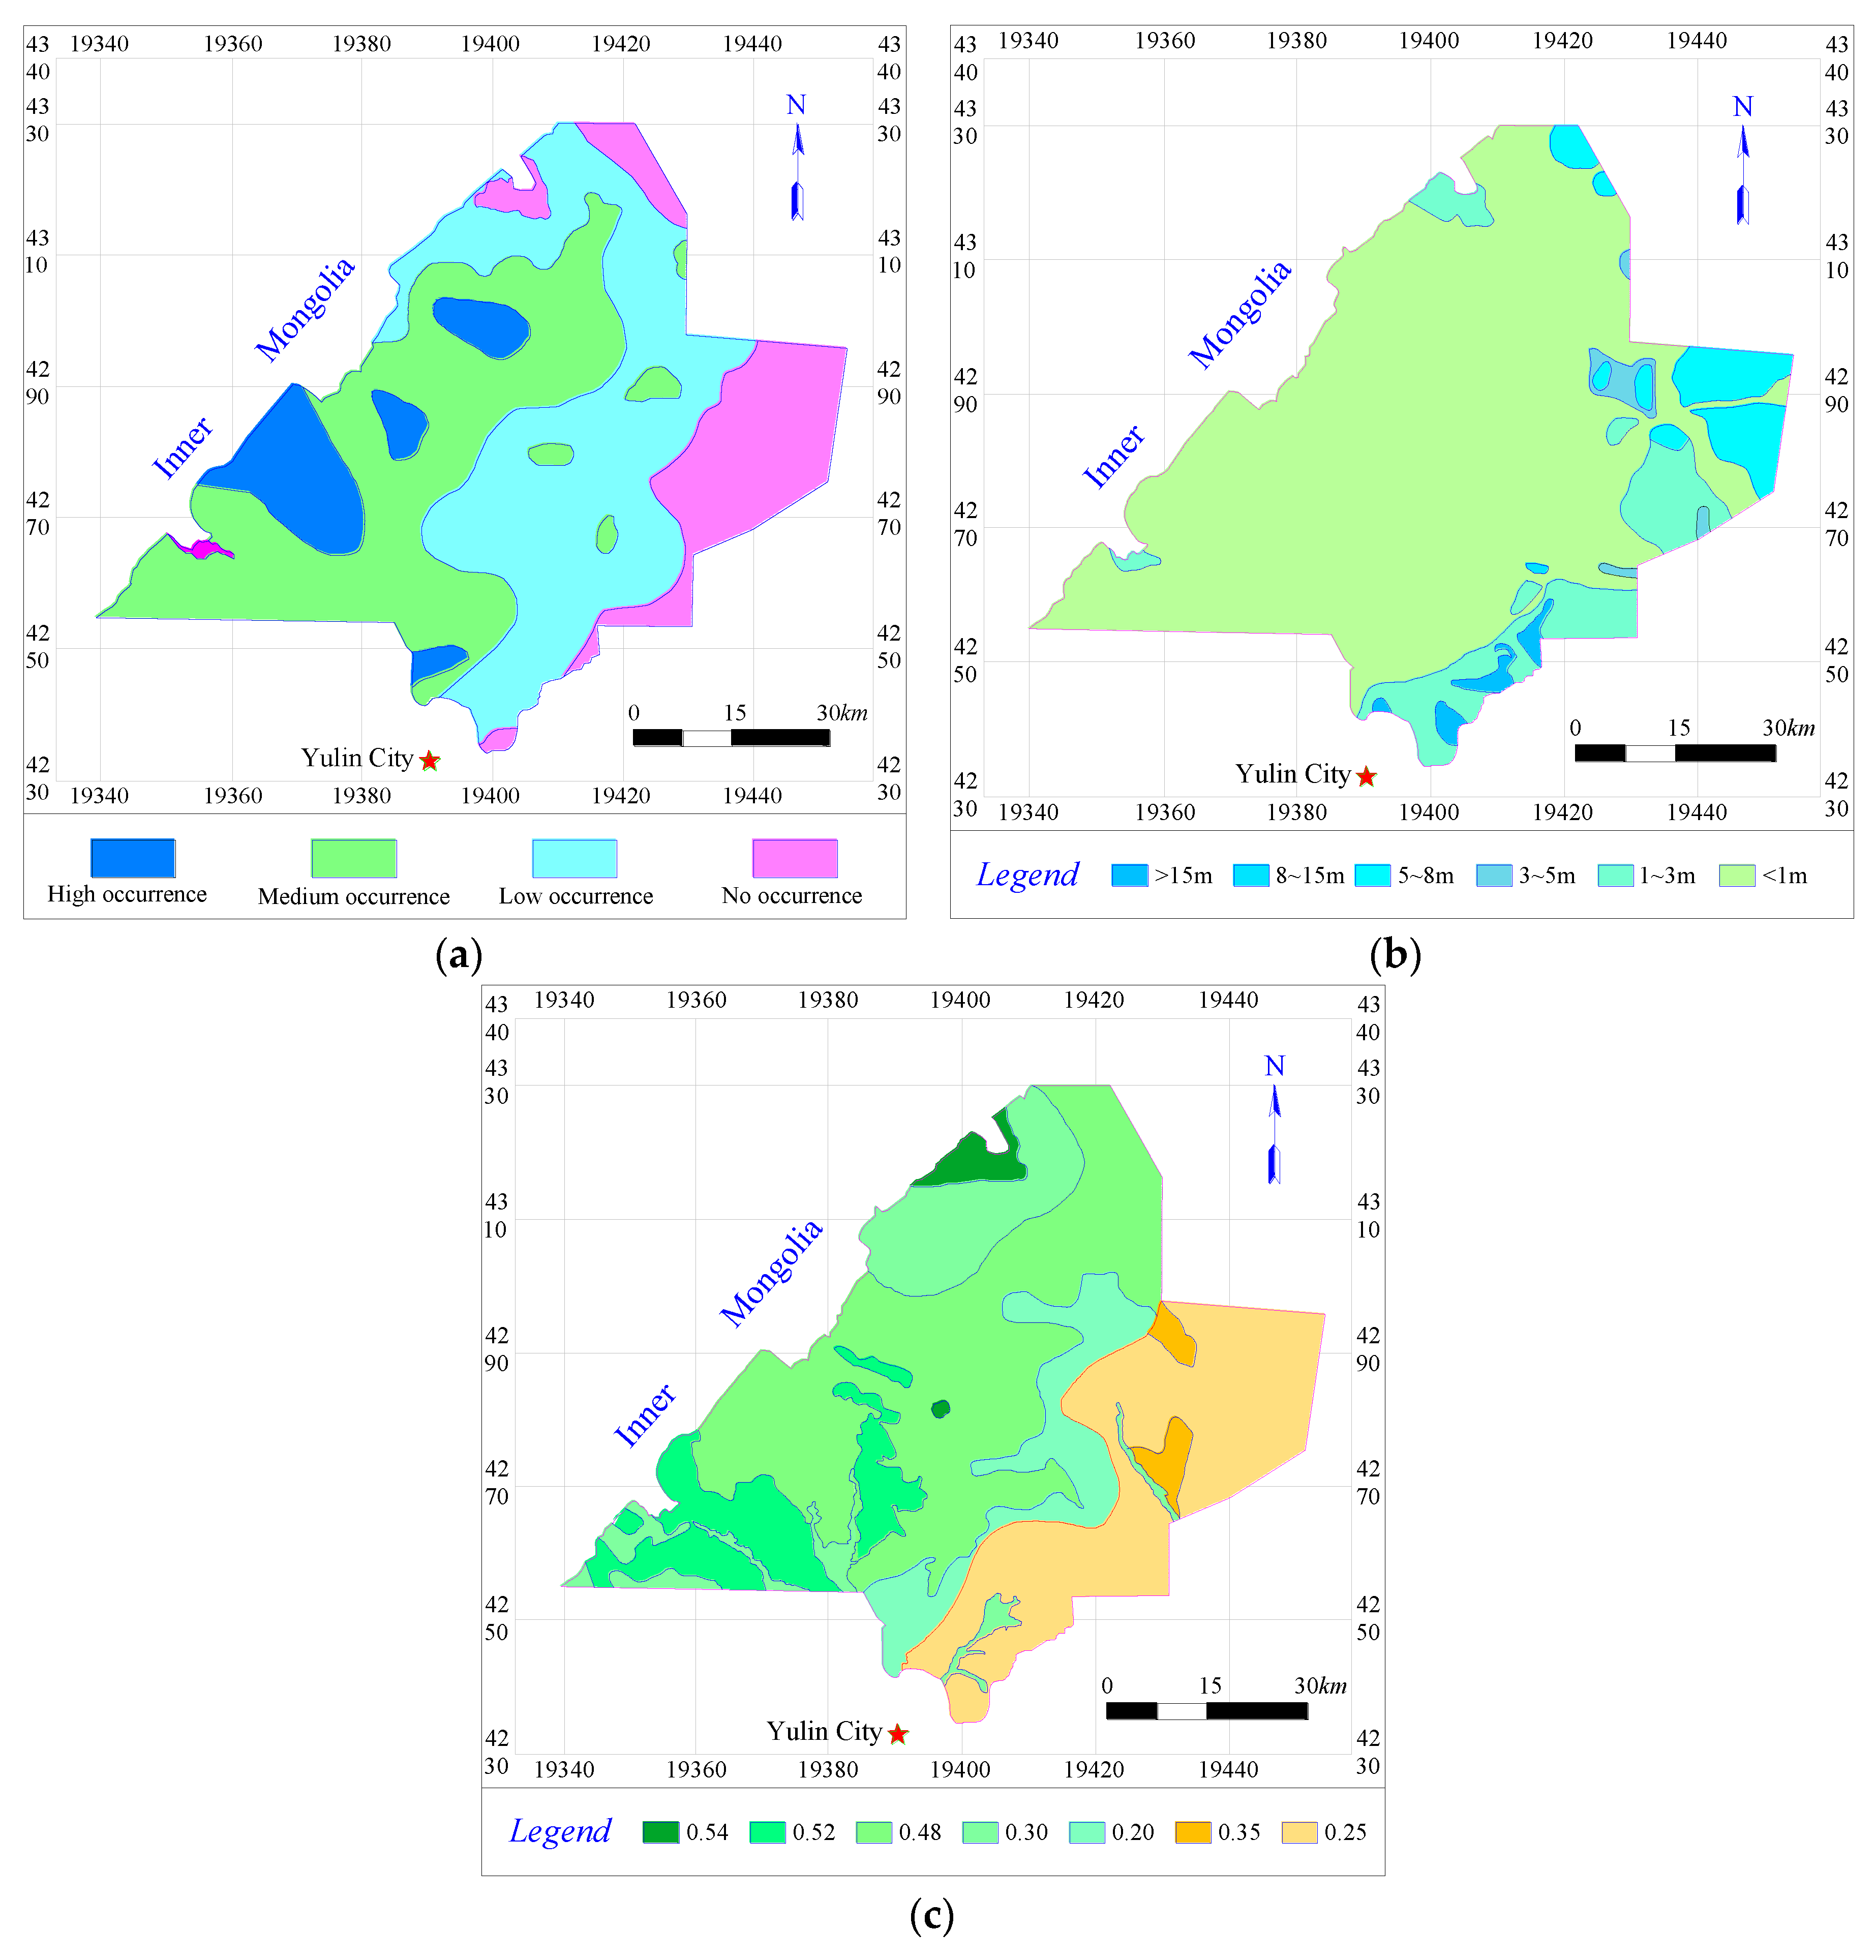
Sarawusu Formation aquifer is the primary supply source of water demand for local residents and is decisive for the eco-environment of the study area. Thus, it is the main aquifer for WRCCMA research in the Yu-Shen mining area. The high water-rich regions of the aquifer cover a total area of 504 km2, and the salinity in these areas ranges from 0.188 to 0.355 g/L. The total area of medium water-rich areas is 1911 km2, with a mineralization degree of 0.170 to 0.561 g/L. The low water-rich regions of the aquifer is 1919 km2 in area, with mineralization varying from 0.214 to 0.588 g/L. The comprehensive pollution index p of the Sarawusu Formation aquifer is from 0.21 to 0.7, and the groundwater quality is generally II−III grade. For most areas in the Yu-Shen mining area, the water table drop after mining is less than 1 m. However, in the southeast and northeast boundaries of this mining area, the water level declines drastically. The coefficient of recharge from precipitation in Yu-Shen mining area varies from 0.2 to 0.54 [4,57]. The water-rich zoning map of Sarawusu Formation aquifer is shown in Figure 10. The zoning map of mining-inudced groundwater level drop of Sarawusu Formation aquifer is shown in Figure 10. The zoning map of the coefficient of recharge from precipitation is shown in Figure 10.
4. Coal mining system
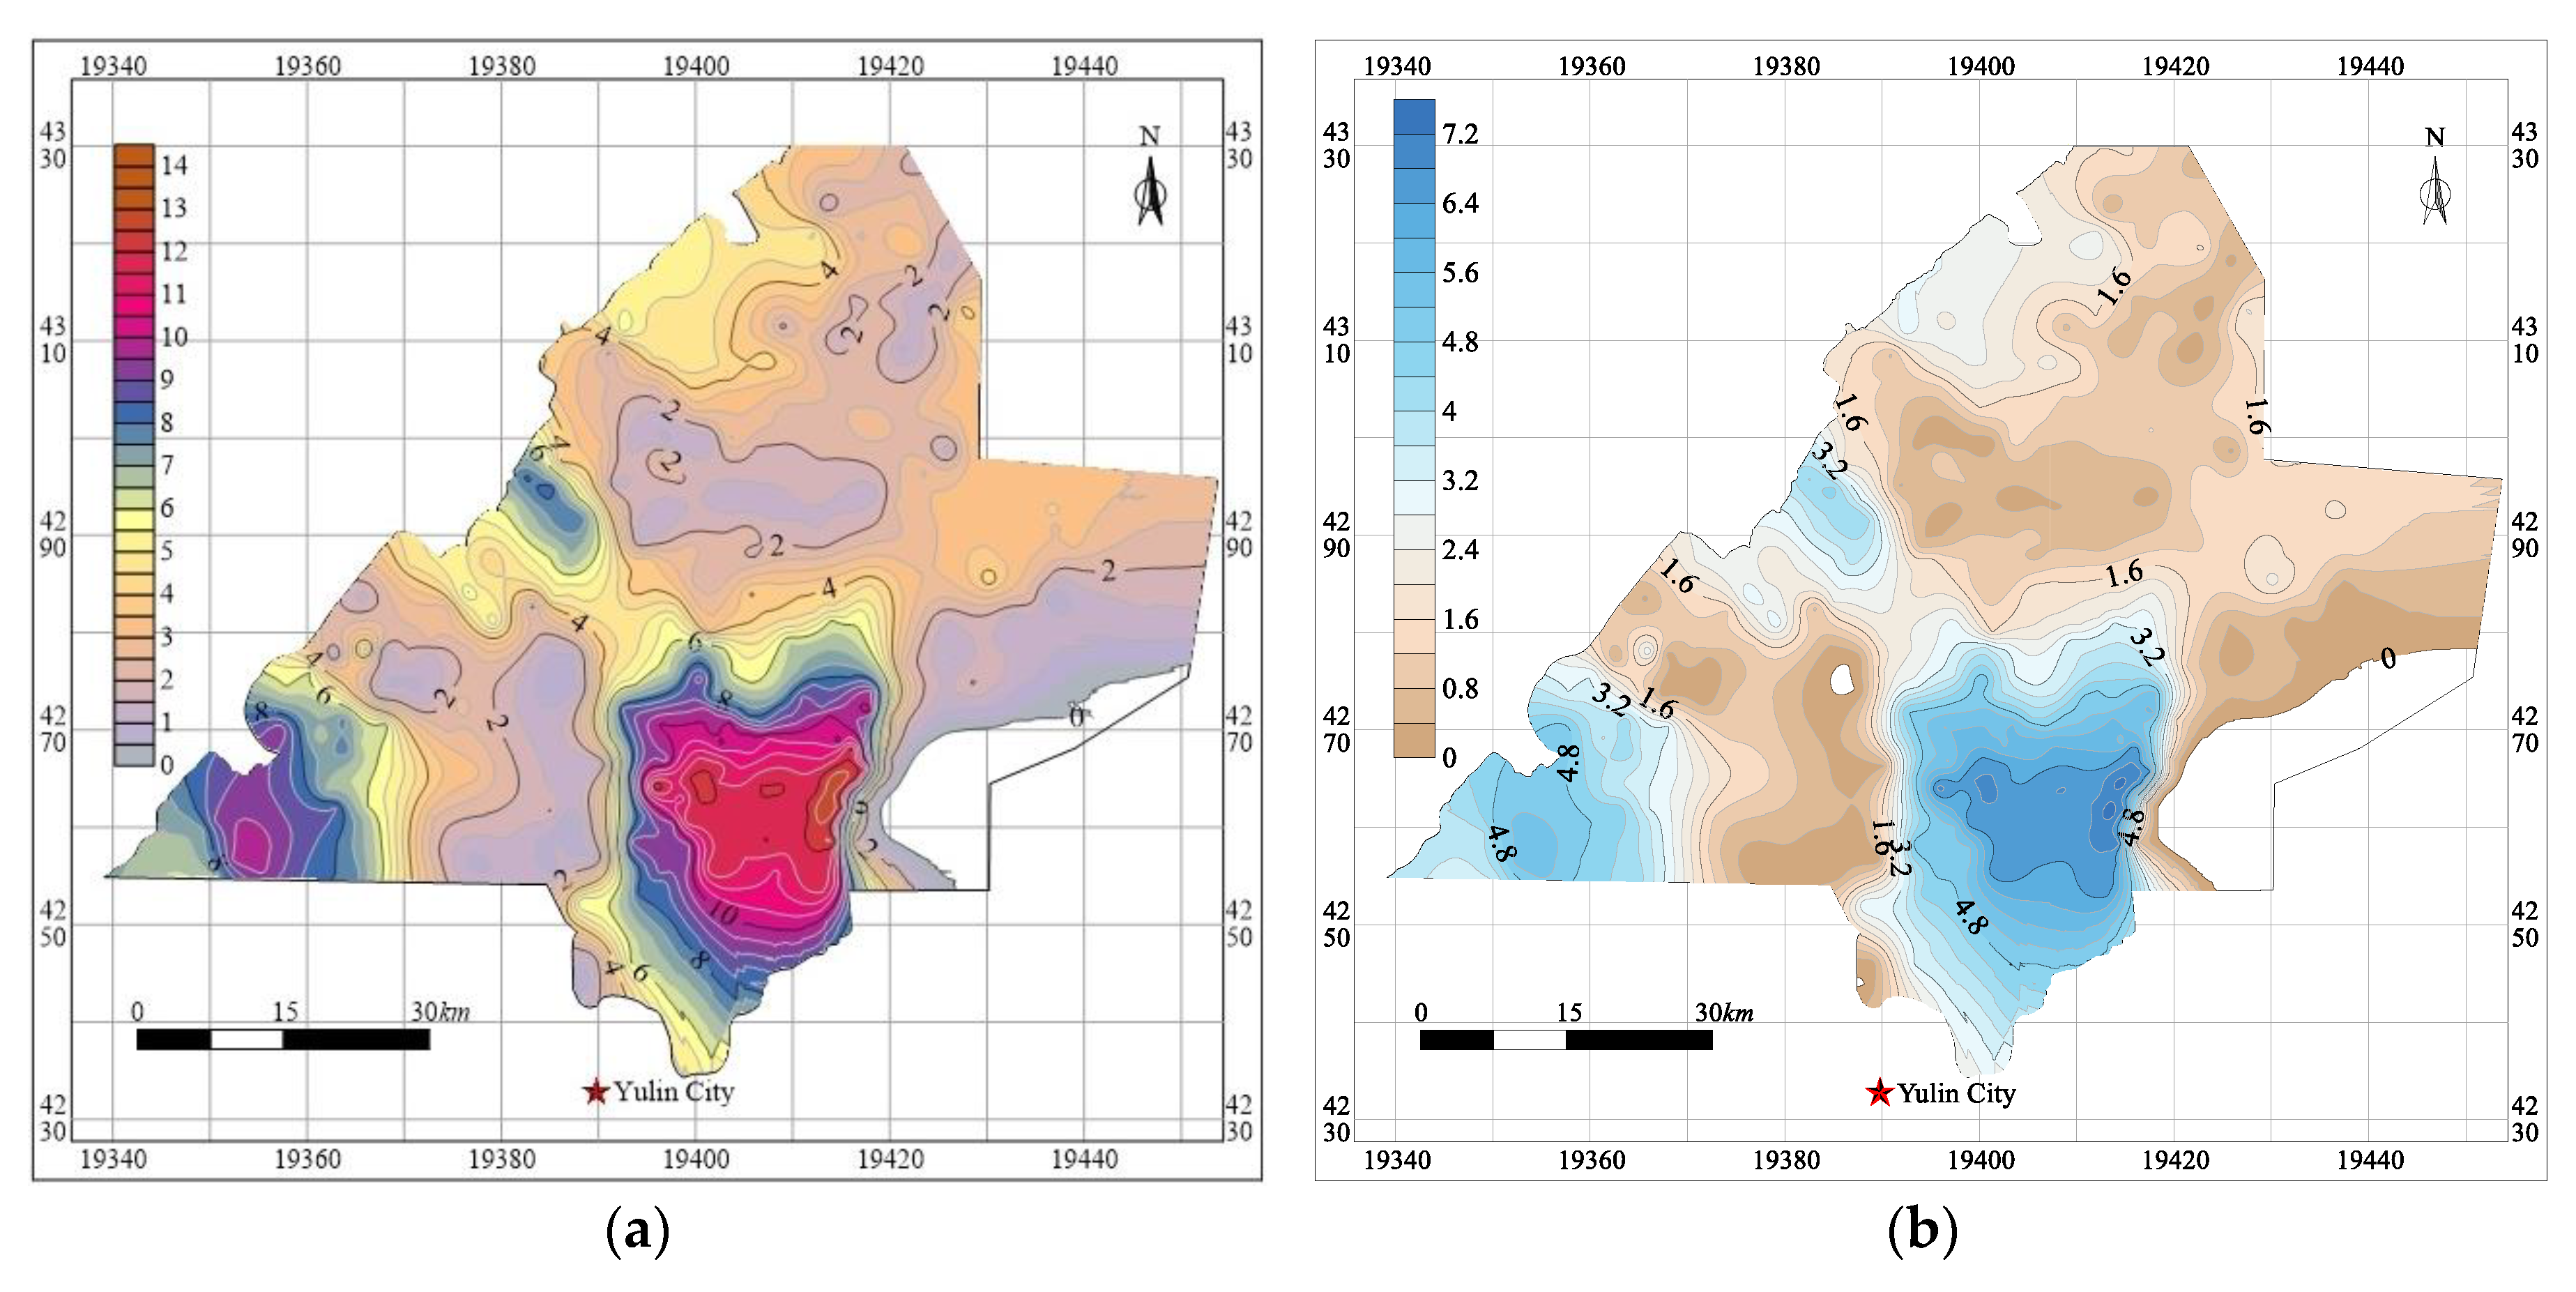
The Jurassic Yan’an Formation is the coal-bearing strata in the mining area. There are five main mineable coal seams, i.e., 1−2, 2−2, 3−1, 4−2, and 5−2 coal seams. These seams are generally flat with small dip angles of 1° to 3°, while their thicknesses vary significantly, ranging from 0 to 12 m. The contour map of the first-mined coal seam thickness is shown in Figure 11. Through on-site investigation, the author found that when the mining height is 4 m, 5 m, 6 m, and 7 m, the corresponding maximum subsidence values are 2.2 m, 2.8 m, 3.3 m, and 3.8 m, respectively, in the Yu-Shen mining area. The formula of maximum subsidence value was obtained by linear fitting, as shown in Formula (26).
W max = 0.53 M + 0.11   R 2 = 0.997
Based on the formula and the coal seam thickness of different boreholes, we calculated the maximum subsidence values of different drill holes under longwall full-seam mining in the Yu-Shen mining area, and the contour map of them was plotted, as shown in Figure 11.
5. Ecological system
The vegetation coverage in Yulin city is 45.82% [62]. The total water resources of Yulin city in 2018 was 2.432 billion m3, 90.4% of that in 2017, which is 2.69 billion m3 [63].
6. Social system
The water utilization rate of Yulin city from 2014 to 2018, published by the Shaanxi Provincial Water Resources Department, is shown in Table 5. It can be seen that the water utilization rate of Yu-Shen mining area is 34.04% on average [63]. In addition, in light of the distribution of water resources per capita from 2014 to 2018 released by the National Bureau of Statistics [64], the water resources per capita of Yu-Shen mining area are 1000–2000 m3, revealing that it is a moderate water scarcity area.

5.2.2. Results of WRCCMA Prediction

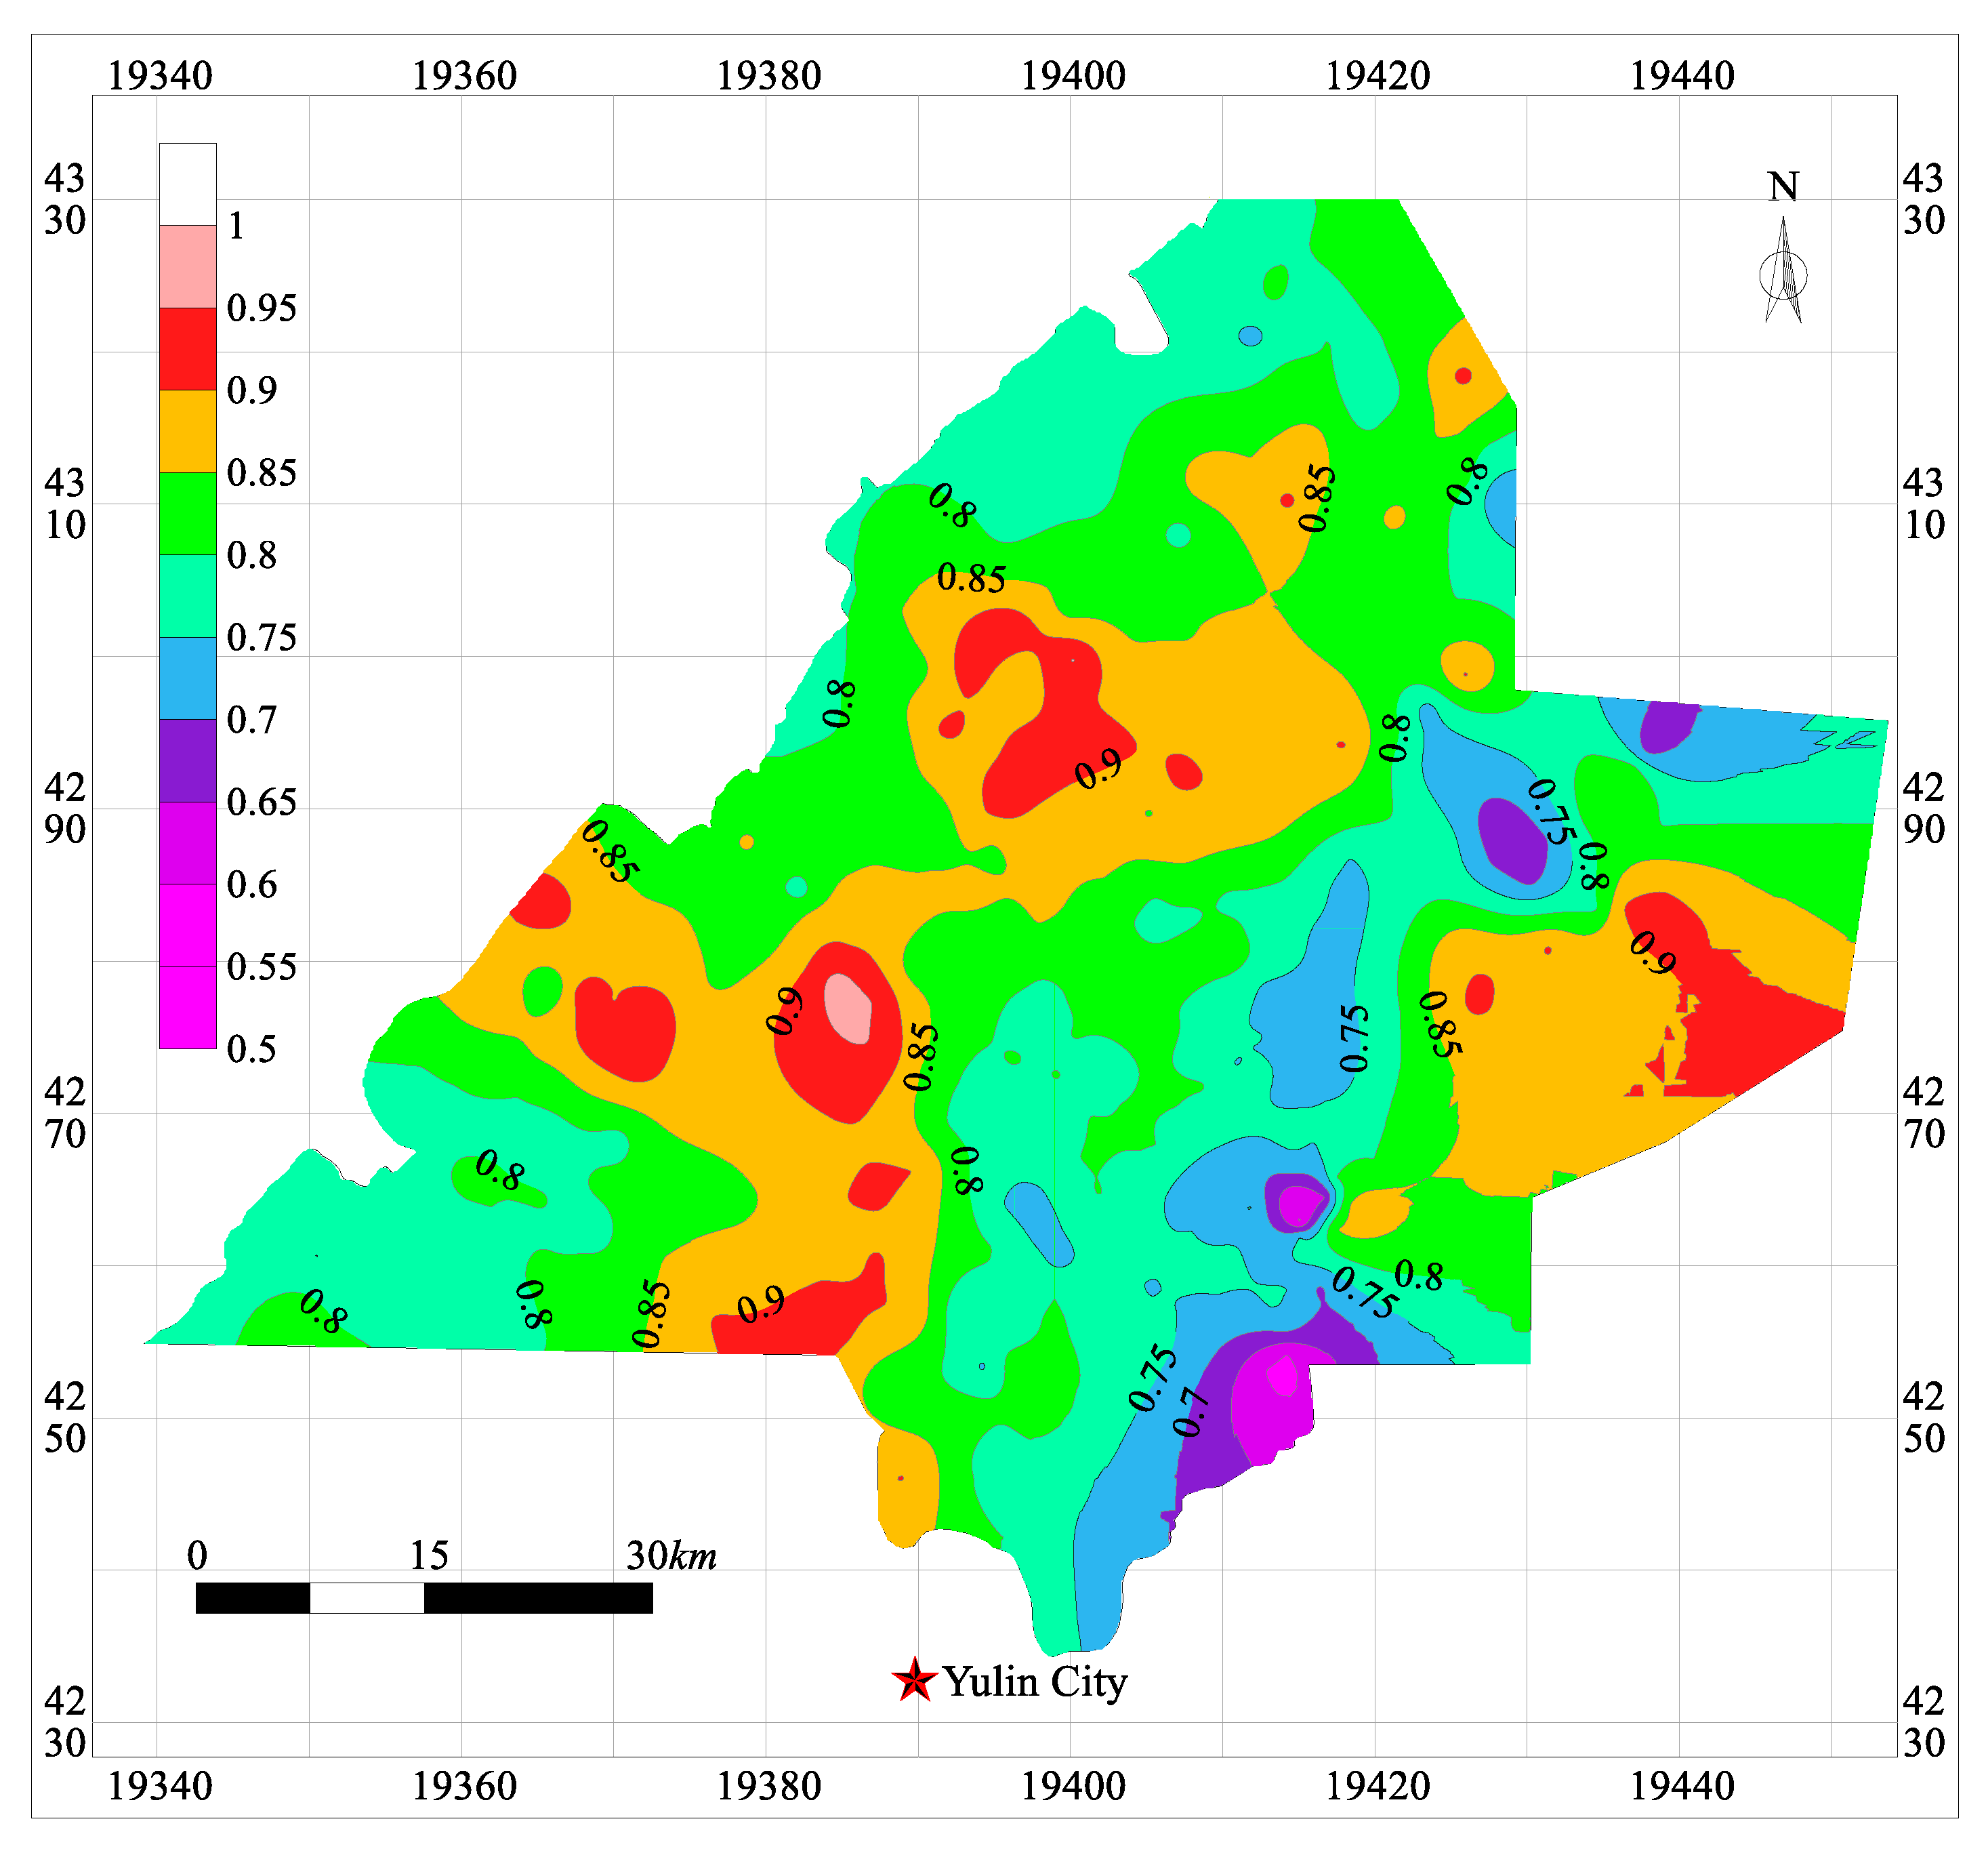
Based on the comprehensive evaluation value Φ of the WRCCMA of each borehole, the Kriging method was employed to draw the contour map of the Φ under longwall full-seam mining in the Yu-Shen mining area, as shown in Figure 12.
As a whole, the comprehensive evaluation values of drill holes in the northwest area are generally larger than those in the southeast. The areas of grade I are geographically dispersed, and are distributed in the central west, southwest, and northeast area in Yu-Shen mining area, where the longwall full-seam mining can realize the coordinated development among the high-efficient mining, water resources preservation, and ecology protection. In the western border of the study area, the WRCCMA belongs to grade II and grade III, which are generally lower than that in the adjacent eastern boreholes. The main reason is that the areas near the west border are eolian sand landform and are characterized by low vegetation coverage and serious land desertification. The areas of grade II and grade III of WRCCMA are distributed in the middle part, and a small part of northeast border and WCCM methods should be used in these areas to maintain the WRCCMA. The areas of grade IV are distributed in the northeast border and southeast border of the study area. The areas of grade V are distributed in the southeast of Yu-Shen coal area, in which the coal mining should be strictly prohibited because the WRCCMA is severly over-carrying.
The evaluation results in this paper are consistent with other evaluation methods, indicating this model is scientific, reasonable, and reliable [60]. In addition, this evaluation system can not only accurately predict and evaluate the WRCCMA in the Yu-Shen mining area but also can be employed in other arid and semi-arid regions in Northwest of China, since they share the arid and semi-arid climate, fragile ecology, and water scarcity in common.
Based on the prediction results of WRCCMA grades of different collieries (boreholes) in the Yu-Shen mining area, three countermeasures, namely, mining methods selection, mine water reutilization, and water-resisting layer reconstruction, were proposed to achieve WCCM.
1. Mining methods selection
For areas where there is no water distribution, or the WRCCMA is carrying surplus, the traditional longwall full-seam mining method can be used to extract coal resources. However, when the WRCCMA is capable of carrying, the coal mines should adopt harmonious mining or slice mining methods. By adjusting the mining sequence of the panels, these two methods can reduce and counteract the movement and deformation of overlying strata. Hence, the WCFZ height will be restricted, and the impact of coal mining on water bodies will decrease. Moreover, coal mines with medium WRCCMA should employ partial mining methods, including height-restricted mining, room and pillar mining, and narrow strip mining, since the water flowing fractures generated by traditional longwall full-seam mining in these collieries are prone to reaching the overlying aquifer, resulting in water level drop and groundwater loss. These three WCCM methods can prevent groundwater from seeping and thus maintain the WRCCMA by discarding part of coal body to support the overlying strata and restrict their movement. If the WRCCMA is severely over-carrying, mining activity should be completely banned in order to preserve the precious water resources.
For collieries whose WRCCMA is slightly over-carrying, backfill mining must be employed, because the WRCCMA has reached the warning value. This method substitutes extracted coal body with filling bodies and allows all coal resources in an area to be extracted, and is recognized as an ideal approach to protecting water from mining-induced damage. However, traditional paste filling material and high water swelling material are confronted with several problems, such as insufficient sources, small filling scales, and high filling costs, and it is difficult for them to be popularized and applied in a larger range. On the other hand, coal mine solid waste was no longer needed in the process of production and living activities and was therefore accumulated on the ground for a long time. The harmful contaminants contained in the solid waste are prone to infiltrating into the shallow water by leaching process, contributing to the water quality deteriorating and the WRCCMA declining. In addition, as there is no coal body to support the overburden strata after mining, the water conductive fractures can easily reach the aquifer and thus lead to water table lowering and water bursting in mine, which not only jeopardizes the mine safety, but also severely affects the domestic water of local residents. Therefore, backfilling the solid waste into the goaf to restrict the movement of overlying strata and the development of the water flowing fissures can not only preserve shallow water resources from being polluted, but prevent water seepage. As an effective method of disposing of mining wastes, solid waste backfill mining method allows longwall full-seam mining under water bodies. It will make significant contributions to the harmless treatment of solid waste and sustainable development of the coal area.
2. Mine water reutilization
Seventy percent of coal mines in arid and semi-arid areas of Northwest China are short of water, over 40% of which suffer from serious water shortage. Collieries throughout China discharge about 4.2 billion m3 of mine water every year, while the reutilization rate is only 40% [58,59,60,61]. In the process of coal mining, aquifer dewatering has caused large-scale water level drop and water loss. Also, due to the large evaporative capacity in arid and semi-arid areas, the discharged mine water on the surface can quickly be evaporated and lost. If the WRCCMA of the colliery is carrying surplus or capable of carrying, it should purify the polluted mine water while making a profit. The treated and purified water can provide a source of water for coal mines and households. The over-exploitation of water resources can be avoided, and thereby the WRCCMA can be maintained.
In addition, mining areas where the WRCCMA is moderate carrying or slightly over-carrying are usually the ones with a short distance from the aquifer to the coal seam and without effective water-resistant strata (aquifuge). Once the coal seam is mined, the water flowing fractures will connect the overlying aquifer and the goaf, which inevitably leads to a large quantity of groundwater infiltration into gob, meaning the scale of mine drainage treatment can no longer meet the requirements. Therefore, it is necessary to construct underground reservoirs to store and utilize mine water. The subsurface reservoir can make full use of the function of environmental self-purification of rock mass in goaf. It is unnecessary for the mine water to be discharged to the ground, thus reducing the evaporation loss. In recent years, more than 32 underground coal mine reservoirs have been built in Shen-Dong mining area, with a water storage capacity of more than 31 million m3. The water stored in a reservoir can be used for colliery production and local residents’ living, and excessive abstraction of groundwater can be avoided.
3. Water-resisting layer reconstruction
The mining-induced water conductive fissures of slightly over-carrying colliery are likely to break the balance of original stress of the aquifer and change the hydrogeological conditions and the recharge, runoff, discharge of the groundwater. More seriously, the groundwater entrained with sand or mud flows into the mined-out area, causing water bursting and sand gushing in mines and threatening the mine safety. Under this background, the impermeable layer reconstruction was proposed to reduce the permeability of rock mass by grout injection in the layer under the overlying aquifer, so as to block the water flowing channels between the aquifer and the goaf. This technology can enable the aquifer to be recharged and to restore water, realizing water level recovery and thereby helping to maintain the WRCCMA. At the moment, this technology is utilized more frequently to prevent the water inrush from the floor in underground coal mining. The impermeable layer reconstruction in overlying strata of coal seam has been applied in Dashui colliery and Shangwan colliery, and good economic and environmental benefits have been achieved [2].

6. Discussion

The prediction results of the model have good agreement with the ones of other studies. Overall, the grade of WRCCMA in the Yu-Shen mining area decreases from west to east. The main reasons are that the areas near the west boundary of the study area feature high or medium water abundance and thick bedrock, while the east areas are usually covered by thin bedrock and water yield property in these areas is usually low or even without Salawusu Formation aquifer distribution. Other similar research usually treats the mining area as a whole and evaluates the WRCC for the entire coal area. The evaluation results of mining area are usually used as the instructions and guidance for the mining planning and scientific mining scale [2,11]. By contrast, we evaluated and predicted the WRCC based on each borehole distributed in the whole mining area. Therefore, the prediction results of our article can provide instructions for each colliery with different grades of WRCC. Compared to other studies, our findings can better instruct coal production of each colliery and help coal mines to maintain their WRCC, making significant contributions to the sustainable and green development of the mining area. To sum up, our findings have advantages over findings of other studies in terms of instructing each colliery’s production in the premise of preserving water resources.
WCFZ height is decisive to achieve WCCM and thus is an important factor affecting the WRCCMA. We obtained the formula for predicting the WCFZ height of four different stratigraphic structures (sand-soil-bedrock, sand-bedrock, bedrock, and soil-bedrock) by numerical simulation and field measurements, which is only related to mining height. However, the coefficient in the proposed formula also takes the influence of other factors on WCFZ height into consideration. Therefore, it is reasonable to use mining height as the only variable in the equation. The equation can contribute to accurately evaluating the WRCCMA of the Yu-Shen mining area.
The Yu-Shen mining area is a part of Yulin city. Therefore, the membership degree of some evaluation indicators of WRCCMA, including vegetation coverage, total water resources, water utilization rate, and water resources per capita, were determined by the data of Yulin city, since there are no relevant collected data of different boreholes in the Yu-Shen mining area up to now. However, the membership degrees of different collieries are not always the same. Further field investigation is thus needed to make the evaluation of the WRCCMA more accurate, so as to better instruct WCCM.
Although these three countermeasures offered to maintain the WRCCMA can provide guidance for WCCM, it is necessary for planners and engineers to take into account the specific engineering and geological conditions of collieries during implementation. Taking mining methods, for example, coordinated mining should consider the layout of the coal face and mining sequence to partly reduce and offset the tensile and compressional strains of overlying strata and thereby the development of the water flowing fissures. For narrow strip mining, the width of the narrow strip and strip coal pillar need to be optimized to maximize the coal extraction in the premise of water conservation. In addition, the strip coal pillars left unmined may fail owing to weathering after years of mining, which suggests that narrow strip mining is only suitable under certain geological conditions. Considering the current technological and economic conditions and equipment available, it is suitable for this WCCM method to be adopted at low-production coal mines. Furthermore, for room and pillar mining, in order to improve the recovery ratio of coal resources in the premise of WCCM, the sizes of room and pillar should be analyzed in detail. Both of these two mining methods can be particularly used in collieries where the shapes coal seams are irregular and longwall panels are unsuitable to arrange. Besides, for backfill mining, filling rate, filling materials, and filling pipelines need to be determined and designed based on the different conditions. In order to preserve water resources while maximizing economic benefits, two or more WCCM methods can be employed together in a colliery. For example, after narrow strip mining, the backfill mining method can be utilized to extract coal pillars left unmined, so as to maintain the WRCCMA while improving the recovery rate. For specific conditions, the construction of underground coal mine reservoir requires the determination of water source prediction, site selection, storage capacity design, dam construction, and water quality guarantee. As for impermeable layer reconstruction, it is necessary to select the specific grouting materials, grouting parameters, and grouting pressure, in terms of the physical and mechanical properties of overlying strata [65].

7. Conclusions

The following conclusions are drawn from the research:
1. Based on the AHP-fuzzy comprehensive evaluation method, a three-level AHP model, with 6 sub-factors and 15 tertiary factors, was developed to identify the influencing factors of the WRCCMA and determine the weight distribution. The subordinate functions of these influencing factors were constructed. According to the weights distribution, among the secondary indicators, the coal mining system is the most important one, with a weight of 0.3319. The mining method and buried depth of aquifer are the two most important tertiary indicators, with weights of 0.1791 and 0.1550, respectively.
2. The fluid-solid coupling module of FLAC3D finite element software was employed to simulate the seepage of the groundwater in Yubujie coal mine, and its water level has dropped 1.32 m. The prediction model of WRCCMA was applied in the Yubujie colliery, and the comprehensive evaluation value Φ was calculated to be 0.84, indicating that the WRCCMA is capable of carrying. The ground deformation and the vegetation coverage alteration after mining in the colliery were analyzed through field investigation, and the validity of this evaluation model was verified.
3. The comprehensive evaluation value Φ of each borehole was obtained in Yu-Shen mining area. The Kriging method was employed to plot the contour map of Φ in this study area. In view of different grades of WRCCMA of collieries, three countermeasures, i.e., selecting reasonable mining methods, reutilizing the mine water, and reconstructing the water-resisting layer, have been provided to help them achieve WCCM and maintain the WRCCMA. Reasonable mining methods can control the deformation and break of overlying strata and thus can prevent groundwater from infiltrating into the mined-out area. Mine water reutilization can provide a source of water for coal mines and households and avoid the over-exploitation of water resources. The water-resisting layer reconstruction can reduce the permeability of rock mass by grout injection in the layer under the overlying aquifer, so as to block the water flowing channels between the aquifer and the goaf. These three countermeasures can not only be used in the Yu-Shen mining area, but also can be popularized and applied in a larger range, such as Xinjiang, Ningxia, and Inner Mongolia coal production base in the Northwest of China. More broadly, these three countermeasures can be used in non-coal mines under water bodies to protect the previous water resources. There are severe conflicts between coal mining and water preservation. Only by predicting the WRCCMA accurately can water preservation and coal resources extraction develop in a coordinated way. Without the precise evaluation of WRCCMA, water loss on a larger scale and a water crisis will occur in the coming years. This article combines fuzzy mathematics with mining engineering to construct a fuzzy comprehensive evaluation model to predict the WRCCMA. The research results can provide a theoretical basis and practical reference for coal mining planning in ecologically fragile arid and semi-arid mining areas. It is conducive to promoting the coordinated development of coal resources extraction, water resources preservation and ecology protection, contributing to the realization of green mining and sustainable development of the mining area in Northwest China.

Author Contributions

Y.X. conceived the research and wrote the paper. L.M. revised and reviewed the manuscript. N.M.K. professionally proofread and edited manuscript. All authors have read and approved the final manuscript.

Funding

The National Natural Science Foundation of China (51874280); the Priority Academic Program Development of Jiangsu Higher Education Institutions (PAPD).

Acknowledgments

This work was supported by the National Natural Science Foundation of China (51874280), and the Priority Academic Program Development of Jiangsu Higher Education Institutions (PAPD).

Conflicts of Interest

The authors declare that they have no competing financial interests.

References

  1. Zhang, D.; Fan, G.; Ma, L.; Wang, X. Aquifer protection during longwall mining of shallow coal seams: A case study in the Shendong Coalfield of China. Int. J. Coal Geol. 2011, 86, 190–196. [Google Scholar] [CrossRef]
  2. Liu, S.; Li, W. Zoning and management of phreatic water resource conservation impacted by underground coal mining: A case study in arid and semiarid areas. J. Clean. Prod. 2019, 224, 677–685. [Google Scholar] [CrossRef]
  3. Wang, S.; Ma, L. Characteristics and control of mining induced fractures above longwall mines using backfilling. Energies 2019, 12, 4604. [Google Scholar] [CrossRef] [Green Version]
  4. Xu, Y.; Ma, L.; Yu, Y. Water preservation and conservation above coal mines using an innovative approach: A case study. Energies 2020, 13, 2818. [Google Scholar] [CrossRef]
  5. Yu, Y.; Ma, L.; Zhang, D. Characteristics of roof ground subsidence while applying a continuous excavation continuous backfill method in longwall mining. Energies 2020, 13, 95. [Google Scholar] [CrossRef] [Green Version]
  6. Newman, C.; Agioutantis, Z.; Leon, G.B.J. Assessment of potential impacts to surface and subsurface water bodies due to longwall mining. Int. J. Min. Sci. Technol. 2017, 27, 57–64. [Google Scholar] [CrossRef]
  7. Qiao, W.; Li, W.; Li, T.; Chang, J.; Wang, Q. Effects of coal mining on shallow water resources in semiarid regions: A case study in the Shennan mining area, Shaanxi, China. Mine Water Environ. 2017, 36, 104–113. [Google Scholar] [CrossRef]
  8. Ma, L.; Jin, Z.; Liu, W.; Zhang, D.; Zhang, Y. Wongawilli roadway backfilling coal mining method—A case study in Wangtaipu coal mine. Int. J. Oil Gas Coal T. 2019, 20, 342–359. [Google Scholar] [CrossRef]
  9. Ma, L.; Jin, Z.; Liang, J.; Sun, H.; Zhang, N.; Li, P. Simulation of water resource loss in short-distance coal seams disturbed by repeated mining. Environ. Earth Sci. 2015, 74, 5653–5662. [Google Scholar] [CrossRef]
  10. Wang, A.; Ma, L.; Wang, Z.; Zhang, D.; Li, K.; Zhang, Y.; Yi, X. Soil and water conservation in mining area based on ground surface subsidence control: Development of a high-water swelling material and its application in backfilling mining. Environ. Earth Sci. 2016, 75, 779. [Google Scholar] [CrossRef]
  11. Chi, M.; Zhang, D.; Fan, G.; Zhang, W.; Liu, H. Prediction of water resource carrying capacity by the analytic hierarchy process-fuzzy discrimination method in a mining area. Ecol. Indic. 2019, 96, 647–655. [Google Scholar] [CrossRef]
  12. Dai, D.; Sun, M.; Xu, X.; Lei, K. Assessment of the water resource carrying capacity based on the ecological footprint: A case study in Zhangjiakou City, North China. Environ. Sci. Pollut. Res. 2019, 26, 11000–11011. [Google Scholar] [CrossRef] [PubMed]
  13. Bao, C.; He, D. Scenario modeling of urbanization development and water scarcity based on system dynamics: A case study of Beijing-Tianjin-Hebei urban agglomeration, China. Int. J. Environ. Res. Public Health 2019, 16, 3834. [Google Scholar] [CrossRef] [PubMed] [Green Version]
  14. Xiufeng, X.; Zhenghe, X.; Limin, P.; Yunhai, Z.; Min, D.; Penggang, L. Water resources carrying capacity forecast of Jining based on non-linear dynamics model. Energy Procedia 2011, 5, 1742–1747. [Google Scholar] [CrossRef] [Green Version]
  15. Wang, S.; Xu, L.; Yang, F.; Wang, H. Assessment of water ecological carrying capacity under the two policies in Tieling City on the basis of the integrated system dynamics model. Sci. Total. Environ. 2014, 472, 1070–1081. [Google Scholar] [CrossRef] [PubMed]
  16. Wang, T.; Xu, S. Dynamic successive assessment method of water environment carrying capacity and its application. Ecol. Indic. 2015, 52, 134–146. [Google Scholar] [CrossRef]
  17. Min, D.; Zhenghe, X.; Limin, P.; Yunhai, Z.; Xiufeng, X. Comprehensive evaluation of water resources carrying capacity of Jining City. Energy Procedia 2011, 5, 1654–1659. [Google Scholar] [CrossRef] [Green Version]
  18. Ren, C.; Guo, P.; Li, M.; Li, R. An innovative method for water resources carrying capacity research—Metabolic theory of regional water resources. J. Environ. Manag. 2016, 167, 139–146. [Google Scholar] [CrossRef]
  19. Pires, A.; Morato, J.; Peixoto, H.; Botero, V.; Zuluaga, L.; Figueroa, A. Sustainability Assessment of indicators for integrated water resources management. Sci. Total. Environ. 2017, 578, 139–147. [Google Scholar] [CrossRef] [PubMed]
  20. Milano, M.; Ruelland, D.; Dezetter, A.; Fabre, J.; Ardoin-Bardin, S.; Servat, E. Modeling the current and future capacity of water resources to meet water demands in the Ebro basin. J. Hydrol. 2013, 500, 114–126. [Google Scholar] [CrossRef]
  21. Qiyong, Y.; Zhang, F.; Jiang, Z.; Yuan, D.; Jiang, Y. Assessment of water resource carrying capacity in karst area of Southwest China. Environ. Earth Sci. 2015, 75, 1–8. [Google Scholar] [CrossRef]
  22. Mhlongo, S.; Mativenga, P.T.; Marnewick, A. Water quality in a mining and water-stressed region. J. Clean. Prod. 2018, 171, 446–456. [Google Scholar] [CrossRef] [Green Version]
  23. Zhang, Z.; Lu, W.; Zhao, Y.; Song, W. Development tendency analysis and evaluation of the water ecological carrying capacity in the Siping area of Jilin Province in China based on system dynamics and analytic hierarchy process. Ecol. Model. 2014, 275, 9–21. [Google Scholar] [CrossRef]
  24. Fan, L. Scientific connotation of water-preserved mining. J. Chin. Coal Soc. 2017, 42, 27–35. [Google Scholar]
  25. Qian, M.; Xu, J.; Miao, X. Green technique in coal mining. J. Chin. Univ. Min. Technol. 2003, 32, 343–347. [Google Scholar]
  26. Palchik, V. Formation of fractured zones in overburden due to longwall mining. Environ. Earth Sci. 2003, 44, 28–38. [Google Scholar] [CrossRef]
  27. Liu, S.; Li, W.; Wang, Q. Height of the water-flowing fractured zone of the jurassic coal seam in Northwestern China. Mine Water Environ. 2018, 37, 312–321. [Google Scholar] [CrossRef]
  28. Guo, W.; Zou, Y.; Hou, Q. Fractured zone height of longwall mining and its effects on the overburden aquifers. Int. J. Min. Sci. Technol. 2012, 22, 603–606. [Google Scholar] [CrossRef]
  29. Ma, L.; Guo, J.; Liu, W.; Zhang, D.; Yu, Y. Water conservation when mining multiple, thick, closely-spaced coal seams: A case study of mining under Weishan Lake. Mine Water Environ. 2019, 38, 643–657. [Google Scholar] [CrossRef]
  30. Zhang, J.; Jiang, H.; Deng, X.; Ju, F. Prediction of the height of the water-conducting zone above the mined panel in solid backfill mining. Mine Water Environ. 2014, 33, 317–326. [Google Scholar] [CrossRef]
  31. Ma, L.; Zhang, D.; Jin, Z.; Wang, S.; Yu, Y. Theories and methods of efficiency water conservation mining in short-distance coal seams. J. Chin. Coal Soc. 2019, 44, 727–738. [Google Scholar]
  32. Huang, Q. Simulation of clay aquiclude stability of water conservation mining in shallow-buried coal seam. Chin. J. Rock Mech. Eng. 2009, 28, 987–992. [Google Scholar]
  33. Wu, Q.; Wang, M.; Wu, X. Investigations of groundwater bursting into coal mine seam floors from fault zones. Int. J. Rock Mech. Min. Sci. 2004, 41, 557–571. [Google Scholar] [CrossRef]
  34. Wu, Q.; Shen, J.; Wang, Y. Mining techniques and engineering application for “Coal-Water” dual-resources mine. J. Chin. Coal Soc. 2017, 42, 8–16. [Google Scholar]
  35. Wu, Q.; Fan, Z.; Liu, S.; Zhang, Y.; Sun, W. Water-richness evaluation method of water-filled aquifer based on the principle of information fusion with GIS: Water-richness index method. J. Chin. Coal Soc. 2011, 36, 1124–1128. [Google Scholar]
  36. Zhang, H.; Zhou, R.; Guo, D.; Du, P. Investigation on Predicting roof water gush in coal mines based on multi-factor analysis. J. Chin. Univ. Min. Technol. 2005, 34, 115–119. [Google Scholar]
  37. Booth, C.J.; Spande, E.D.; Pattee, C.T.; Miller, J.D.; Bertsch, L.P. Positive and negative impacts of longwall mine subsidence on a sandstone aquifer. Environ. Earth Sci. 1998, 34, 223–233. [Google Scholar] [CrossRef]
  38. Booth, C. Groundwater as an environmental constraint of longwall coal mining. Environ. Earth Sci. 2006, 49, 796–803. [Google Scholar] [CrossRef]
  39. Hill, J.G.; Price, D.R. The impact of deep mining on an overlying aquifer in western Pennsylvania. Ground Water Monit. Remediat. 1983, 3, 138–143. [Google Scholar] [CrossRef]
  40. Stoner, J.D. Probable hydrologic effects of subsurface mining. Ground Water Monit. Remediat. 1983, 3, 128–137. [Google Scholar] [CrossRef]
  41. Gülçin, Ö.; Karaman, A.; Akhiev, S.S.; Carpenter, P.J. A new method of analysis of water-level response to a moving boundary of a longwall mine. Water Resour. Res. 1999, 35, 1001–1010. [Google Scholar] [CrossRef]
  42. Robertson, J. Challenges in sustainably managing groundwater in the Australian Great Artesian Basin: Lessons from current and historic legislative regimes. Hydrogeol. J. 2019, 28, 343–360. [Google Scholar] [CrossRef] [Green Version]
  43. Howladar, M.F. Coal mining impacts on water environs around the Barapukuria coal mining area, Dinajpur, Bangladesh. Environ. Earth Sci. 2012, 70, 215–226. [Google Scholar] [CrossRef]
  44. Gandhe, A.; Venkateswarlu, V.; Gupta, R.N. Extraction of coal under a surface water body—A strata control investigation. Rock Mech. Rock Eng. 2005, 38, 399–410. [Google Scholar] [CrossRef]
  45. Li, W.; Liu, S.; Pei, Y.; He, J.; Wang, Q. Zoning for eco-geological environment before mining in Yu-Shenfu mining area, northern Shaanxi, China. Environ. Monit. Assess. 2018, 190, 619. [Google Scholar] [CrossRef]
  46. Wang, S.; Huang, Q.; Fan, L.; Yang, Z.; Shen, T. Study on overburden aquclude and water protection mining regionazation in the ecological fragile mining area. J. Chin. Coal Soc. 2010, 35, 7–14. [Google Scholar]
  47. Ma, X.; Fan, L.; Zhang, X.; Li, W.; Zhang, H. Water-preserved mining based on relationship between vegetation and groundwater. J. Chin. Coal Soc. 2017, 42, 1277–1283. [Google Scholar]
  48. Yang, Z.; Li, W.; Li, X.; He, J. Quantitative analysis of the relationship between vegetation and groundwater buried depth: A case study of a coal mine district in Western China. Ecol. Indic. 2019, 102, 770–782. [Google Scholar] [CrossRef]
  49. Fan, L.; Ma, L.; Yu, Y.; Wang, S.; Xu, Y. Water-conserving mining influencing factors identification and weight determination in northwest China. Int. J. Coal Sci. Technol. 2019, 6, 95–101. [Google Scholar] [CrossRef] [Green Version]
  50. Yu, Y.; Ma, L. Application of roadway backfill mining in water-conservation coal mining: A case study in Northern Shaanxi, China. Sustainability 2019, 11, 3719. [Google Scholar] [CrossRef] [Green Version]
  51. Yu, X.; Mao, X.; Guo, W. Coordinated waterproof mining mode under thick loose sand stratum in Barapukuria coal mine. J. Chin. Coal Soc. 2019, 44, 739–746. [Google Scholar]
  52. Gao, W.; Ge, M. Stability of a coal pillar for strip mining based on an elastic-plastic analysis. Int. J. Rock Mech. Min. Sci. 2016, 87, 23–28. [Google Scholar] [CrossRef]
  53. Ma, L.; Zhang, D.; Wang, S.; Xie, Y.; Yu, Y. Water-preserved mining with the method named “backfilling while mining”. J. Chin. Coal Soc. 2018, 43, 62–69. [Google Scholar]
  54. Gu, D. Theory framework and technological system of coal mine underground reservoir. J. Chin. Coal Soc. 2015, 40, 239–246. [Google Scholar]
  55. Gu, D.; Zhang, J. Modern coal mining affected to underground water deposit environment in West China mining area. Coal Sci. Technol. 2012, 40, 114–117. [Google Scholar]
  56. Li, W.; Wang, Q.; Li, X. Reconstruction of aquifuge: The engineering geological study of N2 laterite located in key aquifuge concerning coal mining with water protection in northwest China. J. Chin. Coal Soc. 2017, 42, 88–97. [Google Scholar]
  57. Xu, Y. Study on “Five Maps, Three zones and Two Zoning Plans” Water Conservation Mining Method in Yu-Shen Mining Area. Master’s Thesis, China University of Mining Science & Technology, Xuzhou, China, 2019. [Google Scholar]
  58. Gu, D. Groundwater Protection and Utilization and Ecological Restoration of Large Coal Base in the Contiguous Area of Shanxi Province, Shaanxi Province and Inner Mongolia Autonomous Region, 1st ed.; Science Press: Beijing, China, 2015. [Google Scholar]
  59. Zhao, C.; Hu, W.; Jin, D. Research on Disturbing Mechanism of Groundwater Environment System and its Evaluation Technique in Shaanxi-Inner Mongolia Coal Mining Region, 1st ed.; China University of Mining and Technology Press: Xuzhou, China, 2018. [Google Scholar]
  60. Wang, S.; Huang, Q.; Fan, L.; Wang, W. Coal Mining and Ecological Water Level Protection in Ecologically Fragile Areas, 1st ed.; Science Press: Beijing, China, 2010. [Google Scholar]
  61. Liang, B.; Cao, D. Fuzzy Mathematics and its Application, 1st ed.; Science Press: Beijing, China, 2007; pp. 41–47. [Google Scholar]
  62. Shaanxi Forestry Department. Available online: http://lyj.shaanxi.gov.cn/ (accessed on 8 July 2020).
  63. Shaanxi Provincial Water Resources Department. Available online: http://slt.shaanxi.gov.cn/ (accessed on 8 July 2020).
  64. National Bureau of Statistics. Available online: http://www.stats.gov.cn/ (accessed on 11 July 2020).
  65. Citroni, R.; Di Paolo, F.; Livreri, P. A novel energy harvester for powering small UAVs: Performance analysis, model validation and flight results. Sensors 2019, 19, 1771. [Google Scholar] [CrossRef] [Green Version]
Figure 1. Location, planning zones, and a part of the boreholes of Yu-Shen mining area (Xi’an geodetic coordinate system 1980).
Sustainability 12 07782 g001
Figure 2. Stratigraphic column of Yu-Shen mining area.
Sustainability 12 07782 g002
Figure 3. The major types of aquifers in Yu-Shen mining area.
Sustainability 12 07782 g003
Figure 4. Influencing factors for evaluating water resource carrying capacity in the mining area (WRCCMA).
Sustainability 12 07782 g004
Figure 5. Sketch map of narrow strip mining in Yubujie colliery.
Sustainability 12 07782 g005
Figure 6. Numerical simulation model of Yubujie Colliery.
Sustainability 12 07782 g006
Figure 7. Numerical simulation results of water table lowering of Yubujie colliery. (a) Groundwater depression cone, (b) the contour map of water table drop.
Sustainability 12 07782 g007
Figure 8. Vegetation and subsidence basin near Yubujie Colliery.
Sustainability 12 07782 g008
Figure 9. Contour map of the overburden strata system. (a) Contour map of the distance from an aquifer to coal seam, (b) contour map of the height of the caved zone, (c) contour map of the WCFZ height, (d) contour map of the aquifuge thickness.
Sustainability 12 07782 g009aSustainability 12 07782 g009b
Figure 10. Zoning map of the groundwater system. (a) Water-rich zoning map of aquifer, (b) zoning map of water level drop of aquifer, (c) zoning map of the coefficient of recharge from precipitation.
Sustainability 12 07782 g010
Figure 11. Contour map of the coal mining system. (a) Contour map of the first mined coal seam thickness, (b) contour map of the maximum subsidence value.
Sustainability 12 07782 g011
Figure 12. Contour map of the comprehensive evaluation value of WRCCMA in Yu-Shen mining area.6. Approaches to maintain the WRCCMA.
Sustainability 12 07782 g012
Table 1. Classification criteria for evaluating the WRCCMA.
GradeClassificationΦ ValueRemark
ICarrying surplusΦ > 0.9Mining activity almost has no influence on the WRCCMA, and water resources can contribute to ecology and social development in a good way.
IICapable of carrying0.9 ≥ Φ > 0.8WRCCMA is slightly affected by mining, while both of them show coordinated development.
IIIModerate carrying0.8 ≥ Φ > 0.7Mining has influenced the WRCCMA to some extent, and some damage has been caused to the surface ecology, but it can be controlled by taking countermeasures.
IVSlightly over-carrying0.7 ≥ Φ > 0.6Coal mining’s impacts on the WRCCMA have already threatened ecological and human development, and the WRCCMA has reached the critical state.
VSeverely over-carryingΦ ≤ 0.6In order to keep the WRCCMA and preserve the eco-environment from continuous deteriorating, mining must be stopped, since its impacts on the WRCCMA have already exceeded the critical state.
Table 2. Influencing factors and weights of WRCCMA.
Weights of Layer BWeights of Layer C
Overburden strata system B1
0.0818
The distance from coal seam to aquifer C1
0.0273
The thickness of aquifuge C2
0.0545
Geological structures system B2
0.0434
Fault strength C3
0.0434
Groundwater system B3
0.3795
Buried depth of groundwater table C4
0.1550
Recharge of groundwater C5
0.0371
Groundwater mineralization C6
0.0324
Water yield property of aquifer C7
0.0775
Groundwater quality C8
0.0775
Coal mining system B4
0.3319
Mining methods C9
0.1791
Mining parameters C10
0.0542
Surface deformation C11
0.0986
Ecological system B5
0.0817
Vegetation coverage C12
0.0272
Total water resources C13
0.0545
Social system B6
0.0817
Water utilization rate C14
0.0163
Water resources per capita C15
0.0654
Total of weights of layer B
1.0000
Total of weights of layer C
1.0000
Table 3. Rock physical and mechanical parameters.
NumberStrataDensity
(kg/m3)
Bulk Modulus
(GPa)
Shear Modulus
(GPa)
Cohesion
(MPa)
Friction Angle
(°)
Tensile Strength
(MPa)
1Fine sandstone260030.820.35.6354.0
2Sandstone25002.52.32.2361.3
3Clay19000.280.0930.85250.35
4Siltstone246016.111.62.0211.2
5Gritstone250020.811.93.0231.4
6Mudstone22008.34.32.1251.0
7Medium sandstone256023.114.54.42.82.0
8Coal seam14002.01.41.7281.5
Table 4. The characteristics of fault in the Yu-Shen coal area.
Name of FaultF1F2F3F4F5F6F7
Fault strength1.231.382.772.872.872.342.58
Table 5. Water utilization rate in Yu-Shen mining area from 2014 to 2018.
Year20142015201620172018
Water utilization rate (%)34.2840.1229.6331.1934.99