Abstract
A crucial problem which China faces is how to improve its energy consumption structure. In this paper, a system dynamic model of energy substitution based on energy capital and putty-clay theory is adopted, in order to explore the substitution effect of natural gas on the energy consumption structure transition in China. The results demonstrate that the huge capital stocks of coal and oil capacities effectively delay the progress of natural gas substitution for optimizing the energy structure, resulting in a limited effect of natural gas substitution in the short term and a large cumulative effect in the long term. Further scenario analyses indicate that natural gas subsidies and carbon price policies have positive effects on the growth of natural gas consumption and the optimization of the energy structure. We also found that a higher pressure of safety supply may emerge to meet the demand for energy consumption in the energy transition. Recommendations are given for improving the energy consumption structure in China from three aspects: allocating capital investment to natural gas, reducing the transition cost between natural gas and other energy sources, and awareness of the systemic risks in energy consumption.
1. Introduction
Coal- and oil-based energy consumption structures contribute to the world economy [1], but increasing environmental pressure has forced people to actively promote a low-carbon transformation [2]. Reducing emissions of pollutants such as carbon dioxide and transforming coal-based energy to controllable clean energy are closely related to the principles of sustainable development [3,4]. At the same time, energy transition is also one of the most important ways to promote the sustainable development of society and the environment [5,6]; however, there still exists a large margin for improvement in the contribution of the energy sector to sustainable development [7]. At present, natural gas plays an important part in energy structure optimization, as it is cleaner and more environmentally friendly (i.e., than coal or oil) [8,9,10]. In 2018, natural gas accounted for 23.3% of the global primary energy consumption and contributed 43% to the growth of energy consumption [11], making an outstanding contribution to the transition to a global low-carbon energy structure [12,13]. In-depth advancement of industrialization and urbanization has boosted natural gas consumption [14,15], but its proportion in China was far lower than the global average [16]. Besides, the long-term regulated natural gas market has restricted the enthusiasm of suppliers in capacity investment [17], resulting in the price of natural gas having doubled since 2013. As a result, consumers were prompted to switch back to oil and coal resources, causing a reverse substitution of oil and coal for natural gas [18]. However, based on the development trend of the natural gas industry, the demand for natural gas in China, which is now in a period of rapid development, is expected to play a major role in the energy transition.
Energy substitution can make a difference in realizing China’s international commitments of energy conservation, emission reduction, and coping with the challenges of global climate change; however, the process is expected to be long and tortuous, due to the dynamic processes involved. Therefore, it is difficult to achieve the zero-emission goal through energy substitution in the short term [19,20]. Considering the potential carbon benefits of natural gas (compared with coal and oil) under climate constraints, it is expected to be the main transitional energy source in the long run [21]. The higher the substitution elasticity of natural gas for coal and oil, the easier it is for their market shares to decline [22]. However, due to the lack of elasticity resulting from price control, the energy substitution of natural gas is limited, and a variety of energy sources are expected to coexist in the energy system for a long period [23]. The difference in substitutions caused by resource endowments also has a direct impact on market selection [24] and, so, how consumers make choices in the energy market has become a core problem. The hypothesis of a rational person assumes that consumers tend to make their choices rationally to maximize their utility [25]. Under this hypothesis, there are mainly deterministic rules and probabilistic selection rules, the latter of which can be applied to the choice of energy consumption market, as it can be used to simulate market behaviors more reliably and truly [26,27].
Due to the serious environmental pollution caused by the coal-based energy consumption structure [28,29], some scholars have focused on the driving factors and favorable effects of the energy consumption structure transition. For example, Xia and Wang [30] concluded that the optimization and adjustment of the energy consumption structure and intensity mainly depended on investment, while Jiang et al. [31] pointed out that, with the increase of energy consumption, the trend of energy structure transforming into renewable energy will be strengthened. The improvement of the energy consumption structure is important for the green transformation of industrial economic development [32] and helps to achieve the reduction of peak carbon emission levels promptly, but at the cost of economic losses [33]. Though the importance of the energy consumption structure transition is self-evident, the process has negative effects; so, whether different energy transition paths will produce risks should also be taken seriously.
The optimization of the energy consumption structure is expected to effectively enhance the stability of the energy system, where a reasonable space for natural gas supply can play a crucial role in economic well-being and social sustainable development [34,35]. In the long term, the energy diversity and sustainability of the energy system are key factors in energy consumption safety [36]. However, short-term risks cannot be ignored, due to the interactions between long-term and short-term energy supporting systems [37]. To avoid market disruption in the short term, it is crucial to ensure the matching of capacity and consumption. To ensure the sustainability and diversification of energy supply, it is vital to enhance the long-term substitution elasticity of clean energy [38]. In this way, with a good interaction between the supply and demand sides, a safe energy system can be formed [12].
Capacity capital shows two-stage characteristics—short-term stickiness and long-term elasticity—with the short-term energy transition facing huge sunk costs [39,40]. According to the putty-clay theory, the heterogeneity of capital leads to the difficulty of transformation of capital goods with weak technical characteristics from one state to another, providing a more comprehensive and analytical perspective for energy substitution from the two-stage characteristics of capital [41,42]. Heterogeneous characteristics have been found in the capitals of diverse energy sources, due to their differences in productivity and capital intensity. Therefore, the effects of policy implementation for energy structure adjustment vary in different periods [43,44,45]. Furthermore, it is helpful to measure the dynamic substitution elasticity by analyzing the impact of the behavior difference of capacity capital on the energy market [39,46,47].
Few studies have analyzed the change trend of energy substitution elasticity from the perspective of capital flow, and the potential risks of energy consumption shortage in the energy consumption structure transition have barely been discussed. On this basis, this study analyzes the effects of natural gas substitution on China’s energy structure transition and reveals the change mechanism of the capital flow structure from the perspective of energy capacity capital heterogeneity. To this end, a system dynamics model of energy substitution based on the energy capital putty-clay theory is adopted, and an effective path of natural gas consumption expansion and corresponding capacity capital investment is put forward. Meanwhile, we also focus on the negative impact of natural gas substitution on the energy consumption space and propose coping strategies, hoping to lay a solid foundation for promoting a successful transition from high-carbon energy to cleaner energy.
2. Materials and Methods
2.1. System Dynamics Model of Energy Substitution
Many economists have used the constant elasticity of substitution (CES) production function, the translog production function, or the even more comprehensive computable general equilibrium (CGE) model to analyze the process of energy substitution and structure transition. For example, Zha and Zhou [48] analyzed the combination mode between energy and non-energy input factors in China’s industrial sector by using the CES production function; Pablo-Romero et al. [49] adopted the translog production function to estimate the substitution elasticity of 12 EU countries from the perspective of output growth, in order to obtain the impacts of different energy use patterns on the energy use of various sectors; Cui et al. [50] used a multisector CGE model with different nested structures and different elasticities of power sources to analyze the economic and environmental impacts of reducing renewable energy generation curtailment in China. These methods provide a mature theoretical analysis framework for the research of energy substitution concerning energy market demand, substitution effects, and influencing factors. However, the impact of capacity capital for energy production is different in different stages, and there is also a dynamic flow process; however, the dynamic characteristics of capital are not fully considered in the assumptions of these common methods. Compared with these methods, the dynamic model of energy substitution system (ESSDM) proposed by Moxnes [39], based on the putty-clay theory, can describe the dynamic behavior of capital in the energy system. Meanwhile, embedding the putty-clay theory into energy production research can comprehensively depict non-linear and complex energy systems. Therefore, we adopted this model to simulate the process of energy substitution in China.
The model supposes that the choice of primary energy (e.g., coal, oil, natural gas, and electric power) can be freely adjusted ex-ante, whereas no substitution is possible ex-post. Thereby, substitution depends on the investment into equipment freshly installed in the short-term run, as well as the stocks of existing equipment depicted by two vintages of capital in the long term. In this paper, in particular, electric power includes hydropower, wind power, solar power, and other renewable energy sources. To clearly illustrate this model, the system flow diagram is shown in Figure 1.
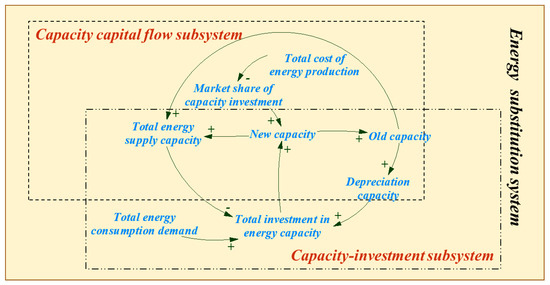
Figure 1.
Framework of the energy substitution system dynamic model. The system consists of two sub-systems, (a) a capacity capital flow sub-system; and (b) a capacity–investment sub-system.
To simplify, let i represent different energy sources and the total cost of energy production consist of investment cost, operation cost, environmental cost, and premium cost, which can be expressed as:
For an energy source i, is the fixed cost of capacity construction, is the payback period of capital investment, is the operation cost in the construction process, is the market price, is the coefficient of CO2 emission, is the carbon trading price, and is the combustion efficiency. is the premium cost, which is used to describe the properties that are difficult to measure directly, such as variability, incentive status, and availability. This parameter needs to be obtained according to the calibration results of historical behavior. Among these parameters, the changes of energy market price and carbon trading price belong to market behavior, the payback period describes the response speed of capital, and the change of premium cost comes from government behavior, while the improvements of variable cost and efficiency depend on technological progress.
The cost of energy directly determines the attraction of new capital investment in the construction of this energy capacity (in other words, the market choice of capital). We adopted the multiple logit equation to describe the relationship between the cost and the investment share :
where α is a non-negative parameter, , and . Under the same condition, a share is a decreasing function of the energy price . The total investment I is the capital of the new capacity investment in the current year, where the investment of the ith energy is:
The capital flow of energy equipment capacity is interpreted according to the vintage difference considering the putty-clay theory. Equipment capital (equally regarded as the equipment capacity) can be classified into two kinds of capital. One is the capacity for the newly installed equipment in the current period (KN), while the other is that for existing equipment, called the old capacity (KO). In the whole life cycle of the equipment, new equipment becomes old equipment, which is eliminated after a certain running period. Finally, the depreciation of equipment leads to investment in new equipment. In order to clearly describe the depreciation process, it is assumed that new equipment is classified as old equipment after half of its life cycle, and old equipment is eliminated after the rest of the time. Based on these assumptions, the capacities of new equipment and old equipment over time can be expressed by Equations (4)–(6):
At time t, the capacity of all depreciated equipment is as follows:
The balance of energy supply and demand determines the direction of capacity investment, where its gap reveals signals to the market which guide investment adjustments [51]. Therefore, the relationship among investment capital, depreciation capacity capital, total demand, and total capacity is obtained as:
where TI is introduced to measure the response speed of capacity investment in the energy market, and the total consumption demand of energy is recorded as ED. The capacity of the existing equipment is , where represents the total capacity of energy i, while . Furthermore, f (x) is a piecewise continuous function, expressed as follows:
where β is a non-negative constant. When the total capacity is equal to the total consumption demand, f (0) = 1 denotes that the new investment (i.e., next year) is equal to the depreciated equipment.
is the capacity utilization rate, which is introduced to measure the balance level of energy sources between the total capacity and total demand, in order to track the impact of supply and demand fluctuation on each energy and, then, estimate the consumption levels of different energy sources. The calculation process is as follows:
It is assumed that the capacity utilization ratio of each energy source is equal to the overall level of the energy market (i.e., for each energy , ). Under this assumption, the simulated consumption value is:
Details of all variables involved in the above-mentioned equations are summarized in Table 1.

Table 1.
Details of the used variables.
2.2. Model Calibration
The focus of this paper is China’s primary energy consumption, such as coal, oil, natural gas, and electric power. The calibration period lasted from 2000 to 2018. The data of energy consumption were obtained from the National Bureau of Statistics; the prices of coal, oil, and natural gas were obtained from BP; the price of electric power was obtained from the National Energy Administration; and the rest of the data were obtained from the International Energy Agency. The initial values of some parameters are provided in Table 2.
Table 2.
Initial values of relevant parameters.
To simulate the consumption of coal, oil, natural gas, and electric power, there are 13 parameters to optimize in ESSDM, including and . Considering the high non-linearity of ESSDM, we adopted a genetic algorithm to obtain the optimal values of these parameters. The optimal values of different parameters found by the genetic algorithm are shown in Table 3. These parameters were further brought into the ESSDM to simulate the structure of the capital and energy consumption in the energy system.
Table 3.
Results after parameter calibration.
The initial stock capital of coal (KO) was the largest, as shown in Table 3, indicating that coal consumption has strong stickiness and that the entire energy market depends heavily on coal; meanwhile, natural gas and electric power had less stickiness and market basis. Oil consumption had the minimum stickiness, which shows that oil consumption is in a tight equilibrium state without redundancy in China’s energy market. Based on new investment capital (KN), the elasticities of coal, oil, and electric power consumption were stronger than that of natural gas, reflecting that the capital market prefers to invest in these three energy sources than in natural gas. Based on premium cost (PR), the figures of coal and natural gas were negative (i.e., −988 yuan/toe and −11472 yuan/toe, respectively). These results indicate that both the environmental cost of coal and the capital conversion cost of natural gas were high, which serves to restrain the growth of their consumption levels. Furthermore, the premium costs of electric power and oil were positive but lower than that of coal, indicating that the consumption of the first two energy sources did not form a significant cost advantage in the market. In conclusion, the initial capital putty-clay structure of the energy market in China has created an inherent resistance to the Chinese government’s vigorous promotion of clean energy policies.
The energy consumption structure from 2000 to 2018 in China is shown in Figure 2, which demonstrates that the total energy consumption has been growing rapidly, while the optimization process of the energy consumption structure has evolved slowly. Specifically, coal consumption maintained a rapid growth until 2011, after which there has been a steady downward trend. Oil consumption has been growing slowly, while clean energy sources such as natural gas and electric power have maintained a rapid growth since 2010. The simulated demands of various energy sources were consistent with the actual ones, and the mean absolute percentage errors (MAPE) of the predictions of coal, oil, natural gas, and electric power were 1.60%, 4.1%, 8.98%, and 6.74%, respectively. All of them were less than 10%, revealing that the model established in the study could simulate the growth of energy consumption in China and capture the evolution process of energy consumption structure under the existing energy policy settings.
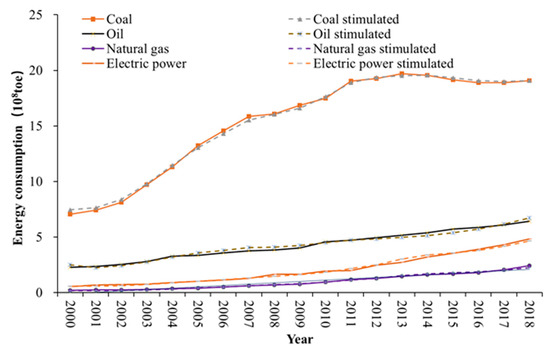
Figure 2.
Comparison between the actual (solid lines) and the simulated (dashed lines) values of energy consumption from 2000 to 2018 in China.
3. Results
The putty-clay attributes of energy capacity capital can determine the short- and long-term elasticities of energy substitution, respectively. The analysis of this effect can clearly demonstrate the transition path from traditional energy to clean energy sources such as natural gas, which is conducive to the formulation of energy transition policies. Therefore, we simulated and analyzed the short-term mutual substitution effect between the four kinds of energy sources from 2000 to 2018 and further deconstructed the evolution process of their capacity capital, in order to gain insight into the long-term cumulative effect of natural gas substitution.
3.1. Short-Term Substitution Effect
We used substitution elasticity to describe the substitution effect of natural gas. There are various forms of substitution elasticity, and cross-price elasticity is preferable in practical applications [52]. Therefore, we adopted cross-price elasticity to measure the substitution effect of natural gas, as shown in Equation (11):
where is the marginal consumption of i and is the marginal price change of j. The specific process was as follows: In the first step, we set the price range of natural gas as {0, 40,000} yuan/toe and obtained 5000 price data series in steps with an interval of 8 yuan/toe. In the second step, the price was successively brought into the system dynamics model to obtain the corresponding coal consumption data series. Considering that energy consumption in China can be affected by the macroeconomic and social environment, we determined the cross-price elasticity distribution of energy in 2000, 2004, 2008, 2014, and 2018. The reason for this is that 2000 and 2018 were the initial and end years of the research samples; in 2004, the west-to-east gas transmission line was fully connected, and China began to use natural gas on a larger scale; in 2008, the global financial crisis occurred; and international crude oil prices fell precipitously in 2014.
As can be seen from the curve of substitution elasticity (Figure 3), the demand cross elasticity increased rapidly at first and, then, decreased slowly after reaching its peak, with an increase of substitution energy price. In the price range of {0, 5000} yuan/toe, the substitution elasticity of natural gas to coal gradually increased, showing a positive substitution effect; when the price exceeded 5000 yuan/toe, there was a reverse substitution effect of coal. The price range of the positive substitution effect of natural gas for oil was {0, 8500} yuan/toe; if it exceeded this range, the negative substitution effect occurred. In 2000–2018, the average prices of coal, oil, and natural gas (see Table 2) were 1091, 5765, and 2609 yuan/toe, respectively, but the cost of replacing coal was 5000 yuan/toe, higher than the average price of coal. Similarly, the cost of replacing oil was higher than the average price of oil, at 8500 yuan/toe. Therefore, the difference between the replacement cost and the average energy price formed the energy conversion cost, which creates resistance against energy conversion.
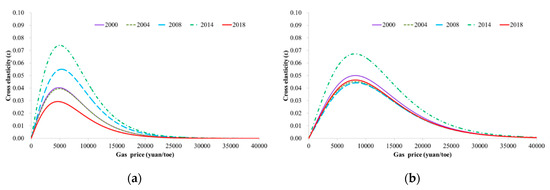
Figure 3.
Primary energy substitution in China from 2000 to 2018: (a) for natural gas to coal; and (b) for natural gas to oil.
Overall, substitution elasticities among the different energy sources were less than 0.1, indicating that the existing energy sources in China are difficult to replace with each other. Regarding the period difference of the elasticity of substitution, in 2004, the west-to-east natural gas pipeline was fully connected, expanding natural gas consumption and starting the process of natural gas substitution for coal and oil. In 2008, the economic downturn caused by the global economic crisis accelerated the process of substitution. In 2014, the precipice of global oil prices led to the decline of natural gas prices. With the global economic recovery and oil price rise in 2018, the elasticity of substitutions has declined.
3.2. Long-Term Capital Heterogeneity
The time-cumulative effect of energy substitution comes from the capital flow of capacity and transformation between the new and old capacities, which can be described by Equations (4)–(7). We present the evolution process of new and old capacity capitals for four kinds of energy sources from 2000 to 2018 in Figure 4.
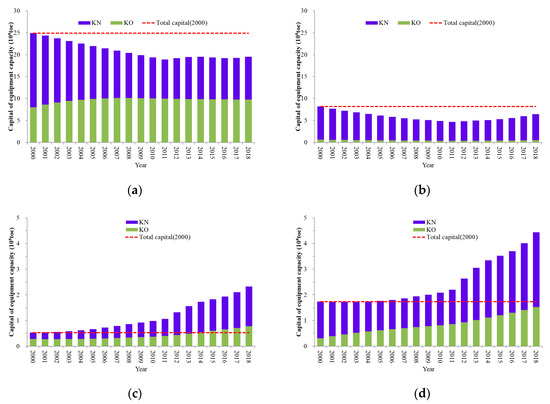
Figure 4.
Capital changes of new and old primary energy capacity in China from 2000 to 2018: (a) for coal; (b) for oil; (c) for natural gas; and (d) for electric power.
Compared with 2000 (shown by the red dotted line in Figure 4), the capacity capital changes of the four kinds of energy sources show that the energy market can stay elastic in the long term. Specifically, since 2007, the capacity capital of natural gas and electric power has increased significantly, compared with that in 2000, and the long-term elasticities of these two kinds of energy have gradually increased (Figure 4c,d). Similarly, the total capacity capital of coal kept decreasing and stabilizing (Figure 4a), while the long-term elasticity tended to stabilize from 2010. The oil capacity capital fluctuated (Figure 4b), leading to its long-term elasticity changing from small to large and, then, decreasing.
The drivers of long-term elasticity change mainly derive from the long-term response of new capacity to energy market investment. New capacity capitals of natural gas and electric power have been growing with an accelerating trend, reflecting the long-term preference and positive response of the capital market for investment in clean energy sources such as natural gas and electric power. However, investments in coal and oil are constrained by environmental regulations and excessive early-stage investment, which led to the total capacity capital being greater than the actual demand in 2011 (Figure 4a,b). Therefore, the capacity capitals of these two energy sources are relatively surplus, and the decline of new capacity investment indicates the cautious response to invest in them. Although capital investment in new capacity of oil had picked up since 2011, natural gas and electric power have gradually replaced the demand for coal and part of oil.
Based on the flow process of energy capacity capital (see Equations (4)–(7)), the changes of the capacity capitals of the four energy sources were gradually increasing or decreasing, which shows the rigid response of capacity capital to market demand in the short term; that is, the stickiness of capacity capital. The investment in capacities of natural gas and electric power has increased the accumulation of new capacity capital and the stock of old capacity capital, such that the capital stickiness has gradually expanded the market basis of the consumption of these two energy sources, while still being smaller than that of coal. The old capacity capital of oil has been maintained at about 0.5 × 10⁸ toe; thus, the amount of new capacity capital converted to old capacity capital simply makes up for the depreciation loss of oil. This means that oil consumption does not have a relatively stable market basis and is easily affected by market prices and other factors. However, the conversion costs between oil and other energy sources are very large, thus forming closeness in the oil market.
The putty-clay structure of capacity capital can explain the slow adjustment of energy consumption structure in China. The continuous downturn of market demand for coal is transmitted to the production process, while new capacity capital with the elasticity of coal can respond quickly and then decline. However, due to the stability of sticky capital, it is difficult to immediately transform the production process to clean energy. Therefore, the pace of structural adjustment of coal removal has been hindered. The proportion of oil capacity capital in the clay stage is not high and is still in the process of capital accumulation. Meanwhile, with the rapid process of industrialization, the demand for oil has been stimulated and new capacity rapidly promoted, such that the oil market will remain stable for a long time. The changes of capacity capital of natural gas and electric power are similar. However, it is difficult to guarantee the energy supply to match market demand, due to the low level of accumulation of capacity capital of natural gas; therefore, it is not easy to promote the rapid formation of the natural gas consumption market.
4. Scenario Analysis and Discussions
4.1. Scenarios
We chose 2019 as the base year for simulation. To simulate the future adjustment trends in the energy structure, it was necessary to estimate the exogenous variable of total energy consumption demand, which could be decomposed into three parts: EI (energy intensity), PGDP (GDP per capita), and POP (population size) (Table 4) [53]. The process was as follows: The situation of population change in China was set at the middle level of population growth scenario, according to the prediction of natural growth rate based on the World Population Prospects issued by the United Nations Population Division [54]. Considering the exponential decline of energy intensity in China, we set the energy intensity in China as an index function with an average annual decline rate of 0.042. GDP per capita was obtained by a quadratic function fitting. According to the fluctuation of energy prices over the years, the annual fluctuation range of market prices of each energy source was set to be within 5%; that is, the randomly generated sequence of energy price changes was obtained as [47,55].
Table 4.
Estimation equation of total energy demand.
According to the given parameters, the path of energy consumption structure change in China from 2019 to 2050 was obtained by the model (Figure 5), which was labeled as the BAU (business as usual) scenario. The simulation path showed that, under the current factor-driven background, the energy system transition trend in China will improve for a long time, but the speed of clean adjustment will remain slow. Coal and oil are the main consumed energy sources in the economic production process. In the early stage, the consumptions of natural gas and electric power steadily increase, and the market share of electric power surpasses that of oil. However, in the later stage, the development of natural gas stagnates and clean energy is not dominant in the Chinese energy consumption structure.
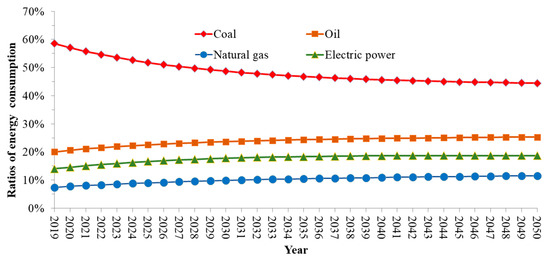
Figure 5.
Simulation of energy consumption structure adjustment path in China from 2019 to 2050.
In order to further improve the important role of natural gas through rational adjustment of the energy structure, as well as to ensure energy security, it is necessary to discover effective incentive strategies for the development of natural gas, in order to promote the rational allocation of capacity capital in the energy system. Therefore, we simulated the energy consumption structure under different scenarios. According to the different characteristics of parameters (Table 1), the main scenarios’ settings were as follows (see Table 5 for specific parameter adjustments in each scenario):
Table 5.
Related parameter settings of natural gas in each scenario.
(1) Market scenario: Adjustment of carbon price. The carbon trading mechanism can encourage the market to adjust the production and consumption structure, where the carbon price reflects the efforts to introduce a market mechanism to address the energy optimization and carbon emission reduction. However, the current carbon trading price has difficulty in effectively describing the cost of environmental damage. The results of the 2017 China carbon price survey showed that consumers expect the carbon trading price to be within the range of 50 yuan/t to 200 yuan/t [56]. Therefore, we set the carbon trading price at 50, 100, and 200 yuan/t, in order to measure the contribution of different market constraints to the development of natural gas.
(2) Government scenario: Adjustment of premium cost. To speed up the goal of optimizing and adjusting the energy structure, the government needs to provide effective subsidies to improve the energy consumption structure and environment through financial tools. As the low premium level of natural gas makes it difficult to stimulate the production side of the energy market, we set the subsidies provided by the government for the production side of natural gas to 10%, 20%, and 30% of the premium cost.
(3) Efficiency scenario: Adjustment of technical efficiency. Technological advances are crucial for energy utilization, where energy efficiency reflects the level of technological advances. Based on the existing efficiency of natural gas utilization, it was assumed that the efficiency was increased by 80%, 85%, and 90%.
(4) Capital scenario: Adjustment of payback period. Capital plays an important role in the process of energy substitution, where the investment payback period reflects the process and speed of capital depreciation and recovery; that is, the market opportunity for investment. The payback period of capital investment was set at 8 years, 6 years, and 5 years, in order to observe the effects of capital flow rate on the optimization of the energy consumption structure.
4.2. Natural Gas Consumption Expansion
The evolution of energy consumption structures was simulated under the market, government, technology, and capital scenarios, in order to analyze the cumulative effect of policy adjustment on the proportion of natural gas consumption and the impact of the spillover effect of natural gas consumption growth on the optimization of the energy structure adjustment path in China. The simulation results are shown in Figure 6.
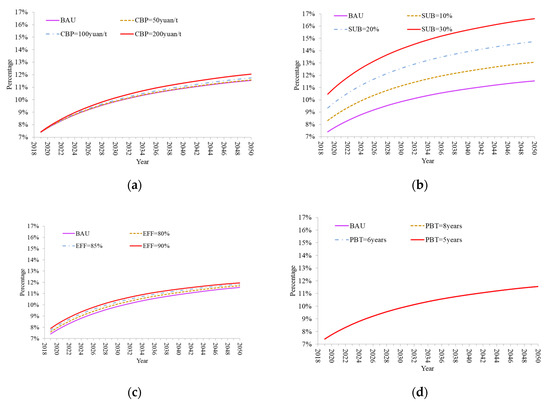
Figure 6.
Simulation of the evolution of the natural gas consumption structure: (a) in the market scenario; (b) in the government scenario; (c) in the efficiency scenario; and (d) in the capital scenario.
Under the existing policies, the simulated proportion of natural gas consumption in China slowly rose from 7.4% in 2019 to 11.5% in 2050, which is smaller than the expectation of the Chinese government (i.e., the proportion of natural gas consumption in the whole energy structure should be 15% by 2030). From the simulation results of four scenarios, the cumulative effects of government subsidy policies on the consumption promotion of natural gas were the most significant. When the subsidy increased by 30%, the proportion of natural gas consumption reached 16.6% in 2050; that is, 5.5% higher than in the BAU scenario. The increase of carbon price and the improvement of natural gas combustion efficiency did not significantly increase the proportion of natural gas consumption, which was only about 0.5% higher than that in the BAU scenario. The reason for this may be that carbon price and efficiency have little impact on the total cost of natural gas production equipment, which cannot significantly change the consumption market preference for natural gas. Furthermore, the payback period had little impact on the proportion of natural gas consumption (Figure 6d). The reason for this may be that the fixed cost of natural gas was only 66.7 yuan/toe (Table 2). Although reducing the payback period can speed up the recovery of fixed costs, the impact on the total cost is very small, which cannot change the choice behavior of the energy consumption market.
Considering the evolution process of the energy consumption structure, carbon trading and subsidy policies had distinct characteristics at different stages for the optimization and adjustment of the energy consumption structure in China. In the early stage of policy implementation, the effect of energy structure adjustment was not obvious, while after 2030 the long-term cumulative effect of policy implementation appeared rapidly. Therefore, increasing the carbon price and natural gas market subsidies not only increased the consumption proportion of natural gas in the energy consumption market, but also accelerated the transformation from coal and oil into clean energy sources such as natural gas and electric power. Therefore, in the process of energy structure adjustment, the development of natural gas should be led by the government, and the development environment of natural gas should be optimized through an effective and reasonable policy implementation mechanism, supplemented by a reasonable level of market power. Furthermore, technology is also an important means for the transition stage of energy adjustment within the next couple of decades.
4.3. Natural Gas Capacity Investment
In the discussion in Section 4.2, we found that altering the natural gas efficiency and payback period on investment did not effectively optimize the energy structure. Therefore, in this section, we mainly observe the dynamic evolution process of natural gas equipment capacity, depreciation, and investment under the two scenarios of market and government, in order to provide a reference for natural gas market investment in China. For this reason, we present the change paths of natural gas equipment capacity, depreciation, and investment from 2019 to 2050, as shown in Figure 7.
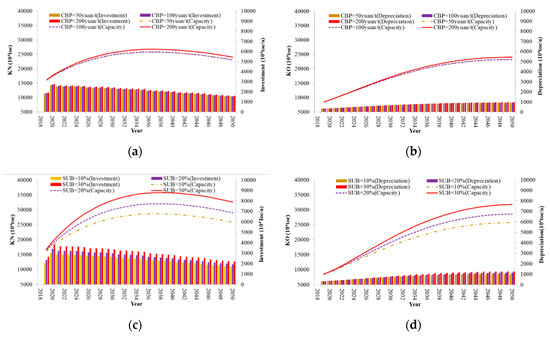
Figure 7.
Changes in natural gas capacity capital, investment, and depreciation in China from 2019 to 2050: (a,b) in the market scenario; (c,d) in the government scenario.
From the results of the market scenario simulation (Figure 7a,b), the impacts of increasing the carbon trading price on the capacity, investment, and depreciation of natural gas from 2019 to 2050 are not obvious. Capacity investment forms new equipment capacity in the market, thus promoting the growth of new natural gas capacity. However, with the annual capacity investment slowly decreasing from 1.8 × 10⁷ toe/a in 2020 to 1.5 × 10⁷ toe/a in 2050, the new capacity remained at the level of 2.5 × 10⁸ toe after 2034. Why did new investment not promote new capacity after 2034? The reason for this may be that the new investment made up for the transfer of new capacity to old capacity and the depreciation loss of old capacity, as explained in Figure 7b. As can be seen from the figure, the new capacity increased and then converted to old capacity, such that the old capacity increased rapidly—from about 8.4 × 10⁷ toe in 2019 to about 1.9 × 10⁸ toe in 2034. After 2034, with the depreciation of new capacity and the old capacity remaining stable, the old capacity increased slowly and remained at about 2.4 × 10⁸ toe.
From the results of the government scenario simulation (Figure 7c,d), increasing government subsidies were seen to significantly affect the new and old capacities of the natural gas market. When the subsidy increased by 30%, the new and old capacities of natural gas reached 3.5 × 10⁸ toe and 3 × 10⁸ toe, respectively, thus forming a consumer market with a total capacity of 6.5 × 10⁸ toe. From the perspective of investment changes, before 2038, the annual investment was more than 3 × 10⁷ toe, after which the investment slowed down to about 2 × 10⁷ toe. Only in this way can we make up for the depreciation loss of old capacity and maintain the growth trend of natural gas capacity and stability after 2038.
Comparing the simulation results of the market and government scenarios, the intensity of capacity investment under the government subsidy was higher than that under the market scenario, about 107 toe/a. Such differences in investment intensity led to differences in the evolution paths of total capacity under the two scenarios, where the difference in total capacity gradually expanded with the increase of investment time. By 2050, the gap between the two scenarios widened to 1.7 × 10⁸ toe/a. Furthermore, the peak of total capacity in the market scenario was around 2034, while that under the government scenario was around 2038. It can be seen that the government scenario contributed the most to adjusting and guiding the allocation of natural gas capacity, indicating that an effective subsidy under the guidance of the government provides the most critical way to improve the environment of the natural gas capacity market. Although natural gas capacity investment under the market scenario did not significantly increase the natural gas consumption in energy market, it can significantly reduce the coal consumption and induce increases in the proportion of electric power and oil consumption. As a result, the energy consumption structure can be optimized.
4.4. Negative Effect of Natural Gas Substitution
While improving the consumption of natural gas and optimizing the energy structure, it is also necessary to pay attention to the negative effects caused by natural gas substitution. Therefore, the safety level of market demand caused by the increase of natural gas consumption was also measured in our study.
We chose 2050 as the research time node to simulate the price demand function curve and price demand elasticity of natural gas in China under the market and government scenarios, in order to analyze the natural gas market’s safety space of consumption and price. The specific steps were as follows: First, we selected the natural gas price range of {0, 40,000} yuan/toe and set the step interval of 8 yuan/toe to obtain 5000 price data series. Second, we input the price data series into the energy system dynamics model to obtain 5000 consumption quantities corresponding to the price order, and then obtained the demand function curve. Finally, we used Equation (12) and the difference method to calculate the price elasticity series, in order to obtain the price elasticity distribution curve:
where and are the marginal consumption and the marginal price change level, respectively, of energy source i. The demand function and price elasticity curve under the market scenario and government scenario are shown in Figure 8.
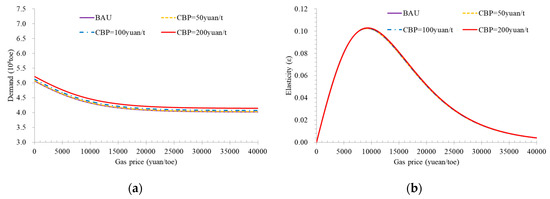
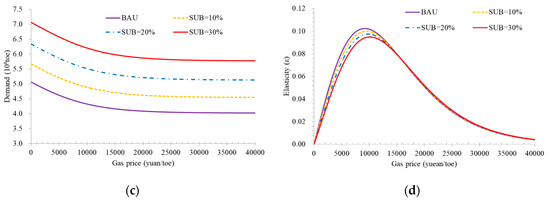
Figure 8.
Demand function and price elasticity distribution of China’s natural gas in 2050 under the market and government scenarios: (a) market scenario, demand function; (b) market scenario, price elasticity; (c) government scenario, demand function; and (d) government scenario, price elasticity.
Both demand function curves showed an “L” shape, according to the simulation results under the market and government scenarios. This indicates that, with the increase of price, the consumption of natural gas gradually decreased, while the market consumption presented an elastic response. However, the market demand appeared to be viscous when the price exceeded 1500 yuan/toe, after which it no longer decreased with the increase of price. Accordingly, the inflection point of the demand elasticity curve appeared at about 1000 yuan/toe and, so, it can be estimated that the price space of natural gas in 2050 is {0, 1000} yuan/toe. Moreover, the maximum price elasticity in 2050 was about 0.1, indicating that the natural gas market price lacked elasticity and showed a certain degree of rigid consumption (Figure 8b,d).
The main difference was that the consumption safety level of the natural gas market in 2050 under the government scenario was greater than that under the market scenario (Figure 8a,c). Under the BAU scenario, the upper limit of natural gas consumption was 5.06 × 10⁸ toe/a (when the natural gas price was equal to 0 yuan/toe) and the demand guarantee was 4.02 × 10⁸ toe/a (when the price was more than 1500 yuan/toe). Meanwhile, in the government scenario, with the increase of subsidies, the maximum consumption increased from 5.67 × 10⁸ toe/a to 7.01 × 10⁸ toe/a and the demand guarantee level increased from 4.54 × 10⁸ toe/a to 5.77 × 10⁸ toe/a. Under the market scenario, the safety space of natural gas consumption was similar to that under the BAU scenario (Figure 8a). When the price of carbon trading increased to 200 yuan/t, the demand of maximum market consumption was about 5.27 × 10⁸toe/a and the guarantee level was 4.15 × 10⁸ toe/a. Obviously, both the market and government scenarios improved the minimum guarantee quantity of natural gas consumption. However, the domestic natural gas supply is limited. Therefore, the market may face a huge demand gap, which could cause serious market consumption security concerns.
Moreover, the natural gas market in China may face the dilemma of consumption security and price security. When the market supply is at the minimum guarantee quantity, the price of natural gas will be about 15,000 yuan/toe, far higher than the average market price of 2609 yuan/toe (Table 2), which exceeds the market price tolerance and leads to price risk. If the average market price reaches 2609 yuan/toe, the market supply under the market scenario will reach 4.96 × 10⁸ toe/a, and the market supply under the government scenario will reach 6.80 × 10⁸ toe/a.
5. Conclusions
Based on the putty-clay theory, we adopted a system dynamics model (ESSDM) to describe the flow and transformation process of new and old energy capacity capitals, as well as to analyze the evolution mechanism of the natural gas substitution effect on the energy consumption structure transition. The impact of natural gas substitution on the energy structure optimization path from 2019 to 2050 in China was analyzed using scenario simulations, in order to put forward corresponding countermeasures to build a sustainable energy system from the aspect of reasonable energy supply, such that it can be ensured that natural gas consumption will be adequate and effective in the long term. Our main conclusions are as follows:
- Under the current policy, market, and technical environment, the substitution of natural gas for coal and oil has the advantage of reducing the energy conversion cost, but the substitution effect is small. The main reason for this is that the capacity capital stock of coal and oil are large and sticky. Therefore, it is difficult to adjust and recover in a short period through depreciation and a gradual and long-term process is required for natural gas to replace oil and coal, followed by the optimization of the energy structure.
- Increasing market subsidies for natural gas consumption and carbon trading prices not only promotes consumption, but also accelerates the transition of energy consumption from coal and oil to natural gas and electric power. The efficiency improvement of natural gas combustion technology will improve the consumption of natural gas, but cannot serve to effectively replace coal and oil. Reducing the capital payback period of natural gas capacity can improve the speed of capital recovery; however, it cannot increase the consumption share of natural gas or promote the optimization of the energy structure.
- The capital investment intensity of natural gas capacity under subsidy policies will be greater than that under carbon price policies. Although subsidy and carbon price policies can increase the consumption of natural gas, they could increase the minimum supply guarantee level to meet the consumption of natural gas, which may lead to an unpredictable risk of energy demand.
By investigating the challenges of the natural gas substitution effect in the Chinese energy consumption structure, several policy recommendations can be provided to facilitate the smooth transition from high-carbon energy to natural gas:
- The implementation of energy substitution policies should focus on breaking the deep-seated structural contradictions in the process of energy transition. Both energy substitution stickiness and the cost of energy conversion are very high, due to the high capital stock of capacity equipment of coal and oil, which has become the main obstacle for the replacement of traditional energy sources by natural gas. Therefore, in the processes of policy-making for “coal to gas” and “oil to gas” and in other related approaches with natural gas as the main substitution energy, we should take a step-by-step approach. Specifically, it may be helpful to speed up the establishment and improvement of capacity management and control mechanisms, to eliminate inefficient and high-cost excess capacity in time, and to further accelerate the investment in natural gas capacity capital, in order to strengthen the accumulation of sticky capital. At the same time, it is necessary to break down the barriers of technology, market, and the cost of the interconnection between different energy sources, while promoting the coordinated development of energy systems, in order to reduce the cost of energy conversion and to facilitate the smooth transition from high-pollution fossil energy to clean energy.
- Reasonable measures to reduce the conversion costs, in line with the phased objectives of social and economic development, should be taken to continuously cultivate and improve the natural gas consumption market. Our simulation results showed that the subsidy tool is key to increasing the share of natural gas in the short term, the effect of carbon trading price adjustment on energy structure is reflected in the long term, and enhanced technologies are reflected in the medium term. Therefore, the subsidy intensity of capacity should be adjusted in a timely manner, according to market fluctuations. At the same time, the carbon trading price and the strength of technology improvement, which show less effects in the short term, should be set based on the expected performance of medium- and long-term market consumption, in order to ensure that the implementation of the measures can take effect in the future and that the coordinated and orderly development of the natural gas market can occur.
- It is necessary to grasp the opportunity period of energy transition and promote the optimization of the energy investment structure. The peak energy consumption level in China may appear in the 2030s. Continuous additional investment into coal and oil with high pollution and low efficiency will not be conducive to the early arrival of the peak, while the high efficiency of natural gas combustion will not affect the quality of energy utilization. Therefore, before the peak of energy consumption arrives, the government should take this opportunity to increase the exploitation and utilization of natural gas, promote its high-quality and large-scale development, and gradually increase its proportion of market consumption. On the basis of expanding the natural gas consumption market, the “crowding out effect” could be produced through the investment demand of high pollution fossil energy, thus optimizing the structure of the energy investment market.
- The systematic risk caused by natural gas substitution should be reduced, and the sustainable operation of the energy system should be ensured. The rapid growth of natural gas consumption demand will have impacts on all aspects of the natural gas industry chain (e.g., its supply system) and cause the overall fluctuation of the energy market. Therefore, the government should take precautions: on the one hand, strengthening the exploration and development of domestic natural gas resources and international diversified import sites to improve the supply guarantee capacity; on the other hand, increasing the complementarity of major energy varieties such as coal, oil, and gas in the energy consumption network, while supervising the reasonable operating range of various energy market prices, which can serve to maximize the effect of price adjustment on the improvement of substitution elasticity and ensure the high-quality development of the energy system.
Author Contributions
Conceptualization, W.X. and L.Y.; methodology, W.X.; writing—original draft preparation, W.X.; writing—review and editing, T.W. and Y.G.; visualization, T.W.; supervision, L.Y. All authors have read and agreed to the published version of the manuscript.
Funding
This research received no external funding.
Acknowledgments
We would like to thank the editor and the anonymous reviewers for their helpful comments and suggestions.
Conflicts of Interest
The authors declare no conflict of interest.
References
- Wang, Z.Q.; Li, Y.C.; Zhang, J.F.; Wen, K. Natural gas consumption forecasting model based on coal-to-gas project in China. Glob. Energy Inter. 2019, 2, 429–435. [Google Scholar] [CrossRef]
- Unurjargal, N.; Willi, S. Climate change and the transition to a low carbon economy—Carbon targets and the carbon budget. Econ. Model. 2020, 84, 367–376. [Google Scholar]
- Mele, M.; Magazzino, C. A Machine Learning Analysis of the Relationship among Iron and Steel Industries, Air Pollution, and Economic Growth in China. J. Clean. Prod. 2020, 277, 123293. [Google Scholar] [CrossRef]
- Udemba, E.N.; Magazzino, C.; Bekun, F.V. Modeling the nexus between pollutant emission, energy consumption, foreign direct investment, and economic growth: New insights from China. Environ. Sci. Pollut. Res. 2020, 27, 17831–17842. [Google Scholar] [CrossRef]
- Ferreira, P.; Soares, I.; Lund, H. Engineering and economics perspectives for a sustainable energy transition. Energy 2020, 207, 118288. [Google Scholar] [CrossRef]
- Ibrahim, M.D.; Alola, A.A. Integrated analysis of energy-economic development-environmental sustainability nexus: Case study of MENA countries. Sci. Total Environ. 2020, 737, 139768. [Google Scholar] [CrossRef]
- Simsek, Y.; Santika, W.G.; Anisuzzaman, M.; Bahri, P.A.; Escobar, R. An analysis of additional energy requirement to meet the Sustainable Development Goals. J. Clean. Prod. 2020, 272, 122646. [Google Scholar] [CrossRef]
- Zhang, Y.; Ji, Q.; Fan, Y. The price and income elasticity of China’s natural gas demand: A multi-sectoral perspective. Energy Policy 2018, 113, 332–341. [Google Scholar] [CrossRef]
- Wang, K.; Wu, M.; Sun, Y.; Shi, X.; Sun, A.; Zhang, P. Resource abundance, industrial structure, and regional carbon emissions efficiency in China. Resour. Policy 2019, 60, 203–214. [Google Scholar] [CrossRef]
- Zhou, N.; Wu, Q.; Hu, X.; Xu, D.; Wang, X. Evaluation of Chinese natural gas investment along the Belt and Road Initiative using super slacks-based measurement of efficiency method. Resour. Policy 2020, 67, 101668. [Google Scholar] [CrossRef]
- Dudley, B. BP Statistical Review of World Energy, 68th ed.; BP Statistical Review: London, UK, 2019; pp. 1–8. [Google Scholar]
- Du, X. Energy Revolution: For the future of sustainable development. China Popul. Resour. Environ. 2014, 24, 1–4. [Google Scholar]
- Liu, P.; Wang, Z. Is China’s “energy transformation” reasonable?—An Empirical Study on the relationship between energy substitution and complementarity. China Soft Sci. 2019, 8, 14–30. [Google Scholar] [CrossRef]
- Zhao, X.; Luo, D. Forecasting fossil energy consumption structure toward low-carbon and sustainable economy in China: Evidence and policy responses. Energy Strateg. Rev. 2018, 22, 303–312. [Google Scholar] [CrossRef]
- Zhang, K. Natural gas supply-demand situation and prospect in China. Nat. Gas Ind. 2014, 1, 103–112. [Google Scholar]
- Bu, Y.; Wang, E.; Bai, J.; Shi, Q. Spatial pattern and driving factors for interprovincial natural gas consumption in China: Based on SNA and LMDI. J. Clean. Prod. 2020, 263, 121392. [Google Scholar] [CrossRef]
- Bertrand, R.; Philipp, G.; Frederic, M.; Felipe, F.; Axel, P.; Artem, M.; Yan, L.; Kang, W. The economic impact of price controls on China’s natural gas supply chain. Energy Econ. 2019, 80, 394–410. [Google Scholar]
- Zhang, W.; Yang, J.; Zhang, Z.; Shackman, J.D. Natural gas price effects in China based on the CGE model. J. Clean. Prod. 2017, 147, 497–505. [Google Scholar] [CrossRef]
- Hou, Y.; Xu, F.; Cheng, W. Sustainable economic development model based on renewable energy substitution. Syst. Eng. Theory Pract. 2008, 9, 67–72. [Google Scholar]
- Weng, Y.; Zhang, X. The role of energy efficiency improvement and energy substitution in achieving China’s carbon intensity target. Energy Procedia 2017, 142, 2786–2790. [Google Scholar] [CrossRef]
- Hausfather, Z. Bounding the climate viability of natural gas as a bridge fuel to displace coal. Energy Policy 2015, 86, 286–294. [Google Scholar] [CrossRef]
- Yan, X.; Zhang, J.; Zou, S. Prediction of elasticity of alternative energy in the new normal based on GA-SA method. China Manag. Sci. 2015, 23, 755–762. [Google Scholar]
- Ma, C.; Stern, D.I. Long-run estimates of interfuel and interfactor elasticities. Resour. Energy Econ. 2016, 46, 114–130. [Google Scholar] [CrossRef]
- Qiang, Q.; Jian, C. Natural resource endowment, institutional quality and China’s regional economic growth. Resour. Policy 2020, 66, 101644. [Google Scholar] [CrossRef]
- Julia, B.; Massimo, F.; Nilkanth, K. Boundedly rational consumers, energy and investment literacy, and the display of information on household appliances. Resour. Energy Econ. 2019, 56, 39–58. [Google Scholar]
- Zhang, T.J.; Luo, X.G.; Cai, L.Q.; Tang, J.F. Optimization model of mobile tariff package based on customer selection behavior. Syst. Eng. Theory Pract. 2014, 34, 444–450. [Google Scholar]
- Kwong, C.K.; Luo, X.G.; Tang, J.F. A Multiobjective Optimization Approach for Product Line Design. IEEE Trans. Eng. Manag. 2011, 58, 97–108. [Google Scholar] [CrossRef]
- Sun, J.; Li, G.; Wang, Z. Optimizing China’s Energy Consumption Structure under Energy and Carbon Constraints. Struct. Chang. Econ. Dyn. 2018, 47, 57–72. [Google Scholar] [CrossRef]
- Wang, S.; Li, C.; Zhou, H. Impact of China’s economic growth and energy consumption structure on atmospheric pollutants: Based on a panel threshold model. J. Clean. Prod. 2019, 236, 117694. [Google Scholar] [CrossRef]
- Xia, C.X.; Wang, Z.L. Drivers analysis and empirical mode decomposition based forecasting of energy consumption structure. J. Clean. Prod. 2020, 254, 120107. [Google Scholar] [CrossRef]
- Jiang, Z.; Lyu, P.; Ye, L.; Zhou, Y.W. Green Innovation Transformation, Economic Sustainability and Energy Consumption during China’s New Normal Stage. J. Clean. Prod. 2020, 273, 123044. [Google Scholar] [CrossRef]
- Yang, Z.; Shao, S.; Yang, L.; Miao, Z. Improvement pathway of energy consumption structure in China’s industrial sector: From the perspective of directed technical change. Energy Econ. 2018, 72, 166–176. [Google Scholar] [CrossRef]
- Chang, C. A multivariate causality test of carbon dioxide emissions, energy consumption and economic growth in China. Appl. Energy 2010, 87, 3533–3537. [Google Scholar] [CrossRef]
- Li, J.; Wang, L.; Lin, X.; Qu, S. Analysis of China’s Energy Security Evaluation System: Based on the Energy Security Data from 30 Provinces from 2010 to 2016. Energy 2020, 198, 117346. [Google Scholar] [CrossRef]
- Shaghayegh, K.B.; Farzad, M.S.; Seyed, J.S. Developing natural-gas-supply security to mitigate distribution disruptions: A case study of the National Iranian Gas Company. J. Clean. Prod. 2020, 254, 120066. [Google Scholar]
- Hal, T.; Leonardo, B. Long-term security of energy supply and climate change. Energy Policy 2006, 34, 2232–2250. [Google Scholar]
- Shoki, K.; Hironobu, U. Short-term vs long-term reliance: Development of a novel approach for diversity of fuels for electricity in energy security. Appl. Energy 2020, 262, 114520. [Google Scholar]
- He, R.; Li, S.; Cao, Q.; Zhou, J. Thoughts on the safety of China’s natural gas supply. Nat. Gas Ind. 2019, 39, 123–132. [Google Scholar]
- Moxnes, E. Interfuel substitution in OECD-European electricity production. Syst. Dyn. Rev. 1990, 6, 44–65. [Google Scholar] [CrossRef]
- Li, X.; Yao, X. Can energy supply-side and demand-side policies for energy saving and emission reduction be synergistic?—A simulated study on China’s coal capacity cut and carbon tax. Energy Policy 2020, 138, 111232. [Google Scholar] [CrossRef]
- Gilchrist, S.; Williams, J.C. Investment, capacity, and uncertainty: A putty–clay approach. Rev. Econ. Dyn. 2005, 8, 1–27. [Google Scholar] [CrossRef]
- Zhu, S.G.; Lu, C.J.; Wang, Y.K. Impact effect of energy price on China’s industrial capital stock. Stat. Educ. 2009, 6, 8–13. [Google Scholar]
- Atkeson, A.; Kehoe, P.J. Models of energy use: Putty-putty versus putty-clay. Am. Econ. Rev. 1999, 89, 1028–1043. [Google Scholar] [CrossRef]
- Lindh, T. Productivity slowdown due to scarcity of capital to scrap in a putty-clay model. Econ. Lett. 2000, 69, 225–233. [Google Scholar] [CrossRef]
- Ishise, H. Capital heterogeneity as a source of comparative advantage: Putty-clay technology in a ricardian model. J. Int. Econ. 2016, 99, 223–236. [Google Scholar] [CrossRef]
- Abada, I.; Briat, V.; Massol, O. Construction of a fuel demand function portraying interfuel substitution, a system dynamics approach. Energy 2013, 49, 240–251. [Google Scholar] [CrossRef]
- Gómez, C.R.; Arango-Aramburo, S.; Larsen, E.R. Construction of a Chilean energy matrix portraying energy source substitution: A system dynamics approach. J. Clean. Prod. 2017, 162, 903–913. [Google Scholar] [CrossRef]
- Zha, D.; Zhou, D. The elasticity of substitution and the way of nesting CES production function with emphasis on energy input. Appl. Energy 2014, 130, 793–798. [Google Scholar] [CrossRef]
- Pablo-Romero, M.D.P.; Sanchez-Braza, A.; Exposito, A. Industry level production functions and energy use in 12 EU countries. J. Clean. Prod. 2019, 212, 880–892. [Google Scholar] [CrossRef]
- Cui, Q.; Liu, Y.; Ali, T.; Gao, J.; Chen, H. Economic and climate impacts of reducing China’s renewable electricity curtailment: A comparison between CGE models with alternative nesting structures of electricity. Energy Econ. 2020, 91, 104892. [Google Scholar] [CrossRef]
- Xu, Q. Analysis of the relationship between fixed asset investment and energy supply and demand. China Energy 1991, 7, 37–40. [Google Scholar]
- Frondel, M. Modelling energy and non-energy substitution: A brief survey of elasticities. Energy Policy 2011, 39, 4601–4604. [Google Scholar] [CrossRef]
- Liu, L.; Yi, J. Estimation and prediction simulation of China’s energy demand. J. Shanghai Univ. Financ. Econ. 2008, 10, 84–91. [Google Scholar]
- Nations, U. World Population Prospects: The 2017 Revision, Volume I: Comprehensive Tables; Department of Economics and Social Affairs PD: New York, NY, USA, 2017; pp. 48–58. [Google Scholar]
- Guo, Z.; Zhang, X.; Zheng, Y. Study on the impact of energy price fluctuation on energy environment economy system. China Manag. Sci. 2018, 26, 22–30. [Google Scholar]
- De Boer, D.; Roldao, R.; Slater, H.; Qian, G. 2017 China Carbon Price Survey; China Carbon Forum: Beijing, China, 2017; pp. 19–20. [Google Scholar]


© 2020 by the authors. Licensee MDPI, Basel, Switzerland. This article is an open access article distributed under the terms and conditions of the Creative Commons Attribution (CC BY) license (http://creativecommons.org/licenses/by/4.0/).